A Cold Chain Study of Indonesia - Economic ...
←
→
Page content transcription
If your browser does not render page correctly, please read the page content below
Chapter          4
A Cold Chain Study of Indonesia

PT Capricorn Indonesia Consult

September 2019

This chapter should be cited as
PT Capricorn Indonesia Consult (2019), ‘A Cold Chain Study of Indonesia’, in Kusano, E. (ed.),
The Cold Chain for Agri-food Products in ASEAN. ERIA Research Project Report FY2018 no.11,
Jakarta: ERIA, pp.101-147.
Chapter 4
                        A Cold Chain Study of Indonesia
                               PT Capricorn Indonesia Consult

4.1. Introduction
Background
The cold chain system is a type of supply chain wherein the process aims to maintain
temperature so that the product is maintained during the distribution process. An important
factor in maintaining cold chain products is the correct treatment in each of the main
distribution points in the cold chain so that the right distribution channels will provide good
quality of cold chain products.
The application of cold chains requires the provision of several facilities, both in the storage
and distribution process. In the storage process, it is needed to have, among others, cold
storage and freezing machines, while in the distribution process, it is necessary to have
refrigerated transportation fleets (carriers, aircraft and vehicles).
Cold chain business is a major supporter of various industrial sectors such as the food
processing industry, fishing industry, retail network, pharmaceutical industry and so on.
Indonesia is considered to have a potential market for cold chain business. This is supported
by the user industrial sector, which shows fairly good development. The user industrial
sectors such as livestock, fisheries, processed food and chemical, pharmaceutical and drug
industries are still an important key for national development, and this can be seen from its
contribution to Indonesia’s gross domestic product (GDP) during 2018.
Based on the information from the Central Bureau of Statistics (BPS), in that period, GDP of
the livestock sector had a contribution of 1.5% or Rp231.7 trillion of the total Indonesian GDP
of Rp4,837.3 trillion, the fisheries sector contributed 2.6% of the total GDP, the food and
beverage industry accounted for 6.2% and the chemical, pharmaceutical and drug sector
amounted to 1.6% of Indonesia’s total GDP.

Scope of study
This study aims to discuss more clearly the prospects for cold chain business and the
obstacles faced by this industry. It also discusses the user industry such as the processed food
industry, fisheries industry, agricultural industry, trade industry and pharmaceutical industry.
In addition, this study features information on companies involved in the processed food
industry, fishing industry and pharmaceutical industry. Besides that, it also discusses
government policies that support the cold chain industry and the cold chain market share in
Indonesia.

                                              101
Methodology and source of information
This study was conducted in two ways, namely, desk research and field research. Field
research is performed by conducting interviews with business players or several stakeholders
in related industries in Indonesia that produce primary data. While desk research is obtained
based on the information in the form of studies or data from related institutions such as the
Ministry of Maritime Affairs and Fisheries (KKP), Fishery Products Processing and Marketing
(P2HP), Animal Husbandry and Animal Health, BPS, and Indonesian Cold Chain Associations
(ARPI), which produce secondary data.
In addition, to complete the information, this study also relies on several studies and analyses
originating from the data bank of PT Capricorn Indonesia Consult, Inc. (PT CIC).
4.2. General review on cold storage in Indonesia
National economic development
The prospect of Indonesia’s economy is expected to improve further next year with higher
growth and maintained stability. This growth is triggered by stronger domestic demand by
both consumption and investment, improved export performance and declining imports.
Bank Indonesia (BI) estimates that domestic economic growth will be in the range of 5.5%–
6.1% until 2024.
The improving economic condition in Indonesia will certainly lift the growth of various
industrial sectors, including the processed food industry, fishing industry, agricultural
industry and pharmaceutical industry.
Based on BPS information, the growth rate of the processed food sector during 2014–2018
averaged 5.8% per year. The contribution of the livestock sector averaged 1.5%, the fisheries
sector attained 2.5% per year and the processing pharmaceutical industry reached 1.7% per
year.
In 2018, the processed food industry was the largest in contribution, namely, 6.2% of the
total GDP nationally or reaching Rp927.4 trillion and increased compared with the previous
year (2017), which reached Rp834.4 trillion.
The fisheries sector contributed 2.6% or reached Rp385.9 trillion in 2018. Meanwhile, the
chemical industry and drug sector contributed Rp239.6 trillion, while the livestock industry
contributed 1.5% with a value of Rp231.7 trillion in 2018.
102Table 4.1: Gross Domestic Products Based on Current Prices, 2014–2018 (Billion Rupiah)
Year
BUSINESS FIELD
Annual
2014 2015 2016 2017 2018
BASED ON CURRENT Average
PRICES (%)
AGRICULTURAL SECTOR
a. Livestock 167,008 184,152 201,124 213,306 231,711 –
Contribution to GDP (%) 1.58 1.60 1.62 1.57 1.56 1.59
b. Fishery 245,488 288,917 317,190 348,854 385,936 –
Contribution to GDP (%) 2.32 2.51 2.56 2.57 2.60 2.51
PROCESSING SECTOR
a. Food and Beverage 562,017 647,072 740,810 834,425 927,444 –
Industry
Contribution to GDP (%) 5.32 5.61 5.97 6.14 6.25 5.86
b. Chemical, Pharmaceutical 180,037 209,788 223,405 236,193 239,678 –
and Drug
Contribution to GDP (%) 1.70 1.82 1.80 1.74 1.62 1.74
GROSS DOMESTIC 10,569, 11,526, 12,401, 13,587, 14,837, –
PRODUCTS (GDP) 705 333 729 213 358
Source: Central Bureau of Statistics (2019).
Contribution of national economic development to cold storage in cold chain business
The development of the livestock, fisheries, processed food, chemical and pharmaceutical
and drug industry has a major influence on the development of the cold chain industry in
Indonesia. The development of these industrial sectors will automatically affect the increase
in cold chain demand.
Several policies are issued by the government to support the development of the cold chain
industry by the user industry, such as the fisheries sector. The potential of Indonesian marine
products is known to be very abundant. However, the abundant potential of fish catches is
often constrained by the limited supporting means, of them is cold storage. The presence of
cold storage at each distribution point is needed to extend the freshness of the fish for the
buyer.
The fisheries sector is one of the government’s special concerns to be optimised; thus, it has
added value and contributes to state revenues.
In the livestock sector, the role of the cold chain is also very much needed. Animal products
are one of the food sources that are rich in protein and needed to build healthy and smart
communities. Food products from animals are also one of the products that are categorised
as perishable food and potentially hazardous.
Apart from having to think about its availability, it must also be handled properly to be able
to be beneficial and guaranteed to be healthy and safe for consumption. The government
continues to try to support the implementation of the cold chain to maintain the supply of
103meat to remain stable nationally and to meet not only domestic needs but also export market
needs.
Likewise, in the pharmaceutical sector and the processed food industry, where cold chains
are indeed needed to maintain good product quality. This condition makes it clear that cold
chain industries also have significant contributions in national economic development.
Obstacles and challenges of cold storage in cold chain business in Indonesia
The development of cold chain business is not as expected as this business has many
challenges and obstacles to face. Among them are obstacles in investment because of
infrastructure problems the lack of fiscal facilities offered by the government.
As is known, 100% raw material of the cold chain industry is still imported, and the
government has not yet agreed to provide duty exemption facility on the component as well
as the provision of tax holiday facilities to build cold storage assembly plants in the country.
Another challenge is the lack of availability of electric power in remote areas. This condition
results in the use of cold chains by the user industry not being optimal. According to
information from ARPI, the installed capacity of the industry is only half of the national
demand.
Seeing the economic development of Indonesia, which is increasingly being supported by
abundant natural resources, these obstacles and challenges can create opportunities, as well
as challenges, for the cold chain industry in the country.
Prospects for cold storage markets in Indonesia
The need for cold storage in cold chain business in Indonesia is still quite high. This is
indicated by almost all cold storage warehouses that are always fully occupied for storing
meat products, fish, vegetable fruits and so on.
In addition, Indonesia’s cold chain market has fairly good prospects, marked by the increasing
Indonesian economic growth, followed by the development of the user industry.
Another indicator is the large population with a consumption pattern that tends to require
efficiency and speed and who likes fresh products such as fresh fruits and vegetables and
processed meat, milk and other products.
Besides that, the development of network retail sector and restaurant chain stores has also
encouraged the development of cold storage business in Indonesia. Most retail networks
have many outlets spread across several locations. This requires handling the availability of
goods professionally and on time, similarly, the export and import business of fishery
products, meat, fruit and vegetables and the ice cream industry.
1044.3. Development of cold chain products in Indonesia
Cold storage production in cold chain business in Indonesia
To maintain cold storage facilities require a substantial investment. It is not surprising that
many companies do not have their own cold storage facilities for their needs. For this reason,
many of them rent or cooperate with cold storage owners.
It is very difficult to know the amount of cold storage production in Indonesia and can only
be known from the production capacity of cold storage.
Several players involved in this business consist of various business sectors, namely, cold
storage companies, food processing industries, meat importers including slaughterhouses,
fishing industries, ice cream industries, fruit importers, retail networks and pharmaceutical
industries.
Based on a survey conducted by CIC, until the end of 2018, there were around 69 major cold
storage companies throughout Indonesia with a total capacity of 370,000 tons per year. Of
this amount, the largest capacity is owned by PT Enseval Medika Prima Tbk., which has a cold
storage production capacity of 59,000 tons. It is followed by PT Unilever Indonesia (Wall’s ice
cream) with a production capacity of 50,000 tons.
PT Sukanda Djaya ranked third with a total cold storage capacity of 45,000 tons and followed
by other companies such as PT Kiat Ananda Cold Storage, PT Mega Internasional, PT
Indomaguro Tunas Unggul and others as shown in the following table:
Table 4.2: Cold Storage Company and Capacity in Indonesia, 2018
Capacity Share
No. Name of Company
(Ton) (%)
1 Enseval Putra Megatrading Tbk, PT 59,000 15.9
2 Unilever Indonesia, PT (Wall’s ice cream) 50,000 13.5
3 Sukanda Djaya, PT 45,000 12.2
4 Kiat Ananda Cold Storage, PT 30,000 8.1
5 Mega Internasional Sejahtera, PT 21,000 5.7
6 Indomaguro Tunas Unggul, PT 15,000 4.1
7 Dharma Samudera Fishing Industries, PT 14,000 3.8
8 Savina Cold Storage 9,000 2.4
9 Wahana Cold Storage, PT 7,000 1.9
10 Lion Super Indo, PT/Super Indo 6,600 1.8
11 Bonicom Servistama Compindo, PT 6,000 1.6
12 Central Windu Sejati, PT 6,000 1.6
13 Adib Food Supplies, PT 6,000 1.6
14 Mgm Bosco Logistics, PT 5,500 1.5
15 Perum Perikanan Indonesia 5,100 1.4
16 Bumi MenaraInternusa, PT 5,000 1.4
17 Surya Alam Tunggal, PT 5,000 1.4
105Capacity Share
No. Name of Company
(Ton) (%)
18 Jalur Sejuk, PT 5,000 1.4
19 Hero Supermarket Tbk, PT/Giant 4,400 1.2
20 Trans Retail Indonesia, PT/Carrefour 4,100 1.1
21 Wirontono Cold Storage & Industry, PT 4,000 1.1
22 Supra Boga Lestari/Ranch Market, PT 3,000 0.8
23 Istana CiptaSembada (Ics), PT 3,000 0.8
24 ExpravertNasuba, PT 3,000 0.8
25 Mega Marine Pride, PT 2,000 0.5
26 Scrum Indonesia, PT 2,000 0.5
27 Wira Logitama Saksama 2,000 0.5
28 Fast Food Indonesia, PT Tbk (KFC) 1,800 0.5
29 Perikanan Nusantara, PT 1,550 0.4
30 AGB Tuna, PT 1,500 0.4
31 Alpine Cool Utama 1,500 0.4
32 Central Coldstorage PratamaSakti, PT 1,500 0.4
33 Raficon Sarijaya, PT 1,500 0.4
34 Bintang Citra International, PT 1,500 0.4
35 Guna Pratama, PT 1,500 0.4
36 Lotte Shopping Indonesia, PT/Lotte 1,300 0.4
37 Trade Corp Indonesia, PT 1,200 0.3
38 Starcon Indonesia, PT 1,200 0.3
39 Multi Guna International Persada, PT 1,100 0.3
40 Diamond Cold Storage, PT 1,000 0.3
41 Kini Cold Storage, PT 1,000 0.3
42 Central Food Lestari, PT 1,000 0.3
43 United Refrigeration, PT 1,000 0.3
44 Ercoolcoldstorage, PT 1,000 0.3
45 Rekso Nasional Food, PT/McDonald’s 1,000 0.3
46 Cold Storage Jaya Makmur, PT 1,000 0.3
47 Aneka Boga Nusantara, PT 1,000 0.3
48 IluvaIntiluhur Fuji Abadi, PT 1,000 0.3
49 Cooltech Surabaya, PT 1,000 0.3
50 Widjaya Dwi Kalmindo, PT 1,000 0.3
51 Aneka Cool Citratama, PT 1,000 0.3
52 Indopanel Sukses Makmur, PT 1,000 0.3
53 Sarana Refrigeratama, PT 1,000 0.3
54 Celcius Jaya, PT 1,000 0.3
55 Sarana Dunia Pendingin, PT 1,000 0.3
56 Wahana Boga Nusantara, PT 1,000 0.3
57 Indoguna Utama, PT 1,000 0.3
58 Belfoods Indonesia, PT 1,000 0.3
59 Armada Container Indonesia, PT 1,000 0.3
60 Inter Mitra Transindo, PT 1,000 0.3
61 Tri Putra Perkasa, PT 1,000 0.3
106Capacity Share
No. Name of Company
(Ton) (%)
62 Pluit Cold Storage, PT 500 0.1
63 Tiara Dewata Group 500 0.1
64 San Miguel Pure Foods Indonesia, PT 500 0.1
65 Japfa Santori Indonesia, PT 500 0.1
66 Hwasung Thermo Indonesia, PT 500 0.1
67 Bali Mina Utama, PT 400 0.1
68 Darta Logistic, PT 250 0.1
69 Abbatoir Surya Jaya, PT 200 0.1
TOTAL CAPACITY 370,200 100.0
Source: Survey by author.
Development of cold chain demand in cold chain business in Indonesia
In the next five years, the demand for cold storage is expected to continue to increase, which
will automatically increase the current installed capacity. Based on the trends experienced
by major cold storage being surveyed, on average in the next few years, the need for cold
storage will increase between 10% and 20% per year.
With this estimate, it is projected that in 2019, the demand for cold storage capacity will
reach 462,700 tons, or an additional capacity of 92,500 tons is needed from the current
production capacity of 370,200 tons. Until 2024, the capacity will reach 824,700 tons, or an
additional capacity of 59,600 tons is needed as shown in the following table:
Table 4.3: Projection of Potential Demand for Cold Storage in Indonesia, 2019–2024
Projection of Production Additional Production Capacity
Year
Capacity (tons) (thousand tons)
2019 462,750 92,550
2020 548,359 85,609
2021 631,161 82,802
2022 692,384 61,223
2023 765,084 72,700
2024 824,760 59,677
Notes: Estimated based on the trends experienced by major cold storages being surveyed.
Additional Production Capacity denotes gap between the projected capacity and the previous
year’s capacity.
Source: Authors.
4.4. Demand for frozen food in Indonesia
Transitions of Indonesia frozen food consumption
Indonesia is considered to have good prospects in the food and beverage industry, which is
mainly driven by the frozen food industry, especially those from marine products.
107The demand for frozen food in recent years is estimated to have been increasing, along with
changes in the pattern of consumption of people, which tend to be fast, practical and
economical but meet nutritional and health needs. With a population of around 260 million,
it is a considerable market potential for the frozen food industry in Indonesia, especially
supported by the increasing public purchasing power.
According to CIC’s observations, in the last five years, the consumption of frozen food has
increased by an average of 6.9% per year. While in 2014, the consumption of frozen food
only reached 5.0 million tons, and in 2015, it increased to 5.5 million tons, up 8.6%. This
condition also occurred in 2016, where frozen food consumption again increased to 5.9
million tons, up 7.4%. Until the end of 2018, frozen food consumption has reached 6.6 million
tons. More information on the development of frozen food consumption during the 2014–
2018 period is presented in the following table:
Table 4.4: Development of Frozen Food Consumption in Indonesia, 2014–2018 (Ton)
Year Production Import Export Consumption Growth (%)
2014 5,629,902 280,360 828,130 5,082,132 –
2015 5,920,708 229,551 631,013 5,519,246 8.6
2016 6,211,514 314,470 600,794 5,925,191 7.4
2017 6,502,321 389,626 621,604 6,270,342 5.8
2018 6,793,127 406,179 568,774 6,630,531 5.7
Annual Average (%) 6.9
18
Notes: See footnote for frozen foods referred in this discussion. Domestic consumption was
estimated from production + import – export.
Source: Central Bureau of Statistics (2019).
Export of frozen food in Indonesia
Although the frozen food industry has developed in Indonesia, its marketing to the export
market has not been optimal, which has good prospects. Admittedly, there are some
obstacles to export frozen food overseas that must be faced and certainly difficult. For
18
Frozen foods in this discussion consist of HS 02023000, 02032200, 02032900, 02044100, 02069000,
02043000, 02071200, 03031900, 03032300, 03032400, 03032600,03032900, 03033100, 03033300,
03033900, 03034100, 03034200, 03034300, 03034400, 03034600, 03034900, 03035300, 03035410,
03035420, 03035500 up to 03035700, 03035910, 03035920, 03035990, 03036800, 03036900,
03038100, 03038200, 03038400, 03038911, 03038913, 03038914, 03038916 up to 03038919,
03038926 up to 03038929, 03039100, 03039200, 03046100, 03046200, 03046900, 03047900,
03048100 up to 03048400, 03048700 up to 03048900, 03049100, 03049300, 03049600, 03049700,
03049900, 03061110, 03061190, 03061210, 03061290, 03061410, 03061490, 03061500, 03061600,
03061711, 03061719, 03061721, 03061722, 03061729, 03061730, 03061790, 03061900, 03071200,
03072200, 03073200, 03074310, 03074390, 03075200, 03077200, 03078400, 03079200, 03081200,
03083030, 04014020, 04014090, 07101000, 07102100, 07102200, 07102900, 07103000, 07104000,
07108000, 07109000, 07141091, 07142010, 07143010, 07144010, 07149011, 08112000, 08119000,
12122930, 20041000, 20049010, 20049090.
108example, the tariff of import duty applied by various export destination countries is quite
high.
Information obtained by CIC from the Indonesian Food and Beverage Association (GAPMI)
stated that the export of food and beverages is targeted at 10% annually, but the import duty
factor is an obstacle for food products to compete in the global market.
As an example, African countries provide better import tariffs to some countries such as
China because of the cooperation of CEPT (Common Effective Preferential Tariffs). As a result
of such constraint, it is not impossible, if seen from its development, for frozen food exports
to decline every year.
Some frozen food products that are quite a mainstay of exports are cuttlefish and frozen
squid, skipjack, frozen shrimp and other types of frozen fish.
Based on the information from the Central Bureau of Statistics (BPS) during the 2014–2018
period, frozen food exports declined every year with an average of 8.4 % per year. While in
2014, frozen food exports only reached a volume of 828,100 tons worth US$2.8 billion, in
2015, the volume dropped to 631,000 tons or decreased by -23.8% worth US$2.2 billion.
In 2017, frozen food exports increased again with a volume of 621,600 tons (3.5%) worth
US$2.7 billion compared with the previous year’s export volume of 2016, which reached
600,700 tons worth US$2.5 billion. And until the end of 2018, exports fell to 568,700 tons
worth US$2.4 billion as shown in the following table:
Table 4.5: Development of Indonesia Frozen Food Export, 2014–2018
Volume Growth Value Growth
Year
(Ton) (%) (US$‘000) (%)
2014 828,130 – 2,845,684 –
2015 631,013 - 23.8 2,263,607 - 20.5
2016 600,794 - 4.8 2,525,598 11.6
2017 621,604 3.5 2,715,074 7.5
2018 568,774 - 8.5 2,419,199 -10.9
Annual Average (%) -8.4 -3.1
Source: Central Bureau of Statistics (2019).
Frozen food exports from Indonesia are aimed at various countries such as the United States,
China, Japan, Vietnam, Thailand, Taiwan and Malaysia. Frozen food exports to the United
States are the largest among other export destination countries.
In 2017, exports to the United States reached a volume of 129,200 tons with a value reaching
US$1.2 billion or controlling 20.8% of the total export volume that year, which amounted to
621,600 tons. The second position is occupied by China (18.4%) with a volume of 114,400
tons worth US$232.7 million, followed by Japan (14.7%) with a volume of 91,300 tons worth
US$452.0 million, and Vietnam with a volume of 71,200 tons (11.4%) worth US$160.8 million.
109Table 4.6: Export of Frozen Food by Destination Country, 2017
Volume Value Share
Country
(Ton) (US$ ‘000) (%)
United States 129,252 1,224,390 20.8
China 114,481 232,705 18.4
Japan 91,336 452,081 14.7
Vietnam 71,200 160,869 11.5
Thailand 67,606 131,502 10.9
Taiwan 33,591 81,479 5.4
Malaysia 18,496 43,678 3.0
Korea, Republic of 12,901 31,668 2.1
Italy 11,509 56,440 1.9
Philippines 11,211 18,292 1.8
Singapore 9,775 33,371 1.6
Other Countries 50,245 248,599 8.1
TOTAL 621,604 2,715,074 100.0
Source: Central Bureau of Statistics (2019).
Import of frozen food by Indonesia
Even though Indonesia has been able to produce frozen food, the dependence on imported
products is still ongoing, even though the volume is not large. Frozen foods that enter
Indonesia include frozen beef, mackerel fish, frozen potatoes, sardines, frozen beef innards
and so on.
Imports of frozen food in the last five years increased by an average of 11.8% per year. In
2016, imports increased to 37.0% with a volume of 314,400 tons worth US$801.6 million.
Whereas in 2017, imports increased with a volume of 389,600 tons with a value reaching
US$855.4 million, up 23.9%. In 2018, imports increased again with a volume of 406,100 tons
valued US$991.5 million. Details can be seen in the following table:
Table 4.7: Development of Frozen Food Import by Indonesia, 2014–2018
Volume Growth Value Growth
Year
(Ton) (%) (US$‘000) (%)
2014 280,360 – 669,351 –
2015 229,551 -18.1 482,010 -28.0
2016 314,470 37.0 801,698 66.3
2017 389,626 23.9 855,472 6.7
2018 406,179 4.2 991,566 15.9
Annual Average (%) 11.8 – 15.2
Source: Central Bureau of Statistics (2019).
Three major countries are recorded as the major suppliers of frozen food products to
Indonesia, namely, China, Australia and India. As an illustration, in 2017, frozen food products
originating from China reached a volume of 102,300 tons valued at US$88.6 million or
110controlled 26.3% of the total volume of frozen food imports that year, which reached 389,600
tons.
Frozen food products from Australia were ranked second after China, reaching a volume of
84,500 tons with a value of US$275.0 million or controlling 21.7%, while frozen food products
from India controlled 12.3% with a volume reaching 48,000 tons valued at US$169.5 million.
Then it is followed by other countries such as the United States, Oman, the Netherlands and
so on as shown in the following table:
Table 4.8: Import of Frozen Food by Origin Country, 2017
Volume Value Share
Country
(Ton) (US$ ‘000) (%)
China 102,347 88,674 26.3
Australia 84,555 275,025 21.7
India 48,014 169,508 12.3
United States 37,104 97,370 9.5
Oman 17,298 10,636 4.4
Netherlands 15,792 15,544 4.1
Pakistan 14,854 10,954 3.8
New Zealand 14,700 48,931 3.8
Japan 9,753 12,099 2.5
Belgium 8,296 7,970 2.1
Canada 7,591 39,238 1.9
Norway 5,785 15,822 1.5
Malaysia 4,157 5,317 1.1
Other Countries 19,378 58,384 5.0
Total 389,626 855,472 100.0
Source: Central Bureau of Statistics (2019).
4.5. Demand for cold storage in Indonesia
Cold storage is needed to maintain the temperature so that the product is maintained and
not damaged during the distribution process. To get the right cold chain system, there are
several steps that need to be observed, especially for frozen products, namely, handling
during the initial process, storage and processing upon arrival, handling during transportation
to the destination country and handling on loading and distribution systems to consumers.
Cold storage in Indonesia is applied to several industries, namely, the food, agricultural,
fishery and pharmaceutical industries, such as medicines. Of the several industries, certainly,
the handling is different. CIC reviewed cold storage needs on each user industry.
111Development of Demand for Cold Storage Cargo for Foodstuff in Indonesia
Cold storage for foodstuffs consists of freezing, storing in cold storage, transporting in
refrigerated trucks, displaying in cold cabinets at food stores and, ultimately, storing in
freezers at home.
Food products (snacks, dish foods and canned food products) that have gone through the
stages of processing plants with good packaging usually have a long useful life and can be
stored at normal temperatures.
The food processing industry manages the product supply cycle to all consumers in various
places with special treatment for each product category and marketing channel and uses
different distribution systems for small outlets and large outlets.
For food products that require cold storage such as milk and seafood before being marketed
usually enter the cooling room and are distributed using a refrigerated truck before entering
the store. The following shows the distribution system of food products based on handling
characteristics:
Figure 4.1: Distribution System of Food Products Based on Handling Characteristics
Source: Cited from Tobing (2015).
Each food product has its own specifications in storage depending on the size and amount of
food and the size of the storage. The storing temperature of each food product is different,
such as for meat, fish, shrimp and its processed food with a temperature of -5°C to 0°C can
112store up to three days, with a temperature of -19°C to -5°C can store up to one week and
storage with a temperature below -10°C can store more than one week.
Eggs, milk and processed foods with a temperature of -5°C to 7°C can store up to three days,
while temperature below -5°C can store food for up to one week.
Development of cargo equipment for cold storage for agricultural products
The agricultural sector is also the user of cold storage to store various kinds of agricultural
products ranging from vegetables, meat, fish, chicken, fruits and so forth. However, there
are still some limitations in terms of developing cargo equipment for agricultural products.
Limited cooling facilities range from reefer containers, regular packing process up to the use
of refrigerated trucking. The potential of food products in Indonesia seems not to be
maximally supported by good cold logistics, even though the distribution process and cold
storage are very much needed in Indonesia.
The storage of agricultural products has different characteristics such as for vegetables that
require a temperature of 6°C to 8°C with 80% to90% humidity. Fruits require a temperature
of 4°C to 6°C with 80% to 90% humidity.
According to the type, cold storage is divided into four groups, namely chilled rooms, freezer
rooms, blast freezers, and blast chillers. Chilled rooms and freezer rooms are used to store
products according to received temperature conditioning, while blasts freezer and blast
chillers are used to condition a product at a certain temperature.
A chilled room is a low-temperature cooling room between 1°C and 7°C. This room is used to
store fresh food products such as vegetables and fruits and other products with a durability
of up to two months. While for fresh meat, it is stored in a freezer room with a temperature
of -2°C to 0°C with 80% to 90% humidity as shown in the following table:
Table 4.9: Products That Require Cold Storage, Abbreviated
Temperature Humidity
Product
(°C) (%)
Chocolate 15–18 50–60
Flower 8–16 70–75
Vegetables 6–8 80–90
Fruits 4–6 80–90
Mushrooms 0 90–95
Fresh meat -2–0 80–90
Frozen fruits and vegetables -10–0 –
Frozen meat -20 –
Frozen tuna -40–-60 –
Source: Survey by author.
113Based on the information from ARPI, Indonesia currently lacks a cold chain for agricultural
commodities. Indonesia needs facilities and cold chains to support national cargo so that the
transportation of agricultural products can be optimised.
According to ARPI, currently, the capacity of refrigerated trucks is only around 3,000 units
with a capacity of 15,000 tons per day or only 10% of the needs, which reach an average of
150,000 tons per day.
This condition is certainly very unfortunate considering the agricultural sector, especially
livestock, is a potential market for cold chain sector. As an illustration, meat production,
especially chicken, on average, increased to 7.3% annually; pork increased to 2.1% per year
and lamb and goat meat averaged to 1.7% per year.
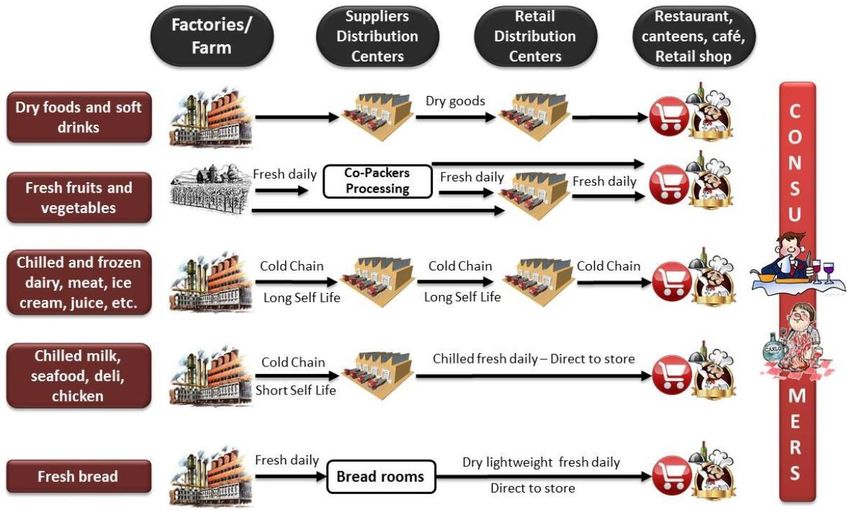
The production of beef and buffalo fell -0.1%. Chicken production in 2018 reached 2.6 million
tons, beef and buffalo production reached 527,000 tons, lamb and goat meat production
reached 115,000 tons and pork production reached 327,000 tons.
Figure 4.2: Development of Meat Production, 2014–2018
3,000,000
2,500,000
2,000,000
(Ton)
1,500,000
1,000,000
500,000
0
2014 2015 2016 2017 2018
Cow & Buffalo 532,900 542,100 550,400 515,700 527,900
Sheep & Goat 108,700 109,400 113,700 125,500 115,600
Chicken 1,978,600 2,071,500 2,349,700 2,505,700 2,620,000
Pig 302,300 330,200 339,600 317,400 327,200
Source: Director General of Animal Husbandry, Ministry of Agriculture (2019).
Chicken production increased over a period of five years (2014–2018) during which period,
the production increased by an average of 8.4% per year. While in 2014, the production of
chicken meat reached 1.6 million tons with a population reaching 1.5 billion, in 2015, it
increased to 1.7 million tons with a population of layers and broilers of 1.6 billion tails.
In 2018, the production of chicken meat has reached 2.6 million tons, up 4.6%, compared
with the production in 2017, which was only 2.1 million tons, similar with the population as
seen in the table of population and production development of layers and broilers below:
114Table 4.10: Development of Population and Production of Broilers and Layers, 2014–2018
Layer Broiler Total
Populati Produc Populati Producti Populati Growt Producti Growt
Year on tion on on on h on h
(‘000 (‘000 (‘000
pcs) (tons) pcs) (tons) pcs) (%) (tons) (%)
1,443,34 1,544,40 1,590,00 1,641,60
2014 146,660 97,200 9 0 9 – 0 –
102,80 1,528,32 1,628,30 1,683,33 1,731,10
2015 155,007 0 9 0 6 5.9 0 5.5
110,30 1,632,80 1,905,50 1,794,16 2,015,80
2016 161,364 0 1 0 5 6.6 0 16.4
114,90 1,848,73 2,046,80 2,025,66 2,161,70
2017 176,937 0 1 0 8 12.9 0 7.2
116,30 1,891,43 2,144,00 2,073,18 2,260,30
2018 181,752 0 5 0 7 2.3 0 4.6
Average Growth (%) 6.9 – 8.4
Source: Director General of Animal Husbandry, Ministry of Agriculture (2019).
Development of cargo equipment for cold storage for fishery products
Based on the potential value of the logistic market, the potential for cold chain utilisation in
Indonesia is very large, especially for perishable commodities (agriculture, livestock and
fisheries), while products are very vulnerable to damage. According to the analysis of Supply
Chain Indonesia (SCI), an independent institution engaged in education, training,
consultation, research and development in the field of logistics and supply chain in Indonesia,
the potential value of fishery logistics market reaches Rp43.1 trillion.
Cold storage for fishery products is needed to optimise the temperature and quality of
freshness of the fish. The optimisation is done by tracking the real-time temperature of the
frozen fish. The real-time temperature of fish is used as input information on the energy
needed for temperature and environmental conditioning that fish need to maintain quality
and freshness.
The frozen fish industry uses fish processing with a system of storing in low temperatures
(cold storage). Basically, freezing is the same as cooling, which is intended to preserve the
natural properties of frozen products. Freezing results almost all water content in the
product being frozen into ice. Frozen conditions cause microbiological activity and enzymes
to be inhibited so that the product’s shelf life is longer compared with products that are only
refrigerated.
Based on a technical paper released by Johnston et al. (1994), fish begins to spoil immediately
after death. This is reflected in gradual developments of undesirable flavours, softening of
the flesh and eventually substantial losses of fluid containing protein and fat. By lowering the
temperature of the dead fish, spoilage can be retarded and, if the temperature is kept low
enough, spoilage can be almost stopped.
115Rigor mortis, over a period of hours or days soon after death, can have a bearing on handling
and processing. In some species the reaction can be strong, especially if the fish has not been
chilled. The muscles under strain tend to contract, therefore, some of the tissue may break,
especially if the fish is roughly handled, leaving the flesh broken and falling apart. If the
muscles are cut before or during rigor, they will contract and in this way fillets from fish can
shrink and acquire a somewhat rubbery texture. In many species, however, rigor mortis is
not strong enough to be of much significance.
The freezing process alone is not a method of preservation. It is merely the means of
preparing the fish for storage at a suitably low temperature. In order to produce a good
product, freezing must be accomplished quickly. A freezer requires to be specially designed
for this purpose and thus freezing is a separate process from low temperature storage. Fish
that are being frozen slowly cannot be used as ingredients for certain processing such as
canning, fumigation and so on. Based on the above considerations, besides to shorten the
time and produce high output, fish must be frozen quickly.
Frozen fish need to be stored in suitable conditions to maintain its quality. Usually, frozen
fish are stored in cold storage. This storage is the main stage of preservation and freezing
method. The temperature normally recommended for cold storage is generally -30°C to -
60°C, depending on needs.
To get an appropriate cold chain system, there are four critical stages that must be observed,
namely, handling on the initial process, storing and processing when arriving on land,
handling when transporting to the destination place and handling on loading and distribution
systems to consumers.
In developing fish handling devices with cold chains, there are various system elements that
must be met. First, the sensor is used to measure the temperature of the product and the
environment. This temperature measurement is the key to preventing damage to fish. In
further development, sensors are also used to measure humidity, moisture content and
freshness of fish products. Second, the transmitter system is used to transmit/send data
information to communications networks. Transmitter usually has become one package in
the sensor and battery. Last, communication networks are used to build connections among
supply chains.
The technology that is developing in the digital era and is compatible with cold chain
communication networks, among others, is the Internet of Things (IoT). Development
Internet networks now allow users to perform monitoring and handling of aquaculture
wherever and whenever. IoT is also a device that can be used long term because future
Internet networks will be increasingly widespread and evenly distributed.
As with the agricultural sector, the cold chain needs for the fisheries sector are also still
minimal. Even though cold chain system is one of the most important components in the
supply chain of fishery products in Indonesia so that it is not quickly damaged, special
handling is needed to keep the fish fresh and have high quality.
116To overcome this problem, the government, in this case, the Ministry of Maritime Affairs and
Fisheries (KKP), allocated funds of Rp1.32 trillion for the fulfilment of the cold chain in 2017.
The total funds will be used to help 270 units of ice flake machines or ice-making machines
with a capacity of Rp168 billion, 55 units of four-wheeled refrigerated vehicles at Rp21.6
billion, 75 units of six-wheeled refrigerated vehicles at Rp36.9 billion, three fish processing
units with integrated cold storage 1,000 tons capacity of Rp168.6 billion and seven fish
processing units with integrated cold storage of 500 tons capacity of Rp120.4 billion.
In addition, KKP will also build 2 modern fish market units at a cost of Rp190.7 billion, 10
clean fish market units with Rp30.4 billion costs, 6 traditional fish market revitalisation units
of Rp8.5 billion, 10 culinary centre units of Rp13.05 billion, 15 cold storage units with a
capacity of 200 tons at Rp121.4 billion, 100 freezer units of 300 litres at a cost of Rp1 billion
and financing of 2 locations of Integrated Marine and Fisheries Centres in Biak and Mimika
of Rp78.95 billion.
Furthermore, KKP conducted a groundbreaking for the construction of 1,000 tons of cold
storage in Muara Baru, North Jakarta, in 2018. The cold storage built has two floors. The first
floor consists of the receiving room, anteroom and loading room, packing room, dry storage,
ABF, panel room and engine room and freezer room with a capacity of 300 tons. The second
floor consists of an anteroom and freezer room with a capacity of 700 tons.
The fisheries sector is now one of the special concerns of the Indonesian government to
optimise the return of its wealth so that it has added value and contributes to state revenues
and especially people’s welfare. Judging from its development in general, the fishing industry
in Indonesia is quite promising.
This can be seen from the development of its production, which, on average, increased to
5.4% per year. While in 2014, the fisheries production only reached 19.2 million tons, in 2015,
it increased to 20.4 million tons, up 6.4%. The same conditions also occurred in 2017 and
2018, where the production increased by 23.8 million tons and 25.0 million tons, respectively.
Table 4.11: Production of Fishery Products of Indonesia Based on Its Source, 2014–2018
Volume (tons) Annual
Type Average
2014 2015 2016 2017 2018* (%)
6,436,00 6,678,00 6,580,00 6,600,00 6,930,00
Capture Fisheries 0 0 0 0 0 –
Growth, % – 3.76 -1.47 0.30 5.00 1.52
6,038,00 6,205,00 6,115,00 6,133,58 6,440,26 –
Marine Fisheries 0 0 0 7 6
Inland Fisheries 398,000 473,000 465,000 466,413 489,734 –
12,795,0 13,792,0 15,456,0 17,220,0 18,081,0
Aquaculture 00 00 00 00 00 –
Growth, % – 7.79 12.06 11.41 5.00 7.25
117Volume (tons) Annual
Type Average
2014 2015 2016 2017 2018* (%)
8,379,00 9,035,00 9,773,00 10,888,3 11,432,8 –
Marine Culture 0 0 0 97 17
Pond, Brackish 2,345,00 2,428,00 3,012,00 3,355,76 3,523,54 –
Water 0 0 0 1 9
Pond, Fresh 1,774,00 1,964,00 2,289,00 2,550,24 2,677,75 –
Water 0 0 0 5 7
Cage Cultivation 200,000 221,000 204,000 227,283 238,647 –
Paddy Field 97,000 144,000 178,000 198,315 208,231 –
19,231,0 20,470,0 22,036,0 23,820,0 25,011,0 –
TOTAL 00 00 00 00 00
Growth, % – 6.44 7.65 8.10 5.00 5.44
* Preliminary value
Source: Ministry of Maritime Affairs and Fisheries (2018).
Meanwhile, if viewed from the company side the frozen industry of fishery products has
developed quite a long time. Based on CIC’s records, there are currently around 59
companies involved in this business and spread throughout Indonesia with a total capacity
of 816,800 tons.
Based on the region, East Java province is the largest with 21 companies engaged in the
frozen fish sector. It is followed by Central Java and Jakarta as many as six companies, South
Sulawesi and Bali as many as four companies and other regions such as Bali, Lampung, South
Kalimantan, West Java and West Sumatra to the Papua region.
Of the 59 companies, PT Bone Commercial Company (Bonecom) is the oldest. PT Bonecom is
located in Makassar, South Sulawesi, and founded in 1960. PT Bonecom has a frozen goods
production capacity of 12,300 tons per year consisting of frozen shrimp of 4,000 tons, frozen
tuna/skipjack of 5,000 tons, frozen bony fillets of 2,500 tons and frozen sunfish fillets of 800
tons. In addition, PT Bonecom also has a cold storage capacity of 14,700 tons per year.
In addition to Bonecom, another company that is long in the frozen fish business is PT
Diamond Cold Storage, located in Ancol, North Jakarta. The company was founded in 1970.
In addition to being known as a company that deals with ice cream and soft drink industry, it
is also involved in the frozen fish business with a capacity of 2,000 tons per year. Besides in
Jakarta, this company has branches in Cimahi, West Java, Yogyakarta and Surabaya.
When viewed from its production capacity, the company that has the largest frozen fish
capacity is PT Central Proteina PrimaTbk with a production capacity of 400,000 tons per year.
The company that has existed in the field of animal feed business, in 2007, also expanded
into the frozen shrimp industry in the Tulang Bawang region, Lampung, with a capacity of 1.6
million tons per year. See the following table for more information:
118Table 4.12: Frozen Fish and Shrimp Company in Indonesia, 2018
Production
Year
No Name of Company Location Capacity
Established
(tons)
1 Bali Mina Utama, PT 1987 Bali 4,670
Canning Indonesian
2 Products, PT 1948 Bali 2
Industri PerikananTerpadu
3 Chiu Shih, PT 1996 Bali 160
4 Sari Segar Laut Indonesia, PT 2002 Bali 3,000
5 Aorta, PT 1979 Central Java 1,000
6 Aquafarm Nusantara, PT 1998 Central Java 1,200
7 Karya Mina Putra, CV 1996 Central Java 6,500
8 Maya Food Industries, PT 1995 Central Java 5,000
9 Seafer General Food, PT 1991 Central Java 10,000
10 Toxindo Prima, PT 1997 Central Java 540
11 Aneka Boga Nusantara, PT 1998 East Java 1,000
12 Aneka Tuna Indonesia, PT 1991 East Java 650
13 Bumi Menara Internusa, PT 1985 East Java 5,000
14 Bumi Pangan Utama, PT 1996 East Java 7,000
Central Proteina PrimaTbk,
15 PT 1996 East Java 400,000
Charoen Pokphand Indonesia
16 Tbk, PT 1996 East Java 36,000
17 Ciomas Adisatwa, PT 1987 East Java 6,000
18 IluvaIntiluhur Fuji Abadi, PT 1997 East Java 700
19 Istana Cipta Sembada, PT 1987 East Java 1,500
20 Kelola Mina Laut Gresik, PT 1994 East Java 7,000
21 Marine Cipta Agung, PT 1994 East Java 1,800
22 Megamarine Pride, PT 1992 East Java 2,000
23 Rex Canning, PT 1990 East Java 5,000
24 Scrum Marine, PT 1997 East Java 2,100
119Production
Year
No Name of Company Location Capacity
Established
(tons)
25 Sekar BumiTbk, PT 1997 East Java 24,000
26 Sekar Mulia, PT 1984 East Java 1,500
27 SK Foods Indonesia, PT 1990 East Java 800
28 Suri Tani Pemuka, PT 1987 East Java 7,200
29 Surya Alam Tunggal, PT 1984 East Java 5,000
30 Tani Abadi Sulawesi, PT 1985 East Java 900
Wonokoyo Jaya Corporation,
31 PT 1994 East Java 10,600
Sumber Kalimantan Abadi, East
32 PT 1986 Kalimantan 4,800
33 Lola Mina, PT 1983 Central Jakarta 1,800
34 Central Pertiwi Bahari, PT 1998 Lampung 77,700
Dipasena Citra Darmaja Tbk,
35 PT 1987 Lampung 72,900
36 Sumber Haslindo, PT 1977 North Jakarta 6,000
37 Diamond Cold Storage, PT 1970 North Jakarta 2,000
38 Lousiana Far East, PT 1995 North Jakarta 1,350
39 Lucky Samudra Pratama, PT 1983 North Jakarta 3,000
40 Ocean Mitramas, PT 1989 North Jakarta 6,000
41 Shing Sheng Fa Ocean, PT 2000 North Sulawesi 2,600
Sinar Pure Foods
42 International, PT 1991 North Sulawesi 1,000
North
43 Central Windu Sejati 1994 Sumatera 5,400
Medan Tropical Canning and North
44 Frozen, PT 1999 Sumatera 1,000
North
45 Timur Jaya Cold Storage, PT 1970 Sumatera 3,000
46 Alfa Kurnia, PT 2009 Papua 300
47 Dwi Bina Utama, PT 1975 Papua 1,459
South
48 SahabatInko, PT 1989 Kalimantan 425
120Production
Year
No Name of Company Location Capacity
Established
(tons)
Samarinda Cendana Cold South
49 Storage& Industry, PT 1975 Kalimantan 1,800
Bone Commercial Company,
50 PT 1960 South Sulawesi 12,300
Dharma Samudera Fishing
51 Industries, PT 1999 South Sulawesi 25,200
52 South Suco, PT 1989 South Sulawesi 5,200
53 WahyuPradanaBinamulia, PT 1996 South Sulawesi 3,700
South
54 Lauraindo, PT 1990 Sumatera 720
55 Fega Aquafarmindo, PT 1983 Tangerang 4,900
56 Grobest Indomakmur, PT 1989 Tangerang 180
57 Adijaya Guna Satwatama, PT 1998 West Java 3,400
58 Frozen Foods Pahala, PT 1998 West Java 900
West
59 Danitama Mina, PT 1989 Sumatera 10,000
TOTAL 816,856
Source: Survey by author.
Development of cargo equipment for cold storage for processed foods
The growth of the processed food industry sector in Indonesia has not yet been matched by
the presence of the food cold chain industry, which has an installed capacity of only 50% of
national needs. For this reason, in food industry policy in the context of implementing the
industry 4.0 roadmap, the government will make improvements by building a better cold
chain network.
The processed food industries that are highly depending on cold chain systems include the
sausage and nugget industry. In addition, there are also burgers, meatballs, corned beef,
smoked meat and roulades, all of which must pass the sterilisation process to increase the
durability of the product. Cold chains are needed starting from raw materials, processing, up
to the product ready to consume by consumers because it must be stored in the refrigerator
to extend its durability.
121Nowadays, there are lots of frozen food items such as sausages and nuggets. In recent years,
the sausage and nugget industry is quite developed in Indonesia.
Based on CIC’s records, up to 2018, the number of companies engaged in the sausage
business reached around 112, and the nugget business reached 117 with a capacity of 90,200
tons and 67,100 tons, respectively.
Meanwhile, when viewed from its production over the past five years, sausage production
increased by an average of 3.4% per year from 17,800 tons in 2014 to 20,300 tons in 2018.
Likewise, the production of nuggets over the past five years increased by 6.8% per year from
51,400 tons in 2014 to 66,900 tons in 2018.
Table 4.13: Development of Sausage and Nugget Production, 2014–2018
Production of
Growth Production of Growth
Year Sausages
(%) Nuggets (tons) (%)
(tons)
2014 17,839 – 51,443 –
2015 18,478 3.59 55,317 7.53
2016 19,118 3.46 59,191 7.00
2017 19,757 3.35 63,064 6.54
2018 20,397 3.24 66,938 6.14
Annual Average Growth (%) 3.41 – 6.81
Source: Survey by author.
In Indonesia, sausages have been known since the Dutch colonial era. Only the first known
sausage product is sausages which are packaged in cans and are fully imported. The first
sausage industry in Indonesia was pioneered by PT Badranaya, which was founded in 1918.
The forerunner of PT Badranaya was inseparable from the effort pioneered by Lambert
Scroeder, a Dutch national who made sausages by utilising leftover meat that was not sold.
After the establishment of PT Badranaya, it is then followed by the Mantrust Group with the
prime mover of the late Tegoeh Soetantyo AKA Tan KienLiep, formerly known as the
champion of canned food products, especially canned fish (tuna, sardines and mackerel) and
corned beef, through PT Canning Indonesia Products and PT Pengambengan Raya.
However, the sausage business which was pioneered in the decade of the 1940s was less
successful; thus, it was more focused on developing canned fish and corned beef. After that,
it was followed by Perusahaan Titiles in Denpasar, which was founded in 1950, UD. Ananda
in Denpasar (1974), PT Kemang Food Industries in Jakarta (1975), UD. Dilamo in Bandung
(1980) and PT Suba Indah in Jakarta (1980). In its development, PT Suba Indah was
subsequently taken over by San Miguel; thus, the name was changed to PT San MiguelPure
Foods Indonesia.
In line with the current development, based on the information obtained by CIC, there are
64 companies engaged in the sausage industry. PT So Good Food Manufacturing as a
producer of sausage brands SG SOZZIS, SO NICE and SO GOOD is listed as the owner of the
122largest production capacity in Indonesia, namely, 45,000 tons per year, or its role constitutes
49.9% of the total sausage production capacity nationally, which is 90,200 tons per year.
The second place is occupied by PT Charoen Pokphand Indonesia Tbk., with a sausage
production capacity of 12,000 tons per year (13.3%). It is then followed by PT
MadusariNusaperdana with 5,000 tons per year (5.5%), PT San MiguelPure Foods Indonesia
with 4,500 tons per year (5.0%), PT Kemang Food Industries with 3,000 tons per year(3.3%),
PT Belfoods Indonesia and PT ElodaMitra are each 2,000 tons per year (2.2%), PT Wonokoyo
Jaya Corporindo with 1,500 tons per year (1.7%), PT Soejasch Bali and PT
DagsapEnduraEatore with 1,000 tons (1.1%) and so on.
As for the nugget industry, the largest production capacity of nugget in Indonesia in 2018
was held by PT Charoen Pokphand Indonesia Tbk., which produces the brand of FIESTA,
GOLDEN FIESTA, CHAMP and OKEY with a capacity of 17,500 tons per year, or 26.1% of the
total national nugget production capacity, which in 2018 reaches 67,100 tons per year.
It is then followed by PT MadusariNusaperdana with 12,000 tons per year (17.9%), PT
Belfoods Indonesia with 8,000 tons (11.9%), PT So Good Food Manufacturing with 6,5000
tons per year (9.7%), PT Kemang Food Industries with 5,000 tons (7.5%) and PT Frozen Food
Pahala with 4,600 tons per year (6.9%) as shown in the following table:
Table 4.14: Producers of Sausage and Nugget in Indonesia and Its Capacity, 2018
Production Capacity Share
No. Name of Company
(tons) (%)
Producer of Sausage
1 So Good Food Manufacturing, PT 45,000 49.9
2 Charoen Pokphand Indonesia Tbk., PT 12,000 13.3
3 Madusari Nusaperdana, PT 5,000 5.5
4 San Miguel Pure Foods Indonesia, PT 4,500 5.0
5 Kemang Food Industries, PT 3,000 3.3
6 Belfoods Indonesia, PT 2,000 2.2
7 Eloda Mitra, PT 2,000 2.2
8 Wonokoyo Jaya Corporindo, PT 1,500 1.7
9 Soejasch Bali, PT 1,000 1.1
10 Dagsap Endura Eatore, PT 1,000 1.1
11 Makanan Sehat Nusantara, PT 800 0.9
12 Macroprima Pangan Utama, PT 750 0.8
13 Suryajaya Abadi Perkasa, PT 650 0.7
14 Diamond Cold Storage, PT 600 0.7
15 SicmaInti Utama, PT 500 0.6
16 Titiles, Perusahaan 400 0.4
17 Dunia Daging Food Industries, PT 360 0.4
18 Sorin Maharasa, PT 350 0.4
19 Petra Sejahtera Abadi, PT 350 0.4
20 Sumber Prima Anugrah Abadi, PT 300 0.3
123Production Capacity Share
No. Name of Company
(tons) (%)
21 Aroma Duta Rasaprima, PT 300 0.3
22 Sumber Pangan Jaya, PT 300 0.3
23 Elson Bernardi, PT 250 0.3
24 Winner Food Industry, PT 250 0.3
25 Pasir Kaliki, PD 200 0.2
26 Miko PanganUtama, PT 200 0.2
27 Perikanan Nusantara, PT 150 0.2
28 Satria Pangan Sejati, PT 150 0.2
29 Bumifood Agro Industri, PT 150 0.2
30 Other Producers 6,190 6.9
TOTAL CAPACITY 90,200 100.0
Producers of Nugget
1 Charoen Pokphand Indonesia Tbk., PT 17,500 26.1
2 Madusari Nusaperdana, PT 12,000 17.9
3 Belfoods Indonesia, PT 8,000 11.9
4 So Good Food Manufacturing, PT 6,500 9.7
5 Kemang Food Industries, PT 5,000 7.5
6 Frozen Food Pahala, PT 4,600 6.9
7 Wonokoyo Jaya Corporindo, PT 1,500 2.2
8 Suryajaya Abadi Perkasa, PT 1,500 2.2
9 Soejasch Bali, PT 1,250 1.9
10 Macroprima Pangan Utama, PT 1,200 1.8
11 Makanan Sehat Nusantara, PT 1,000 1.5
12 Sorin Maharasa, PT 600 0.9
13 San Miguel Pure Foods Indonesia, PT 500 0.7
14 Dagsap Endura Eatore, PT 500 0.7
15 Diamond Cold Storage, PT 250 0.4
16 Pasir Kaliki, PD 250 0.4
17 Petra Sejahtera Abadi, PT 200 0.3
18 Sumber Prima Anugrah Abadi, PT 200 0.3
19 Sakana Indo Prima, PT 200 0.3
20 Aroma Duta Rasaprima, PT 150 0.2
21 Elson Bernardi, PT 150 0.2
22 Perikanan Nusantara, PT 150 0.2
23 Central Pertiwi Bahari, PT 150 0.2
24 Satria Pangan Sejati, PT 100 0.1
25 Other Producers 3,650 5.4
TOTAL CAPACITY 67,100 100.0
Source: Survey by author.
124Development of cargo equipment for cold storage for chemical products, pharmaceuticals,
and drugs
Cold chain processes in chemical, pharmaceutical and drug industries are also needed to
prevent damage to their chemical structure. Changes and damage to chemical structures can
cause potential loss, and drugs becomes useless as vaccines for immunisation. Failure to
provide good cold chains causes damage to almost 50% of vaccines worldwide every year.
Since the discovery of vaccines and vaccine manufacturing techniques that are growing
rapidly to date, there is one thing that absolutely must exist if we talk about vaccine storage,
namely, cold chain, which is a vaccine storage system with a temperature of between 2°C
and 8°C, so that the components in a bioactive vaccine do not get damaged because of high
temperatures or too low temperatures. With the right storage temperature, the potential for
vaccine protection will be maintained except for certain types of vaccines such as oral OPV
polio vaccine, which must be stored below -20°C.
As for the consideration in choosing the cold chain, it includes the number of targets; the
volume of vaccines to be loaded; the available energy sources; the nature, function and
temperature stability of storage facilities; the parts and recommendations of WHO or the
results of research or trials that have been conducted.
Table 4.15: Storing Temperature and Age of Vaccine Based on Type of Vaccine
Type of
Storing Temperature Age of Vaccine
Vaccine
BCG +2°C up to +8°C or -15°C up to -25°C 1 year
Polio +2°C up to +8°C 6 months
-15°C up to -25°C 2 years
Measles +2°C up to +8 °C or -15°C up to -25°C 2 years
DPT +2°C up to +8°C 2 years
Hepatitis B +2°C up to +8°C 26 months
TT +2°C up to +8°C 2 years
DT +2°C up to +8°C 2 years
DPT – HB +2°C up to +8°C 2 years
Source: Galazka, Milstien, and Zaffran (1998).
The use of cold chains in the chemical, pharmaceutical and drug industry is like the horns of
a dilemma. On the one hand, the cold chain is necessary, while on the other hand, the use of
cold chain is quite expensive. Based on the information obtained, cold chain costs for
vaccines from the beginning of production until they are used in hospitals or clinics can reach
around 80% of the selling price of the vaccine itself.
Seeing this condition, the use of cold chains becomes a problem, especially for health service
providers and pharmaceutical companies and especially with conditions in some areas,
where the availability of electricity is still a problem.
125The pharmaceutical industry has been developing in Indonesia for a long time. Various kinds
of drugs have been able to be produced in increasing numbers with an increasingly extensive
distribution network; thus, they can reach almost all levels of society. Even the
pharmaceutical industry is one of the business sectors that still survive.
Based on data collected by CIC, the total number of pharmaceutical companies in Indonesia
(both companies that have factories and importing companies that hold imported product
licenses) that registered at the relevant agencies up to the end of 2018 reached 259
companies, consisting of 217 companies that already have its own pharmaceutical factories
and the remaining 42 companies that are only listed as companies holding licenses for
imported pharmaceutical products.
4.6. Cold chain business model in Indonesia
In Indonesia, there are two models of cold chain business player, namely, those that are used
alone (integrated) and those that are fully leased. The main function of that is used alone is
to store its own products, either temporarily or for long periods, as stock.
Companies with business models like this are usually integrated with the company’s main
activities and become supporting of its operational activities. Therefore, the activity of
storing, shipping goods or distributing is performed by the company itself in accordance with
its business activities. Examples of integrated business models are the ice cream industry;
importers of meat, fruit, vegetables and food; and exporters of fish or seafood.
Occasionally, it is also leased to other parties, but the space offered is limited. An example of
an integrated company is PT Dharma Samudera Fishing Industries, which engaged in the
fisheries sector, and PT Unilever Indonesia Tbk., which produces the Wall’s ice cream brand.
For the leased one, there are two types of companies, namely, logistics and forwarders,
transportation companies, and companies that specifically engaged in the rental of cold
storage, among others are PT Wahana Cold Storage and PT Pluit Cold Storage.
Cold storage operated in Indonesia
Cold storage is a room designed with certain temperature conditions and is used to store
various products with the aim of maintaining freshness and material content. There are
several types of cold storage that are operated, namely, chilled room, freezer room, blast
freezer and blast chiller.
Chilled rooms and freezer rooms are used to store products according to received
temperature conditioning, while freezer blasts and blast chillers are used to condition a
product at a certain temperature. Chilled room is a low-temperature cooling room between
1ᵒC and 7ᵒC. This room is used to store fresh foodstuffs, such as vegetables, fruits and other
ingredients with a durability of up to two months.
126You can also read