A Minimum Income Standard for the United Kingdom in 2021
←
→
Page content transcription
If your browser does not render page correctly, please read the page content below
A Minimum Income
 Standard for the
 United Kingdom
     in 2021
     by Abigail Davis, Donald Hirsch, Matt Padley and Claire Shepherd.

  This report looks at the current levels of MIS and the extent to which people
can achieve it based on benefits, Universal Credit and the National Living Wage.
               It also looks at preliminary research on how norms
                 have been affected by the COVID-19 pandemic.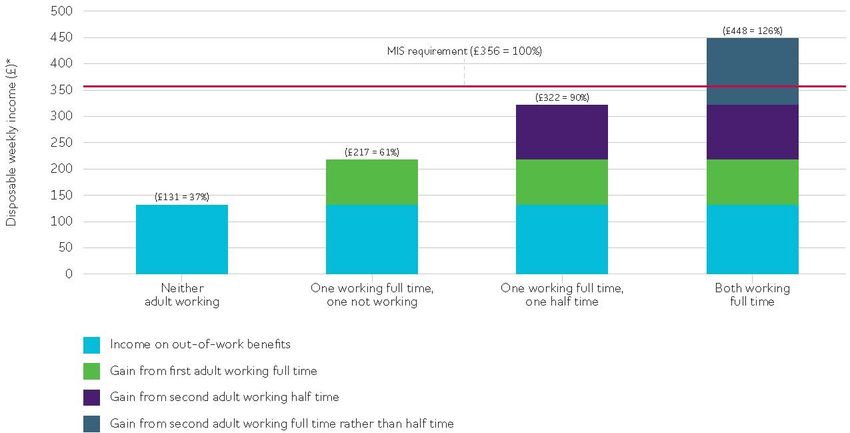
A Minimum Income Standard for the
United Kingdom in 2021
bigail Davis, Donald Hirsch, Matt Padley and Claire Shepherd
The Minimum Income Standard (MIS) presents a vision of the living standards
that we, as a society, consider everyone in the UK should be able to achieve.
This is the 2021 update of MIS for the United Kingdom, based on hat
members of the public think e all need for an acceptable minimum
standard of living. It shos that in 2021, many people on lo incomes are
being held back from reaching this standard, because of unstable ork,
inadequate pay and a benefits system that does not provide adequate
income security.
What you need to know
To Government actions can loosen some of the constraints that are preventing families from reaching
MIS:
• Instead of taking aay £20 a eek from millions of families’ already-precarious incomes this October
by cutting Universal Credit (UC), keep this lifeline. The Government should also ensure that people
ho are still receiving the ‘legacy benefits’ that UC is replacing, many of hom are disabled or carers,
are no longer excluded from this vital improvement to support.
• Develop a strategy to make jobs ork, by improving the stability and adequacy of earnings from
ork, and focusing on reducing the uncertainties that people no face in the labour market, by
orking to provide better jobs. This is particularly urgent as the furlough scheme comes to an end,
also in October 2021.
We can solve UK poverty
JRF is orking ith governments, businesses, communities, charities and individuals to solve UK poverty.
Minimum Income Standard for the United Kingdom in 2021 plays an important part in monitoring
costs and living standards – a key focus of our strategy to solve UK poverty.
July 2021
.jrf.org.uk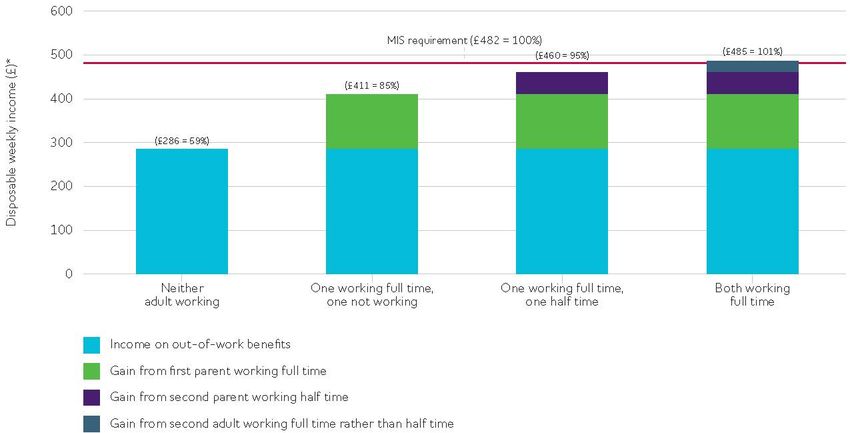
Contents
Executive summary 1
1 Introduction 2
2 MIS budgets in 2021 6
3 Comparison of MIS ith incomes on benefits and the National Living age 9
4 COVID-19 and public vies of a minimum living standard in 2021 16
5 Conclusion 23
Notes 24
References 25
ppendix 1: MIS results over time 26
ppendix 2: MIS, median income and the poverty line 31
cknoledgements 33
bout the authors 34
i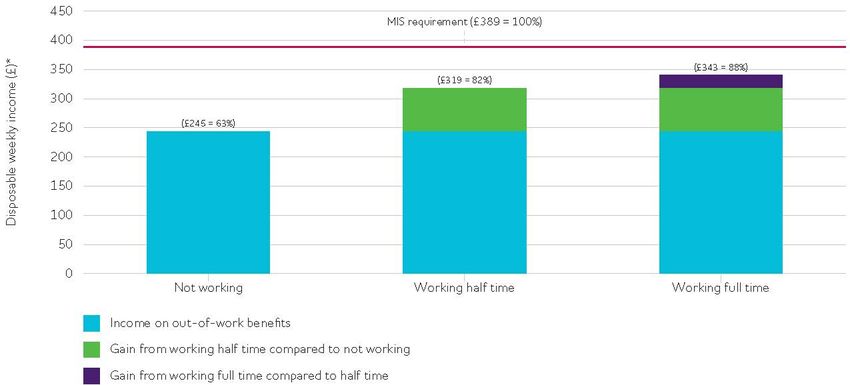
ii
Executive summary
The Minimum Income Standard (MIS) presents a vision of the living standards that e, as a society,
consider everyone in the UK should be able to achieve. In this year’s MIS report, e report on the current
levels of MIS, on the extent to hich people can achieve this based on benefits, Universal Credit (UC) and
the National Living age (NL), and on preliminary research considering ho norms have been affected
by COVID-19.
In 2021, MIS budgets previously dran up by members of the public have been uprated by inflation, and
our calculations take account of the benefit, UC and income tax levels introduced in pril this year.
Inflation, hile still lo by historic standards, has started to return, and to affect households’ ability to
make ends meet. Families ith children sa a 2.5% rise in minimum living costs and a 3–4% rise in
childcare costs, but benefits and UC increased at a sloer rate. In 2021:
• Out-of-ork families ith children on UC fall about 40% short of the income they need, and those
ithout children fall 60% short.
• ork improves income considerably, even part-time jobs on the NL, but still mainly falls short of
enabling people to reach MIS, holding back millions of households from reaching the income
considered adequate by society. Even orking full time, a single person falls 14% short of this
standard and a lone parent ith to children falls 12% short, although a couple ith to children can
reach it if both parents ork full time. For those ith part-time jobs, the shortfalls are much greater,
underlining the damaging effects of uncertain and sporadic ork.
• Cutting UC by £20 per eek, as planned for October 2021, is set to make these outcomes
considerably orse. Other adverse factors that need addressing include the groing reach of the
Benefit Cap, no affecting families ith to or more children, and the groing number of families
living in privately rented housing, for hom high rents can reduce net incomes considerably.
In pril and May 2021, ne MIS research consulted members of the public, asking them to reflect on the
impact of a year of COVID-19, and exploring hether and to hat extent it had changed their
perceptions of hat is needed for a minimum socially acceptable standard of living in the UK. This
preliminary research as not used this year to alter MIS budgets, but to gain insights that ill inform
future research revising the budgets.
Participants in this research reflected on ho they have been living differently during the pandemic,
particularly ho this has affected the ays they spend money on their homes, on technology, on travel
and on recreation. For some of these changes, especially those affecting recreation and social
interaction, members of the public consider that needs are not being met at present, and continue to
vie these needs in much the same ay as pre-pandemic. This confirms that it remains important for
people to have the resources needed to participate in society, as they did pre-pandemic.
In other cases, people are less certain about hether previous spending patterns ill return. These
include the balance beteen online and in-person shopping, ork patterns and their consequences for
travel, and the technological requirements of a home. In particular, they anticipate that ork ill be
different in the future, and this could significantly affect the minimum cost of living, but in different ays
for different people. Future research ill therefore have to look afresh at hat can be considered a
common minimum, that everyone should be able to afford.
The report concludes that using MIS to identify hat e, as a society, consider to be a living standard that
everyone ought to be able to reach, has become more relevant than ever in the 2020s. In the ake of
the pandemic, it is essential that e develop ne approaches to ensuring that people are not held back by
inadequate benefits, and uncertain and unstable job prospects. The first step must be to recognise the
value of the additional support in helping families build better lives, and not take aay £20 a eek from
the already-precarious incomes of millions of families by cutting UC this October. It must also look at
ne ays of creating good, stable jobs, as the backup provided by the furlough scheme is ithdran.
11 Introduction
s the United Kingdom assesses the short- and longer-term effects of COVID-19, millions of
households are struggling to make ends meet. Even before the pandemic, three in ten UK households
had incomes too lo to meet a minimum budget as defined by members of the public (Padley and Stone,
2021). The restrictions that have accompanied COVID-19 have disrupted people’s livelihoods, hitting
families on lo incomes hard (Hill and ebber, 2021).
The Minimum Income Standard (MIS) provides a vision of the standard of living that e, as a society,
consider that people should be able to achieve. To meet this standard, households need not just to reach
a given income level at a point in time, but to achieve a degree of security and stability that many people
find elusive. People are being held back by unstable labour markets and uncertainties over benefits, as
ell as by inadequate levels of income from earnings and from the state.
During the pandemic, Government measures have gone some ay toards mitigating its impact so far on
living standards, in particular through the furlough scheme and the £20-a-eek increase in Universal
Credit (UC) rates, but households ill face ne uncertainties hen this support falls aay (Breer et al,
2021). In future years, the MIS benchmark ill be particularly important in assessing hat is needed for
people to achieve stable incomes to reach the standard that society expects. MIS ill also sho ho this
standard evolves as society changes, revieing hether the profound impact of COVID-19 on society
has altered hat people think a minimum acceptable living standard includes.
Since 2008, MIS research has orked out ho much income households require to meet their material
needs and participate in society, based on the deliberations of groups of members of the public. This
report presents the MIS results for 2021, and compares them to incomes of people on minimum ages
and out-of-ork benefits. The household budgets used in this report ere originally researched in 2018
and 2020, and this report uprates them, based on inflation, to 2021 prices. It also compares these
uprated MIS budgets to the incomes of those relying on UC and minimum age income, at the rates
introduced this pril.
This year’s report, the 14th in the MIS series, has a number of distinctive features:
• Comparisons of orking-age incomes ith MIS are no focused on households claiming UC.
Previous versions had started by looking at ‘legacy’ benefit and tax credit entitlements. UC has no
become the dominant system, even though the sitchover is far from complete, folloing a doubling
of the number of households on UC during the pandemic (increasing from 2.58m in February 2020
to 5.04m in February 2021). In this report, e have continued to make some comparisons ith the
legacy system here relevant, and the online Minimum Income Calculator (see Box 1) still allos
results to be generated for the legacy benefit system.
• This year, for the first time, our income calculations assume that orking people contribute to a
pension scheme. Folloing the full rollout of auto-enrolment in employer schemes, participants in
MIS orking-age discussion groups have unanimously agreed that contributing at standard rates to
such a scheme should be the default assumption hen calculating hat people need to earn
(although our Minimum Income Calculator allos users to ‘opt out’ of this if they ish). MIS
discussion groups ere firmly of the vie that they should be included, since auto-enrolment
suggests that the Government expects that people ill need to make that provision for their
retirement. e assume here that people in ork are auto-enrolled in ork-based pensions, on
standard conditions that require employees to contribute 4% (net of tax) of eligible earnings to the
scheme. This change has typically added around £1,000 a year to the earnings required to reach MIS
(see ppendix 1, Table 7).
• In 2021 e carried out additional research investigating the extent to hich current vies of
necessities have been affected by the COVID-19 pandemic. This provided an initial reflection on
areas of life that have changed in the UK over the past 16 months. It is still too early to translate
these into any ne ‘norms’ that could eventually influence hat is considered to be part of a
minimum acceptable standard of living in the UK. Hoever, this preliminary research allos us to
2start considering ho such ne norms might be investigated, and ill be explored in more detail in
the MIS 2022 report.
This update is part of a regular annual cycle of MIS updates. Table 1 shos the ork being carried out in
the present four-year cycle. Each household budget is researched from scratch once in the cycle
(‘rebased’), and then revieed after to years. In other years, including 2021, previously identified
budgets are updated to take inflation into account. In 2022, budgets for households ithout children ill
be fully rebased, and budgets for those ith children revieed. The ne research in 2022 ill explore and
incorporate any changes in ho minimum living requirements are vieed by the public resulting from the
pandemic. Box 1 gives further details about MIS.
Table 1: The current MIS updating cycle
2020 2021 2022 2023
Households
Revie Inflation uprating Rebase Inflation uprating
without children
Families with
Rebase Inflation uprating Revie Inflation uprating
children
3Box 1: MIS in brief
hat is MIS?
MIS is the income that people need to reach a minimum socially acceptable standard of living in the UK
today, based on hat members of the public think. It is calculated by specifying baskets of goods and
services required by different types of households to meet these needs and to participate in society.
Specifically, the minimum is defined as follos, based on consultation ith groups of members of the
public in the original research:
minimum standard of living in the UK today includes, but is more than just, food, clothes and shelter. It
is about having hat you need in order to have the opportunities and choices necessary to participate in
society.
Ho is it arrived at?
Members of the public have detailed negotiations, in groups, about the things a household needs to
achieve an acceptable living standard. Each set of groups has a different role. The first groups go through
all aspects of the budget, in terms of hat goods and services ould be needed, of hat quality, ho long
they ould last, and here they ould be bought. Experts make selective inputs, notably checking the
nutritional adequacy of the food baskets, calculating domestic fuel requirements and advising on
motoring costs. Subsequent groups check and amend the budget lists, hich are then priced at various
stores and suppliers by the research team. Groups typically comprise six to eight people from a range of
socioeconomic and ethnic backgrounds, but all participants ithin each group are from the household
category under discussion. So, parents ith dependent children discuss the needs of parents and children,
orking-age adults ithout children discuss the needs of single and couple adults ithout children, and
pensioner groups decide the minimum for pensioners. In all, over 160 groups have been used to research
MIS since its inception in 2008, involving a ne set of participants on each occasion.
crucial aspect of MIS is its method of developing a negotiated consensus among these socially mixed
groups. This process is described in detail in Davis et al (2015). The MIS approach uses a method of
projection, hereby group members are asked not to think of their on needs, but of those of
hypothetical individuals (or case studies). Participants are asked to imagine alking round the home of
the individuals under discussion, to develop a picture of ho they ould live, to reach the living standard
defined above. hile participants do not alays start ith identical ideas about hat is needed for a
minimum socially acceptable standard of living, through detailed discussion and negotiation they
commonly converge on ansers that the group as a hole can agree on. here this does not appear to
be possible, for example here there are to distinct arguments for and against the inclusion or
exclusion of an item, or here a group does not seem able to reach a conclusion, subsequent groups help
to resolve differences.
hat does it include?
s set out in the definition above, a minimum is about more than survival alone. Hoever, it covers needs,
not ants; and necessities, not luxuries: items that the public think people need to be part of society. In
identifying things that everyone requires as a minimum, it does not attempt to specify extra requirements
for particular individuals and groups ho may have additional needs – for example, those resulting from
living in a remote location or having a disability. So, not everybody ho has more than the minimum
income can be guaranteed to achieve an acceptable living standard. Hoever, someone falling belo the
minimum is unlikely to achieve such a standard.
Ho can the results be accessed?
There are several ays of accessing MIS results, all via the results page1 on the Loughborough University
MIS ebsite:
1. The online Minimum Income Calculator2 shos the budgets and earnings requirements for any
specified household type.
2. There are detailed lists of the items used to compile the budgets for each household type.
3. For users ho ant to analyse the data, there are spreadsheets shoing the budgets broken don
by category for each of the main household types for each year of MIS.
44. There is also an Excel version of the current year calculator that can generate results for any
specified household type for the present year.
To hom does it apply?
MIS applies to households that comprise a single adult or a couple, ith or ithout dependent children. It
covers most such households, ith its level adjusted to reflect their composition. The needs of more than
a hundred different family combinations (according to numbers and ages of family members) can be
calculated. It does not cover families living ith other adults in the main calculations, although
supplementary reports on single adults sharing accommodation (Hill et al, 2015) and single adults in their
20s living ith their parents (Hill and Hirsch, 2019) estimate variations for these household types.
here does it apply?
MIS as originally calculated as a minimum for Britain; subsequent research in Northern Ireland in 2009
shoed that the required budgets there ere all close to those in the rest of the UK, so the national
budget standard no applies to the hole of the UK.
This main UK standard is calculated based on the needs of people in urban areas outside London. Most
groups are held in Midlands tons and cities, but from 2018 budgets have been revieed in other parts
of the UK. The research has also been applied in other geographical contexts, in supplementary projects
considering costs in rural England (Smith et al, 2010), London (Padley et al, 2021), remote rural Scotland
(Hirsch et al, 2013), and Guernsey (Smith et al, 2011). The London research is ongoing, and Inner and
Outer London budgets are shon as a variation of the main UK results budgets in the online Minimum
Income Calculator. Other countries have used the same overall method but employed their on
definitions of the minimum, carrying out studies in Japan (Davis et al, 2013), Portugal (raP, nd), France
(Gilles et al, 2014), Thailand, Singapore (Teo and Ng, 2019), Tunisia and Mexico (ban Tamayo et al,
2020). n ongoing MIS programme in the Republic of Ireland uses methods based on the UK ork
(Collins et al, 2012). Pilot research has also been carried out in South frica (Byaruhanga et al, 2017).
Ho is it related to the poverty line?
MIS is relevant to the discussion of poverty, but does not claim to be a poverty threshold. This is because
participants in the research ere not asked to talk about hat defines poverty, but instead hat, in
today’s society, constitutes an acceptable minimum. Hoever, it is relevant to the poverty debate in that
almost all households officially defined as being in income poverty (having belo 60% of median income)
are also belo MIS. Thus, households classified as being in relative income poverty are generally unable to
reach an acceptable standard of living as defined by members of the public.
ho produces it?
The main MIS research is supported by the Joseph Rontree Foundation (JRF) and carried out by the
Centre for Research in Social Policy (CRSP) at Loughborough University. The original research in 2008
as developed by CRSP in partnership ith the Family Budget Unit (FBU) at the University of York.
52 MIS budgets in 2021
MIS produces budgets for a ide range of household types. Specifically, budgets are calculated for
pensioners, orking-age adults ithout children and families ith children; ithin each of these, e
distinguish budgets for single adults/lone parents and for couples. For families ith children, budgets can
be calculated to include up to four children ith couple parents and up to three ith lone parents, in any
combination of four age categories: aged 0–1, aged 2–4, primary school age and secondary school age.
The online calculator allos budgets for these combinations to be calculated. In our main analysis, e
look at four examples ithin these categories, hose minimum budgets are set out in Table 2.
6Table 2: Weekly MIS budgets, four household types, April 2021
Lone parent with Couple with two
Single adult, two children aged children aged 2–4
Couple pensioner
working age 2–4 and primary and primary
school age school age
Food £50.99 £75.25 £81.43 £111.94
lcohol £6.10 £12.37 £5.40 £10.47
Tobacco £0.00 £0.00 £0.00 £0.00
Clothing £9.46 £15.82 £36.31 £46.52
ater rates £6.09 £7.18 £10.90 £10.90
Council Tax £17.17 £22.92 £21.82 £29.08
Household
£1.57 £1.55 £1.31 £1.46
insurances
Fuel £13.50 £15.07 £18.04 £19.25
Other housing costs £1.48 £2.99 £1.94 £1.94
Household goods £10.05 £17.55 £26.67 £27.56
Household services £7.66 £10.77 £13.64 £10.84
Childcare £0.00 £0.00 £225.39 £225.39
Personal goods and
£17.62 £38.67 £31.73 £41.59
services
Motoring £0.00 £0.00 £69.08 £69.61
Other travel costs £43.30 £19.16 £6.30 £32.49
Social and cultural
£44.82 £81.56 £86.16 £97.73
participation
Rent £95.45 £86.81 £93.02 £93.02
Total excluding rent
£229.81 £320.86 £410.74 £511.39
and childcare
Change since 2020 1.3% 1.0% 2.5% 2.4%
TOTL LL £325.26 £407.67 £729.14 £829.80
Total excluding
£325.26 £407.67 £503.75 £604.41
childcare
Total excluding rent,
childcare, Council
Tax and ater
£206.55 £290.76 £378.02 £471.41
(comparable to
fter Housing Cost
income measure)
Total excluding
childcare and
Council Tax
(comparable to £308.08 £384.76 £481.94 £575.33
Before Housing
Cost income
measure)
Total excluding rent,
Council Tax, £212.64 £297.95 £388.92 £482.31
childcare
7Overall, these figures reflect the return of some modest inflation in 2021 compared ith flat prices the
previous year. The Consumer Price Index (CPI) rose by 1.5% overall in the year to pril 2021. Some items
such as food sa no change, and this is reflected in the modest increases for households ithout
children. Hoever, for families ith children hose budgets include running a second-hand car, a 14%
rise in the price of petrol from its lo point in pril 2020 contributed to MIS budgets rising slightly faster
than the CPI overall.
To further increases affecting households this year have been Council Tax, hich rose by an average of
4%, and childcare, hich rose around 3–4% (for preschool nursery places). Rents increased by around
1.5% in both the private and social housing sectors.
Since 2008, hen MIS results ere first calculated, budgets have fluctuated to some degree, but
remained broadly stable in real terms. Figures 8–10 in ppendix 1 sho these changes. Some
fluctuations have occurred due to items being added, changed or subtracted at each ‘rebase’, or because
the cost of essentials rose at different rates than general prices. Pensioner budgets have trended
upards, having started out belo those of orking-age adults, ith hich they have converged to some
extent (see Davis et al, 2018). CPI-adjusted pensioner budgets are no about 20% higher than in 2008,
hile other budgets are typically 5–10% higher, much of hich can be accounted for by prices of MIS
items changing at different rates from the overall CPI. ppendix 2 considers ho changes in MIS budgets
compare to changes in median income over the period. It shos that because MIS has not tracked such
fluctuations in actual incomes, households on the relative poverty line of 60% of the median have been
better or orse off relative to the MIS threshold at different times.
83 Comparison of MIS with incomes on
benefits and the National Living Wage
Ho do the minimum incomes guaranteed by benefits and by the National Living age (NL) compare
to the MIS benchmark? This chapter looks in turn at the situation for adults ithout children, families
ith children and pensioners. It compares disposable household incomes ith the equivalent MIS budgets.
‘Disposable income’ is used here to mean the amount available to a household to spend each eek after
paying taxes (including Council Tax), and covering their rent and any childcare costs.
Working-age adults without children
For orking-age adults ithout children, the minimum disposable income guaranteed through benefits is
far loer, relative to MIS, than for families ith children or for pensioners. Conversely, the income gains
from orking full time on the NL are larger, alloing couples to reach MIS on the NL, and singles to
get close to doing so. These results are illustrated in Figures 1 and 2. They sho that:
• orking-age adult or couple relying on out-of-ork benefits gets less than half of hat they need
through UC. ithout last year’s £20-a-eek increase to UC, hich is included here, the proportion
falls to around one third. Those relying on Income Support/Jobseeker’s lloance in the legacy
benefits system already have extremely lo incomes relative to need, and if UC is cut on 1 October
2021 as planned, so ill claimants of UC. The figures also include an estimate of ho much the rent
element of UC is likely to fall short of an actual private rent, due to restrictions in the uprating of the
Local Housing lloance. In 2020, this rent penalty as greatly reduced for many tenants by
recalibrating the rent element to the 30th percentile of local rents, but the refreezing of these rates
this year means that annual increases in rent are not being covered.
• single person orking full time more than doubles their disposable income compared to those not
orking. This is not quite enough to reach MIS, but the gap has been reduced greatly by the
introduction of the NL. In 2015, a single person orking full time on the minimum age fell 30%
short of hat they required; no it is just 14%. The gap has narroed over this period as the NL
has risen faster than inflation. Since pril 2015 it has risen by 37%, compared to CPI inflation of just
10%.
• Singles orking part time or ith intermittent ork can end up a long ay short of hat they need.
Figure 1 shos, for example, that orking half time on the NL, a single person ends up one-third
short of MIS. hile almost 80% of employed people ithout children still ork full time,3 the
precarity of ork over the past year has restricted the orking options of younger adults in
particular. These figures sho ho important access to full-time ork can be for the living standards
of this group.
• couple ithout children is the one household type hose income can greatly exceed MIS on the
NL, provided that both partners ork full time. This type of household has the most favourable
ratio of income to costs.
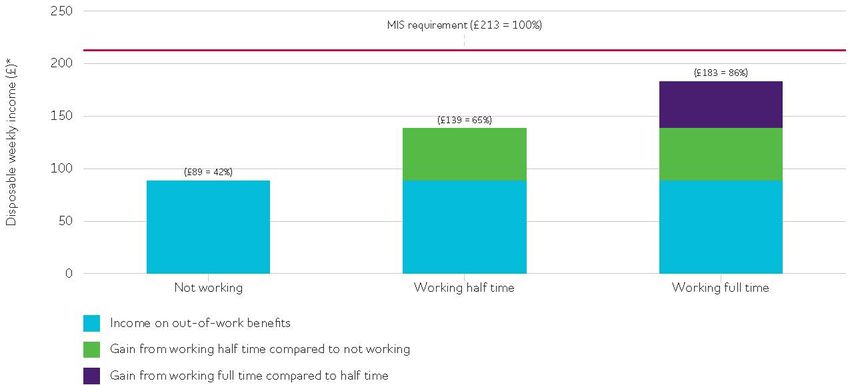
9Figure 1: By working full time on the NLW, a single adult without children can double their
out-of-work income, but still fall short of MIS
Note: *ssumes UC £20 increase is in place. If UC is reduced by £20 per eek as planned in October 2021, percentages reduce: from
42% to 33% (not orking); from 65% to 56% (half time); and from 86% to 83% (full time).
Percentages sho the percentage of MIS budget covered, net of rent, childcare and Council Tax.
Figure 2: A couple without children can get comfortably above MIS if both work full time on
the NLW
Note: *ssumes UC £20 increase is in place. If UC is reduced by £20 per eek as planned in October 2021, percentages reduce: from
37% to 31% (neither orking); and from 61% to 55% (one orking full time). To orking adults ithout children are not eligible for
UC in the other to examples shon.
Percentages sho the percentage of MIS budget covered, net of rent, childcare and Council Tax.
longside the calculations of incomes relative to MIS of people on the NL, e also calculate hat they
need to earn to meet the MIS budgets fully.
single person needs to earn £20,400 a year to reach the MIS level. This compares to earnings of
£17,400 orking full time (37.5 hours a eek) on the NL. ithout the assumption that they pay auto-
10enrolled pension contributions, the earnings requirement ould be £19,600, compared to the £19,100
needed in 2020.
couple ithout children, both orking, need to earn £27,400 a year beteen them (an average of
£13,700 each) to reach MIS. If they both ork full time on the NL, they ill earn £34,800 beteen
them.
Families with children
For families ith children, the minimum income guaranteed by out-of-ork benefits is not as lo,
relative to MIS, as for orking-age adults ithout children, but nevertheless falls a long ay belo the
income required. orking on the NL, a lone parent’s income still falls short of MIS, but a couple can
potentially reach the standard if both parents ork full-time. This is illustrated in Figures 3 and 4, using
examples of a lone parent and couple parents, both ith to children aged 3 and 7.
lone parent ith to children faces a shortfall of over £140 a eek in meeting the MIS budget if they
are out of ork. part-time job can close about half of this gap, here the parent orks half time on the
NL. orking full time makes them better off, but they still fall £46 a eek short of being able to afford
the minimum living standard set out by MIS, and they ould need to earn £27,500 a year to reach this
standard fully. Families ith children sometimes see relatively small gains here a parent orks full time
rather than part time, caused by a combination of the reduction of UC as earnings rise, and the need to
spend some of these earnings on childcare.
For orking couples, the situation is more favourable. hile they fall over 40% short of MIS if they are
out of ork, even taking account of last year’s £20 increase in UC, this can be reduced to 15% short if
one parent orks full time on the NL; to 5% if a second parent orks half-time; and, if both are
orking full time at this age rate, each earning £17,400 a year, their income slightly exceeds the MIS
level.
Three factors in particular have made it possible for some orking parents to get closer to the MIS level
than in the recent past – although ith some important caveats in each case:
• UC pays up to 85% of childcare costs, an improvement from the 70% paid by orking Tax Credit.
The key caveat here is that the limits to eligible childcare costs have not been increased since 2005,
and the average cost of full-time childcare exceeds these limits in an increasing number of cases,
particularly for families ith children under 2, ho are ineligible for the 30-hours early years
entitlement. For example, for a lone parent ith a child under 2, orking full time rather than part
time ould make them orse off financially. They ould have to contribute over £100 out of their
ages toards full-time childcare costs, making them nearly £50 a eek orse off than if they
orked half time ith much loer childcare costs.
• The increases in the NL have helped families become better off, especially those ith to ages.
Until 2019, these increases ere to a significant degree offset by real-terms cuts in UC. Hoever, in
2020 and 2021, UC has risen.
• The additional £20-a-eek increase in UC has helped all families claiming it to get closer to MIS. In
Figures 3 and 4, ithout this increase, the percentages shon ould be about five points loer for a
lone parent and four points loer for a couple family. If UC is cut by £20 as planned in October
2021, progress in getting some families closer to MIS through better pay ould be reversed.
11Figure 3: A lone parent with children aged 3 and 7 can halve the amount they fall below MIS
if they get a part-time job on the NLW, but childcare costs means that they only gain slightly
more by working full time
Note: *ssumes UC £20 increase is in place. If UC is reduced by £20 per eek as planned in October 2021, percentages reduce: from
63% to 58% (not orking); from 82% to 77% (half time); and from 88% to 83% (full time).
Percentages sho the percentage of MIS budget covered, net of rent, childcare and Council Tax.
Figure 4: A couple with two children aged 3 and 7 can reach MIS on the NLW only if both
parents work full time
Note: *ssumes UC £20 increase is in place. If UC is reduced by £20 per eek as planned in October 2021, percentages reduce: from
59% to 55% (neither orking); from 85% to 81% (one orking full time); from 95% to 91% (one full time, one half time); and from 101%
to 97% (both full time).
Percentages sho the percentage of MIS budget covered, net of rent, childcare and Council Tax.
To other features of UC ork against these improvements for some families. First, for families ith
three or more children, the to-child limit on UC entitlements, affecting those born after pril 2017,
continues to bite. For a couple ith children no aged 3, 7 and 14, for example, out-of-ork benefits
12provide less than half the income required for MIS, and even if both parents ork full time, they end up
over £110 a eek short of meeting the standard.
Second, the effect of the Benefit Cap continues to cut ever more deeply into the incomes of out-of-
ork families, because of the cap being frozen despite prices and benefit entitlements rising. The
calculations shon in Figure 4 assume families are in social housing, hich means that they do not
generally hit the Benefit Cap if entitled to benefits for up to to children (although ith last year’s £20
UC increase, they just reach the level of the cap). If they are paying a private rent, on the other hand,
they are highly likely to hit the cap. Figures 5 and 6 illustrate both scenarios for an out-of-ork couple
ith to children. Even ith the modest private rent shon (based on loer-quartile rents in a lo-cost
region, the East Midlands), disposable income is reduced by £40 a eek, leaving the family ith only 51%
of the disposable income they need to reach MIS.
More generally, it should be noted that most of the calculations of disposable income as a percentage of
MIS reported in this and the previous section have declined slightly since pril 2020 (hen UC as
increased by £20), indicating a decline in the adequacy of these incomes. For example, the percentage of
MIS provided by orking-age benefits has fallen by about one percentage point, continuing a long-term
decline in the UC rates (not including last year’s £20 increase; see ppendix 1, Table 5). This is the result
of UC and benefits being uprated by only 0.5% in pril 2021, as a result of being based on the inflation
rate the previous September, hereas by pril, the CPI had risen to 1.5%. hile these mismatches
beteen the timings of benefit rises and price rises should not have a significant long-term impact, the
return of inflation creates ne vulnerabilities among those living on lo incomes, particularly here the
price of essentials rises faster than general inflation. For families ith children, this has already occurred
in 2021, hen the high increase in petrol prices caused budgets for families ith children to rise by
around 2.5%, faster than the CPI overall. (MIS upratings apply inflation rates for each CPI expenditure
category to corresponding areas of the budgets, rather than using the overall CPI inflation rate.)
Figure 5: An out-of-work couple with two children paying a social rent of £93 a week only
just reaches the Benefit Cap, and ends up with 59% of the disposable income they need
13Figure 6: For the same family as in Figure 5 with a modest private rent of £134 a week, the
Benefit Cap reduces disposable income by £41 a week, to only 51% of the MIS budget
Pensioners
In terms of guaranteed income through the benefit system, pensioners fare better than orking-age
adults ith or ithout children, ith a greater proportion of their income relative to MIS covered. s a
baseline, the Pension Credit tops up income to a guaranteed level, hich combined ith the universal
inter Fuel lloance brings pensioner income to only slightly belo the MIS level. Hoever, to get to
the full MIS level, it is not sufficient to have a small amount of pension to supplement Pension Credit. This
is because the Pension Credit is generally ithdran pound for pound as pension income rises (an
exception is older pensioners still benefiting from the Savings Credit, hich is being phased out). In other
ords, if Pension Credit brings someone’s income to £10 a eek belo MIS, but that person has £10 a
eek in pension income, they ill still be £10 belo MIS, because their Pension Credit entitlement ill be
reduced by that amount.
This means that to achieve incomes above MIS, people need pension incomes equivalent to an amount
slightly above the Pension Credit level. For those ho do not on their homes, this must also be enough
to cover rent, taking account of the fact that Housing Benefit and Council Tax Support also start to be
ithdran above the Pension Credit level. (The MIS calculations shon here assume a baseline case of
paying an average social rent). The ne single-tier pension makes it easier to achieve this, by paying
eligible pensioners ith full contribution records an amount similar to the Pension Credit level, and
therefore creating a nearly-adequate income that can be supplemented ith a ork or private pension,
or savings income, ithout a means test that ithdras this additional income pound for pound by
reducing benefits if they receive income from elsehere.
These results are shon in Figure 7. Pensioners are guaranteed an income that falls slightly short of MIS.
The gap is greater for a couple, but if both receive the full state pension, the gap becomes very small.
single pensioner can reach the full MIS level ith pension income of £12,800 a year, of hich a full
state pension can potentially provide £9,400, requiring an additional £3,400 in private or occupational
pension, or savings income, to top this up. Tapering of Housing Benefit and Council Tax Support still
means much of this extra income is claed back, but since the total top-up required is lo, it does not
take a very large additional pension to reach MIS. For a couple here both have a full state pension, each
ould require an additional £1,100 a year in pension or savings income to reach MIS.
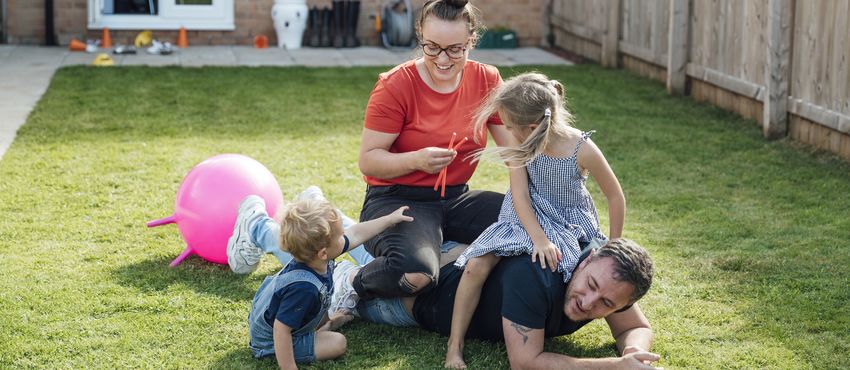
14Figure 7: Weekly disposable income on Pension Credit and full state pension, compared to
MIS: single pensioner (top), couple pensioner (bottom)
Note: Full state pension is £9,400 a year per person – to reach MIS, a single pensioner requires a gross income of £12,800; each
couple pensioner requires a gross income of £10,500.
154 COVID-19 and public views of a
minimum living standard in 2021
The last MIS research consulting members of public as completed in early 2020 (Davis et al, 2020). The
final group took place the day before the orld Health Organization declared COVID-19 a pandemic.
Since then, people have experienced changes and challenges in multiple dimensions of everyday life, as
lockdons and restrictions have been imposed and lifted. hile the next MIS research is not due until
2022, this year e held additional groups to start to consider the impact of the pandemic. Their aim as
to capture people’s reflections after a year of COVID-19, and explore hether and to hat extent it had
changed their perceptions of hat is needed for a minimum socially acceptable standard of living in the
UK.
e held nine online discussion groups during pril and May 2021; three ith orking-age adults ithout
children, three ith parents and three ith pensioners. Each group lasted three hours and comprised
beteen six and eight people from a range of backgrounds, housing tenures and income sources
(ork/pension and/or benefits). Participants ere recruited by a professional recruitment company,
selected by household type and geographic region as shon belo.
Table 3: Participants by household type and geographic region
Working-age adults Parents Pensioners
North East England North England est Midlands
ales Scotland North est England
Northern Ireland South est England South East England
Participants revieed the lists of items required for a minimum socially acceptable standard of living
agreed by groups in 2020, and e asked if any of these should be changed to reflect different
expectations or needs resulting from the pandemic. The discussions ere recorded, transcribed and
thematically analysed to identify similarities and differences beteen the demographic groups, and
capture the range of experiences and opinions.
Groups identified and considered various items through the lens of the pandemic, reaching consensus for
the most part about the areas of expenditure in hich the pandemic as likely to have an impact on the
cost of a minimum budget going forard. Some budget elements ere discussed and agreed to be
unlikely to change in future MIS research, either because changes ere likely to be temporary, or
because they had been experienced during earlier phases of lockdon but had since reverted to ‘normal’
levels. In other cases, although people’s access to goods or services had been limited over the past year,
the need for them as not considered to have changed. The examples included belo illustrate the kinds
of conversation and deliberation that groups undertook.
Participants reflected in particular on four questions, under hich e report on their discussions belo:
• hat had they missed most during the pandemic?
• hat changes had been brought about by COVID-19?
• Did they think these ere likely to continue in the future?
• Had there been any effect on ho people thought about financial stability and security?
16What have people missed most during the pandemic?
Social contact
The constraints on social contact had been idely experienced and keenly felt across all groups.
Participants talked about not being able to see family and friends in person. Important family occasions
and visits to see relatives in other countries had been postponed indefinitely.
lthough technology had offered some people a ay of keeping in touch, groups agreed that this as
not an adequate substitute.
Man: “I mean to quote my mother, she hasn’t been able to see my to sisters or her
daughters for some time … and she turned around the other day and she said
‘Christ, I even miss arguing ith them’. “
[laughing]
Researcher: Is she not arguing ith them online?
Man: No, it is not the same she said.
oman 1: For me it is social contact has been the biggest loss.
oman 2: Yes, meeting people, socialising.
oman 1: For me it has been holidays, eekends aay, dating, going to church all things
outside of the house, getting out of the house … luckily, I am not a depressive
type of person, but I am surrounded by people ho are really, really depressed
at the moment and they have also lost the ability to ant to go out.
oman 2: I just miss my grandchildren and going places ith them.
Pensioners group
Choices
common theme that emerged from the discussions as that people missed having the range of choices
and opportunities that they had had before lockdons and restrictions on, for example, social contact
and movement. This as expressed in terms of missing freedom and spontaneity in ho, here and ith
hom they could spend their free time.
oman 1: “My nan passed aay ith [COVID-19], I couldn’t go to her funeral, that as
really difficult for me, very, very difficult. So I kno you say hat have e
missed, but that to me as a massive part of my life I missed out here I
couldn’t take part in that. Basically social interaction ith other people… for me
there’s quite a bit I’ve missed out on.”
oman 2: “Yeah, it’s like no you’ve got to plan your journey or everything, in terms of
hether you’ve got a mask on, hat ay they sanitise it, hether there’s social
distancing, you just can’t be spontaneous anymore, you’ve actually got to plan
the outings, hich takes the fun out of it.”
Parents group
What changes have been brought about by COVID-19?
Changes to working life
The pandemic’s effects on orking life ere diverse and often dependent on the nature of an individual’s
employment. People talked about having to adapt to a changing situation. Some had found themselves
making difficult choices for pragmatic reasons.
17oman: “Even though both of our jobs fortunately have been fine, I as actually on
maternity leave, I’ve really just gone back in the last fe months; e felt like
both of our choices ere limited in a ay. My husband, he’s been orking from
home and his job’s OK, he orks for a drinks company, but … before all this,
e’d been talking about him maybe going for another job but he’s just … it’s this
hole thing of, right your job’s safe, there’s no point, you kno, taking a risk,
mainly because there’s not that many opportunities out there. lso for me, I
decided to go back part time but a lot of childcare options ere totally limited
as ell because nurseries ere obviously shut. They’ve also … a lot of them
aren’t doing half-days anymore, so that as like a factor in our decision-making
process … thankfully e do have grandparents ho are, like, looking after our
son, but it did mean that I basically had to go back the certain amount of days
that I’ve gone back.”
Man: “I started off, I as a contractor ith the company I’m currently ith no, and I
as … ell it as November 2020 I as told my contract as due to cease and
having looked at the sort of job boards and speaking to agents, I think generally
the job market across the board as pretty flat for obvious reasons, and I think
for me there as a lot of uncertainty there, and the opportunity came to go
permanent or apply for a permanent role ith the company I’m currently ith,
and I as very fortunate to get the role. The flip side of that as that my
earnings, and again I’m not trying to sound ungrateful in the slightest, I as, you
kno, very grateful, but my earnings ent don by 25%, hich, you kno,
played a major impact on day-to-day living. So in professional terms it’s had a
major impact, and obviously that’s affected me personally because of the
financials as ell.”
Parents group
The sudden disappearance of seasonal ork, ith festivals and live events cancelled, and the
corresponding effects of travel restrictions on the hospitality industry, had taken their toll on people
orking in those sectors. Those ho ere self-employed reported finding the situation extremely
stressful, ith little or no business and no certainty about hen or ho they ould recover, although this
varied across different roles and occupations.
orking-age adult groups discussed the practicalities of orking from home. They agreed that if
additional equipment (laptop, monitor, headset, etc.) as essential, that the cost should be met by the
employer, although people’s experiences of the adequacy or availability of resources varied significantly.
oman: “I’ve got a really old laptop ith my job, hich is very difficult. I tried to log onto
it today just before this and the hole thing ent black. Like it stopped orking
and that’s been supplied by my employer.”
Researcher: “So in that situation, can I just ask then, hat do you do? re you able to go
back to them and say, ‘This isn’t fit for purpose’?”
oman: “Yes, but e’ve been aiting for months. I ork for a charity and ... I’ve been
aiting since Christmas to get a ne one. e ere commissioned by the
council to [purchase ne equipment] back in December, so e are aiting and
[the computers] are there but e haven’t got them as yet.”
orking-age adults ithout children group
Hoever, there ere also positive experiences. Some had flourished: one self-employed participant had
moved the location of their business from a commercial property to their on home, saving them money
on overheads, and their partner had successfully moved his personal training business online. Others had
found that orking from home had advantages.
18“hat I’ve actually valued is time back ith the kids and that’s been orking from home.
That’s been challenging in its on right but still, orking from home, so you kno as soon as
I’ve logged off, I’m at home. I don’t have a commute, I’m there ith the children, I can
dedicate my time, I get a lot of … you kno, I get probably [at] least to hours back a day
from the commute … The kids’ clubs [being shut] it’s a shame because, you kno, they’re
missing out on interaction ith others, the fun and the exercise, and that type of scenario.
But on the flip side of that, it’s been quite positive because [it used to be] come the
eekend, right, e need to be there … e need to be there Saturday morning to do this and
then e need … on Sunday morning e need to get up early to do this and go take the kids
simming. So it’s been a lot more relaxed and a lot more … yeah, e’ve had a lot more
freedom.”
Man, Parents group
Travel to ork as one area here the kinds of job people did had the potential to make a significant
difference in ho they lived day to day and the costs they incurred. For several respondents, not having
to commute every day had resulted in a reduction in costs, hereas key orkers ho had continued to
ork throughout the pandemic had not had the same potential savings on transport.
oman 1: “I’ve found I’ve definitely spent less on transport … I used the car every day
hen I as going to ork and no I’m not going as far and I’m maybe only
using my car tice a eek. My expenditure on transport has really reduced
drastically, but I ouldn’t say I’m spending that money on anything else.”
oman 2: “I’ve definitely saved on transport over the last year. I ould normally have a
tunnel toll and at the moment I’m paying that tice a eek instead of five times
a eek and that makes a huge, huge difference.”
orking-age adults ithout children group
Some participants suggested that ‘blended’ or ‘hybrid’ orking as likely to continue at least for the
foreseeable future, if not indefinitely.
“I ork in an office but I've been told that because of the success of orking from home,
that they're no going to possibly change the contract so that e have an option to ork
more often from home. Even if lockdon ends. So that they're going to close the office
don, maybe just make a hub in the ton so I can just go and get things done, but I don’t
necessarily have to travel to ork hich means that I ould normally pay £60 a month for
my bus fare that ould be the monthly ticket. I don’t need to do that so I on't need that
from no on.”
Man, orking-age adults ithout children group
Groups agreed that spending more time at home, either on furlough or orking, as likely to have
affected spending on lighting, heating and cooking, especially during the cold eather and shorter
daylight hours of inter.
Financial stability and security
Some people said that as they had reduced some areas of everyday spending (for example, by not going
out, not going on holiday and not travelling to ork), they had saved money. Others found that this kind
of reduction in spending had not resulted in an increase in savings because the money had been spent
‘elsehere’. Previous evidence (Hill and ebber, 2021) shos that lo-income families in particular have
seen additional spending pressures. Living ith the constraints and uncertainty caused by COVID-19 had
increased some people’s aareness of financial precarity, and this had affected ho they felt about their
finances.
19Man: “I’ve seen my mates ho thought they ere in the most secure jobs out of all
of us and they’re the ones that are out of it, so it shos that it could hit anyone
at any time and, you kno, some companies have gone under pretty quickly.”
oman: “I kno a lot of people ho are nervous about their job and they’re just using
the phrase ‘I’m just keeping my head don’, you kno they don’t ant to be
noticed and put at risk because they kno ho difficult it ill be to get another
job in this climate. e kno that there’s loads of people out of ork. e had a
job last eek that e advertised and e had 70 applicants for it in one day, and
there’s just aful stories of people ho’ve been made redundant and ho are
desperate for ork, and I think it just makes people feel very nervous and
concerned about ho precarious their position might be in the future.”
orking-age adults ithout children group
Access to goods and services
Each group discussed perceptions of changes in ho people accessed goods and services. This included,
but as not limited to, buying groceries, household goods and clothing. It also included positive and
negative experiences of accessing health and personal care services, and alternatives to pre-pandemic
leisure services, such as going to the gym or eating out.
The pre-pandemic MIS 2020 budgets included the cost of mideek supermarket deliveries for orking-
age couples ithout children, as they said it ould be harder for them to get a eekly shop for to
people home on the bus. In pril 2020 this as priced at £3.49 a month for a 12-month subscription
ith unlimited deliveries Tuesday–Thursday (minimum spend £40). Pensioners in 2020 agreed that they
preferred to shop in person, and ould go more frequently throughout the eek, so ould be able to
manage this ith public transport. Parents’ budgets include a second-hand car per household, hich
ould be used to bring shopping home.
The 2021 groups discussed hether households should have the choice to have their groceries
delivered. Participants ere aare that the cost of this service had significantly increased during the
pandemic, oing to higher demand, and that at the start of lockdon it had been very difficult to book a
delivery slot. Furthermore, because of lo stocks, there ere accounts of people only receiving a small
proportion of the goods they had ordered. s the restrictions lifted, and the levels of supply and demand
in supermarkets returned to a more stable level, it had been easier to access this service. Pensioners and
orking-age adults ithout children felt that people should be able to have their eekly grocery
shopping delivered if they chose to.
For the most part, this related to concerns about staying safe, and the risk of catching or transmitting the
virus hen visiting busy supermarkets. People also felt that if this had become a regular practice over the
last year, people might have come to rely on the convenience and time-saving that it offered. The
parents groups agreed that driving to the supermarket and bringing the shopping home in the car ould
still meet parents’ needs, so didn’t feel that grocery delivery costs should be added to those households’
budgets.
People discussed having more takeaays and food deliveries, particularly in the first lockdon in 2020,
although for some the novelty of this had orn off. There as a particular emphasis on supporting local
businesses, and several groups talked about purchasing food from neighbourhood restaurants or cafés
that ould not previously have offered takeaays, to assist their local hospitality businesses during
lockdons. There as also shared experience for some of doing more cooking from scratch, partly from
necessity and partly because people had more time available. For some households, cooking had become
a family activity.
“I’m cooking a lot at home no and a lot ith my children as ell. I think they like to interact
ith like, you kno, helping out in the kitchen, even ashing the dishes, my youngest one
said like, you kno, I’ll even ash dishes for you. But yeah, it’s good interaction, you kno,
beteen the parents and the children.”
Man, Parents group
20Discussions around changes relating to shopping centred around the rise of online retail, hich most
people seemed to feel as inevitable and had been precipitated by the pandemic, coupled ith the likely
further decline of the high street. Many people had been reliant on online shopping hile non-essential
shops had been closed for long periods of time.
“I think there ould be more postage and delivery because no most people are buying
online. For myself, like even groceries, you kno I’m buying online, I’ve not been out to a
shop for quite a number of eeks no. nd clothes-ise, you kno because all the shops
have been closed, you kno the children’s clothes, again, that’s being done online as ell. So
most people are no, you kno, going toards the online option no.”
Man, Parents group
t the time the focus groups took place, some of the restrictions preventing non-essential retail opening
had been lifted, but some people felt that they ere likely to continue to order goods online due to
changes in the retail experience, and also because of health concerns.
“I used to love shopping, it as just a really good experience, just going out and you kno
hanging out ith some friends, trying stuff on, it as just a really nice experience. nd then I
ent once everything as opened again and I felt it as like extremely, extremely stressful
and I’m not going to be going back! I just … I’m going to be sticking to kind of online. It’s just
the queues, the mask and just like … it as just … just too much. So I think for myself, I’ll be
sticking to online shopping.”
oman, Parents group
Conversely, some people said that the pandemic had caused them to shop more locally to support small
businesses and independent traders, and to use family-run businesses rather than chain stores. There
ere accounts of both giving and receiving this kind of support.
“In my area there is a lot of local businesses offering this no and I think it is important as
ell in this time to try and support these local businesses, so a lot of the local cafés that
haven’t been able to open have been doing this delivery service hich has been great, I
think.”
Man, Pensioners group
“I think hen all this happened last year, things changed so drastically … I as running our
on shop, and the landlord asn’t very understanding, so the rent obviously had to be paid,
so e had no choice but to give the keys back and to close the shop. So the first eek into
everything as extremely stressful because obviously e’ve got three kids and a lot to do. I
come from kind of a coffee shop background … so I started baking from home basically and
the response that I got from my local community as absolutely amazing.”
oman, Parents group
Opinions varied on hether the amount allocated for postage and delivery costs ould need to be
increased to enable people to access goods ithout being reliant on in-person shopping, and this ill be
further explored in MIS 2022 groups.
Some people had changed the ay they exercised, for example accessing online orkouts from home
and buying exercise equipment to support their attempts to replace the classes and gyms they ould
have been attending under normal circumstances. Others talked about going for more alks and
exploring their local area.
Seeing an optician had not been problematic during this period, but it had been more difficult to access
dental treatment, ith reports of practices only being prepared to see patients if they ere experiencing
pain. Some had also had difficulty getting appointments ith their GP, and had not been able to access
other medical services such as physiotherapy. Conversely, others remarked on the fact that they found
the system of phone and online GP appointments more efficient and thought that this might continue
beyond the pandemic.
Groups considered the budgets for hairdressing carefully, ith several accounts of prices having
increased since lockdon. For the most part, people thought the relatively small increases ere
21You can also read