COVID-19 BCG Perspectives - Future of Cities - Boston Consulting Group

Page created by Felix Gibbs
 
CONTINUE READING
COVID-19 BCG Perspectives - Future of Cities - Boston Consulting Group
October 2020
                                        Future of Cities
                                                                                                                 COVID-19
                                                                   Facts, scenarios, and actions for leaders
                                                                                                     BCG Perspectives

Copyright © 2020 by Boston Consulting Group. All rights reserved. Updated 29 October 2020 Version 18.1
COVID-19 BCG Perspectives - Future of Cities - Boston Consulting Group
COVID-19
       BCG Perspectives
       Objectives of this document

                                                                                                                                Copyright © 2020 by Boston Consulting Group. All rights reserved. Updated 29 October 2020 Version 18.1
       COVID-19 is a global                                   Leaders need to drive an integrated
       societal crisis                                        response to navigate the crisis

       We at BCG believe that the COVID-19 outbreak is        It is the duty of health, political, societal, and business
       first and foremost a societal crisis, threatening      leaders to navigate through this crisis. A complex
       lives and the well-being of our global community.      interplay of epidemic progression, medical response,
       Society now, more than ever, needs to collaborate      government action, sector impact, and company
       to protect people’s lives and health, manage mid-      action is playing out. This document intends to help
       term implications, and search for lasting solutions.   leaders find answers and shape opinions to navigate
                                                              the crisis in their own environments. It encourages
                                                              thinking across the multiple time horizons over which
                                                              we see the crisis manifesting itself.

Source: BCG                                                                                                                 1
COVID-19 BCG Perspectives - Future of Cities - Boston Consulting Group
The COVID-19 recovery will be driven by disease progression, de-averaged
economic impact, government policies, and business and public responses

                      Flatten                                              Fight                                               Future

Typically in the initial phase after a pandemic      Finding paths to collectively fight the virus,         Disease controlled through vaccine/cure/
outbreak, the goal is to urgently limit the number   restart the economy, and support society in            herd immunity and treatment within

                                                                                                                                                              Copyright © 2020 by Boston Consulting Group. All rights reserved. Updated 29 October 2020 Version 18.1
of new cases, especially critical care               balancing lives and livelihood                         sustainable medical capacities possible

Social distancing (lockdown) and partial business    Increasing economic activity with recovering           Reactivated economy with strong business
closures lead to economic recession with a large     GDP, some business reopenings, and social              rebound and job growth, social restrictions
employment impact                                    distancing on a sustainable level                      limited or completely suspended

                                                       1. Disease progression, healthcare system capacity, and response

                                                       2. Government policies and economic stimulus

                                                       3. Economic scenarios

                                                       4. Business engagement and response

                                                       5. Public engagement and response

                 All of the above five factors result in specific economic and social outcomes in each phase
Source: BCG                                                                                                                                               2
COVID-19 BCG Perspectives - Future of Cities - Boston Consulting Group
Summary snapshot | Restart progression at a glance
As of 26 Oct 2020

                        Epidemic Progression                                                                                                Consumer Activity                                                                                                 Business Impact
   Global epidemic snapshot                                                                                        Mobility                                                                                                        Stock market performance
   43.5M                        424K                    13.1M                      1.2M                                                                                    Jul            Aug           Sep                        Month end vs. 02 Jan '20                                Jul            Aug           Sep
        # of                     # of                      # of                      # of                          Mobility7                      US                      -19%           -19%           -20%
                                                                                                                                                                                                                                   S&P500                                                   0%              7%            3%
       cases                 daily cases1              active cases               fatalities                       (month vs. Jan
                                                                                                                                                  Europe                  -17%           -17%           -14%
                                                                                                                   '20)                                                                                                            FTSE100                                                -22%            -22%          -23%

                                                                                                                                                                                                                                                                                                                                         Copyright © 2020 by Boston Consulting Group. All rights reserved. Updated 29 October 2020 Version 18.1
                                                   July         Aug           Sep         Oct4                                                    Japan                   -13%           -14%           -11%
                                                                                                                                                                                                                                   CHN SSE                                                  7%             10%            4%
  Month-on-              Americas                  1.7x         1.0x         0.8x          1.1x
  month                                                                                                                                           US                      -76%           -68%           -64%                       Volatility Index (S&P500)12                             2.0x            2.1x          2.1x
                         Europe                    1.0x         1.7x         1.9x          2.8x                    Domestic air
  growth of                                                                                                        travel tickets                 UK                      -86%           -86%           -84%
  new cases2             Asia3                     1.7x         1.4x         1.3x          0.9x                    booking8 (YoY)                                                                                                  International trade
                                                                                                                                                  China                   -27%            -8%            -1%

                             Economic Impact                                                                       Sales                                                                                                           Trade value13                    US                    -11%           -11%            -8%
                                                                                                                                                                                                                                   (YoY)                            UK                    -19%           -16%            -8%
                                                                IMF (07 Oct)            Banks5
                                                                                                                   Retail goods       US                                    9%             8%            10%
   GDP forecasts (%)                                                                                                                                                                                                                                                China                   3%             3%             4%
                                                                                                                   sales9 (excl. auto UK                                    3%             4%
   2020                   -10 -8 -6 -4 -2 0 2 4 6                               8 10                               & fuel, YoY)
                                                                                                                                      China                                -2%            -1%             2%
                            -8.3%      Baseline6 1.3%                                                                                                                                                                              Industrial production
   Europe
                                                                                                                   Passenger                      US                      -19%           -27%            -4%
                                        -4.3%               2.0%
                                                                                                                   vehicle sales10                                                                                                 Purchasing                       US                      51             53              53
   US                                                                                                                                             Europe                    0%            -2%
                                                                                                                   (YoY)                                                                                                           manager’s                        EU                      52             52              54
                                     -5.8%              0.7%                                                                                      China                     9%             6%             8%                       index14
   Japan                                                                                                                                                                                                                                                            China                   51             51              51
                                                                                                                                                                                                                                   (base = 50)
                                                           1.9%        6.0%                                        Hotel                          US                      -36%           -32%           -28%
   China                                                                                                           occupancy11
                      -10.3%                                           5.8%                                                                       Europe                  -66%           -45%           -52%
                                                                                                                   (YoY)                                                                                                           Steel production (YoY)15                                -3%             0%              3%
   India                                                                                                                                          China                   -19%           -12%

                                                                                                                                                                                                                                                                             To be updated in forthcoming editions
1. Calculated as 7-day rolling average; 2. Calculated as monthly average of daily cases vs. previous month; 3. Includes Middle East and Oceania; 4. As of 26 October 2020; 5. For India, forecast is for financial year; for others, it is for calendar year; YoY forecasts; range from forecasts (where available) of World Bank;
International Monetary Fund; JP Morgan Chase; Morgan Stanley; Bank of America; Fitch Solutions; Credit Suisse; Danske Bank; ING Group; HSBC; as of reports dated 08 June 2020 to 16 Oct 2020; for India's GDP forecast, World Bank's 2020 forecast from 08 June provides the upper bound of the forecast range; 6. IMF Jan
2020 forecast; 7. Mobility values are calculated as the average of mean monthly mobilities in workplace, public transit, retail & recreation, and grocery & pharmacy and compared to a baseline from 03 Jan – 06 Feb 2020; Europe mobility values are calculated as the average of Germany, France, UK, Spain, and Italy; 8.
Calculated as change in last 14 days rolling average value as compared to same period last year; 9. Retail goods sales include online & offline sales and comprise food & beverages, apparel, cosmetics & personal care, home appliances, general merchandise, building material; do not include auto, fuel & food services; 10.
Figures represent passenger vehicle (including sedan, hatchback, SUV, MPV, van and pickup) sales data for 2020 over same month in 2019; Europe value calculated as cumulative sales in Germany, France, UK, Spain, and Italy; 11. Calculated as average occupancy rates compared to same month of previous year; 12.                 3
Underlying data is from Chicago Board Options Exchange Volatility Index (VIX); Volatility Index is a real-time market index that represents the market's expectation of 30-day forward-looking volatility and provides a measure of market risk and investors' sentiments; 13. Calculated as sum of imports and exports, measured
in USD and compared to previous year period; 14. PMI (Purchasing Manager's Index) is a diffusion index that summarizes whether market conditions, as viewed by purchasing managers, are expanding (>50), staying the same (50), or contracting (
COVID-19 BCG Perspectives - Future of Cities - Boston Consulting Group
Executive Summary | COVID-19 BCG Perspectives

Cities hit hard by the COVID-19 pandemic; governments taking action to contain the damage and build a pathway towards a stronger future
 • While cities are witnessing higher case numbers and GDP loss than the world at-large, severity varies significantly across cities
 • Cities are dealing with multiple challenges arising from the pandemic such as constrained budgets, people exodus, and business closures
 • Governments are taking action to support vulnerable communities, small & local businesses as well as large enterprises via incentives & deregulation
 • Evidence from past crises highlights that cities transform and emerge stronger; multiple cities have started acting toward a stronger future
 • Business leaders should consider six strategic actions now: (i) reimagine workplace & talent footprint; (ii) rethink retail & distribution strategy; (iii) respond to

                                                                                                                                                                                                                                                      Copyright © 2020 by Boston Consulting Group. All rights reserved. Updated 29 October 2020 Version 18.1
     'new' customer preferences; (iv) enter & grow into adjacencies; (v) participate in building an equitable city; (vi) leverage partnership opportunities
 • Public leaders should recraft action agenda: (i) upgrade strategic vision; (ii) rethink citizen's engagement; (iii) review mega projects; (iv) modernize operations

Severe global economic downturn expected to continue for 2020 driven by resurgence in COVID-19 cases across multiple countries
 • Several countries (France, Netherlands, Spain, UK, US, Russia, Canada) witnessing resurgence with cases exceeding historic peaks
 • Many countries are returning to severe restrictions or even partial lockdowns in the light of latest resurgence of cases
 • 10 vaccine candidates already in Phase III; some may get emergency use authorization (EUA) starting in Q4 20201; multiple promising therapeutics in trials
 • For most leading economies, forecasts indicate a rebound to 2019 GDP levels only by end of 2021
 • 5 (out of 24) sectors2 are currently above pre-crisis TSR3 levels; 6 sectors have a significant share4 of companies with >15% default risk

        We believe during                                                       Taking an integrated perspective on                                                                       Thinking multi-
        this crisis leaders                                                     health/medical progression,                                                                               timescale in a
        need to think along                                                     governmental responses, societal                                                                          Flatten-Fight-Future
        two dimensions:                                                         reactions, and economic implications                                                                      logic
                                                                                to understand business/sector impacts

1. Initial data observed in the early stages of phase 3 trials may lead to restricted approvals starting in Q4 2020; 2. Semiconductors, Retailing, Household products and Materials; 3. TSR: Total Shareholder Return; 4. Retailing, Materials,   4
Auto, Transport, Hospitality, Real estate and Energy are sectors with > 10% of companies with probability of default > 15%;
COVID-19 BCG Perspectives - Future of Cities - Boston Consulting Group
Guide for Leaders

                                                               Copyright © 2020 by Boston Consulting Group. All rights reserved. Updated 29 October 2020 Version 18.1
COVID-19 impact on cities and current actions
Outlook on future of cities and implications for leaders

Updated Analyses and Impact
Epidemic progression and virus monitoring
Economic and business impact

                                                           5
COVID-19 BCG Perspectives - Future of Cities - Boston Consulting Group
Questions on business and public leaders’ minds about cities
                                                                                                               Non-Exhaustive
                                • Have all cities been impacted in the same way?
1      What has been the
       impact of COVID-19       • Is there a correlation between the health and economic impact on cities?
       on cities?               • What actions have cities taken to alleviate the impact of the socio-economic crisis
                                  prompted by COVID-19?

                                                                                                                                Copyright © 2020 by Boston Consulting Group. All rights reserved. Updated 29 October 2020 Version 18.1
2       Will there be a         • Will COVID-19 lead to degrowth in cities -- citizens migrating away?
        reversal of the         • How will changes differ around the world? (E.g. emerging vs. developed countries)
        urbanization trend?     • How should leaders think about their workplace and talent footprint given the trends?

                                • What kind of trends have past pandemics triggered in cities?
3       What will the future
        city look like & what   • What trends are likely to continue, accelerate and shape the future?
        will the implications   • How should business leaders re-think their operating model and participate in new
        be for business &         emerging opportunities?
        public leaders?         • How should public leaders now think about livability and its implications?

Source: BCG
                                                                                                                            6
COVID-19 BCG Perspectives - Future of Cities - Boston Consulting Group
Cities, powerhouses of the world, are most impacted by COVID-19
As of 15 Oct 2020

Cities pivotal to economic activity,                                      COVID-19 impact witnessed more                                             Many facing resurgence, potentially
with majority of world population                                         severely than world at large                                               impacting economic activity further

  Importance of cities (2020 data)                                            Total impact on capital cities of                                           Current resurgence in capital cities

                                                                                                                                                                                                                           Copyright © 2020 by Boston Consulting Group. All rights reserved. Updated 29 October 2020 Version 18.1
                                                                              top 30 countries (by GDP)1                                                  of top 30 countries (by GDP)1

    ~55%                                                                            ~2x                                                                    ~45%
                                     Of global                                                             Cases per million2                                                          Cities witnessing
                                     population                                                            in cities vs. world                                                         resurgence in
                                     lives in cities                                                       average                                                                     COVID-19 cases4

    ~80%                                                                        ~1.5x                                                                      ~40%
                                     Of global                                                             Higher % GDP loss3                                                          Cities re-imposed
                                     GDP generated                                                         expected in cities                                                          partial lockdown or
                                     by cities                                                             vs. world in 2020                                                           tighter restrictions5

1. Includes: Washington D.C., Beijing, Tokyo, Berlin, Delhi, London, Paris, Rome, Brasilia, Ottawa, Moscow, Seoul, Madrid, Canberra, Mexico, Jakarta, Amsterdam, Riyadh, Ankara, Bern, Warsaw, Taipei,
Stockholm, Brussels, Bangkok, Buenos Aires, Abuja, Tehran, Vienna, Abu Dhabi; 2. As of 15th October 2020, cases per million in top 30 capital cities (Data not available for Taipei, Ankara) of ~12,000 vs ~6,000
cases per million world average ; 3. Average GDP loss of ~6% in top 30 capital cities vs ~4% in the world expected for 2020; top 30 cities (data not available for Brasilia, Canberra, Bern) expect a fall in GDP of
~$308 billion while the world expects a fall in GDP of $3.6 trillion; 4. 13/30 cities facing resurgence - Berlin, Delhi, London, Ottawa, Moscow, Madrid, Amsterdam, Ankara, Bern, Stockholm, Brussels, Tehran,
Vienna; 5. 12/30 facing partial lockdown or tighter restrictions – Berlin, London, Paris, Rome, Ottawa, Madrid, Jakarta, Amsterdam, Brussels, Buenos Aires, Tehran, Abu Dhabi; Source: Official regional               7
databases; Oxford Economics; World Bank; BCG
COVID-19 BCG Perspectives - Future of Cities - Boston Consulting Group
Severity of disease spread and economic impact varies across cities
As of 15 Oct 2020                                                                                                                                                                                      Non-Exhaustive

Infection spread and economic impact across major1 cities                                                                                                           Example: Challenges faced by NYC

  Expected GDP change                                                                                                City-set      City-set
  (2020 vs 2019)
                                                                                                                                                                                       Constrained city
                                                                                                                     average2      median3
                                                                                                                     15,000        10,000                                              budgets
                                                                                                                                               Beijing
  Growth 2%

                                                                                                                                                                                                                          Copyright © 2020 by Boston Consulting Group. All rights reserved. Updated 29 October 2020 Version 18.1
                                                                                                                                                         Shanghai
                                                                                                                                                                     Budget deficit: NYC facing deficit of
                                        0%                                                                                                     Tianjin               approximately $9 billion
  Rates improving from bottom to top

                                                                                                                                               Seoul
                                                                                                  Washington DC                     Jakarta         Abuja
                                       -2%    World avg.
                                                                                                                     Stockholm Ottawa Warsaw
                                                -4%
                                       -4%                                                Moscow    Los Angeles
                                                                                                             New York (NYC) Chicago        Lagos                                       Exodus from big
                                                 São Paulo                                                                  Vienna                                                     cities
                                       -6%                                                    Bangalore               Amsterdam Berlin       Tokyo Bangkok
                                                                                                           London                        Osaka
                                                       Abu Dhabi                                                       Kolkata                                       Companies, people fleeing cities:
                                                                                                                                   Riyadh
                                       -8%                                                 Brussels          Delhi Mexico                                            >110K residents moving out of NYC
                                                                                                      Mumbai                             Rome Manila                 post COVID-19, 5X 2019 level
                                                                                                                                   Paris
                                       -10%
                                                               Madrid
                                                                                                                                              Tehran
                                       -12%
                                               Buenos Aires                       Lima                                                                                                 Small businesses
       -14%                                                                                                                                       //                                   threatened
          50,000                                               40,000              30,000               20,000                  10,000                   0
De-growth
                                                                                                                                                                     50% of bars & restaurants might
                                                           Cumulative number of cases per million population
                                                                                                                                                                     have to close for good in NYC alone –
                                                           North America   Asia          Europe      South America        Africa                                     150K jobs threatened

1. Major cities includes a combination of top 30 cities by population and capital cities of top 30 countries by GDP. Data not included for Bern, Brasilia, Canberra, Dhaka, Karachi, Rio de Janeiro, Lahore, Wuhan,
Bogota, Ankara, Taipei, Cairo, Istanbul, Kinshasa; 2. Avg. cases/M population (major city average); 3. Median cases/M population (major city median)
Source: Official regional databases; Oxford Economics; BCG                                                                                                                                                            8
COVID-19 BCG Perspectives - Future of Cities - Boston Consulting Group
Within cities, inequitable impact correlated with socio-economic disparity
                                                                                                                                                                           US Example

20 of Top 25 most impacted1 New York City (NYC) ZIP                                                     Service industries (with low remote potential) impacted
codes are in low-income communities                                                                     severely by COVID-19 facing higher unemployment…
            e.g. Morris Park                                                                            Change in New York City employment in %, Sep'2020 vs. Sep'2019
                 (Bronx)

                                                                                                                                                                                         Copyright © 2020 by Boston Consulting Group. All rights reserved. Updated 29 October 2020 Version 18.1
             15% below NYC
            median income,                                                                                     Leisure and Hospitality                            -48
           +1.2% poverty rate                                                                                                                                            Limited
                                                                                                                                                                         remote
                                                                                                                Traveler accomodation                            -44
                                                                                                                                                                         working
   e.g. Upper East                                                                                                                                                       potential
  Side (Manhattan)
   91% above NYC                                                                                            Food & Drinking Services                             -43
   median income,
  -11% poverty level                                                                                              Professional Services               -12                Higher
                                                                     e.g. Borough Park                                                                                   remote
                                                                         (Brooklyn)                                                                                      working
                                                                       25% below NYC
                                                                                                                     Financial Activities            -5
                                                                                                                                                                         potential
                                                                      median income,
                                                                     +12% poverty rate
                                                                                                          …aggravating NYC inequality, since more low-
                                                  Number of COVID-19 cases per 1 000
                                                                                                          income area residents work for these industries
                                                  0    6   11   17   23   28   34   39   45

1. Impact = average daily cases per 100,000 people in the past week as of October 2020
Source: Press research; New York City Department of Health and Mental Hygiene; New York Department of Labor; Citizens' Committee for Children of New York; BCG                       9
Governments taking action to manage the immediate fallout
                                                                                                                                                    Non-Exhaustive

                                                                                                                  …enabled through federal support and
Multiple interventions rolled out across cities globally...                                                       reprofiled city budgets

        Vulnerable & impacted community support                                                                        Utilize federal government support
     • Affordable housing to promote growth, create jobs, and                                           London     1   (e.g. stimulus packages, loans)

                                                                                                                                                                     Copyright © 2020 by Boston Consulting Group. All rights reserved. Updated 29 October 2020 Version 18.1
       improve living conditions
                                                                                                       Santiago
     • Delivery of food & cleaning supplies to the disadvantaged                                       de Chile
     • ~9-month moratorium on evictions on residential rental                                           Seattle
                                                                                                                       Leverage public debt (e.g. issue
                                                                                                                   2   treasury bonds) to improve liquidity
       Small & local business support, especially impacted industries
     • >$40M relief package for food & entertainment industry                                            Sydney
                                                                                                                       Re-prioritize the city's capital
     • Paycheck Protection Program to enable small
       businesses to guarantee 8 weeks of payroll
                                                                                                       New York
                                                                                                                   3   expenditure / investment pool

        Business incentive & deregulation
     • Rent exemption and tax support for enterprises                                                                  Rationalize expenses (e.g. deferred
                                                                                                                   4
                                                                                                       Shanghai
     • Relaxing zoning to enable flexible building use                                                   Madrid
                                                                                                                       wages) and enhance charges (e.g.
                                                                                                                       additional council taxes1)
1. Currently under consideration in London
Source: Press research; United Nations; New York Government; London Government; Victorian Government                                                            10
While the short term is challenging, evidence from past crises suggests that cities
transform and emerge stronger
                                                                                                                                                                                        Non-Exhaustive

Example:                   Changes focused on urban planning and citizen behavior in cities
Spanish Flu
A pandemic that                                                                          • Introduced single-use zoning1 and tenement reforms2
                                Institutionalized land
                                                                                           for improved sanitary conditions and ventilation3
radically altered cities       use & housing reforms                                     • Upgraded and built new sewage system & water lines

                                                                                                                                                                                                                  Copyright © 2020 by Boston Consulting Group. All rights reserved. Updated 29 October 2020 Version 18.1
in the 20th century
                                Re-invigorated open &                                    • Construction of wider, tree-lined boulevards & lush parks
                                         green spaces                                      to improve human and environmental health4

~50M
                                                                                         • Growing automobile ownership (2-4X pre-pandemic level)
                                  Accelerated adoption
                                                                                           supported by social acceptance established through usage
                                         of automobile                                     as ambulances during Spanish Flu5
fatalities across
three waves                                       Emergence of                           • Businesses accepted orders from quarantined or sick
(1918-1919)                                      telecommerce                              customers via telephone6; scaled across population steadily

                               Urban planning                    Citizen behavior                           Cities in focus: London, Melbourne, Paris, Washington, D.C.

                           1. Parts of the city became exclusively r esidential or industrial areas; 2. Reforms for low-income house dwellings; 3. Modernist city planning in Paris sought to build cities and
                           housing full of light and air; 4. Several garden cities constructed after the Spanish Flu, such as St Helier (London) from 1928-36 & Garden City in Victoria, Melbourne from 1926-
                           48; 5. Private-owned automobiles used as motorized ambulances & taxis for healthcare personnel in many U.S. cities (1918/19), U.S. yearly automobile registrations grew ~2X
                           from 1918 to 1922 & ~4x from 1918 to 1928; 6. In Washington, D.C., sick customers phoned in grocery orders during the Spanish Flu
                           Source: Press search; BBC; FHWA; NCBI; UC Davis; BCG
                                                                                                                                                                                                             11
Cities will learn and adapt; multiple pre-existing trends and new considerations
will shape the future city
                                                                                                          Inclusive City:
 Urban Sustainability:                                                                                    • Increased affordable housing
 • Green mobility & public transport                                                                      • Equitable access to key services
 • Open green spaces & vertical farms
 • Low-carbon ecosystem
                                                                                                                                                Resilient Infra & Operations:
                                                                                                                                                • Real-time data tracking &
                                                                                                                                                  surveillance of city operations

                                                                                                                                                                                          Copyright © 2020 by Boston Consulting Group. All rights reserved. Updated 29 October 2020 Version 18.1
                                                                                                                                                • Climate-smart infra: resilient
                                                                                                                                                  to extreme weather changes
                                                                        15-Minute Neighborhood:
                                                                        • Hyperlocal concept using mixed-use
                                                                          real estate & agile infrastructure1
                                                                        • Basic needs within a 15-min radius
                                                                          via walking or micro-mobility

      Digital Public Services:                                                                                                                 Connected Suburban Cities:
      • City services online,                                                             Increased Outdoor Orientation:                       • Stronger digital connection
        with enhanced cybersecurity                                                       • Outdoor & leisure spaces as                          between suburb and main city
      • City uses real-time data for                                                        new city centers; work & other                     • Burgeoning local economy,
        transparent decision-making                                                         activities organized around them                     with availability of key services

Changes in cities will vary depending on their starting point (including extent of municipal services,
type of economic opportunities), COVID-19 impact & response, and city leadership priorities
                                                                                                                                                                                     12
1. Infrastructure that can be easily re-configured for different uses
Many cities have already started to act toward a stronger future
As of 26 Oct 2020

                                Oct 20, 2020                                  Oct 23, 2020                                    Oct 15, 2020                                  Oct 13, 2020

                                                                                                                                                                                                Copyright © 2020 by Boston Consulting Group. All rights reserved. Updated 29 October 2020 Version 18.1
Paris to create a 15-minute city: 'Hyper       London to turn 50% of its urban               First Australian city aims to go carbon-        Singapore investing heavily in high-tech
proximity' with less cars and easy access      environment green by 2050, supported          neutral in 20 years using renewable             farming to become more self-sufficient
to essentials by foot & micro mobility         by Mayor’s £12 million Greener City Fund      energy, shared transport, e-vehicles            and increase food security

                                Oct 19, 2020                                  Oct 18, 2020                                    Oct 25, 2020                                 Oct 20, 2020

Real-time monitoring of environmental          Singapore to enable citizens to access        Lisbon has started leasing empty rental         London releases 2025 vision that mulls
health implemented in Sydney suburb            government agencies, banking services,        apartments and sub-letting as subsidized        outdoor gyms, skateboarding parks,
                                               etc. with quick face scan verification        housing post COVID-19                           pop-up art galleries, etc.

                                                                                                                                                                                           13
Business leaders should craft their action agenda keeping in mind trends
shaping the future of cities

  A           Re-think & Innovate Operating Models                      B    Capitalize on Emerging Opportunities

    1        Re-imagine workplace & talent footprint                    1   Enter and grow into adjacencies

                                                                                                                                          Copyright © 2020 by Boston Consulting Group. All rights reserved. Updated 29 October 2020 Version 18.1
             Re-design workplace, rethink talent strategy, find right       Tap into new “city” opportunities in mobility,
             balance of “type,” location, and size of workplaces            digitization, climate-smart infrastructure, urban food
                                                                            systems, etc.
                                                                        2   Participate in building an equitable city
    2        Re-think retail & distribution strategy                        Take action on city focus areas, such as affordable
             Refine customer experience via prioritized store and           housing, quality healthcare, digital literacy, etc.
             delivery footprint, size, and digital integration

    3        Respond to “new” customer preferences
                                                                        C    Leverage Partnership Opportunities
             Refine current product, pricing, promotion, and
             assortment in reaction to pivots in lifestyle and habits   1   Optimize outcomes via strategic partners
                                                                            Operating model innovation & opportunities enabled
                                                                            through partnership models, including PPP1

1. Public-Private Partnership
Source: BCG                                                                                                                          14
A.1                      Re-design workplace, rethink talent strategy, find right balance of “type,”
                         location, and size of workplaces
                                                                                                                                                                 Focus of upcoming edition

                                                                               • Access wider & diverse talent pool, not constrained by location
Re-imagine                  Employee-centered future
                                                                               • Define future workforce personas per team needs & employee
workplace and               hybrid workplace model
                                                                                 preferences to create future hybrid workplace scenarios
talent footprint

                                                                                                                                                                                             Copyright © 2020 by Boston Consulting Group. All rights reserved. Updated 29 October 2020 Version 18.1
How does the need                                                              • Optimize space required by reducing assigned workspaces &
                            Optimal space allocation
for physical space                                                               creating activity-based space allocation1
                            and streamlined
                                                                               • Select right “type” of workplaces across formats (owned, leased,
change with more            real estate portfolio
                                                                                 flex space, etc.) & locations (e.g. suburban satellite offices)
remote work?

With increasing          Example | US-based financial institution optimized real estate footprint by considering
migration out of         employee preferences and expected future realities
cities, should offices
shift to sub-urban
locations?
                                                             Future Hybrid Workplace Model          PROJECT
                                                                                                     OFFICE HEADQUARTERS
                                                                                                                         SATELLITE
                                                                                                                          OFFICES                                           40%
                                      BUSINESS                                                                   AS A NETWORK
                                  HEADQUARTERS
                           One-stop office serving as meeting
                                                                                                HOME OFFICE                   CO-WORKING
                                                                                                                                                                   reduction in real
                            room, project office, flex space                                                                     SPACE                              estate footprint
                                                                                                            MEETING ON-DEMAND

                         1. Reduces ties to assigned workspaces; Provides purpose-built zones for collaboration, focus, wellness, and affiliation to support productivity
                         Source: CBRE Analysis; BCG                                                                                                                                     15
A.2                        Refine customer experience via prioritized footprint, size and digital integration

Re-think retail                1                                           2                                       3
and distribution               Re-imagine the purpose of                   Re-assess appropriate size             Accelerate omnichannel
                               the retail store of the future              for store portfolio, balancing         integration, using data to
strategy                       to reflect new reality                      physical and digital presence          provide a personalized
                                                                                                                  experience, across channels

                                                                                                                                                            Copyright © 2020 by Boston Consulting Group. All rights reserved. Updated 29 October 2020 Version 18.1
How should cities
reassess store network
per preference for local
                           Example | Multinational sports footwear & apparel company's two-pronged strategy to
stores?
                           provide localized & hyper-personalized experiences
What is the role of a
retail store & omni-           Direct to consumer via neighborhood stores                   Omni-channel strategy
channel strategy in            Plans to open 150-200 smaller footprint stores in US         Launched a digitally enabled experiential store in China
                               and EMEA
best serving future
customers?                                             • Shift closer to end-user with                         • Digitally push personalized
                                                         local retail assistant familiar                         offers to customers, as they
                                                         to community                                            explore store
                                                       • Direct to home shipment                               • Latest in-store
                                                         post selection in store                                 technologies (foot scan to
                                                                                                                 find shoe size, scan to try)

                           Source: Press search; BCG
                                                                                                                                                       16
A.3                      Refine current product, pricing, promotion, and assortment based on pivots
                         in lifestyle and habits of city residents

                           Build a demand lighthouse                      Enable targeted reactions to changing customer preferences
Respond to
“new” customer              Observe real-time changes
                                                                          Assortment          Packaging                Pricing
preferences                 in city residents’ lifestyle,                 Optimize product    Adapt product size,      Introduce new
                            habits and behaviors                          & assortment mix    design, materials to     pricing models;
                                                                          per new emerging    cater to new city        push for “new

                                                                                                                                              Copyright © 2020 by Boston Consulting Group. All rights reserved. Updated 29 October 2020 Version 18.1
How do companies
                                                                          trends in cities    consumer needs           affordability”
refine their portfolio
to better meet
buying preferences?
                         Example | Select instances of companies re-adjusting portfolio offering based on
What is the right        changing preferences of city dwellers
pricing strategy
given increased
focus on value?
                                                     American coffee subscription                         Luxury couture brand over-
                                                     company launched new 5-                              indexed on loungewear &
                                                     pound pack for value-conscious                       home décor, anticipating
                                                     home customers; pack typically                       sustained demand for home-
                                                     sold to wholesalers                                  living categories

                         Source: Press search; BCG
                                                                                                                                         17
B.1                     Identify trends emerging in cities
                                                                                               Capitalize on opportunities opened up by
                                                                                               new “city” opportunities

                                                                     (Non-Exhaustive)                                                    (Non-Exhaustive)

Enter and grow               Climate-smart infrastructure for resilience                         Invest in alternate energy as climate concerns rise

into adjacencies             E-commerce and digital retail                                       Devise localized last-mile offering

                                                                                                                                                                 Copyright © 2020 by Boston Consulting Group. All rights reserved. Updated 29 October 2020 Version 18.1
                             Sustainable urban food systems                                      Innovate to make urban farming scalable
Which city trends
will create new
opportunities and            E2E digitization for a connected IoT city                           Use real-time data to enhance resident experience

adjacencies?

How should              Example | Leading companies orient toward future value in city growth vectors
companies leverage
investments and            Asian auto player setting up 100 dealerships                             European tech startup to manage end-to-
capabilities to            with EV charging infrastructure across key cities                        end last-mile delivery for retailers
capture value in city
                                                                                                                      Offer enabled by 50+ carrier
growth vectors?                                     Manufacturer investing in brand-
                                                                                                                      networks (from local bike couriers
                                                    agnostic swappable battery &
                                                                                                                      to large express operators) &
                                                    charging stations for two-wheelers,
                                                                                                                      pooling increased last-mile
                                                    anticipating energy transition in cities
                                                                                                                      demand across retailers

                        Source: Press search; BCG
                                                                                                                                                            18
B.2                        Example | Affordable housing, key agenda of cities for equity and inclusivity

                              Cities launching multiple schemes                   Companies already engaging on city agenda
Participate in
building an                   New ownership model:                                            Norwegian startup to use local
equitable city                UK city to deliver 100+ homes with mixed                        recycled plastic waste to build
                              ownership models with housing association                       quick, low-cost & dignified houses

                                                                                                                                          Copyright © 2020 by Boston Consulting Group. All rights reserved. Updated 29 October 2020 Version 18.1
Which initiatives can
                              Ease in regulation:                                             US real estate player digitized
business leaders
                              Indian city relaxes policy on land purchase and                 modular design, for reduced
implement to help             building approval process                                       housing delivery costs
build an equitable city?

How can companies          Key city priorities to reduce urban                  Participate in building equitable and
integrate both business    inequity                                             inclusive communities
and social priorities?
                                                           (Non-Exhaustive)                                           (Non-Exhaustive)

                               Affordable housing                                Innovate in real estate to build budget homes

                               Literacy and digital awareness                    Launch online learning solutions at low prices

                               Accessible quality healthcare                     Establish low-cost digital healthcare facilities

                           Source: Press search; BCG
                                                                                                                                     19
C.1                     Operating model innovation & new opportunities enabled through
                        partnership models, including PPP1
                                                                                                                                                                 Non-Exhaustive

Optimize                Private-Private                                        Public-Private                                         Community as Partner
outcomes via
strategic                   Leverage complementary                                 Combine private sector                                   Seek active partnership
                            capabilities and shared                                capabilities with public                                 with citizens to ensure
partners                    networks to gain access                                sector scale & resources to                              buy-in and mitigate

                                                                                                                                                                                  Copyright © 2020 by Boston Consulting Group. All rights reserved. Updated 29 October 2020 Version 18.1
                            to markets                                             deliver city-centric objectives                          roadblocks
Which city priorities
benefit from a
collaboration           Example | Innovative partnerships to optimize city and business outcomes
model, creating
synergies at large?
                          FMCG achieves direct to home delivery                                            Preparing for the future of work
What innovative           Asian FMCG joins hands with ride-hailing app to                                  North American CEO council partners with city to
partnership models        ensure access to essentials for city consumers                                   meet need for skilled labor & create employment
can be leveraged to                             • App created alternative use case
create win-win                                    for delivery, given reduced                                                   • Scaled proven skilling model,
partnerships?                                     rideshare demand                                                                using shared resources
                                                • FMCG captured increased                                                       • Plug labor shortfall via upskilling
                                                  demand, gaining 10% YoY growth                                                  to hire 100,000 city residents by 2030
                                                  vs. industry decline2

                        1. Public-private partnership; 2. Non-cigarette FMCG business sees 10.3% YoY growth vs. industrywide slump of 17.1% in April-June 2020
                        Source: Press search; BCG                                                                                                                            20
Public leaders should re-craft their action agenda to transform cities

  A            Upgrade
               strategic vision
                                      B     Rethink citizen
                                            engagement
                                                                      C       Review mega
                                                                              projects
                                                                                                        D     Modernize
                                                                                                              operations

                                                                                                                                          Copyright © 2020 by Boston Consulting Group. All rights reserved. Updated 29 October 2020 Version 18.1
  01          Make economic           01   Lead the dialogue on       01   Consider extended city       01   Apply “war rooms”
              recovery a priority          “digital rights”                to address potential de-          and agile teams
              including contingency                                        urbanization                      beyond COVID-19
              planning
                                      02   Support R2R (resident      02   Evaluate projects in light   02   Be “digital by
  02          Include emerging             to resident)                    of future scenarios               default” in public
              trends (e.g. hybrid          cooperation & networks          (incl. mobility)                  services & operations
              work footprint) into
              development plans       03   Facilitate participation   03   Review zoning rules to       03   Access to wider
                                           through digital                 enable multi-purpose              talent pool enabled
                                           platforms                       infrastructure                    via remote working
  03          De-average, assess
              impact, and act based
              on areas and segments

Source: BCG
                                                                                                                                     21
"COVID-19 has laid bare the systemic inequities too
often found at the heart of our communities -- and as we

                                                                                                                                                            Copyright © 2020 by Boston Consulting Group. All rights reserved. Updated 29 October 2020 Version 18.1
   start to emerge from this crisis, we must rebuild an
         economy that truly works for everyone."

                 C401 Chair and Los Angeles Mayor - Eric Garcetti

1. C40 Cities connects 97 of the world’s greatest cities to take bold climate action, leading the way toward a healthier and more sustainable future
                                                                                                                                                       22
Guide for Leaders

                                                                Copyright © 2020 by Boston Consulting Group. All rights reserved. Updated 29 October 2020 Version 18.1
COVID-19 impact on cities and current actions
Outlook on future of cities and implications for leaders

Updated Analyses and Impact
Epidemic progression and virus monitoring
Economic and business impact

                                                           23
Epidemic progression | Daily case growth increasing rapidly,                                                                                                                               EPIDEMIC PROGRESSION
                                                                                                                                                                                           & VIRUS MONITORING
led primarily by resurgence in Europe
As of 26 Oct 2020

Daily new cases (7-day rolling average)                                                                                                             Key observations

        450,000

        400,000                                                                                                                                           43.5M
                                                                                                                                                          # of confirmed cases

                                                                                                                                                                                                                    Copyright © 2020 by Boston Consulting Group. All rights reserved. Updated 29 October 2020 Version 18.1
        350,000                                                                                                             South
                                                                                                                           America
        300,000

        250,000                                                                                 North
                                                                                               America                        Asia1                       13.1M (30%)
        200,000                                                                                                                                           # of active cases
                                                                                               South                         Africa                       (% of confirmed cases)
        150,000                                                                               America
                                                                                                                            North
        100,000                                                                                                            America
                                                                                                Asia1
         50,000                                           Europe2

                0
                                        Mar                        Apr
                                                                                               Africa
                                                                                             May
                                                                                              Europe                                                      1.2M
                          Mar            Apr             May             June            July         Aug               Sep           26 Oct              # of fatalities
   Month-on-
month growth                         ~235%             ~20%            ~50%           ~60%            ~15%           ~10%             ~30%
of new cases2

1. Includes Oceania (Australia, New Zealand, Papua New Guinea and surrounding island nations of the Pacific ocean); 2. Calculated as growth in monthly average of daily cases as compared to previous month;
Source: Johns Hopkins CSSE; Our World in Data; BCG                                                                                                                                                             24
De-averaged view | Several countries across the world witnessing                                                                                                                               EPIDEMIC PROGRESSION
                                                                                                                                                                                               & VIRUS MONITORING
resurgence
As of 26 Oct 2020
Data shown only for top 20 countries (by GDP) with >30 daily new cases per million1

Europe: Most countries witnessing resurgence, with                                                            US, Russia and Canada facing resurgence; Brazil and
cases exceeding previous peaks                                                                                India showing decline compared to peak case levels

 Daily new cases per million1                                                                                    Daily new cases per million1

                                                                                                                                                                                                                       Copyright © 2020 by Boston Consulting Group. All rights reserved. Updated 29 October 2020 Version 18.1
  550                                                                                France                        550
                                                                                     Netherlands
  500                                                                                                              500
                                                                                     Switzerland
  450                                                                                                              450
  400                                                                                                              400
  350                                                                                Spain                         350
                                                                                     UK
  300                                                                                                              300
                                                                                     Italy
  250                                                                                                              250
                                                                                                                                                                                                         US
  200                                                                                                              200
  150                                                                                Germany                       150                                                                                   Russia
  100                                                                                                              100                                                                                   Brazil
                                                                                                                                                                                                         Canada
    50                                                                                                               50                                                                                  Mexico
                                                                                                                                                                                                         India
     0                                                                                                                 0
         Mar        Apr        May         Jun         Jul       Aug      Sep      26 Oct                                  Mar        Apr        May         Jun         Jul       Aug      Sep      26 Oct

Note: Page shows de-averaged view of top 20 countries (by GDP), of which 13 have daily cases/M >30; other 7 countries have
Several countries are returning to stricter restrictions or even                                                                                                                                                          EPIDEMIC PROGRESSION
                                                                                                                                                                                                                          & VIRUS MONITORING
partial lockdowns driven by resurgence
As of 26 October 2020                                                                                                                                                                                                           Non-Exhaustive

Change in lockdown restrictions basis                                                                           Total
stringency index1                                                                                             cases2 (K) Current status of measures implemented by governments
                                   Mar Apr May Jun                       Jul      Aug      Sep      Oct
                                                                                                                                    Alert system depending of # of cases; for "very high," pubs & bars must close, private
              UK                                                                                                          898       meetings only within households; lockdown in Wales from 23rd October to 9th Nov
                                                                                                          3                         Declared national state of emergency on 26 th October incl. night-time curfew from

                                                                                                                                                                                                                                                        Copyright © 2020 by Boston Consulting Group. All rights reserved. Updated 29 October 2020 Version 18.1
              Spain                                                                                                     1,098       11:00 p.m. to 6:00 a.m., private meetings of max. 6 people
                                                                                                          4                         New measures from 26th October; all leisure establishments (incl. restaurants, gyms,
              Italy                                                                                                       543       theaters, cinemas) to close from 6 p.m., online classes for 75% of high school students
                                                                                                                                    Curfew (from 9:00 p.m.) since mid -October; due to >50,000 daily cases lately, currently
Europe France                                                                                                           1,210       reviewing additional measures incl. potential second lockdown
                                                                                                                                    In regions with >50 cases per 100K inhabitants: Curfews, re-enforced restrictions on
              Germany                                                                                                     456       private meetings, strict mask obligation; if not successful, local lockdowns
                                                                                                                                    Partial lockdown from 14th Oct, incl. closure of all bars & restaurants, private meetings
              Netherlands                                                                                                 308       of 4 people maximum, closure of retail stores from 8:00 p.m.
                                                                                                                                    New measures incl. stricter mask obligation, remote schooling & 30% obligatory rem.
              Russia                                                                                                    1,537       working; considering closure of bars & restaurants, reluctant toward second lockdown
                                                                                                                                    Measures varying across states; after having reopened, 8 states now re-introducing
 North US                                                                                                               8,705       stricter measures; Trump's government admitted it’s not going to control pandemic
America Canada                                                                                                                      Partial lockdowns in highly affected Quebec; stronger restrictions on private meetings
                                                                                                                          223       (household members + 6)
                                                               5                                                                    In the phase of reopening (still restrictions e.g. online schooling where possible);
              India                                                                                                     7,946       few local lockdowns depending on # of cases
   Asia
                                                                                                                                    After very strict lockdown & controls, cases are low now and measures strongly
              China                                                                                                         91      reduced; however, recent resurgence in Xinjiang might cause reversal
    Lockdown              Restrictions without lockdown                          Ease of restrictions                  Partial lockdown               Night curfew with additional restrictions
Index                 Min restrictions                             Max restrictions
1. Stringency index is calculated using 8 govt. policy indicators (School closing, workplace closing, public events cancellation, gatherings restriction, public transport closure, stay at home requirements, internal movement restrictions,
international travel controls) and public information campaigns; represented for selected countries; Data range provided from 01 March 2020 until 22 October 2020, stringency index not yet available for most recent dates for individual
countries; Stringency Index for Spain until 12 October only with color for 13-22 October indicating current restrictions; 2. As of 26 October 2020; 3. Nationwide curfew with Canary islands as only exemption; 4. Curfews in individual           26
regions (e.g., Campania region). Note: Lockdown is defined as "stay at home" orders from govt. People are allowed to go out only for essential activities like medical, grocery shopping, etc. following certain restrictions. Lockdown measures
can differ across countries; 5. Ease of restrictions in 4 phases; currently in re-opening phase until 31st October; Source: Oxford covid-19 Government response tracker; Our world in Data; News articles
EPIDEMIC PROGRESSION
Vaccines & Therapeutics | Summary snapshot                                                                                                                                                                                                & VIRUS MONITORING

Best-case timelines as of 19 Oct 2020

                                         Vaccines                                                                                                                                        Therapeutics
                                                     44                                                                                                                                                    257

                                                                                                                                                                                                                                                                  Copyright © 2020 by Boston Consulting Group. All rights reserved. Updated 29 October 2020 Version 18.1
                         candidates currently in clinical trials                                                                                                                   candidates currently in clinical trials

                                                     10                                                                                                                                                            4
                        candidates currently in Phase III;                                                                                                               key candidates currently under EUA1,5 in select
                         in race for EUA1,2 starting Q4'20,                                                                                                              countries; ensuring broad clinical trials, safety,
                     contingent on safety and efficacy profiles                                                                                                               and efficacy key for further approvals

                                         Q2'21                                                                                                                                                     Q4'20
                       expected start of broader distribution                                                                                                                             expected broader availability6
                     (beyond targeted population segments)3
                            in the best-case scenario4
1. Emergency Use Authorization; nomenclature may differ across geographies; 2. Estimated timelines for grant of EUA: BioNTec h/Pfizer, Moderna, Sinopharm/BIPB and Sinopharm/WIPB by Q4 '20, Oxford
University/AstraZeneca between Q4 '20 & Q1 '21; Janssen (J&J), Novavax, Sinovac and CanSino by Q1 '21; Gamaleya Research Institute to be ascertained; 3. Healthy adults (beyond initial target population segments)
able to access vaccine; 4. Estimated for the US; will be subject to a set of preconditions including phase 3 results, manufacturing & distribution setup and scale-up, etc.; 5. EUA for Remdesivir in the US, Japan,     Further reading
Australia (non-exhaustive), Convalescent plasma therapy in the US (non-exhaustive); Dexamethasone in UK, Japan (non-exhaustive); Favipiravir in India, Russia, China (non-exhaustive); 6. First few million doses;
Gilead to ramp up availability of Remdesivir to 2M by Dec 2020; the US has secured 500k already and pre-booked 90% of the September 2020 capacity; Additionally, availability basis prescription has started in select   Vaccines & Therapeutic Outlook Part27
                                                                                                                                                                                                                                                             I:
geographies like India, Japan, European Union, etc; Gilead has also signed non-exclusive voluntary licensing agreements with generic pharmaceutical manufacturers based in Egypt, India and Pakistan;                    Timelines and Success Factors
Dexamethasone widely available but used generally in severe patients requiring supplemental oxygen support; Source: FDA; WHO; Milken Institute; Biocentury; Company websites; BCG
Vaccine fast movers | 10 vaccine candidates already in Phase III
                                                                                                                                                                                                                           EPIDEMIC PROGRESSION
                                                                                                                                                                                                                           & VIRUS MONITORING

                                   As of 19 Oct 2020                                                                                                                                                  WHO Phase III classification
 Vaccine candidates across
 development phases                Potential timelines for candidates currently in Phase III
                                                                                                       Targeted Ph III                                                                             We are here
                                                                                                         enrollment
                             220
                                      BioNTech (Germany), Pfizer (US)                                       ~44,000                                                                                               Expected EUA4
                                                                                                                                                                                                                  by US FDA later
        Phase III1           10       Moderna, NIH (US)                                                     ~30,000                                                                                              this year, subject

                                                                                                                                                                                                                                                               Copyright © 2020 by Boston Consulting Group. All rights reserved. Updated 29 October 2020 Version 18.1
 Confirm effectiveness                                                                                                                                                                                            to initial phase
                                                                                                                                                                                                                    III readouts
                                      Oxford Uni., AstraZeneca5 (UK)                                        ~50,000
           Phase     II2     2
   Effectiveness/safety               Janssen ( J&J) (US)6                                                  ~60,000                                                                                                                          Q1 2021

          Phase I/II         11       Novavax (US)                                                          ~10,000

                                      Sinovac (China)                                                        ~9,000

                                      BIPB7 & Sinopharm8 (China)                                            ~15,000

                                      WIPB9 & Sinopharm8 (China)                                            ~15,000
            Phase I3         21
Safety, side effects/dose             CanSino Biologics (China)                                             ~40,000

                                      Gamaleya10 - Sputnik V (Russia)                                       ~40,000                  Russia registers Sputnik V

                                                                                                                                              Jun            Jul          Aug           Sep           Oct           Nov           Dec          Jan '21
        Pre-Clinical         176                                                                                                                            Start of phase III trials                   Start of phased approval process11
                                   Note: The timeline represented is highly dependent on Phase III vaccine results including safety and efficacy data and, hence, is subject to change; 1. Ph III trials involve large number of volunteers (e.g., 10s
                                   of 1000s) to test efficacy & safety of vaccine; 2. Phase II studies involve small number of volunteers (e.g., 100-1000) & intended to provide preliminary information about vaccine’s ability to produce desired
                                   effect; 3. Phase I clinical studies involve initial testing in very small number of volunteers (e.g., 20-100) to test safety profile; 4. Emergency Use Authorization; 5. Oxford University/AstraZeneca voluntarily
                                   paused Ph. III trials to review safety event on a UK patient; trials resumed in UK, India but suspended in other countries, including US; 6. J&J paused trials due to an unexplained illness in a study participant;
                                   7. Beijing Institute of Biological Products; 8. EUA granted for high-risk groups in China & UAE, conditional regulatory approval for general public use expected by end of year; 9. Wuhan Institute of Biological      28
   (WHO, Milken Institute)         Products; 10. Gamaleya Research Institute; 11. Trials expected to continue until 2021 & 2022 for different candidates, per WHO, clinicaltrials.gov. Companies expected to start approval applications with
                                   initial phase III results. Source: Guggenheim; Wells Fargo; Bloomberg; FT; Cowen; NYT; Milken Institute; Morgan Stanley; NIH; clinicaltrials.gov; WHO; Press Search; BCG
Therapeutics | Multiple therapeutic candidates at various stages                                                                                                                    EPIDEMIC PROGRESSION
                                                                                                                                                                                        & VIRUS MONITORING
    of clinical trials
                           As of 15 Oct 2020                                                                                                                                                          US Example
Globally 300+ treatments
                           3 therapeutic candidates currently approved1 in the US for potential COVID-19 treatment
undergoing trials
                                                         Remdesivir                                            Dexamethasone                                         Plasma Therapy
               357                                       (antivirals)                                          (corticosteroid)                                      (convalescent plasma)
   Phase IV    28            Interim                    ~30% drop in recovery time                             Mortality risk reduction in                           8.7% mortality rate3 for patients
                             report view                                                                       severe patients2                                      transfused within 3 days of
                                                        >50% patients discharged in

                                                                                                                                                                                                                    Copyright © 2020 by Boston Consulting Group. All rights reserved. Updated 29 October 2020 Version 18.1
                                                                                                                                                                     diagnosis versus 11.9% in patients
   Phase III   64                                       2 weeks                                                Reduced 28-day mortality rate
                                                                                                                                                                     transfused after 3 days
                                                                                                               by 17%

                             Authorization              Broader EUA4,5 granted allowing                        Widely available as anti-                             EUA4 granted6; rigorous
                             status                     treatment of suspected or                              inflammatory drug                                     randomized trials underway
                                                        confirmed COVID-19 patients
    Phase II   135
                           Example candidates in Phase III clinical trials                                                                                                                        Non-Exhaustive

                                                         LY-CoV555 (Eli Lilly7)                                Actemra (Roche)                                       REGN-COV2 (Regeneron)
                                                         (monoclonal antibodies)                               (monoclonal antibodies)                               (antibody cocktail)
     Phase I   30
                             Trial phase &              Phase III8                                             Phase III                                             Phase III
                             authorization              Submitted initial request for EUA 4                                                                          Submitted initial request for EUA 4
                             status                     in US                                                                                                        in US
Pre-Clinical   100
                             Interim                    72% reduction in hospitalization for                   Patients were 44% less likely to                      Reduced viral load by 50-90% and
                             report view                patients who received antibody vs.                     progress to mechanical ventilation                    time to alleviate symptoms by 5-7
                                                        those who received a placebo                           or death                                              days vs. those who received a
                                                                                                                                                                     placebo

                            1. Remdesivir and plasma therapy granted Emergency Use Authorization; US Health and Human Services included dexamethasone inCOVID-19 treatment guideline; 2. Patients
                            requiring supplemental oxygen support; 3. 7-day mortality rate; 4. Emergency Use Authorization; 5. Initial EUA restricted use to patients with severe conditions (e.g., patients   29
(BioCentury)                requiring supplemental oxygen support); 6. EUA granted despite no to limited randomized clinical trial involving a placebo group to estimate actual impact of the plasma
                            treatment; 7. Initial request for EUA for LY-CoV016 submitted; 8. Eli Lilly paused one Phase III trial of LY-CoV555 citing undisclosed safety concern
Economic forecasts point toward a continued downturn in 2020;                                                                                                                                          ECONOMIC &
                                                                                                                                                                                                       BUSINESS IMPACT
most countries expected to rebound to 2019 GDP only by end of 2021
As of 16 Oct 2020

GDP forecast levels indexed to 2019 value (Base: 100)
                    US                                        Europe                                    China                                     Japan                                     India1

    112                                                                                                                                 111.4
                                                                                                                                        110.3

                                                                                                                                                                                                                                   Copyright © 2020 by Boston Consulting Group. All rights reserved. Updated 29 October 2020 Version 18.1
    108                                                                                                                                 108.0

                                                                                                                                        104.2                                                                              104.7
    104                                                                                                                     103.3
                                                    101.7                                                                   101.9
                                                                                                                            101.0
                                                                                                                            100.7
    100                                                                                                                                                                                                                    99.8
                                                    98.7
                                                    97.7                                     97.8                                                                                97.4                                      97.6
                                        96.6        97.0                                                                                                                         96.9                           96.8
    96                                                                                       96.5                                                                                96.2
                                        95.7                                                                                                                           95.0
                                                                                             95.0
                                        93.9                                                                                                                           94.7                                                93.6
                                        93.6                                       93.1                                                                                93.9      93.1
    92                                                                             91.7
                                                                                                                                                                      91.2
                                                                                   90.9
                                                                                                                                                                                                                89.7
                                                                                                                                                                                                                89.0
    88                   2019      2020      2021                  2019      2020      2021                 2019       2020      2021                 2019      2020      2021                  2019      2020      2021

2021 forecast
  vs 2019
                               94-102%                                     91-98%                                 101-111%                                     91-97%                                   89-105%
                       2019 GDP levels (Index)                Forecast IMF (Oct 07, 2020)                  Forecast World Bank (Jun 8, 2020)                Forecast range from leading banks2

Note: As of reports dated 08 June 2020 to 16 Oct 2020, YoY forecasts; 1. For India, forecast is for financial year; for other countries, the forecast is for calendar year; 2. Range from forecasts (where available) of     30
JPMorgan Chase; Morgan Stanley; Bank of America; Fitch Solutions; Credit Suisse; Danske Bank; ING Group; HSBC; Source: Bloomberg; World Bank; IMF; BCG
ECONOMIC &
Manufacturing PMI recovery globally indicates positive momentum                                                                                                                           BUSINESS IMPACT

As of 26 Oct 2020

Manufacturing PMI before, during, and after the crisis
US                                                                    Germany                                                                China1
  Neutral         2                                1     3      3        Neutral                                                     6          Neutral         0          2    1     1    1     1    1     2
                        1                                                                                                 1    2
 level = 50                                                             level = 50                                                             level = 50
                             -2               0
                                                                                             -2

                                                                                                                                                                                                                    Copyright © 2020 by Boston Consulting Group. All rights reserved. Updated 29 October 2020 Version 18.1
                                                                                        -5         -5               -5
                                       -10                                                                                                                          -14
                             -14                                                                   -16 -13
                 Jan Feb Mar Apr May Jun July Aug Sep                                  Jan Feb Mar Apr May Jun July Aug Sep                                   Jan Feb Mar Apr May Jun July Aug Sep

                                                                      Italy                                                                  South Korea
                                                                         Neutral                                               3     3          Neutral
                                                                                                                          2
                                                                        level = 50                                                             level = 50
                                                                                                                                                                0    -1                               -2    0
                                                                                        -1   -1               -5    -3                                                                          -3
                                                                                                  -10                                                                     -6               -7
                                                                                                                                                                                -8   -9
                                                                                                   -19
                                                                                       Jan Feb Mar Apr May Jun July Aug Sep                                   Jan Feb Mar Apr May Jun July Aug Sep

                                                                      Sweden                                                                 Japan
                                                                         Neutral                                               4     5          Neutral
                                                                                        2     3                           2
                                                                        level = 50                                                             level = 50
                                                                                                                                                               -1    -2                               -3   -2
     ≤ -30%        -29% to -15%      -14% to 0%              > 0%                                                   -2                                                    -5                    -5
                                                                                                                                                                                -8
                                                                                                   -7
                                                                                                       -9                                                                            -12 -10
   Lockdown started               Lockdown easing                                                  -13
                                                                                       Jan Feb Mar Apr May Jun July Aug Sep                                  Jan Feb Mar Apr May Jun July Aug Sep

Note: PMI (Purchasing Manager's Index) is a diffusion index that summarizes whether market conditions, as viewed by purchasing managers, are expanding, staying the same, or contracting. 50 is neutral, >50 is
considered to be positive sentiment and
Retail & recreation mobility declining after attaining baseline levels                                                                                                                           TRENDS IN MOBILITY &
                                                                                                                                                                                                 CONSUMER ACTIVITY
for select countries; continued lower recovery of workplace mobility
As of 20 Oct 2020                                                                                                                                                                                   Non-Exhaustive

Workplace1, public transit,2 and retail & recreation3 mobility compared to baseline of January to mid-February 2020
Germany                                                                 Sweden                                                                  Italy

                                                                                                                                                                                                                             Copyright © 2020 by Boston Consulting Group. All rights reserved. Updated 29 October 2020 Version 18.1
     0                                                                       0                                                                       0

  -50                                                                      -50                                                                     -50

 -100                                                                    -100                                                                    -100
      Feb   Mar     Apr   May     Jun     Jul   Aug    Sep     Oct            Feb    Mar    Apr    May     Jun    Jul    Aug    Sep    Oct               Feb   Mar   Apr    May    Jun     Jul    Aug   Sep       Oct

US                                                                      South Korea                                                             Japan

     0                                                                       0                                                                      0

  -50                                                                      -50                                                                    -50

 -100                                                                    -100                                                                   -100
      Feb   Mar     Apr   May     Jun     Jul   Aug    Sep     Oct            Feb    Mar    Apr    May     Jun    Jul    Aug    Sep    Oct            Feb      Mar   Apr   May    Jun     Jul     Aug   Sep       Oct

 Lockdown started4           Lockdown easing4                Workplace mobility              Public transit mobility               Retail & recreation                Mobility rebounded to baseline levels
Note: Data taken as weekly average compared with baseline (average of all daily values of respective weeks during Feb 15–Oct 20, 2020); 1. Tracked as changes in visits to workplaces; 2. Tracked as changes in
visits to public transport hubs, such as underground, bus and train stations; 3. Tracked as changes for restaurants, cafés, shopping centers, theme parks, museums, libraries and cinemas; 4. Refers to average         32
lockdown start and easing dates; Source: Google LLC "Google COVID-19 Community Mobility Reports". https://www.google.com/covid19/mobility/ Accessed: 26 Oct 2020; Press search; BCG
Passenger vehicle sales see limited rebound, except in Japan
                                                                                                                                                                                                                          TRENDS IN MOBILITY &
                                                                                                                                                                                                                          CONSUMER ACTIVITY

As of 20 Oct 2020

Monthly passenger vehicle1 sales, YOY % change vs 2019
US1                                                                                Germany                                                                            China2

               0%                                                                                                                                     8%                                                    7%      2%     9%      6%        8%

                                                                    -4%                                                                                                                             -2%
      -11%                                                                               -7% -11%                                      -5%                                   -20%

                                                                                                                                                                                                                                                        Copyright © 2020 by Boston Consulting Group. All rights reserved. Updated 29 October 2020 Version 18.1
                                                    -19% -27%                                                                                 -20%
                                                                                                        -38%                   -32%                                                         -48%
                     -44%            -40% -38%                                                                         -49%
                   -56%                                                                                        -61%                                                                 -82%
       Jan Feb Mar Apr May Jun                      Jul    Aug Sep                        Jan Feb Mar Apr May Jun                       Jul   Aug Sep                         Jan Feb Mar Apr May Jun                       Jul   Aug Sep

                                                                                   Italy                                                                              South Korea3
                                                                                                                                                                                                                   46%
                                                                                                                                               2%
                                                                                                                                                                                            11% 12% 13%                    9%                16%
                                                                                          -6%    -8%
                                                                                                                               -24% -11%
                                                                                                                       -48%                                                                                                        -2%
                                                                                                        -85% -98%                                                            -14% -20%

                                                                                          Jan Feb Mar Apr May Jun                       Jul   Aug Sep                         Jan Feb Mar Apr May Jun                       Jul   Aug Sep

                                                                                   Sweden                                                                             Japan
                                                                                                                                                       7%

                                                                                                 -6%     -9%                           -4%
                                                                                                                                              -13%                           -12% -10% -9%                                -13% -15% -15%
      ≤ -30%          -29% to -15%          -14% to 0%               > 0%                -18%                                  -22%                                                                                -23%
                                                                                                                                                                                                    -30%
                                                                                                                -37%
                                                                                                                       -50%                                                                                -47%
   Lockdown started                    Lockdown easing
                                                                                          Jan Feb Mar Apr May Jun                       Jul   Aug Sep                         Jan Feb Mar Apr May Jun                       Jul   Aug Sep

1. Passenger vehicle sales includes data on, where available, hatchback, MPV, pickup, sedan, SUV, and vans; 2. Stimulus policies: Launched subsidies for car purchases in 10 cities, lessened purchase restriction in high tier cities and
extended NEV subsidies; 3. South Korea's growth in auto sales from Mar through June 2020 is supported by recent tax cuts for individual consumption goods (e.g., cars), several carmakers (e.g. Audi, VW) launching new models and                 33
the increased appreciation by the Koreans of cars as a safe mode of transport and as a travel alternative for camping during COVID-19, supported by recently passed legislation to allow a variety of different cars to be modified into
'camping cars'. Source: Marklines; BCG
Retail goods sales (excl. auto and fuel) have rebounded to                                                                                                                                              TRENDS IN MOBILITY &
                                                                                                                                                                                                        CONSUMER ACTIVITY
pre-COVID-19 levels across most of the countries
As of 21 Oct 2020

Growth of total retail goods sales (excl. auto & fuel)1, YOY % change vs 2019
Retail goods sales include online & offline sales and comprise food & beverages, apparel, cosmetics & personal care,
home appliances, general merchandise, building material; do not include auto, fuel & food services

                          Jan          Feb             Mar             Apr             May             June             July            Aug             Sep

                                                                                                                                                                                                                               Copyright © 2020 by Boston Consulting Group. All rights reserved. Updated 29 October 2020 Version 18.1
      China2                     -16%                  -12%             -6%             -1%              2%             -2%              -1%              2%
                                                                                                                                                                                      Retail goods sales have currently
                                                                                                                                                                                      rebounded to pre-COVID-19
      Japan               0%            2%              1%              -6%             -1%             10%              7%              7%
                                                                                                                                                                                      levels, with US, UK and Belgium
                                                                                                                                                                                      showing higher growth than Jan
      US                  3%            4%              7%              -6%             3%               8%              9%              8%             10%                           levels

      UK                  1%            0%              -4%            -19%            -11%              1%              3%              4%
                                                                                                                                                                                      In Italy, retail goods sales
                                                                                                                                                                                      rebounded in Aug to Jan levels
      Italy               1%            2%             -18%            -27%            -11%             -1%            -11%              1%
                                                                                                                                                                                      Sweden hasn't shown a
      Sweden              3%            5%              2%              -3%             2%               3%              3%              3%
                                                                                                                                                                                      significant impact of COVID-19
                                                                                                                                                                                      on retail goods sales
      Belgium             2%            2%              -7%            -14%             2%               7%              1%              9%

       ≤ -30%            -29% to -15%            -14% to 0%                > 0%                                                                                                           Further reading
1. Retail goods sales categorization may be different across countries; seasonally adjusted values taken; 2. For China, combined value of Jan & Feb is available; Source: US Census       Reigniting Retail Demand
Bureau; PRC National Bureau of Statistics; Eurostat; Ministry of Economy Japan                                                                                                                                         34
De-averaged view | Retail store sales in China have rebounded across                                                                                                                                                   TRENDS IN MOBILITY &
                                                                                                                                                                                                                       CONSUMER ACTIVITY
categories; apparel sales continue to be impacted in other countries
As of 21 Oct 2020

Retail store sales’ breakdown by category, YoY % change vs 2019
Food & beverage stores                                                        Personal care & cosmetics stores

                Apr May June                Jul     Aug      Sep                               Apr May June                Jul     Aug      Sep                            China's sales (except Home
  China1        18%      11%      11%       7%      2%        5%                         4% 13%                  21%       9%      22%      16%
                                                                                                                                                                           Appliances) have almost rebounded
                                                                                China1
                                                                                                                                                                           to year-ago run rates

                                                                                                                                                                                                                                                      Copyright © 2020 by Boston Consulting Group. All rights reserved. Updated 29 October 2020 Version 18.1
  Japan         0%       2%        3%       1%      2%                          Japan    3% -3%                   3%       1%       2%
  US            12%      15%      12%      11%      10%      10%                US      -10% -8%                 -1%       4%       4%       5%
  UK            5%       6%        6%       3%      3%                          UK      -37% -30%                -6%      -3%       0%                                     Retail store sales recovery driven by
  Italy         0%       1%       -1%      -2%      1%                          Italy   -13% -13%                -9%      -5%      -1%                                     F&B across all countries
  Sweden        -2%      0%        1%       0%      3%                          Sweden -3% -5%                    3%       1%       3%
  Belgium       11%      11%       7%       6%      6%                          Belgium -6% -8%                  -1%      -2%       5%                                     Personal care & cosmetics category
                                                                                                                                                                           sales have rebounded to last year levels
Apparel stores2                                                               Home appliance stores3
                                                                                                                                                                           except in Italy
                Apr May June                Jul     Aug       Sep                               Apr May June               Jul     Aug Sep
                -19%      -1% 0% -3% 2%       6%                                                -9%       4%      10% -2%           4%       -3%
                                                                                                                                                                           Apparel category saw the largest
  China1                                                                         China1
  Japan         -54%     -35% -6% -19% -18%                                      Japan          -9%       9%      26% 12%          10%
                                                                                                                                                                           decline; far from recovery across
  US            -86%     -62% -24% -23% -21% -12%                                US            -53%     -42%     -20% -6%          -4%       -6%                           countries except China, Italy & Belgium
  UK            -68%     -60% -33% -25% -16%                                     UK            -50%     -31%       0%  9%          10%
  Italy         -88%     -43% -18% -41% 1%                                       Italy         -55%     -14%       1% -1%           1%                                     Home appliances sales showing signs of
  Sweden  -38% -30% -22% -20% -16%                                               Sweden         8%       15%      15% 17%           9%                                     rebound; strong sales growth in
  Belgium -87% -33% -13% -29% 21%                                                Belgium       -46%      5%      13%       3%      28%                                     Belgium

       ≤ -30%            -29% to -15%             -14% to 0%               > 0%

Note: For US, share in retail store sales in Q4 2019: F&B ~25%, personal care & cosmetics ~12%, apparel ~6%, home appliances ~3%, general merchandising ~25% and building material & gardening equipment ~13%. Sector classification &
mix may be different across countries; 1. For China, Feb data includes both Jan & Feb, Food & beverages category only includes food & grains; 2. Includes clothing accessories, shoes, etc.; 3. Includes audio video & home appliances stores;   35
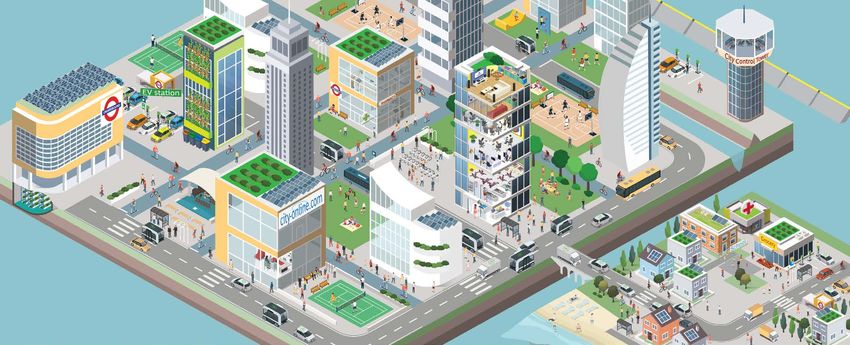
Source: US Census Bureau; PRC National Bureau of Statistics; Eurostat; Ministry of Economy Japan
5 sectors currently above pre-crisis TSR levels;                                                                                                                                          ECONOMIC &
                                                                                                                                                                                          BUSINESS IMPACT
6 sectors with significant share1 of companies with >15% default risk
As of 23 Oct 2020                                                                                                                                                  Based on top S&P Global 1200 companies

Categories based on TSR and net debt/enterprise value2
                                                                                      TSR performance3                                                 Companies with probability of default >15%4
                                                                           21 Feb 2020             21 Feb 2020       09 Oct 2020                                                                    09 Oct 2020
                                                                                                                                                                21 Feb 2020         23 Oct 2020
                                                                          - 20 Mar 2020           - 23 Oct 2020     - 23 Oct 2020                                                                  - 23 Oct 2020
                                         Sem iconductors                      -30%                    20%                                                            0%                  0%
                                         Retailing                            -40%                    11%                                                            0%                 35%
Healthier sectors

                                                                                                                                                                                                                    Copyright © 2020 by Boston Consulting Group. All rights reserved. Updated 29 October 2020 Version 18.1
                                         Materials                            -32%                     7%                                                            5%                 9%
                                         Household Products                   -16%                     3%                                                            0%                  0%
                                         Health Equipm ent                    -31%                     0%                                                            0%                  0%
                                         Tech Hardware                        -26%                    -1%                                                            0%                  0%
                                         Capital Goods                        -35%                    -1%                                                            2%                  5%
                                         Pharm a                              -20%                    -1%                                                            0%                  0%
                                         Media                                -36%                    -2%                                                            0%                  0%
                                         Software                             -30%                    -3%                                                            9%                  0%
Pressured sectors                        Food/staples Retail                  -10%                    -3%                                                            0%                  0%
                                         Durable Goods                        -39%                    -3%                                                            0%                  0%
                                         Prof. Services                       -30%                    -5%                                                            0%                  0%
                                         Auto                                 -41%                    -7%                                                            0%                 14%
                                         Utilities                            -30%                    -9%                                                            0%                  0%
                                         Financials                           -35%                     -9%                                                           0%                 0%
                                         Food & Beverage                      -23%                    -11%                                                           0%                 0%
                                         Telecom                              -17%                    -16%                                                           0%                  8%
                                         Transport                            -34%                    -18%                                                           0%                 28%
Vulnerable sectors                       Hospitality                          -44%                    -19%                                                           8%                 31%
                                         Insurance                            -39%                    -21%                                                           0%                  0%
                                         Banks                                -39%                    -23%                                                           0%                  4%
                                         Real Estate                          -39%                    -28%                                                           0%                 13%
                                         Energy                               -52%                    -42%                                                           0%                 21%

Note: Based on top S&P Global 1200 companies; Sectors are based on GICS definitions; 1. Retailing, Auto, Transport, Hospitality, Real estate and Energy are sectors with > 10% of     Pos. trend ≥ 2%
companies with a probability of default > 15%; 2. Net debt & enterprise value from latest available balance sheet; categories defined based on comparison with S&P Global 1200
                                                                                                                                                                                      No sig. change
median: healthy = TSR & debt/EV > median, pressured = TSR or debt/EV < median, vulnerable = TSR & debt/EV < median; 3. Performance is tracked for two periods, first from                                      36
21 February 2020 (before international acceleration of outbreak) to 20 March 2020 (trough of the market) and from 21 February 2020 through 23 Oct 2020 based on median; 4.            Neg. trend ≥ 2%
Implied by 5-year credit default swap based on median; Source: S&P Capital IQ; BCG ValueScience Center; BCG
You can also read