How do the blind 'see'? The role of spontaneous brain activity in self-generated perception
←
→
Page content transcription
If your browser does not render page correctly, please read the page content below
doi:10.1093/brain/awaa384                                                                                                               BRAIN 2021: 144; 340–353              | 340

How do the blind ‘see’? The role of
spontaneous brain activity in self-generated
perception

                                                                                                                                                                                          Downloaded from https://academic.oup.com/brain/article/144/1/340/6053150 by guest on 31 March 2021
Avital Hahamy,1,2 Meytal Wilf,3                                    Boris Rosin,4,5 Marlene Behrmann6 and Rafael Malach2

Spontaneous activity of the human brain has been well documented, but little is known about the functional role of this ubiquitous
neural phenomenon. It has previously been hypothesized that spontaneous brain activity underlies unprompted (internally gener-
ated) behaviour. We tested whether spontaneous brain activity might underlie internally-generated vision by studying the cortical
visual system of five blind/visually-impaired individuals who experience vivid visual hallucinations (Charles Bonnet syndrome).
Neural populations in the visual system of these individuals are deprived of external input, which may lead to their hyper-sensitiza-
tion to spontaneous activity fluctuations. To test whether these spontaneous fluctuations can subserve visual hallucinations, the
functional MRI brain activity of participants with Charles Bonnet syndrome obtained while they reported their hallucinations
(spontaneous internally-generated vision) was compared to the: (i) brain activity evoked by veridical vision (externally-triggered vi-
sion) in sighted controls who were presented with a visual simulation of the hallucinatory streams; and (ii) brain activity of non-
hallucinating blind controls during visual imagery (cued internally-generated vision). All conditions showed activity spanning large
portions of the visual system. However, only the hallucination condition in the Charles Bonnet syndrome participants demon-
strated unique temporal dynamics, characterized by a slow build-up of neural activity prior to the reported onset of hallucinations.
This build-up was most pronounced in early visual cortex and then decayed along the visual hierarchy. These results suggest that,
in the absence of external visual input, a build-up of spontaneous fluctuations in early visual cortex may activate the visual hier-
archy, thereby triggering the experience of vision.

 1 The Wellcome Centre for Human Neuroimaging, UCL Queen Square Institute of Neurology, University College London, London
   WC1N 3AR, UK
 2 Department of Neurobiology, Weizmann Institute of Science, Rehovot, 7610001, Israel
 3 Department of Clinical Neuroscience, Lausanne University Hospital (CHUV), Switzerland
 4 Department of Ophthalmology, Hadassah-Hebrew University Medical Center, Jerusalem, 91120, Israel
 5 Department of Ophthalmology, University of Pittsburgh Medical Center (UPMC), Pittsburgh, PA 15213, USA
 6 Department of Psychology and Neuroscience Institute, Carnegie Mellon University, Pittsburgh, PA 15213, USA

Correspondence to: Avital Hahamy
UCL, 12 Queen Square Institute of Neurology, University College London, London, UK WC1E 6BT
E-mail: a.hahamy@ucl.ac.uk

Keywords: spontaneous activity; Charles Bonnet syndrome; functional MRI; spontaneous behaviour; visual hallucinations
Abbreviations: BOLD = blood oxygenation level-dependent; CBS = Charles Bonnet syndrome; FFA = fusiform face area; HRF =
haemodynamic response function; TR = repetition time

Received May 13, 2020. Revised August 12, 2020. Accepted September 1, 2020. Advance access publication December 26, 2020
C The Author(s) (2020). Published by Oxford University Press on behalf of the Guarantors of Brain.
V
This is an Open Access article distributed under the terms of the Creative Commons Attribution License (http://creativecommons.org/licenses/by/4.0/), which permits unrestricted reuse,
distribution, and reproduction in any medium, provided the original work is properly cited.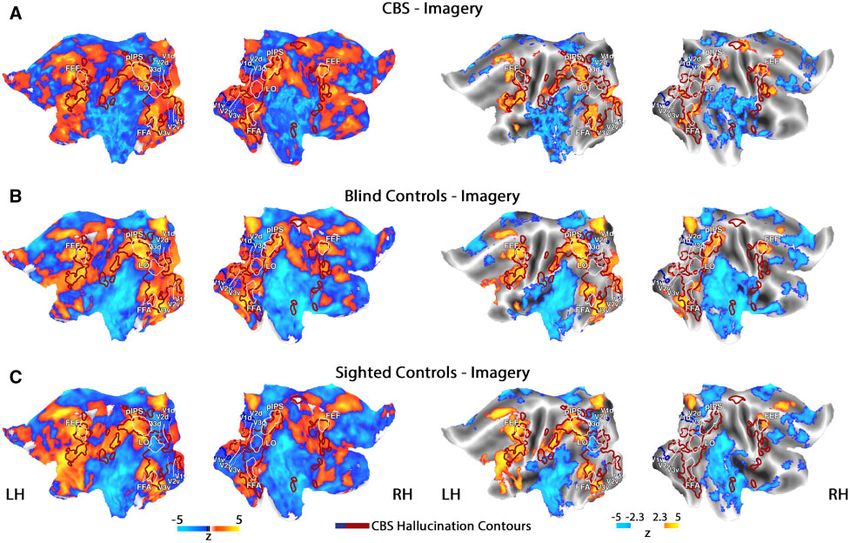
Spontaneous activity drives perception                                                             BRAIN 2021: 144; 340–353     | 341

Introduction                                                         (Smith et al., 2009), and their hierarchical functional organ-
                                                                     ization (Grill-Spector and Malach, 2004), it seems unlikely
During rest and independent of any external stimulation, the         that local activity, which is robust enough to evoke vision,
brain evinces activation in a spontaneous manner (‘resting           would remain confined to a small region. The role of spon-
state’ activity) (Arieli et al., 1995; Nir et al., 2006; Fox and     taneous brain activity in evoking hallucinations is also un-
Raichle, 2007; Raichle, 2009; Harmelech and Malach,                  clear, since, on the one hand, recent imaging findings
2013; Moutard et al., 2015). It has previously been pro-             ascribed hallucinations (Vacchiano et al., 2019) or abnormal
posed that a slow build-up of spontaneous activity can initi-        visual responses (Painter et al., 2018) in individuals with
ate unprompted (spontaneous) behaviour (Schurger et al.,             CBS to external stimulation. On the other hand, the isolated
2012; Moutard et al., 2015). This phenomenon has been                activity in the fusiform gyrus, described by Ffytche et al.
classically observed in the readiness potential during deci-         (1998), appeared to build up slowly over time prior to hallu-
sions to move (Kornhuber and Deecke, 1965; Libet et al.,             cination onset, which aligns with the hypothesis that slow
1983; Libet, 1985; Soon et al., 2008; Fried et al., 2011), but       spontaneous fluctuations underlie the CBS hallucinations. In

                                                                                                                                           Downloaded from https://academic.oup.com/brain/article/144/1/340/6053150 by guest on 31 March 2021
has also been observed during other cognitive tasks                  summary, as evident from the above, neither the spatial nor
(Gelbard-Sagiv et al., 2008, 2018; Norman et al., 2019;              dynamic neural mechanisms of CBS have been fully
Broday-Dvir and Malach, 2020). However, in these studies,            clarified.
the mere instruction to generate behaviour spontaneously                Here, we compared directly the neural correlates of hallu-
prevents behaviour from being purely unprompted.                     cinations in individuals with CBS with the activation profiles
Furthermore, since these studies involved task performance,          evoked by veridical vision in sighted controls and by visual
brain activity was likely to be affected by the task demands,        imagery in blind controls, across the entire visual cortex. As
rather than being entirely spontaneous.                              illustrated in Fig. 1, we predicted that (i) in the spatial (ana-
   Here, we addressed the question of whether spontaneous            tomic) domain, visual hallucinations would be associated
brain activity evokes unprompted cognitive behaviours, by            with distributed activity across the visual system, similar to
examining participants with Charles Bonnet syndrome
                                                                     activations evoked by veridical vision in the sighted and by
(CBS). This condition is characterized by complex visual hal-
                                                                     visual imagery in the blind (Cichy et al., 2012; Dijkstra
lucinations in individuals with a marked visual impairment,
                                                                     et al., 2017, 2019); and (ii) in the temporal domain, unlike
in the absence of a cognitive or mental disorder (de Morsier,
                                                                     in other visual experiences, a build-up of activity in visual
1936, 1967; Teunisse et al., 1996). As individuals with CBS
                                                                     areas would precede the emergence of hallucinations. Such
typically are unable to control the occurrence or the content
                                                                     findings would suggest that temporal, rather than spatial,
of these hallucinations, hallucinations are genuinely un-
                                                                     aspects of neural activity differentiate between unprompted
prompted perceptual behaviour. Furthermore, as neurons
                                                                     visual hallucinations and other cued visual experiences.
deprived of external inputs demonstrate enhanced spontan-
eous brain activity (Echlin et al., 1952; Loeser and Ward,
1967; Segal and Furshpan, 1990), it has been theorized that
spontaneous activity in the deprived visual cortex of individ-       Materials and methods
uals with CBS may subserve hallucinations (Cogan, 1973;
Burke, 2002; Plummer et al., 2007; Reichert et al., 2013).           Participants
   This hypothesis is particularly appealing in light of studies     This study reports findings from five late-onset blind/visually-
showing that, in sighted individuals, spontaneous (resting-          impaired individuals diagnosed with CBS (age 47 ± 8.9, two
state) activity can activate the entire visual system in aspects     females, two left handed, one ambidextrous), 11 late-onset blind
that are similar to those induced by naturalistic visual stimuli     individuals not experiencing visual hallucinations (blind control
(Nir et al., 2006; Gilaie-Dotan et al., 2013; Wilf et al., 2017;     group, age 40.54 ± 11, four females, two left handed, one ambi-
Strappini et al., 2018). It is therefore possible that, in the ab-   dextrous) and 13 sighted individuals with normal or corrected-
sence of visual input, the existing neural mechanism that            to-normal vision (sighted control group, age 43.85 ± 7.4, 10
typically underlies veridical vision, and spans the entire vis-      females, two left handed). Experimental groups did not differ in
ual cortex, may instead be activated by random spontaneous           age, gender or handedness (all P-values 4 0.27, Fisher’s exact
fluctuations. The triggering of the existing network-wide            test). Participants had no history of psychiatric illness or cogni-
neural cascade by spontaneous activity might explain why             tive impairments, and were not taking any psychoactive medica-
                                                                     tions. Recruitment of participants was carried out with the
the resulting hallucinations in CBS can be as vivid as they
                                                                     assistance of a neuro-ophthalmologist, and through standard
are in normal vision (Teunisse et al., 1996; Menon, 2005).
                                                                     advertisements. All participants provided written informed con-
   Support for this hypothesis is, however, lacking. Previous        sent before participating, in accordance with the Declaration of
studies of CBS have associated hallucinations with isolated          Helsinki, and were paid for their participation in the study. All
visual regions (Ffytche et al., 1998; Adachi et al., 2000;           procedures were approved by the Tel-Aviv Sourasky Medical
Santhouse et al., 2000; Kazui et al., 2009; Painter et al.,          Center, IRB ethics committee. Table 1 presents demographic,
2018), for example, in the surround of the fusiform gyrus            clinical and hallucination phenomenology information of the
(Ffytche et al., 1998), rather than with the entire visual cor-      CBS participants (see also Supplementary material,
tex. Yet, given the interconnected nature of visual areas            ‘Hallucination phenomenology’ section).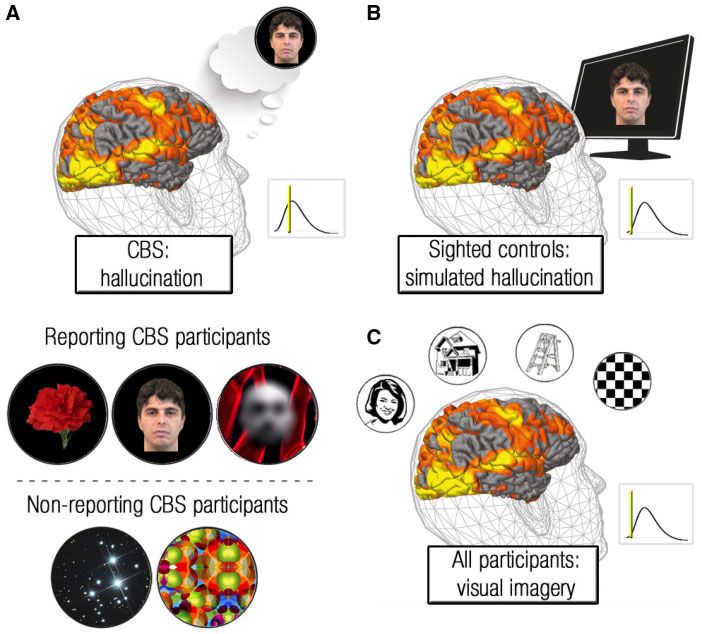
342   | BRAIN 2021: 144; 340–353                                                                                                       A. Hahamy et al.

                                                                                                                                                           Downloaded from https://academic.oup.com/brain/article/144/1/340/6053150 by guest on 31 March 2021
 Figure 1 Schematic of experimental design and participants. (A) Top: Individuals with CBS were asked to verbally/manually report their
 visual hallucinations while in the MRI scanner. Inset: Schematic of blood oxygenation level-dependent (BOLD) signal in the visual system, vertical
 line represents the timing of hallucination report. The hypothesis for this condition is that activation in the visual system would ramp up prior to
 the perception of hallucinations. Bottom: Schematic of hallucination content of all CBS participants (Table 1). Top row depicts the hallucinatory
 content of the three CBS participants who were able to report their hallucinations; bottom row depicts the hallucinatory content of the two par-
 ticipants who were unable to report their hallucinations (see ‘Materials and methods’ section). (B) Verbal reports of hallucinations of the CBS
 participant were illustrated as movies, which were presented to sighted control participants. Inset: The experimental hypothesis of this condition
 is that activation in the visual system would ramp up only after visual stimuli are perceived. (C) All participants completed a visual imagery scan,
 in which they were asked to imagine faces, houses, objects and patterns. Inset: The hypothesis for this condition is that activation in the visual sys-
 tem would ramp up only after visual imagery has initiated. As depicted in this figure, visual hallucinations, like other visual experiences, were
 hypothesized to activate the entire visual hierarchy.

Experimental design                                                            45 min and 120 min. In aggregate, these sessions included
                                                                               one resting-state scan (all groups), one to two imagery scans
We aimed to study hallucinations (unprompted perceptual
                                                                               (all groups), an anatomical scan (all groups), a verbal-man-
events) in CBS as a model for unprompted behaviours. To isolate
                                                                               ual control condition (CBS participants/blind controls), and
the unprompted component of hallucinations, we compared hal-
lucinations in CBS to cued veridical vision in sighted controls                one visual localizer scan (sighted controls). We also con-
who were presented with visual simulations of these hallucina-                 ducted two to four hallucination scans reported verbally or
tions. However, while the unprompted nature of visual hallucina-               using button-presses for each CBS participant, and for
tions differentiates them from veridical vision, another difference            sighted controls, we conducted six simulated hallucination
is that hallucinations are internally generated while veridical vi-            scans (as elaborated below). The order of scans was counter-
sion is evoked by external stimulation. To control for this differ-            balanced across participants with the exception that the first
ence, we further compared hallucinations to cued visual imagery,               session always began with a resting-state run. Analyses of
as both of these conditions are internally generated, but only hal-            the visual localizer and resting state scans will not be
lucinations are unprompted. Finally, to ensure that hallucination-             reported here. Experimental software is detailed in the
related brain activations are not the product of mere verbal/man-              Supplementary material.
ual report, we used a control condition consisting of verbal and
manual tasks that were unrelated to the onsets of hallucinations.
   The experimental procedures included the administration
                                                                               Questionnaires
of questionnaires, and between one and three functional                        Questionnaires were used to collect demographic and clinical
MRI sessions per participant. Session times ranged between                     details. Additionally, the Vividness of Visual Imagery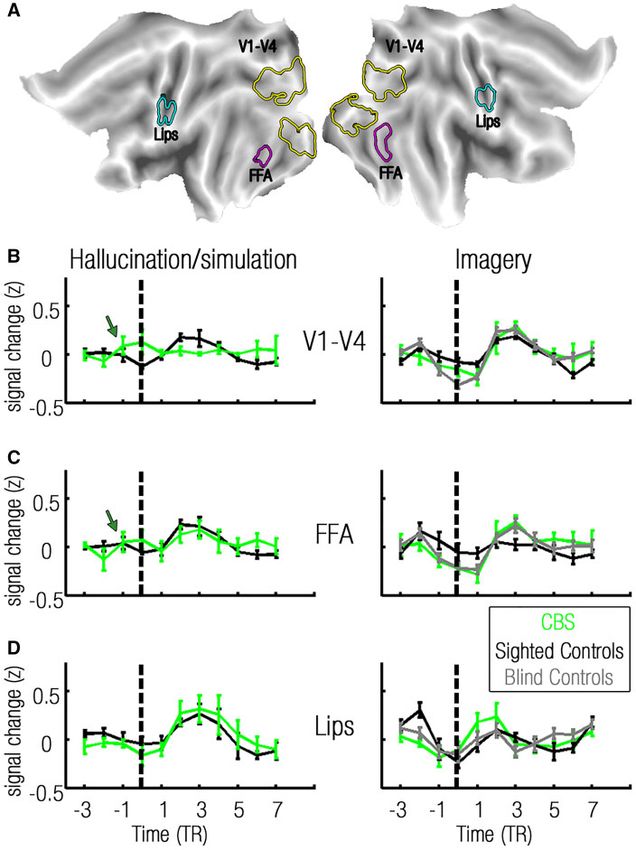
Spontaneous activity drives perception                                                                                              BRAIN 2021: 144; 340–353             | 343

Table 1 Phenomenology of hallucinations in participants with CBS

                             CBS 1                          CBS 2                         CBS 3                          CBS 4                         CBS 5
    Age                      48                             48                            59                             34                            46
    Gender                   Female                         Female                        Male                           Male                          Male
    Handedness               Ambidextrous                   Right                         Left                           Left                          Right
    Visual acuity            No light perception            No light perception           Light perception               6/120                         No light perception
    Time since deterior-     15                             22                            16                             3                             2.5
      ation of vision,
      years
    Diagnosis                Retinitis pigmentosa           Retinitis pigmentosa          Retinitis pigmentosa           Cone-rod dystrophy            Glaucoma
    VVIQ scorea              70                             103                           61                             99                            124
    Hallucinatory content    Continuous stream of           Face of a man who is          Unfamiliar and dis-            Very rapid flashes of         Continuous and rap-
                               still images, including        unfamiliar to the par-         torted black and              light spanning the en-        idly changing
                               humans, animals,               ticipant. The face can         white faces, rotating         tire visual field             shapes and colours

                                                                                                                                                                                     Downloaded from https://academic.oup.com/brain/article/144/1/340/6053150 by guest on 31 March 2021
                               objects, houses, and           appear and disappear           objects, patterns and                                       that resemble kal-
                               patterns                       and can rotate or              flashes of light                                            eidoscope patterns
                                                              move across the vis-
                                                              ual field
    Frequency of             Constant                       Weekly                        Every few months               Constant                      Constant
      hallucinations
    Number of alterna-       123.6 ± 50.5 (four ver-        13.7 ± 4.9 (two verbal        17.5 ± 12 (one verbal          Continuous                    Continuous
      tions in hallucina-      bal and four manual            and one manual re-            and one manual re-
      tions per 8-min          report scans)                  port scans)                   port scans)
      scan, mean ± SD
    Frequency of alterna-    Seconds                        Minutes                       Seconds–minutes                Fractions of a second         Fractions of a second
      tions in hallucin-
      atory content
    Do hallucinations        No                             Yes                           Yes                            Yes                           Yes
      move with gaze?
a
The possible range of the scores in the Vividness of Visual Imagery Questionnaire (VVIQ) across two administrations is 32–160, where low scores indicate higher imagery abilities.

Questionnaire (VVIQ; Marks, 1973) was administered to assess                                  During the button-press runs, Participant CBS1 pressed a but-
how vividly participants imagined different scenes and situa-                               ton using her index finger whenever an image appeared (note
tions. This questionnaire was administered twice, with partici-                             that hallucinatory images were constantly replaced by other
pants’ eyes being open/shut, and the scores across the two                                  images with no interval between them). Participants CBS2 and
administrations were summed per participant.                                                CBS3 pressed a button with the index finger whenever a face
                                                                                            appeared and pressed a second button using the middle finger
                                                                                            when the face disappeared.
Hallucination report
During prescanning simulations, Participants CBS1–3 stated                                  Simulated hallucinations
that they could report their hallucination as easily and promptly                           The temporal structure of the in-scanner verbal reports made by
as they could identify visual stimuli before their vision deterio-                          the CBS participants, along with the post hoc details regarding
rated. Participants CBS4 and CBS5 said they were unable to re-                              the hallucinations’ content, were used to create movies simulat-
port their hallucinations, and were therefore excluded from the                             ing these hallucinatory streams. Three such movies were created,
report condition and subsequent analyses (but were included in                              one corresponding to each of the reporting CBS participants.
all other conditions and analyses). The report condition con-                               The simulated hallucinations of Participant CBS1 consisted of
sisted of several 8-min scans (number of scans depended on the                              images of humans, animals, body parts, objects, houses and pat-
availability/stamina of participants; Table 1), in which partici-                           terns, presented in different sizes and positions on a grey back-
pants provided reports of their hallucinations either verbally, or                          ground. The simulated hallucinations of Participant CBS2
via button presses. Because some CBS participants had some, al-                             consisted of a video recording of a male face, made small
beit minimal, residual vision, participants were instructed to                              enough to move around the grey screen. The simulated halluci-
close their eyes during the entire scanning procedure.                                      nations of Participant CBS3 consisted of various pictures and of
Participants were trained to speak without moving their heads,                              video recordings of faces/patterns, all presented on a grey back-
both outside and inside the scanner.                                                        ground. To account for the possible latency between the true
   In-scanner verbal reports of hallucinations were recorded, and                           onset of hallucinations and the actual reports made by CBS par-
played back to the participants outside the scanner at the end of                           ticipants, all simulated stimuli were presented 1 s prior to their
each session, asking them to give details of these hallucinatory                            real temporal position, as reported by the CBS participants
events. Because the visual acuity of all CBS participants deterio-                          (Ben-Yakov and Henson, 2018).
rated at a relatively late stage of life, their description of the hal-                        Sighted control participants watched these simulated hallucin-
lucinations was based on their prior visual experiences.                                    ation streams in an order that was counterbalanced across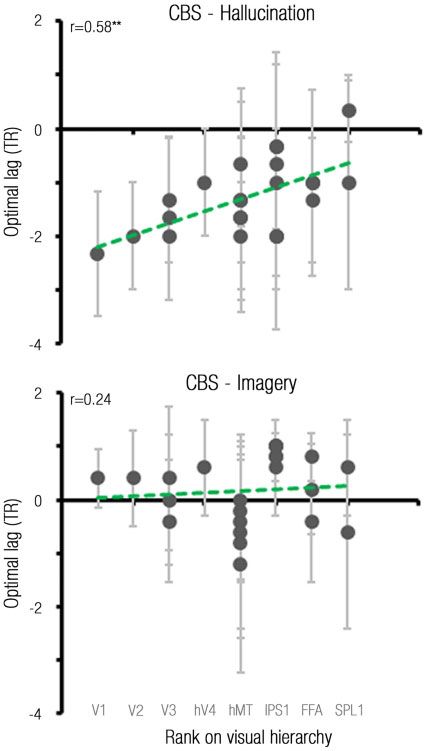
344   | BRAIN 2021: 144; 340–353                                                                                          A. Hahamy et al.

participants. Each simulated hallucination stream was watched          Whole-brain analyses
twice, with instructions to report the hallucinatory content ver-      To create task-based statistical parametric maps, we applied a
bally or using button presses, as the CBS participants did.            voxel-based general linear model (GLM) as implemented in
Participants were trained to speak without moving their heads.         FSL’s FEAT, using a double-gamma haemodynamic response
Two sighted control participants only completed the verbal-re-         function convolved with the experimental model, as well as the
port runs, and additional four participants had one to three of        resulting regressors’ temporal derivatives. The six motion
their six scans excluded from further analyses because of exces-       parameters and their derivatives, scrubbed volumes (Power
sive head motion. Nevertheless, all participants had at least one      et al., 2012), and ventricle and white matter time courses for
valid scan for each simulated hallucination stream.                    each participant (Fox et al., 2009) were used as nuisance regres-
                                                                       sors. In addition, in the simulated hallucinations data, the first/
                                                                       last five repetition times (TRs) of each scan were included in the
Visual imagery                                                         GLM model as nuisance variables, to remove the contribution
All participants were asked to imagine faces, houses, objects          of arousal-related effects. See the Supplementary material for a
and patterns. Before the scan, participants were given examples        detailed description of all GLM designs.

                                                                                                                                              Downloaded from https://academic.oup.com/brain/article/144/1/340/6053150 by guest on 31 March 2021
of items from each category. This 8-min run comprised 12-s                As the sample size of the CBS group was small, whole-brain
blocks, each beginning with an auditory cue signalling a cat-          comparisons between the CBS group and any of the control
egory name. These blocks ended with the auditory instruction           groups were carried out using non-parametric randomization
‘rest’, which was followed by an 8-s resting period. Block order       tests, as implemented in FSL’s randomize (Winkler et al., 2014),
was pseudo-randomized across participants. All participants            including threshold free cluster enhancement correction for mul-
closed their eyes during this experiment. CBS and all blind con-       tiple comparisons. However, because of the inherent differences
trol participants completed two separate runs of this experiment       between the hallucination and the simulated hallucinations con-
(except for two blind controls, who completed only one run),           ditions (as it is impossible to simulate hallucinations with full
and sighted controls completed one run. Data from one blind            precision), we refrained from directly contrasting activation
control were excluded from further analyses due to excessive           strengths between these conditions, as any effects could be
head motion.                                                           equally attributed to differences between hallucinations and ver-
                                                                       idical vision, or to differences in the visual stimuli.
   At the end of each run, participants assessed their success level
in imagining each visual category on an increasing success scale          Parametric activation maps were projected onto a template of
                                                                       a flattened cortical surface using the Connectome Workbench.
of 1–5. These ratings were summed per participant.
                                                                       Quantifying the similarity between visual activations
Verbal-manual control condition                                        Our hypothesis that hallucination-related activations would be
To test whether verbal or manual reports alone evoke activity in       similar to activations evoked by other visual experiences was
the visual system, CBS and blind control participants performed        tested in the posterior part of the brain (25 876 grey matter vox-
a tone discrimination task. During this 8 min 6 s scan, partici-       els corresponding to y 5 44 in MNI space; Gilaie-Dotan et al.,
pants heard a second-long tone of either 440 Hz or 460 Hz,             2013). CBS hallucination activations (group beta values) were
interleaved with silent periods of 3–5 s. Stimulus order was           correlated with imagery/simulated-hallucinations beta values of
                                                                       each sighted control and with imagery/verbal-manual control
pseudo-randomized across participants. Participants spoke/
                                                                       condition beta values in each blind control. This calculation was
pressed a button when presented with the higher/lower fre-
                                                                       performed twice for sighted controls in the simulated-hallucin-
quency tone, respectively. Participants were trained to differenti-
                                                                       ation condition: once modelled using the CBS report protocol,
ate between the two tones before being scanned. Data from one
                                                                       and once using a protocol locked to the sighted controls’ own
blind control were excluded from further analyses due to exces-
                                                                       manual report. In both cases, for each sighted control partici-
sive head motion.
                                                                       pant, analysis was carried out using beta-value maps resulting
   See the Supplementary material for MRI data acquisition and         from an FFX analysis of all three simulated-hallucinations data
preprocessing description.                                             (corresponding to simulations of the three CBS participants’ hal-
                                                                       lucinations). Resulting correlation coefficients of the participants
Statistical analysis                                                   in each group and experimental condition were tested using a
                                                                       two-tailed one-sample Wilcoxon test.
Questionnaires
                                                                          Note that we refrained from statistically testing the posterior
Given the small sample size of participants, here and in all simi-     brain correlations of CBS participants across the different ex-
lar analyses, scores were compared between experimental                perimental conditions, because: (i) any significant similarities be-
groups using non-parametric permutation tests (Holmes et al.,          tween the activations evoked by the imagery/control condition
1996; Nichols and Holmes, 2002). Here, each test statistic was         to those evoked by hallucinations may be confounded by the
set to the difference between the group means. Under the null          fact that CBS participants hallucinated during all conditions;
hypothesis of no group difference in imagery capabilities, partic-     and (ii) any absence of statistical significance could be due to
ipants’ group labels were shuffled to create two random groups         the lack of statistical power in testing very small samples (specif-
of participants, and the difference between these groups’ means        ically, the largest possible effect size in a sample of n = 5 in a
was calculated. This procedure was repeated for all possible per-      Wilcoxon test would correspond with a P-value of 0.03. Any
mutations of participants between the two groups to construct          smaller effect size would be non-significant under an alpha level
the full null distribution, which was used to derive a two-tailed      of 0.05). Nevertheless, we assume that since CBS participants
P-value for the true (unshuffled) test statistic.                      originate from the blind population, any effects found in blind
Spontaneous activity drives perception BRAIN 2021: 144; 340–353 | 345
controls during the imagery/verbal-manual control conditions calculated between the rank of all regions of interest and the
should be representative of similar effects in CBS participants. group-averaged optimal lags in these regions of interest. The
See the Supplementary material for a description of a boot- resulting correlation coefficients were tested using a permutation
strap analysis testing whether the measured correlations were test, under the null hypothesis of no correlation between ranks
driven by noise. across the visual hierarchy and optimal lags. region of interest
ranks across the visual hierarchy were therefore shuffled 10 000
Evaluation of temporal dynamics times, and, each time, the correlation coefficient between
To assess differences in the temporal dynamics of blood oxygen- the random ranks and optimal lags was computed. Two-tailed
ation level-dependent (BOLD) activity between the experimental P-values were derived based on this null distribution.
groups, we extracted signals from an early/intermediate visual
and a fusiform face area (FFA) regions of interest. Sensorimotor Data availability
lip/hand regions of interest were also used as control regions for
the verbal/manual report scans, respectively (see the Statistical data and experimental materials are available upon
Supplementary material for region of interest definitions and request.
Downloaded from https://academic.oup.com/brain/article/144/1/340/6053150 by guest on 31 March 2021
testing of activation in early/intermediate visual regions of
interest).
Single participant’s signals were extracted from each region of Results
interest, z-score normalized and subjected to an event related
averaging analysis, within a time window of 3 TRs prior to Does spontaneous brain activity underlie deprivation-related
stimulus onset to 7 TRs after stimulus onset. These signals were visual hallucinations, and if so, by what mechanism? To an-
later averaged across participants of the same experimental swer these questions, five late-onset blind individuals with
group and for each experimental condition. CBS, 11 late-onset blind controls who did not experience
The BOLD signal typically rises shortly after stimulus presen- hallucinations, and 13 sighted control participants were
tation, but due to noise factors (e.g. slight asynchronies between recruited for an functional MRI study with three main con-
scanner and experimental protocol, inconsistencies in partici- ditions (Fig. 1). CBS participants verbally/manually reported
pants’ attentiveness across trials, etc.) the event-related signals
their hallucinations while being scanned. A visual simulation
for individual participants may show slight random jitter (±1
composed of their hallucinatory streams was later presented
TR) around the true event timings. Here, however, we had a
clear prediction that the BOLD signal in visual regions across all to sighted controls. In addition, all participants completed a
CBS participants should consistently precede the reported onset visual imagery scan.
of hallucinations, unlike in other experimental conditions or in
the control groups. To test this prediction statistically, a canon- Behavioural imagery abilities
ical haemodynamic response function (HRF) was fitted to the
event-related data of each individual participant (this was done Imagery abilities, as assessed using the total score of the
automatically without the possibility of adjustment). This HRF VVIQ questionnaire (Marks, 1973), did not differ between
was fitted to the data five times, each time with a different lag, the CBS (91.4 ± 12.83) and either the blind (69.64 ± 8.34) or
ranging between 3 TRs prior to the modelled neural event (hal- the sighted (78.15 ± 10.64) control groups (P = 0.08 and
lucination/imagery/vision) to 1 TR after the modelled neural 0.23, respectively, two-tailed permutation tests) (Table 1).
event. The HRF lag that produced the best fit between the HRF Similarly, the in-scanner reports of the level to which partici-
and data was identified in each participant. These ‘optimal lags’ pants succeeded in imagining visual categories during the ex-
of the HRF in each region of interest were then compared be-
periment did not differ between the CBS (16.3 ± 1.6) and
tween the CBS group and each of the sighted/blind control
either the blind (17.45 ± 0.54) or the sighted (13.23 ± 1.06)
groups separately, using a permutation test (Supplementary
material). control groups (P = 0.2 and 0.08, respectively, two-tailed
All sighted controls’ simulated-hallucinations data (verbal and permutation tests).
button-press scans) were analysed using a protocol locked to the
hallucination report of CBS participants, and button-press scans Hallucinations and veridical vision
were further analysed using a protocol locked to the individual
button presses of each sighted control participant. The analysis
activate similar visual areas
of the sensorimotor lips/hand regions of interest made use of We first aimed to compare brain activations evoked by hal-
scans involving verbal/button-press reports, respectively. lucinations in the three CBS participants able to provide a
reliable spatiotemporal description of their hallucinations
Quantifying BOLD temporal dynamics across the
(see ‘Materials and methods’ section and Table 1) to activa-
visual hierarchy
tions evoked by veridical vision in sighted controls. As
To assess differences in the onset of the BOLD responses across
depicted in Fig. 2A, a whole-brain analysis of hallucination-
regions of the visual system, all regions of interest of a probabil-
istic atlas (Wang et al., 2015) were ranked based on their pos- related activity in the CBS participants revealed significant
ition in the visual hierarchy (Supplementary Table 1). The activations across the entire visual hierarchy (see
optimal HRF lag was calculated for each CBS participant and Supplementary Figs 1 and 2 for single CBS participants’
region of interest in the hallucination and imagery conditions, maps). The simulated hallucinations in the sighted control
as explained earlier. Then, Spearman’s correlation was group significantly activated the central visual field346 | BRAIN 2021: 144; 340–353 A. Hahamy et al.
representations of early visual areas, as well as areas in the were evoked by auditory, verbal or motor processing in the
ventral stream, including the FFA. Peripheral visual field rep- blind control group, and perhaps in the CBS group as well.
resentations were significantly deactivated (Fig. 2B). However, it seems unlikely that weak activations that appear
The apparent group difference in the spatial extent of vis- in both groups would underlie the emergence of visual hallu-
ual activations between the CBS and sighted controls may cinations, which occurs only in the CBS group.
have been the result of the difficulty in accurately simulating
the internal visual experiences of the CBS participants. For
example, because of technical limitations, some of the dis- Hallucinations and visual imagery in
plays constructed for the simulated hallucinations were
the blind activate similar visual
much smaller spatially than those reported by the CBS par-
ticipants, and may thus have led to reduced activation in areas
peripheral visual areas. Nevertheless, in line with our hy- The unprompted nature of visual hallucinations differenti-
pothesis that hallucinations and veridical vision would evoke ates them from veridical vision. However, another difference
Downloaded from https://academic.oup.com/brain/article/144/1/340/6053150 by guest on 31 March 2021
a similar profile of brain activity (Fig. 1), superimposing the is that hallucinations are internally generated while veridical
contours of significantly activated areas in the CBS group vision is evoked by external stimulation. We next set out to
over the sighted controls’ activation map, revealed that the
compare hallucinations to cued visual imagery, as both are
two patterns of activity overlapped across many regions of
internally generated, but only hallucinations are unprompt-
the visual hierarchy (Fig. 2C). This observation was quanti-
ed. The maps of all experimental groups during the visual
tatively supported by significant inter-group correlation of
imagery condition are presented in Fig. 3 (also see single
activity patterns across the entire posterior part of the brain
CBS participants’ maps during visual imagery in
(median of correlations = 0.2, df = 12, P = 0.002, two-tailed
Wilcoxon test). This profile of overlap was mostly unaltered Supplementary Figs 4 and 5). These maps display a network
when brain activations of sighted controls were not mod- of visual and frontal areas, previously reported to be
elled based on the timings of reports made by CBS partici- involved in visual imagery and visual perception in sighted
pants, but rather on the timing of reports made by the controls (Behrmann, 2000; Ganis et al., 2004; Yellin et al.,
sighted controls themselves (median = 0.11, df = 12, 2015; Dijkstra et al., 2017). As depicted in Fig. 3, left, while
P = 0.006, two-tailed Wilcoxon test; Supplementary Figs 1 the sighted control group tended to activate only higher-
and 2. Note that modelling of the sighted controls’ own order visual areas and deactivate mid-level areas, both the
reports was done on those scans in which participants CBS and blind control groups showed activations across the
reported manually, which comprised half of the data). visual system, which reached significance in both lower- and
Furthermore, these correlations were significantly greater higher-order visual areas. A direct comparison of whole-
than would have been expected by noise, as estimated using brain activations between the CBS and each of the control
shuffled data (P 5 0.001/P = 0.01 for CBS-locked/controls- groups revealed no significant differences.f
locked protocols, respectively, two-tailed permutation tests). As expected by the visual inspection of the sighted con-
It could be argued that the hallucination-related activa- trols’ group map (Fig. 3C), no evidence for similarity be-
tions in the CBS group were not related to the self-generated tween imagery activations in the sighted controls and
visual precepts, but rather to the attentional and report- hallucination-related activations in the CBS group was
related aspects of the experiment. To test this possibility, found in the posterior part of the brain (median = 0.13,
CBS participants and blind controls completed a tone dis- df = 12, P = 0.09, two-tailed Wilcoxon test). However, a
crimination task in which they responded manually or ver- visual inspection of the left panel of Fig. 3 suggested that
bally to specific tones. As presented in Supplementary Fig. the contours of hallucination-activated areas in the CBS
3A (also see Supplementary Figs 4 and 5 for maps of single
group largely matched the spatial activations seen during
CBS participants), blind controls showed weak activations in
visual imagery in the CBS and blind control groups. This
parts of the visual system during this task, which showed
observation was confirmed quantitatively in the blind
some resemblance to the spatial patterns of hallucination-
control group (median = 0.16, df = 9, P = 0.002, two-
related activations (median = 0.09, df = 9, P = 0.05, two-
tailed Wilcoxon test), and correlations were significantly
tailed Wilcoxon test). These correlations were also greater
than would have been expected by noise (P = 0.01, two- greater than those expected by noise (P 4 0.001, two-
tailed permutation test). A qualitative examination of tailed permutation test). We note that the ability to test
Supplementary Fig. 3B and C revealed that these report- for similarities between the spatial activation patterns
related activations were diminished in the CBS group map evoked by hallucinations and imagery in the CBS group
(here the ability to directly test for similarity to the spatial is compromised because of statistical and methodological
patterns of hallucination-related activations is compromised reasons (see ‘Materials and methods’ section). However,
due to statistical/methodological reasons, see ‘Materials and our results suggest that visual hallucinations in CBS and
methods’ section). A whole-brain between-group contrast visual imagery in the blind (the population from which
revealed no significant differences between the CBS and CBS emerges) tend to evoke similar spatial patterns of
blind control groups. Thus, some weak visual activations activations in the posterior brain.Spontaneous activity drives perception BRAIN 2021: 144; 340–353 | 347
Downloaded from https://academic.oup.com/brain/article/144/1/340/6053150 by guest on 31 March 2021
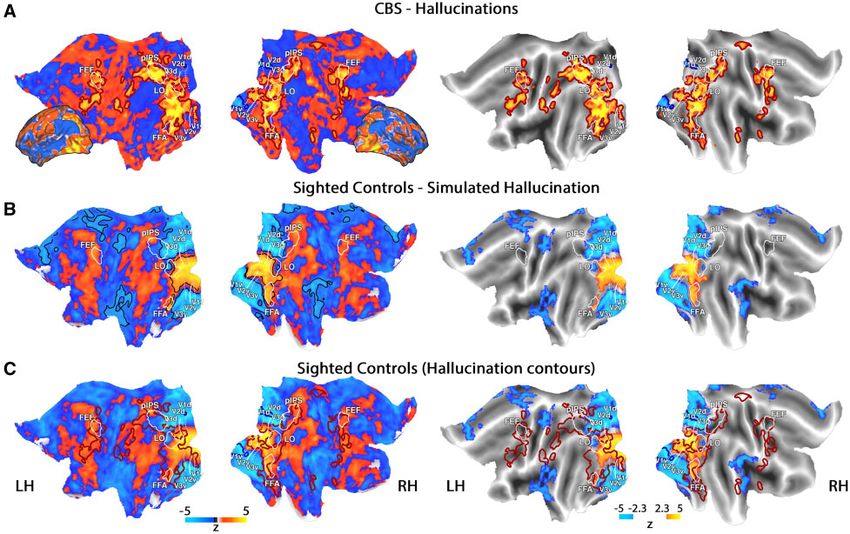
Figure 2 Hallucination compared to normal vision. Left column: Unthresholded maps; right column: The same maps with a statistical
threshold, corrected for multiple comparisons. (A) CBS group maps in the hallucination condition (hallucination versus baseline), projected onto
a representative flat cortical surface (the same map projected onto an inflated cortical surface is presented for reference). Wide red/blue con-
tours depict significant areas of activation/deactivation, corrected for multiple comparisons. (B) Sighted control group maps in the simulated hal-
lucination condition (simulated hallucinations versus baseline). Black contours depict significant areas of activation or deactivation, corrected for
multiple comparisons. (C) The same group maps of the sighted controls in the simulated-hallucination condition, as presented in B, superim-
posed with the significant areas activated/deactivated during hallucinations in the CBS group (wide contours, as in A). White contours depict vis-
ual landmarks, based on a probabilistic atlas. FEF = frontal eye field; LH = left hemisphere; LO = lateral occipital complex; pIPS = posterior
intraparietal sulcus; RH = right hemisphere. See Supplementary Figs 1 and 2.
The temporal dynamics of To test whether the rise of the BOLD signal in CBS partic-
hallucinations differ from those of ipants during the hallucination condition precedes that of
controls during the simulated-hallucination condition
veridical vision and visual imagery (Fig. 1), we first examined the neural dynamics of a bilateral
We next hypothesized that although activations evoked by early/intermediate visual region of interest comprising areas
hallucinations show some spatial overlap with those evoked V1–V4 (Fig. 4A), which showed a significant BOLD signal
by veridical vision in the sighted and visual imagery in the increase during hallucinations (P = 0.04, one-tailed permuta-
blind, they may differ in their temporal dynamics. As sche- tion test). As depicted in Fig. 4B, in the sighted control
matically illustrated in Fig. 1, we expected that both the ex- group, the appearance of stimuli in the simulated-hallucin-
ternal perception and cued imagery of stimuli would bring ation condition was accompanied by a rise in the BOLD sig-
about a rise in the BOLD response in visual areas. This nal (mean optimal lag –0.26 TR). Importantly, and
would suggest that the optimal fit of an HRF to the data consistent with our hypothesis, the BOLD signal in the CBS
would be expected when there is a negligible lag (of no group began building up 2.33 TRs on average before the
more than 1 TR) between the data and HRF. Contrary to reported onset of hallucinations in the early/intermediate vis-
this, we hypothesized that a rise in the visual BOLD re- ual region of interest. This difference in the temporal dynam-
sponse would precede hallucinations. This would require ics between the CBS and sighted control groups was
that the optimal fit of an HRF to the data would be at a statistically significant in this region of interest (P = 0.002,
negative lag, such that the BOLD signal begins rising prior one-tailed permutation test), and also in an additional early/
to hallucination onset. intermediate visual region of interest composed only of348 | BRAIN 2021: 144; 340–353 A. Hahamy et al.
Downloaded from https://academic.oup.com/brain/article/144/1/340/6053150 by guest on 31 March 2021
Figure 3 Hallucination compared to visual imagery. Left column: Unthresholded maps; right column: the same maps with a statistical
threshold, corrected for multiple comparisons. Group maps of the CBS group (A), blind control group (B), and sighted control group (C) during
the visual imagery condition (imagery versus baseline). These maps are overlaid with the contours of areas activated/deactivated during hallucina-
tions in the CBS group (as presented in Fig. 2, wide contours). Note the spatial overlap between hallucination and imagery activations in both the
CBS and blind control groups in the left panel. FEF = frontal eye field; LH = left hemisphere; LO = lateral occipital complex; pIPS = posterior
intraparietal sulcus; RH = right hemisphere. See also Supplementary Figs 4 and 5.
voxels which were significantly activated by hallucinations controls) is not a general temporal characteristic of their vis-
(P = 0.003, one-tailed permutation test). A similar effect was ual system, but rather a unique manifestation of
also observed when the modelled events in sighted controls hallucination.
were based on their own responses in the scans involving To examine activations in higher order visual regions, we
manual report (half the scans), rather than on the reports of chose the bilateral FFA (Fig. 4A), both because all reporting
the CBS participants across all scans (sighted controls opti- CBS participants hallucinated faces (Table 1), and because
mal lag –0.97 TRs, P = 0.056 one-tailed permutation test; the fusiform gyrus has been previously reported to show a
Supplementary Fig. 6). build-up of activity prior to the onset of hallucinations in
Importantly, the group difference in temporal dynamics CBS participants (Ffytche et al., 1998). As depicted in
was not observed during the cue-driven imagery scans. Fig. 4C, a build-up of activity in the FFA did indeed precede
During imagery, the temporal dynamics of the CBS group hallucinations in the CBS group (mean optimal lag: –1 TR),
(mean optimal lag 0.6 TRs) did not differ from those of replicating previous findings (Ffytche et al., 1998). While
sighted controls (mean optimal lag –0.75 TRs, P = 0.09, this difference did not reach significance when the protocol
two-tailed permutation test) or of blind controls (mean opti- of sighted controls was locked to the CBS participants’ re-
mal lag: –0.3 TRs, P = 0.07, two-tailed permutation test). A port in both manual and verbal scans (sighted controls opti-
significant group (CBS, Sighted controls) condition mal lag: –0.3 TRs, P = 0.32, one-tailed permutation test),
(Hallucination/simulated-hallucination, Imagery) interaction significant results were found when using a protocol locked
(sighted controls’ protocol locked to the CBS participants’ to the sighted controls’ reports in the manual scans (sighted
report: P = 0.01; protocol locked to the sighted controls’ re- controls optimal lag: 0.3 TRs, P = 0.04, one-tailed permuta-
port: P = 0.04, two-tailed permutation tests) indicated that tion test). This relatively weak effect is reflected in the bi-
the earlier build-up of activity in the CBS participants during modal shape of the averaged FFA signal, which captures the
hallucination (compared to veridical vision in the sighted higher variability between the temporal dynamics of singleSpontaneous activity drives perception BRAIN 2021: 144; 340–353 | 349
Downloaded from https://academic.oup.com/brain/article/144/1/340/6053150 by guest on 31 March 2021
Figure 4 Hallucination, vision and visual imagery have different temporal dynamics. (A) Regions of interest V1–V4 (yellow con-
tours), FFA (purple contours), lip areas (light blue contours). (B) Event-related averaging of group activations within each region of interest.
Rows correspond with regions of interest (top row: V1–V4; middle row: FFA; and bottom row: lip region), and columns correspond with experimen-
tal conditions (hallucination in CBS participants and simulated hallucination in sighted controls in the left column, and visual imagery in the right col-
umn). Groups are represented by green, black and grey lines for CBS, sighted controls, and blind controls, respectively. Dashed lines depict
hallucination onset (CBS), stimulus appearance in the visual condition (sighted controls) and onset of imagery instruction in the imagery condi-
tion. Note that visual (V1–V4, FFA) activations in the CBS group precede the onset of hallucinations, as marked with dark green arrows. This is
unlike non-visual activations (lips region of interest) in the CBS group, simulated-hallucination activations in the sighted control group and imagery
activations in all groups. See also Supplementary Figs 6–8.
CBS participants in this region compared to the dynamics in note this effect is likely due to the reduced FFA activation
the early/intermediate visual region of interest during imagery in the sighted controls). A similar effect was
(Supplementary Table 2). An opposite effect was observed in found when comparing the CBS to the blind control group
the visual imagery condition, as the mean optimal HRF lag (optimal lag: 0.3 TRs, P = 0.04, two-tailed permutation test).
of the CBS group (0.8 TRs) was significantly delayed com- This slightly delayed rise in signal in the CBS versus blind
pared to the mean optimal lag of the sighted control group control participants may reflect slower initiation of imagery
(–1.1 TRs, P = 0.01, two-tailed permutation test, though upon instruction in CBS participants, possibly due to350 | BRAIN 2021: 144; 340–353 A. Hahamy et al.
interference of hallucinatory visual precepts. The observation hallucinations in participants with CBS, we tested for a cor-
of an earlier build-up of activity in CBS participants during relation between visual ranks and optimal lags in the CBS
hallucinations compared to imagery, and compared to group during the imagery condition, and found no evidence
sighted control participants was supported by a significant for such a relation (r = 0.24, P = 0.13, two-tailed permuta-
group (CBS, sighted controls) by condition (hallucination/ tion test).
simulated-hallucinations, imagery) interaction (sighted con-
trols’ protocol locked to CBS report: P = 0.02, protocol
locked to the sighted controls’ report: P 5 0.001, two-tailed Discussion
permutation tests).
Here, we demonstrate that visual hallucinations, much like
Of significance, no build-up of activity in the CBS group
any other type of visual experience, engage the entire visual
was observed in areas engaged in the hallucination condi-
system. We additionally report that, unlike other types of
tion, but located outside the visual system proper. CBS par-
visual experiences, visual hallucinations are related to a
ticipants showed a slightly delayed BOLD signal in the
Downloaded from https://academic.oup.com/brain/article/144/1/340/6053150 by guest on 31 March 2021
spontaneous build-up of neural activity, which is most pro-
motor lips area (optimal lag: 0.33 TR) compared to sighted
nounced in early visual cortex, and decays along the visual
controls (optimal lag: –0.49 TR, P = 0.03 two-tailed permu-
hierarchy. Taken together, our findings propose a network
tation test) in the scans involving verbal report of hallucina-
view of visual hallucinations in CBS, under which a slow
tions. Similarly, CBS participants showed a slightly delayed
build-up of spontaneous neural activity in early visual
BOLD signal in the motor hand area (optimal lag: 0 TR)
regions may bring about a perception of vision by triggering
compared to sighted controls (optimal lag: –0.47 TR,
a cascade of activity throughout the visual system.
P 5 0.001, two-tailed permutation test) in the scans involv-
Our findings suggest a plausible mechanism underlying
ing manual report of hallucinations. A significant interaction the emergence of visual hallucinations in CBS. Specifically,
between groups (CBS, sighted controls) and regions of inter- deafferentation of the visual system may lead to over-excit-
est (early/intermediate visual cortex, lips region: P 5 0.001; ability in visual areas (Desai et al., 1999; Burke, 2002;
early/intermediate visual cortex, hand region: P 5 0.001, Reichert et al., 2013; Painter et al., 2018), and to enhanced
two-tailed permutation tests) confirmed that the early build- susceptibility to noise fluctuations. Given the normally-
up of activity in the CBS compared to the sighted control developed hierarchical structure of the visual system in (pre-
group was specific to the visual cortex. viously sighted) individuals with CBS, when an activation
Supplementary Figs 7 and 8 present the temporal dynam- threshold in early visual regions is crossed by a spontaneous
ics in the brains of single CBS participants compared to the fluctuation, a cascade of activations across the visual hier-
relevant sighted controls’ data, based on events locked to the archy may lead to the emergence of visual hallucinations
CBS or sighted controls’ report. (Moutard et al., 2015). Further imaging studies are needed
for clarifying the unique characteristics of spontaneous brain
Signals preceding hallucinations activity in individuals with CBS compared to non-hallucinat-
diminish across the visual hierarchy ing blind individuals.
Unlike our findings, studies of sighted patients with
The above analyses of our data revealed that although hallu- dementia-related visual hallucinations reported a reduction
cinations engage the entire visual system, the extent to which in visual activation (Meppelink et al., 2009; Goetz et al.,
neural activity builds up prior to hallucination may vary 2014), which may indicate that hallucinations are a product
across visual brain regions. We therefore aimed to examine of impaired bottom-up processing of external visual stimuli.
whether there was a trend in the ‘propagation’ of this pre- However, we propose that hallucinations in CBS are related
ceding signal across the visual hierarchy. Of importance, to intact bottom-up visual processing, but are a product of
when measuring evoked visual responses, synaptic lags along internal, rather than external, visual inputs (as individuals
the cortical hierarchy are too rapid to be captured using with CBS are visually deprived). Thus, our findings do not
functional MRI (Dijkstra et al., 2020). However, since spon- offer a unified account for visual hallucinations across many
taneous brain activity is composed of ultra-slow fluctuations disorders, but instead illuminate the possible role of spontan-
(Nir et al., 2008), its decay across the visual system could be eous brain activity in evoking visual hallucinations conse-
captured despite the sluggishness of the BOLD signal. quent to visual deprivation.
Indeed, as depicted in Fig. 5, a significant correlation was In this interpretation, we assume that the activity seen in
found in the CBS group during hallucination, such that the visual system of blind individuals is spontaneous (Echlin
lower-level visual areas demonstrated an earlier build-up of et al., 1952; Loeser and Ward, 1967; Segal and Furshpan,
activity relative to hallucination report, compared to higher- 1990). Yet, it is also possible that the visual system of these
order visual areas (r = 0.58, P = 0.004, two-tailed permuta- individuals is activated by inputs from other brain areas
tion test, see Supplementary Table 3 for correlations in sin- processing non-visual information (cross-modal plasticity;
gle CBS participants). Edelman, 1993; Amedi et al., 2003; Collignon et al., 2011;
To evaluate whether the ordered propagation of preceding Renier et al., 2014). However, the extent of cross-modal
signals across the visual system is distinctive of plasticity in the late blind is still debated (Collignon et al.,Spontaneous activity drives perception BRAIN 2021: 144; 340–353 | 351
should be rapid propagation of activation across the visual
system (Dijkstra et al., 2020) leading to an ‘artificial build-
up’ of activity across the entire visual hierarchy. However,
this possibility is contradicted by our findings of a decaying
activity build-up across the visual hierarchy (Figs 4 and 5). It
is therefore more likely that the anticipatory signals reflect
accumulation of spontaneous activity prior to hallucination
onset, rather than hallucination-evoked activity which pre-
cedes the onset of report.
While our findings indicate an endogenous trigger for vis-
ual hallucinations in CBS, a recent EEG study proposed that
hyperexcitability in the early visual cortex of elderly, partial-
ly blind CBS individuals, is related to external visual stimula-
Downloaded from https://academic.oup.com/brain/article/144/1/340/6053150 by guest on 31 March 2021
tion (Painter et al., 2018). Another case study of an elderly
individual with CBS and mild sensorineural deafness
ascribed hallucinations to external auditory stimulations of
the early visual cortex (Vacchiano et al., 2019). Given the
difficulty in recruiting large samples of CBS participants
(Teunisse et al., 1996; Plummer et al., 2007; Cox, 2014),
and given the demographic and clinical differences in the
recruited samples in the three studied, we cannot exclude the
possibility of a heterogeneous mechanism for hallucinations,
combining both internal and external stimulation of the
hyperexcitable early visual cortex. However, in our sample
of participants, the observation of a slow, anticipatory
build-up of activity in the visual cortex prior to hallucination
onset cannot be accounted for by external stimulation. Our
study clearly demonstrates that hallucinations in CBS can be
evoked in the absence of external visual information.
As such, our findings provide unique insight into the pos-
sibility that spontaneous brain activity can evoke conscious
Figure 5 Hallucination-related preceding signals decay percepts by triggering existing neural cascades. This observa-
along the visual hierarchy. The top and bottom plots present the
tion is compatible with previous hypotheses regarding the
data of the CBS group in the hallucination and imagery conditions,
role of the slow spontaneous activity in initiating internally-
respectively. X-axes represent the hierarchical rank of visual regions
of interest (Supplementary Table 1), grey labels depict one repre-
generated behaviour (Schurger et al., 2013; Moutard et al.,
sentative region of interest from each ranking category. Y-axes rep- 2015), which could be directly tested here due to the unique
resent the optimal lag of the HRF relative to stimulus onset, as characteristics of CBS. Taken together, these findings raise
fitted to signals from these regions of interest. Dots depict group the intriguing possibility that spontaneous network dynamics
means for regions of interest and error bars depict standard devia- may underlie many types of internally-generated behaviours.
tions. IPS = intraparietal sulcus; SPL = superior parietal lobe. For example, it is tempting to conjecture that if accumulation
of spontaneous activity in the visual system of blind individu-
als can ignite visual hallucinations, a similar mechanism may
also be implicated in more typical forms of unprompted and
2013; Voss, 2013). Additionally, hallucinations in our sam- deprivation-related percepts, such as in dreaming.
ple of CBS participants appeared in the absence of any exter-
nal sensory trigger, suggesting that sensory inputs did not
elicit the hallucinations.
Limitations
It could also be argued that the slow build-up of activity Since CBS is rare, our sample size was small and heteroge-
observed in the hallucination condition may simply reflect a neous in both the phenomenology of hallucinations, and in
delay between hallucination onset and its report, due to the neural responses to visual hallucinations. Some of the small
elusive nature of the hallucination. However, all CBS partici- reported effects may therefore relate to a reduction in statis-
pants included in this condition indicated that they could re- tical power. It is worth noting, however, that despite the het-
port their hallucinations as promptly as they could report erogeneity, all three participants evinced the same activation
visual stimuli before their vision deteriorated. Moreover, if profile with the slow build-up of activation in early visual
this hypothetical confound actually held, hallucinations cortex. Additionally, we acknowledge that it is impossible to
should evoke an increase in BOLD signal, similarly to veridi- simulate accurately the content/timing of hallucinations be-
cal vision (Fig. 1B). A consequence of this is that there cause (i) our only access to the visual experiences of the CBSYou can also read