Mindful Dating Online: An Examination of the Effects of Mindfulness on Dating Success - Harvard DASH
←
→
Page content transcription
If your browser does not render page correctly, please read the page content below
Mindful Dating Online: An
                Examination of the Effects of
               Mindfulness on Dating Success
                  The Harvard community has made this
               article openly available. Please share how
               this access benefits you. Your story matters

Citation              Tateyama, Josephine M. 2020. Mindful Dating Online: An
                      Examination of the Effects of Mindfulness on Dating Success.
                      Master's thesis, Harvard Extension School.

Citable link          https://nrs.harvard.edu/URN-3:HUL.INSTREPOS:37365615

Terms of Use          This article was downloaded from Harvard University’s DASH
                      repository, and is made available under the terms and conditions
                      applicable to Other Posted Material, as set forth at http://
                      nrs.harvard.edu/urn-3:HUL.InstRepos:dash.current.terms-of-
                      use#LAA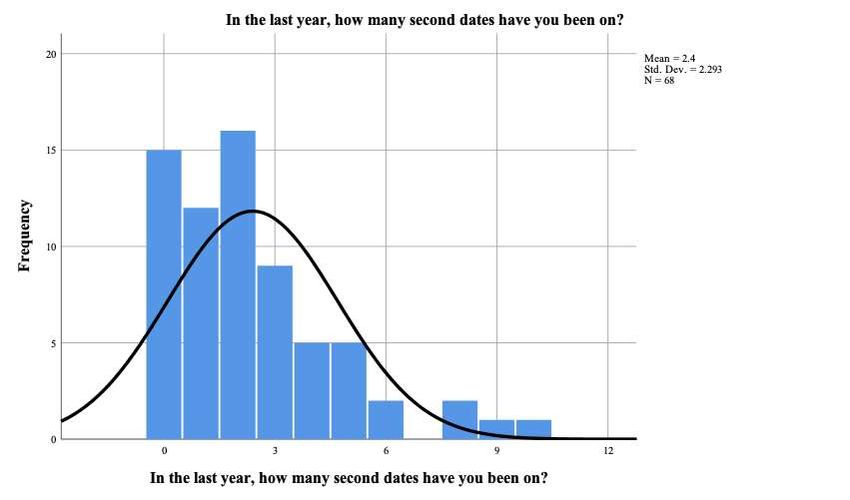
Mindful Dating Online:

An examination of the effects of mindfulness on dating success

                 Josephine Maya Tateyama

             A Thesis in the Field of Psychology

for the Degree of Master of Liberal Arts in Extension Studies

                     Harvard University

                          July 2020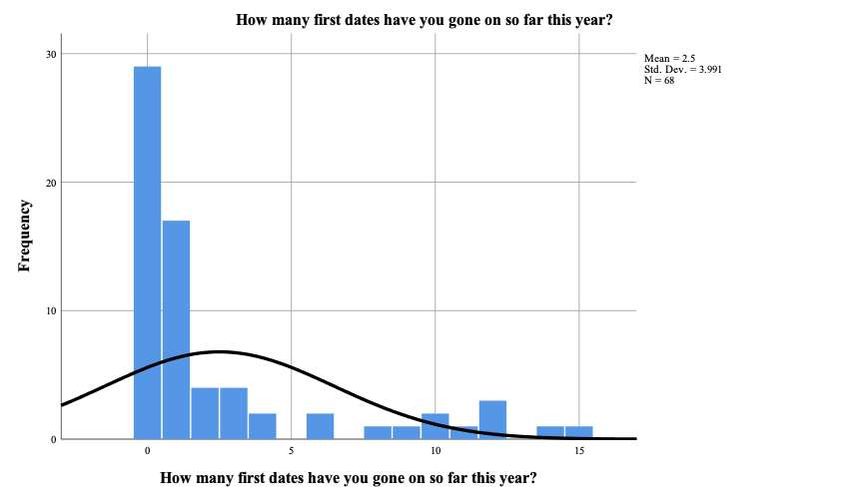
© 2020 Josephine Maya
                  i Tateyama
Abstract The present study investigated how trait mindfulness relates to dating outcomes. An online survey was conducted on 68 self-reported heterosexual men between 25 and 43 years old. Contrary to expectations, no significant associations were found between trait mindfulness and dating success, as measured by the number of total first and second dates in the past year. Despite these findings, this research adds to the growing body of research on mobile dating applications, as no studies have yet investigated associations between trait mindfulness and dating outcomes.
Dedication

I dedicate this thesis to my dear friend, Anthony Patrick Sylvester, you believed in me

and pushed me to go back to school. I am sorry you are not here to see me accomplish

our plans. I also would like to dedicate this thesis to my dear Aunt Martha.

                                                iii
Acknowledgments
I would like to acknowledge my research advisor Dr. Dante Spetter, as well as Dr. Ellen
Langer and Dr. Jack Demick for their patient guidance and support. I also would like to
express the deepest gratitude to my thesis director, Dr. Dante Spetter, for her tireless
availability, help and advice. A huge thank you to Dr. Christelle Ngnoumen, I will always
associate our time at Harvard as “Study Party” time, thank you for all your assistance
with this project. Lastly, I would like to acknowledge my mother for all her love, support
and encouragement.
ivTable of Contents
Abstract ............................................................................................................................... ii
Dedication .......................................................................................................................... iii
Acknowledgments.............................................................................................................. iv
Chapter I Introduction ..........................................................................................................1
Technology and online dating applications .............................................................2
Mindfulness..............................................................................................................3
Mindfulness & dating I: Mindfulness predicts relationship satisfaction .....4
Mindfulness & dating II: Understanding the online dating experience .......5
Chapter II Method ................................................................................................................8
Study hypotheses .........................................................................................8
Participants ...................................................................................................9
Materials and measures ..........................................................................................11
Demographics ............................................................................................11
Socio-cognitive mindfulness......................................................................12
Dating success and single-item measures ..................................................12
Research design and procedures ............................................................................13
Pilot testing ................................................................................................15
Data cleaning .............................................................................................15
Data screening ............................................................................................15
Primary analyses ........................................................................................18
Mindfulness and dating outcomes .............................................................18
vChapter III Results .............................................................................................................19
Relationship history ...................................................................................22
Dating experience characteristics ..............................................................25
Descriptive statistics ..................................................................................29
Mindfulness and dating and relationship history .......................................33
Mindfulness and dating outcomes .............................................................35
Pearson’s correlation method .....................................................................35
Chapter IV Discussion .......................................................................................................45
Interpretation of the findings .....................................................................45
Research limitations and weaknesses ........................................................46
Recommendations for future research .......................................................50
Conclusion .................................................................................................51
Additional Sections (Appendices) .....................................................................................52
Appendix A Recruitment Material.....................................................................................53
Appendix B Letter of Informed Consent ...........................................................................54
Appendix C Relationship History Questions .....................................................................60
Appendix D Online Dating Behavior Characteristics Questions .......................................61
Appendix E The Langer Mindfulness Scale (LMS14) ......................................................63
Appendix F Demographic Questions .................................................................................64
References ..........................................................................................................................66
viList of Tables
Table 1. Demographic characteristics of all participants .................................................20
Table 2. Relationship history of all participants ...............................................................23
Table 3. Responses to survey question - Which of the following statements best describes
your attitude toward seeking a relationship? ....................................................................24
Table 4. Dating experience characteristics of all participants..........................................26
Table 5. Online Dating usage for participant having experience with online dating apps27
Table 6. Responses to survey question - Which online dating sites have you used?
(Choose which one you have used) ....................................................................................28
Table 7. Means, standard deviations of the continuous outcome variables ......................30
Table 8. Correlations between main variables and demographic variables .....................34
Table 9. Pearson’s product moment correlations for mindfulness scales and dating
outcome scores for all participants....................................................................................37
Table 10. Spearman correlations between mindfulness and dating outcome scores ........40
Table 11. Pearson’s product moment correlations for mindfulness scores and dating
outcome scores for participants when potential outliers were excluded ...........................42
Table 12. Comparison of Pearson’s product moment correlations for overall mindfulness
scores and number of first dates between two samples .....................................................43
Table 13. Comparison of Pearson’s product moment correlations for overall mindfulness
scores and number of second dates between two samples.................................................44
viiList of Figures
Figure 1. Histogram of frequency of distribution for the total number of first dates ........31
Figure 2. Histogram of frequency of distribution for the total number of second dates....32
viiiChapter I
Introduction
During the past two decades, the use of online dating platforms to initiate a
romantic relationship has seen a marked increase. According to the Pew Research Center
(2016), 15% of United States adults polled reported having used online dating websites or
mobile dating applications (Smith, 2016). Attitudes towards the use of online dating have
shifted in the past decade as well; whereas it was once stigmatized as being only for the
“desperate” (e.g., Baker, 2002; Gibbs, Ellison, & Heino, 2006; Madden & Lenhart,
2006), online dating is now considered a viable way for relationship-seekers to meet a
prospective date (e.g., Rosenfeld & Thomas, 2012).
In fact, it is now common for individuals who initially meet online to marry. For
instance, in a national representative sample (N =19,131) taken between 2005 to 2012, it
was found that approximately one in three marriages in the United States were formed via
online meeting sites, with 45% of those couples specifically indicating that they met
through online dating sites (Cacioppo, Cacioppo, Gonzaga, Ogburn, & VanderWeele,
2013). These statistics seem promising for the online dating industry; however,
conflicting evidence directly contradict these findings. For instance, it was found that
one-third of the people surveyed indicated their online activity did not lead to meeting
with someone in person (Smith & Anderson, 2016), and for those who did progress to at
least one in-person meeting, only a fraction reported developing a ‘long-term’
relationship offline.What individuals who are seeking ‘real life’ relationships want to know is the real
success rate for online dating overall, and as they choose which platforms to engage with,
which one is most likely to be successful for them. Other questions frequently posed
include: what distinguishes those who succeed in finding love from those who fail?
Perhaps an additional and more worthwhile question to ask is: how do users themselves
approach their online dating experience, and does this predict their outcomes?
Technology and online dating applications
Today’s online dating experiences and platforms, as Finkel et al. (2012) pointed
out, provide an opportunity to meet people who are also looking for a match as the first
step. While dating websites vary in approach, the central aim is to facilitate the process of
seeking prospective romantic partners (e.g., Finkel et al., 2012; Ramirez et al., 2015). The
online dating experience can vary depending on the dating websites or mobile apps.
There are traditional online dating or matchmaking sites, and there are niche dating
websites. Others offer different features: for instance, geographical-location-based sites—
connecting users based on their physical GPS location.
Finkel et al. (2012) specifically suggested three unique services that online dating
sites provide to users: (a) an unparalleled opportunity to gain access to connect with
potential relationship partners; (b) the ability to engage through computer-mediated
communication before deciding whether to take a conversation offline and to meet in
person; and (c) the chance of being matched with potential relationship partners using
matching algorithms. There are many factors that affect whether any two people will ‘hit
2it off’ and develop an ongoing relationship, but those who eventually meet a romantic
partner generally have multiple dates with more than one person before finding ‘the one’.
In considering what makes some people better able to meet in person and to meet
for more than a single drink or cup of coffee, the question of how an individual may
increase his or her own likelihood of forming a lasting relationship from this vast pool of
resources arises. Understanding such distinctions may have practical implications for
individuals seeking romantic relationships both online and offline.
Finkel et al. (2012) recommends that when meeting potential partners it may be
helpful to avoid repeatedly assessing the situation and instead focus on creating a
pleasurable interaction with the other person. We interpret this as mindfulness. Being
mindful of the goal of connecting or simply noticing the subtle contextual variations
around us, or being mindful—is important (Langer, 2014).
This study, therefore, explored whether participating mindfully in the online
dating process leads to more successful dating outcomes, with success measured as
progressing to a face-to-face meeting or ‘date’.
Mindfulness
The term ‘mindfulness’ has been described in many ways, but two distinct, albeit
related, concepts exist (e.g., Haas & Langer, 2014; Zilcha-Mano & Langer, 2016). Within
scientific research, mindfulness is divided into two major areas: meditative mindfulness
(e.g., Kabat-Zinn, 1994; Kabat-Zinn, 2003) and socio-cognitive mindfulness (Langer,
2014).
3The Eastern perspective, meditative mindfulness, is often conceptualized as
‘‘paying attention in a particular way: on purpose, in the present moment, non-
judgmentally’’ (Kabat-Zinn, 1994; Kabat-Zinn, 2003), which draws from philosophical
practices and incorporates the practice of meditation, using breathing exercises among
other techniques (Zilcha-Mano & Langer, 2016).
The Western perspective, socio-cognitive mindfulness, is an active state of mind
(Langer, 2014) achieved through the active process of seeking novel distinctions (Burpee
& Langer, 2005; Langer & Moldoveanu, 2000; Zilcha-Mano & Langer, 2016).
Mindfulness has been used to enhance positive effects in a variety of creative activities
(e.g., Langer & Piper, 1987), employment productivity, social performance (e.g.,
Chanowitz & Langer, 1981; Langer & Imber, 1979) and health (for a review, see Langer,
1989; 1997; 2005; 2009; Ie, Ngnoumen & Langer, 2014). Langer argues that much of our
waking hours are spent in a mindless state or “on autopilot” (Langer & Moldoveanu,
2000), keeping us from noticing and observing the present moment (Langer, 2014).
When we are reliant on past distinctions focusing on a single narrow perspective, this
makes it difficult to keep an open mind. We thereby pass up possible positive alternative
knowledge, thus reducing our choices (Langer, 2000). One way to combat this is for an
individual to focus on noticing and paying attention to new things, hence being mindful
(Langer, 1989).
Mindfulness & dating I: Mindfulness predicts relationship satisfaction
Mindfulness is positively associated with marital satisfaction. For example,
Burpee & Langer (2005) conducted a correlational study, surveying 95 married adults—
55 females and 40 males (between the ages of 25 and 74). The authors assessed
4participants for overall life satisfaction, marital satisfaction and their perceived overall
similarity with their significant other using self-report questionnaires (Burpee & Langer,
2005). In addition, mindfulness was measured using the Langer Mindfulness Scale
(Bodner & Langer, 2001), including four subscales: novelty seeking; novelty producing;
flexibility and engagement.
In dating, romantic relationship-seekers need to try to determine whether people
they meet could potentially be a future mate or someone they would like to start a
relationship with; therefore, especially in online dating, being mindful should be of the
utmost importance.
Mindfulness & dating II: Understanding the online dating experience
An examination of how mindfulness potentially impacts online dating success
requires an understanding of the online dating experience, particularly how it compares to
offline dating. Understanding the kinds of challenges faced by the average online dater
helps elucidate areas where mindfulness could prove useful and instrumental in
facilitating relationship formation (e.g., success).
In an attempt to differentiate the online dating process from more conventional
(offline) forms of dating, Finkel et al. (2012) proposed that there are nine steps involved,
with distinct milestones specific to online dating. First, romantic relationship-seekers
must decide to start dating online. Second, they must identify which websites or services
would be best suited for their goals. Third, they need to create a profile (or multiple
profiles). Fourth is to begin browsing other people’s profiles. Fifth is to initiate contact
with prospective dates. Sixth is to receive communication from other users; seventh is to
engage in computer-mediated interaction (e.g., messaging, flirting, winking or otherwise
5indicating some interest); eighth is to establish an initial in-person meeting; and ninth is
where the daters begin to develop a relationship offline (Finkel et al., 2012). Is being
mindful during each of these steps likely to make online dating more successful?
There are two crucial milestones that differentiate the online dating process and
have an impact on relationship formation. The first milestone is moving the conversation
from online to offline, known as “modality switching” (e.g., Ramirez & Zhang, 2007;
Ramirez & Wang, 2008; Sharabi & Caughlin, 2017). One key factor clearly
distinguishing online dating is the integration of technology as a tool to progress from
online to in-person relationships (e.g., Finkel et al., 2012). Research has emphasized that
the significant turning point in the online dating process is when the decision is made to
take the interaction offline, either to speak by telephone or to meet in person (e.g.,
Sharabi & Caughlin, 2017). The questions thus arise: how do users decide to make this
transition? and what are the actions and characteristics of those who are successful at
making the change?
Following the success of the first in-person meeting, the second milestone is a
follow-up stage, whether there will be a second date and any consecutive meetings or
interaction.
To date, no studies have been conducted to examine socio-cognitive mindfulness
in individuals engaging in the early stages of romantic relationship formation, and no
research has examined whether participating in the online dating process mindfully leads
to enhancement of successful dating outcomes. This study attempted to contribute to the
mindfulness literature on relationship development, close relationships, and relationships
formed online. It aimed to provide a greater depth of understanding regarding
6mindfulness-related mechanisms in forming romantic relationships initiated through the
use of online dating websites. The results from the current study may have practical
implications for individuals seeking romantic relationships both online and offline.
7Chapter II
Method
The current study examined the role of mindfulness in the broader context of
online dating, informed by prior research on mindfulness, romantic relationship
formation and interpersonal functioning. Specifically, the study examined mindfulness in
individuals engaging in the early stages of romantic relationship formation, to ask the
question whether participating in the online dating process more mindfully leads to
enhancement of dating outcomes.
Study hypotheses
Drawing from previous studies mentioned above, we predicted that trait mindful
individuals would have a higher number of first meetings/dates. Mindfulness, as we refer
to it here, has been found to be both a trait and a state (which can be experimentally
introduced). We predicted that increased mindfulness would increase dating success
whether conceptualized as a trait or as a state (Sutcliffe, Vogus & Dane, 2016). Part One
looked at it as a trait; Part Two looked at it as a state.
We sought to examine, using the correlational method, whether there is a
relationship between mindfulness and dating outcomes, whether individuals scoring
higher on LMS14 would be more likely to meet more matches for a second date. We
predicted that those who scored higher on the mindfulness scale would have a greater
success rate in landing second dates.Participants who were actively engaged in seeking partners when the initial
interaction began online were asked to complete measures of mindfulness and report on
their online dating behavior. This was accomplished using a web-based experimental
design.
It is well documented; mindfulness has a positive effect on interpersonal
effectiveness in other contexts (e.g., Burpee & Langer, 2005). This suggests that it could
also promote positive outcomes within the online dating context. Therefore, we predicted
that mindfulness would make it more likely that people would be attracted to someone
during the first in-person date after meeting online. If developing a long-term relationship
is the primary dating objective, mindfulness should increase the likelihood of a second
date.
Data for the current study were collected as part of a larger intervention study. We
assessed the degree to which trait socio-cognitive mindfulness predicted online dating
behaviors and success.
Participants
Participants were recruited over a four-month period from November 22, 2019
through April 1, 2020, using a combination of two sample approaches, convenience and
snowballing. Participants were predominantly recruited through the SONA systems portal
provided by the Harvard University Decision Science lab, through face-to-face
recruitment, as well as through advertisement posted on the social media forum Reddit
(see Appendix A for an example of the advertisement placed in postings for participant
recruitment). At the time of enrollment participants were informed that those who
completed a series of five surveys would be entered into a raffle for a chance to receive
9one of five $100 Amazon gift cards. All study procedures were reviewed and approved
by the Harvard University’s Committee on the Use of Human Subjects (CUHS) prior to
data collection.
All participants were voluntarily enrolled, and only individuals who met the
inclusion criteria and provided their consent were included in the analysis. Inclusion
criteria were as follows: participants must (a) have access to the internet; (b) have the
ability to speak, read, and understand English; (c) be self-identifying heterosexual male
adults between 25 and 44 years of age; (d) be willing to use online dating website(s); and
(e) be willing to engage in face-to-face meeting(s) with prospective romantic
relationship-seekers met online. In order to control for as many variables as possible,
only self-identifying heterosexual male adults, ages 25 to 44 years old, currently living in
the United States, who were either seeking a long-term relationship and/or actively
engaging in the online dating search process were included in the study.
Of these participants, individuals who met the selection criteria upon completion
of the prescreening phase in Part One were qualified for Part Two of the study, which is
ongoing.
10Materials and measures
Additionally, as the investigation was conducted online, participants were
required to have access to the Internet in order to participate.
Demographics
All participants completed a brief self-report demographic form and related
information questionnaire, which included the participant’s age, self-identified sex,
sexual orientation, race/ethnicity, level of education, current employment status and
income. Additionally, participants were asked questions assessing relationship history,
online dating experience, use of dating services and current relationship status.
Participants were also asked questions to report the amount of time on average spent
using online dating application(s) per week, the number of online dating sites used, and
which sites they used (e.g., Tinder, OkCupid, PlentyOfFish, Match, eHarmony, Hinge,
Bumble, The League, or other as specified by the participant). The questions were
derived from prior online dating research (Sharabi & Caughlin, 2017), where participants
were asked to best describe their attitudes toward seeking a relationship (Singles in
America & Match.com, 2017), for example, “Have you ever created a profile on a dating
site/app?”, “Have you ever dated someone you met online?”. The demographic data
collected were used to identify the participant’s dating behaviors and to identify
participant’s eligibility; some items were also used as dependent measures (See Appendix
C).
11Socio-cognitive mindfulness
The Langer Mindfulness Scale (LMS-14; Bodner & Langer, 2001; Pirson,
Langer, & Zilcha, 2018; Appendix F) has been reported to be the most widely used
measure of mindfulness which incorporates a socio-cognitive perspective. Evidence for
the validity of this measure has been reported by Pirson, Langer, & Zilcha, 2018. The
scale is a 14-item self-report measure, adapted from the original 21-point measure (LMS-
21; Bodner & Langer, 2001), each item scored on a 7-point scale from 1 (strongly
disagree) to 7 (strongly agree). The scale yields a primary measure of overall mindfulness
score, and these scales were used in the data analysis.
Additionally, the scale yields a secondary measure, providing three subscales:
novelty seeking; novelty producing; and engagement. Examples of items measuring these
subscales include: novelty seeking: “I often generate novel ideas”, novelty producing: “I
like to investigate things”, and engagement: “I ‘get involved’ in almost everything I do”.
To control for the social desirability effect, the items negatively worded are reverse-
scored (e.g., “I am not an original thinker”). Following this procedure, the scores on the
14 items were summed to yield the main overall mindfulness measure, yielding a range
from 21 to 98, with higher scores indicating greater mindfulness. This measure was used
as the primary outcome measure for this investigation and administered at the beginning
and at the end of the study.
Dating success and single-item measures
Success was assessed using two indicators: the first index of success was
operationalized as the occurrence of off-line meetings (i.e., number of in-person first
12dates), and the second index of success assessed the movement from a first date to a
second date (i.e., number of second dates). Both indicators were measured based on the
reported frequency of the number of either first dates or second dates per participant.
Participants were asked to report on “How many first dates have you gone on so far this
year?” and “In the last year, how many second dates have you been on?”
Research design and procedures
All assessments and tasks were completed via Qualtrics, which were accessible
online at individuals’ convenience outside of the laboratory setting. Each participant was
assigned a unique numerical identifier (ID) to track survey responses. Participants’
unique IDs were not linked to their email addresses, and to keep the individual responses
anonymous, personal information was not recorded in the survey results, and IP addresses
were not collected. The numerical identifiers were used to verify the completion of the
study and to determine which participant would receive a gift card. Participants were not
asked to provide any unnecessary information, or information that might allow for
precise individual identification, other than in awarding study incentives to the
appropriate individuals and the distribution of subsequent surveys for Part Two.
All survey responses were exported manually from the password-protected
Qualtrics account to the principal investigator’s personal password-protected laptop for
analysis. Copies of the raw data were encrypted, and backed up to a password-protected
external hard drive External Storage Encrypted USB as well as a Harvard Managed
Google web-based Cloud backup system to ensure the data was accessible remotely.
13SPSS syntax files were created to streamline the data analysis process and were used to
repeat the analyses in order to verify the accuracy of the results.
Interested participants were invited to enroll in the study using the hyperlink to
the online survey (Qualtrics) embedded in the study invitation, where brief descriptions
of the study were provided. Only participants who provided informed consent
electronically were included in the study. Individuals who were not accepted received a
message thanking them for their consideration. See Appendix B for a sample of the
informed consent form.
Consenting participants were directed to respond to the second self-report
questionnaire. The questionnaires were estimated to take participants approximately 15-
20 minutes to complete, comprised of the following: (a) Relationship History Questions
(Appendix C); (b) Online Dating Behavior Characteristics Questions (Appendix D); and
(c) Langer Mindfulness Scale (LMS-14; Bodner & Langer, 2001; Appendix E); and (d)
Demographic Questionnaire (Appendix F). Please note, based on feedback received
during the pilot testing of the prescreening and first survey, the order of the demographic
questions were presented was changed to be placed at the end of the survey as opposed to
in the beginning. After the responses were collected, participants were asked if they
would like to participate in Part Two of the study, which has been paused due to the
coronavirus pandemic.
Participants who consented to participate in Part Two of the study were then
directed to a separate survey in Qualtrics, where they were asked to provide their email
address. The mailing list was used to contact the appropriate individual to distribute
14subsequent surveys, and once all data is collected the list will be immediately destroyed
after the delivery of the compensation.
Pilot testing
The questionnaires for the current investigation were pilot tested twice, first with
the research members in Professor Langer’s Mindfulness and Decision-Making Lab at
Harvard University and second with the research members of the Harvard University
Decision Science lab. The objectives of the pilot study were to determine the following:
(1) to receive feedback on the questions; (2) to check the flow of the survey questions; (3)
to assess the suitability of the research design and wording of the questions.
Data cleaning
Prior to performing the preliminary analyses, the data were screened for duplicate
participant identification numbers (Unique ID) to ensure that multiple submissions were
not included in the analysis. Further, the data were screened for missing or erroneous
responses. In addition, the LMS-14 were scored in accordance with the original authors’
instructions. The scores were calculated for each of the LMS subscales: novelty seeking;
novelty producing; and engagement.
Data screening
One hundred and twenty-five individuals completed the first online survey;
however, participants missing any of the items in a scale were deleted. First, 22
participants were removed from the data set because they did not complete the survey in
full.
15Second, the individuals that did not meet prescreening criteria were removed.
Demographic data were used to identify the participants’ dating behavior, and
participants who did not answer questions related to the inclusion criteria were removed
(e.g., age, gender, attitude towards dating, and relationship status). Only participants who
were male, heterosexual, between the age of 25 and 44 years old were included. Those
who were already dating someone and not looking to date other people at the moment
were excluded from the final sample. Participants who reported their sex as “Female”,
“Prefer to self-describe”, or “Prefer not to answer” (n = 4) were removed. For the purpose
of the analysis, participants that reported as being in either an open relationship, or
casually dating (one or more partners) were not removed.
Third, 2 duplicate responses were identified using the unique identifier and were
removed. A total of 69 participants were included in the analysis.
Prior to hypothesis testing, univariate and multivariate outliers were identified.
First, in order to identify the univariate, we calculated the standardized or z-scores for the
following 7 variables: age, mindfulness score, mindfulness subscales (novelty seeking,
novelty producing and engagement), and the main dating outcome scores (number of first
dates, number of second dates). Descriptive statistics were used to identify outliers in the
dependent variables, as defined by observations falling greater than 3.29 standard
deviations from the mean, or a standardized value of less than ±3.29 (Keppel & Wickens,
2004). One participant was removed based on z-scores for the number of second dates
being above the threshold.
Second, in order to identify possible multivariate outliers, we performed a
Mahalnobis distance test on the same variables. For this study there were no participants
16identified as multivariate outliers. Therefore, a total of 68 participants remained and were
included in the final analysis.
17Primary analyses
Prior to conducting the main analyses, correlation analysis to examine the
associations between the trait socio-cognitive mindfulness (measured using the LMS-14)
and participants’ online dating behaviors and dating success were examined. The
significance threshold was set at .05.
Participants’ socio-cognitive mindfulness levels, as measured by total scores on
the LMS-14, were correlated against measures assessing attitude toward seeking a
relationship, relationship history, and measures assessing online dating experience, use of
dating services, and current relationship status, amount of time on average spent using
online dating application(s) per week, number of in-person first dates, number of second
dates, which were used to determine the degree to which trait mindfulness predicts
various aspects of dating behavior.
Mindfulness and dating outcomes
For the current study, the first index of dating success was operationalized as the
transition from communicating online to meeting in-person (i.e., offline). The second
index of success was operationalized as the percentage of first dates, which progressed to
second dates. The moderating variables of interest for the proposed study were
participants’ relational goals and socio-cognitive mindfulness.
18Chapter III
Results
The final sample included in this study consisted of 68 self-reported heterosexual
male participants. The sample was comprised of men whose ages ranged from 25 to 43
years, with an overall mean age of 31.56 years (SD = 5.244), with close to two thirds of
the sample (73.5%, n = 50) under 35 years of age. Forty-one percent of the participants
were White (n = 28), 19.1% African-American (n = 13), Asian or Asian-American (n =
12), 17.6%, 7.4% Hispanic, Latino or Spanish (n = 5), 11.8% Multiple races (n = 8) and
American Indian (n = 1) and Middle Eastern (n = 1). The majority of the participants
were Massachusetts residents (51.5%, n = 35). Sample demographics are displayed in
Table 1.
Participants were predominantly single (85.3%, n = 58) with 11.8% casually
dating (n = 8) or in an open relationship (2.9%, n = 2). Of these 77.9% identified as
having never married (n = 53). Participants mainly recruited through Harvard Decision
Science Lab (50%, n = 34), with the remaining 47.1% (n = 32) via Reddit, and 2.9%
through word of month (n = 2). Table 2 displays participants’ relationship history in full.Table 1.
Demographic characteristics of all participants
Characteristic n %
Age at the time of survey (years)
25-29 29 42.6
30-34 21 30.9
35-39 9 13.2
40-43 9 13.2
Highest education level completed
Less than high school degree 1 1.5
High school 9 13.2
Some college but no degree 8 11.8
Associate degree in college (2-year) 11 16.2
Bachelor's degree in college (4-year) 21 30.9
Master's degree 15 22.1
Doctoral degree 2 2.9
Professional degree (JD, MD) 1 1.5
Race/Ethnicity
White 28 41.2
Hispanic, Latino, or Spanish origin 5 7.4
Black or African American 13 19.1
Asian 12 17.6
American Indian or Alaska Native 1 1.5
Middle Eastern or North African 1 1.5
Multiple races, ethnicities 8 11.8
Employment Status
Employed full-time 31 45.6
Employed part-time 15 22.1
Self-employed 11 16.2
Out of work and looking for work 3 4.4
Student 6 8.8
Prefer not to answer 2 2.9
20State
Arizona 1 1.5
California 8 11.8
Colorado 3 4.4
Connecticut 3 4.4
Maine 1 1.5
Massachusetts 35 51.5
Nevada 4 5.9
New Jersey 1 1.5
New Mexico 3 4.4
New York 5 7.4
Texas 1 1.5
Washington 2 2.9
Preferred to not answer 1 1.5
Annual income ($)
Less than $30,000 23 33.8
$30,000 to $49,999 22 32.4
$50,000 to $79,999 12 17.6
$80,000 to $99,999 1 1.5
$100,000 to $149,999 1 1.5
$150,000 or more 1 1.5
Prefer not to answer or I do not know 9 13.2
Note. N = 68. All participants are male and heterosexual.
21Relationship history
Less than half of the participants were actively seeking a committed relationship
(n = 29, 42.6%). About one quarter said that they were not actively looking but would be
open to dating if the right person were to come around (n = 19, 27.9%), or looking for
someone to date casually (19.1%, n = 13) while the rest were not looking for a
relationship and preferred to remain unattached (10.3%, n = 7). See Table 3. Participants
also reported having created a profile on an online dating site (85.3%, n = 58), while
14.7% (n = 10) had no history of using online dating sites. Of the participants who had
experience with online dating, 86.2% (n = 50) reported having an active account. Seventy
percent (n = 48) reported having previously dated someone met online. Table 2 displays
the participants’ relationship history.
22Table 2.
Relationship history of all participants
Characteristic n %
Relationship Status
Single 58 85.3
Casually dating (one or more partners) 8 11.8
In an open relationship 2 2.9
Marital Status
Never married 53 77.9
Living with a partner 2 2.9
Divorced 8 11.8
Separated 4 5.9
Prefer not to answer 1 1.5
Duration since divorce/last relationship
Less than 1 week 3 4.4
Less than 1 month 4 5.9
More than 1 month 7 10.3
3 - 6 months 12 17.6
6 - 12 months 16 23.5
More than 12 months 26 38.2
Length of most recent relationship
Less than 1 week 13 19.1
More than 1 week 1 1.5
Less than 1 month 7 10.3
More than 1 month 8 11.8
3 - 6 months 14 20.6
6 - 12 months 7 10.3
More than 12 months 18 26.5
Note. N = 68.
23Table 3.
Responses to survey question - Which of the following statements best describes your
attitude toward seeking a relationship?
Characteristic n %
I don’t want a relationship, I prefer to stay unattached 7 10.3
I am not actively looking, but I am open to dating if the
19 27.9
right person comes along
Looking to date casually but not settle down 13 19.1
I am actively seeking a committed relationship 29 42.6
Note. N = 68.
24Dating experience characteristics
In this sample 85.35% (n = 58) of the 68 participants reported use of online
dating sites. Seventy-three percent reported as having an active online dating account (n
= 50). Table 4 displays the dating experience characteristics of participants.
Table 5 displays the online dating usage for the participants having experience
with online dating apps (n = 58).
The apps that were reportedly used the most by participants were Tinder (63.8%,
n = 37), Bumble (41.4%, n = 24) and eHarmony (29.3%, n = 17). Table 6 displays the
frequency of use for each online dating site. Although Match.com is the largest dating
app, this was not reflected in this sample.
25Table 4.
Dating experience characteristics of all participants
Characteristic n %
Hours allocated to dating this week (%)
Less than 1 hour 25 36.8
2-4 hours 22 32.4
5-7 hours 11 16.2
8-10 hours 4 5.9
More than 10 hours 2 2.9
Don’t want to answer 4 5.9
Hours willing to allocate to dating this week (%)
Less than 1 hour 8 11.8
2-4 hours 27 39.7
5-7 hours 18 26.5
8-10 hours 8 11.8
More than 10 hours 4 5.9
Don’t want to answer 3 4.4
Method used to meet most recent first date (%)
Online dating site/app 18 26.5
Through a friend 19 27.9
Through family 2 2.9
At a bar/club 7 10.3
At a place of worship 1 1.5
At a volunteer activity 1 1.5
Social networking sites 5 7.4
By chance 5 7.4
At school 9 13.2
None of these 1 1.5
Note. N = 68.
26Table 5.
Online Dating usage for participant having experience with online dating apps
Characteristic n %
Average time spent
Once a week 7 10.3
2-3 times a week 15 22.1
4-6 times a week 18 26.5
Daily 16 23.5
Number of active online dating site/app profile(s)b
1 10 14.7
2 15 22.1
3 18 26.5
4 5 7.4
5 1 1.5
More than 5 1 1.5
Note. N = 68.
a = Subset of total sample that reported as having experience with online dating apps
(n = 58).
b = Subset of participants with online dating apps experience (n = 46).
27Table 6.
Responses to survey question - Which online dating sites have you used? (Choose which
one you have used)
Online dating sites n %
Tinder 37 63.8
Bumble 24 41.4
eHarmony 17 29.3
Match.com 16 27.6
OkCupid 14 24.1
Zoosk 13 22.4
Hinge 12 20.7
EliteSingles 9 15.5
Plenty of Fish 9 15.5
Coffee Meets Bagel 6 10.3
Happn 4 6.9
Badoo 1 1.7
DIl Mil 1 1.7
JDate, JSwipe 1 1.7
Raya 1 1.7
Tagged 1 1.7
Note. n = 58. Total of percentages is not 100 because the percentage of use for each site
was calculated as a standalone measure, according to how many individuals had used
that site, perhaps also using other sites.
28Descriptive statistics
Mean scores and standard deviations for the continuous outcome variables (e.g.,
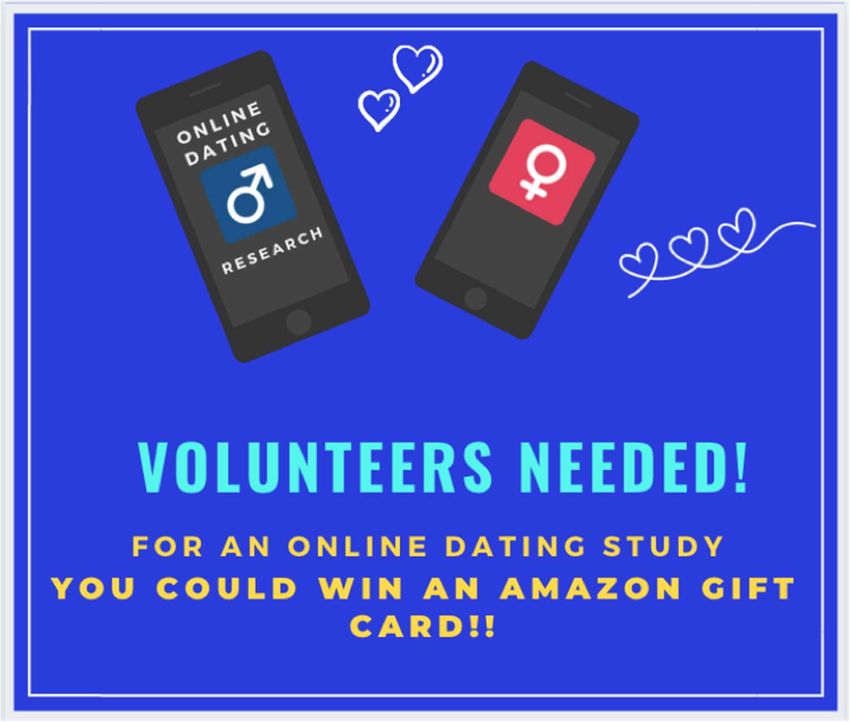
age, dating outcomes, and mindfulness scores) are presented in Table 7. Figures 1 and 2
shows the distribution of data for the two main dating outcome measures used (total
number of first and second dates). In both figures, the data points cluster more toward
one side of the histogram. This illustrates that data for both variables are positively
skewed (right-skewed distribution), which indicates that both variables have a higher
number of data points that have low values. In this case this is an indication that there are
a large number of participants who reported as not having going on any first or second
dates in the past year.
29Table 7.
Means, standard deviations of the continuous outcome variables
95% CL
Variable M SD LL UL Range Skew Kurtosis
Age 31.56 5.244 30.29 32.83 18 .719 -.493
Dating Outcomes
Number of First Dates 2.50 3.991 1.53 3.47 15 1.821 2.146
Number of Second Dates 2.40 2.293 1.84 2.95 10 1.330 1.794
LMS Score 72.44 9.750 70.08 74.80 39 -.117 -.919
LMS Subscales
Novelty Seeking 28.84 3.618 27.96 29.71 16 -.892 .765
Novelty Producing 25.21 3.760 24.30 26.12 18 -.544 -.204
Engagement 18.40 5.900 16.97 19.83 21 .698 -1.083
Note. N = 68. Note: CI = confidence interval; LL = lower limit, UL = upper limit; LMS= Langer Mindfulness Scale.
30Figure 1.
Histogram of frequency of distribution for the total number of first dates
Figure. 1. Histogram with distribution curve overlay showing a positively skewed
distribution for the total number of first dates for the year.
31Figure 2.
Histogram of frequency of distribution for the total number of second dates
Figure. 2. Histogram with distribution curve overlay showing a positively skewed
distribution for the total number of second dates for the year
32Mindfulness and dating and relationship history
Bivariate analysis correlation coefficients were examined to determine if
relationships existed between the main study variables and the demographic variables of
age, length of relationship, relationship status, level of education, employment status and
income. The main variables were: attitude toward seeking a relationship, relationship
history, and measures assessing online dating experience, use of dating services, and
current relationship status, amount of time on average spent using online dating
application(s) per week, number of in-person first dates in the past year, number of
second dates in the past year. These final two variables (number of in-person first dates in
the past year, number of second dates in the past year) were used to determine the degree
to which trait mindfulness predicts various aspects of dating behavior. The matrix of
correlations of all predictor variables is presented in Table 8.
33Table 8.
Correlations between main variables and demographic variables
Variable 1 2 3 4 5 6 7 8 9 10 11 12
1. Number of First Dates ___
in the past year
2. Number of Second ___
.581**
Dates in the past year
___
3. Age -.083 -.050
___
4. Race .220 .117 -.140
___
5. State .007 .083 .028 -.022
___
6. Education .238 .165 -.231 -.007 -.090
___
7. Employment status .105 .287* .026 .186 .073 .121
___
8. Income .252* .347** .110 .400** .066 .136 .127
___
9. Relationship status .083 .049 .301* -.078 -.074 -.111 .100 -.040
___
10. Marital status -.283* -.300* .341* -.202 -.036 .006 -.012 -.155 .175
11. Duration since ___
-.198 -.233 -.038 .062 -.130 -.014 .052 -.041 .025 .251*
divorce/last relationship
12. Duration of most ___
.005 -.161 .295* .155 .058 -.018 .296* .006 .152 .086 -.094
recent relationship
Note. N = 68. *p < .05. **pMindfulness and dating outcomes
The primary purpose of this study was to examine the relationship between
mindfulness and dating outcomes. It was expected that higher mindfulness scores would
be associated with better dating outcomes. Thus, we expected socio-cognitive
mindfulness to positively relate to higher numbers of first and second dates. Pearson
product-moment correlations between the total mindfulness, as measured by the LMS-14,
and dating outcomes were evaluated. The matrix of correlations of variables is presented
in Table 9.
Pearson’s correlation method
Using Method A, we performed four analyses, examining correlations between
first dates and (1) mindfulness (2) novelty seeking (3) novelty producing and (4)
engagement. Then we repeated the process for second dates.
A significant relationship could not be supported between the number of first
dates and (1) the overall mindfulness score (r = .157, p = .201).
In a similar trend, no significant relationships were found between number of first
dates and the three mindfulness subscales: (2) novelty seeking (r = .202, p = .098); (3)
novelty producing (r = .008, p = .949); or (4) engagement (r = .130, p = .290).
Correlations between the number of second dates in the past year and (1) overall
mindfulness scores were also weak but in the expected direction (r = .027, p = .824).
Correlations between the three mindfulness subscales and the number of in-person
second dates in the past year were also weak: (2) novelty seeking (r = .042, p = .734); (3)
35novelty producing (r = .020, p = .873); and (4) engagement (r = .007, p = .955) were all
positive but not significant.
Discussion of these findings is presented in the next chapter.
36Table 9.
Pearson’s product moment correlations for mindfulness scales and dating outcome
scores for all participants.
Variable 1 2 3 4 5 6
1. Number of Dates in ___
the past year
2. Number of Second ___
.581**
Dates in the past year
___
3. Total .157 .027
___
4. NS .202 .042 .776**
___
5. NP .008 .020 .631** .496**
___
6. E .130 .007 .775** .353** .101
Note. N = 68 *p < .05. **pIn addition, to further test the hypothesis, we repeated the analyses using
Spearman’s correlational method, as this method is robust to outliers as compared to
Pearson’s correlation (Field, 2009). Using Spearman’s correlational method, we
performed four analyses, examining correlations between first dates and (1) mindfulness
(2) novelty seeking (3) novelty producing and (4) engagement. Then we repeated the
process for second dates. The matrix of correlations of variables is presented in Table 10.
Using this method, contrary to our expectations, no significant positive
association was found between the total number of in-person first dates in the past year
and the participants’ (1) total mindfulness scores (rs = .156, p = .205).
Looking at the three mindfulness subscales and number of in-person first dates in
the past year, no significant correlations were found. We found that the number of in-
person first dates in the past year and (2) novelty seeking were weak, but not
significantly, correlated (rs = .162, p = .187), (3) novelty producing (rs = .056, p = .651),
and (4) engagement (rs = .148, p = .227).
The subsequent correlational analysis was between mindfulness and the number
of second dates in the past year. Contrary to our expectations, no significant positive
association between the total number of second dates the past year and (1) total
mindfulness was observed (rs = -.116, p = .348).
No significant correlations were found between the three mindfulness subscales
and the number of in-person second dates in the past year. We found an inverse
relationship between the total number of in-person second dates in the past year and the
three subscales; (2) novelty seeking was weakly, but not significantly, negatively
38correlated (rs = -.033, p = .789), (3) novelty producing (rs = .018, p = .881), and (4)
engagement (rs = -.173, p = .157).
Contrary to our prediction, based on the sample tested, no significant correlations
were found between the LMS and dating outcomes.
Discussion of these findings is presented in the next chapter.
39Table 10.
Spearman correlations between mindfulness and dating outcome scores
Variable 1 2 3 4 5 6
1. Number of Dates in ___
the past year
2. Number of Second ___
.634**
Dates in the past year
___
3. LMS .156 -.116
___
4. NS .162 -.033 .772**
___
5. NP .056 .018 .572** .381**
___
6. E .148 -.173 .796** .439** .104
Note. N = 68 *p < .05. **pAn additional analysis was conducted to examine whether the results for the main
hypothesis would change by excluding the participants (n = 7, 10% of the sample) who
had reported their attitude towards seeking a relationship as not looking for a relationship
and preferred to remain unattached. Using the smaller sample (n = 61) we conducted a
series of Pearson’s correlations to examine the relationship between overall mindfulness
and first and second dates when individuals not seeking a relationship were considered as
potential outliers. Based on the additional analysis, we saw an increase in the strength of
the relationship between trait mindfulness and dating outcomes. Despite the lack of
statistical significance, we found that the correlation there was a shift in expected
direction. Table 11 provides a matrix of correlations coefficients between mindfulness
and dating outcomes for the smaller sample.
Further, for a comparison of the Pearson’s correlation coefficients between the
number of first dates and mindfulness the two samples are presented in Table 12. Table
13 shows how Pearson’s correlation coefficients between the number of second dates and
mindfulness change when the seven participants were not looking for a relationship and
preferred to remain unattached have been excluded.
Discussion of these findings is presented in the next chapter.
41Table 11.
Pearson’s product moment correlations for mindfulness scores and dating outcome
scores for participants when potential outliers were excluded
Variable 1 2 3 4 5 6
1. Number of Dates in ___
the past year
2. Number of Second
.602** ___
Dates in the past year
___
3. Total .149 .099
4. NS .194 .140 .774** ___
5. NP -.005 .057 .603** .480** ___
6. E .135 .046 .792** .392** .072 ___
Note. N = 61 *p < .05. **pTable 12.
Comparison of Pearson’s product moment correlations for overall mindfulness scores
and number of first dates between two samples
Potential Outliers Potential Outliers
Statistical method Included Excluded
n r n r
Pearson’s 68 .157 61 .149
Note. *p < .05. **pTable 13.
Comparison of Pearson’s product moment correlations for overall mindfulness scores
and number of second dates between two samples
Potential Outliers Potential Outliers
Statistical method Included Excluded
n r n r
Pearson’s 68 .027 61 .099
Note. *p < .05. **pChapter IV
Discussion
The purpose of this study was to investigate the relationships between socio-
cognitive mindfulness and dating outcomes in a sample of U.S. adult males. Contrary to
our primary hypothesis, the study found no significant correlations between mindfulness,
as measured by the LMS, and dating outcomes.
Interpretation of the findings
The quantitative findings using Pearson correlation analysis showed that there
was a very weak, positive correlation between overall mindfulness score and number of
first dates. The sample data failed to provide sufficient evidence to support the prediction
that the relationship between mindfulness and number of first dates. Similar results were
also found when the analysis was conducted using the Spearman correlation method.
It should be noted that we also found a low non-significant relationship between
mindfulness and the number of second dates. The sample data failed to provide sufficient
evidence to support that those who scored higher on the mindfulness scale would have a
greater success rate in landing second dates. A possible explanation is that the sample
contained an insufficient amount of evidence to conclude that a relationship between
mindfulness and the number of second dates exists.A potential explanation for these findings is there were characteristics of the
sample that caused the results to turn out differently than expected.
A potential explanation for these findings is perhaps the variables are not
adequately measuring the dating outcomes. It is important to note that only 42.6% (n =
29) of participants reported as activity looking for a committed relationship (see Table 3).
Given that more than half the sample was not looking for a relationship, this raises that
question why they are online? Additionally, the sample included participants that
reported as having no experience with using online dating sites. Although the majority
(85.3 %, n = 58) of participants reported as having online dating experience, of these,
only 86.2% (n = 50) reported having an active account. A small number of non-online
users (14.7%, n = 10) were included in the sample. This is a limitation in that it is not
clear whether different patterns would be found with an equal number of active online
dating users and non-online users.
Research limitations and weaknesses
Although this is one of the first studies to investigate the link between socio-
cognitive mindfulness and its potential role in dating outcomes, the main hypotheses
were not supported. Because the correlations were consistently in the expected direction,
although too weak to yield statistical significance, we turn our attention to the
methodological limitations that may help to understand these findings. There were
several limitations that should be taken into consideration when interpreting the results.
First, as with all research, there are limitations concerning the generalizability of the
sample used. Participants included in the study were voluntarily enrolled. Due to the
small sample size, (N = 68) male adult singles residing in the United States, the ability to
46You can also read