Computer Modeling of the Heart for ECG Interpretation-A Review - MDPI
←
→
Page content transcription
If your browser does not render page correctly, please read the page content below
Review
Computer Modeling of the Heart for ECG
Interpretation—A Review
Olaf Dössel * , Giorgio Luongo                    , Claudia Nagel        and Axel Loewe

                                          Institute of Biomedical Engineering, Karlsruhe Institute of Technology (KIT), 76131 Karlsruhe, Germany;
                                          Giorgio.Luongo@kit.edu (G.L.); claudia.nagel@kit.edu (C.N.); axel.loewe@kit.edu (A.L.)
                                          * Correspondence: publications@ibt.kit.edu

                                          Abstract: Computer modeling of the electrophysiology of the heart has undergone significant
                                          progress. A healthy heart can be modeled starting from the ion channels via the spread of a depo-
                                          larization wave on a realistic geometry of the human heart up to the potentials on the body surface
                                          and the ECG. Research is advancing regarding modeling diseases of the heart. This article reviews
                                          progress in calculating and analyzing the corresponding electrocardiogram (ECG) from simulated
                                          depolarization and repolarization waves. First, we describe modeling of the P-wave, the QRS com-
                                          plex and the T-wave of a healthy heart. Then, both the modeling and the corresponding ECGs of
                                          several important diseases and arrhythmias are delineated: ischemia and infarction, ectopic beats and
                                          extrasystoles, ventricular tachycardia, bundle branch blocks, atrial tachycardia, flutter and fibrillation,
                                          genetic diseases and channelopathies, imbalance of electrolytes and drug-induced changes. Finally,
                                          we outline the potential impact of computer modeling on ECG interpretation. Computer modeling
                                          can contribute to a better comprehension of the relation between features in the ECG and the under-
                                          lying cardiac condition and disease. It can pave the way for a quantitative analysis of the ECG and
                                can support the cardiologist in identifying events or non-invasively localizing diseased areas. Finally,

                                          it can deliver very large databases of reliably labeled ECGs as training data for machine learning.
Citation: Dössel, O.; Luongo, G.;
Nagel, C.; Loewe, A. Computer
                                          Keywords: in silico; electrophysiology; electrocardiogram; ECG; cardiac disease; arrhythmia; ischemia
Modeling of the Heart for ECG
Interpretation—A Review. Hearts
2021, 2, 350–368. https://doi.org/
10.3390/hearts2030028
                                          1. Introduction
Academic Editor: Peter Macfarlane              This article reviews research aimed at building a bridge between computerized mod-
                                          eling of the electrophysiology of the human heart and the analysis of the electrocardiogram
Received: 27 May 2021                     (ECG). Potential applications of computer modeling for better interpretation of the ECG
Accepted: 14 July 2021                    are demonstrated and an outlook for further research is given.
Published: 26 July 2021                        The research field of computerized modeling of the electrophysiology of the heart
                                          has reached a mature state. The healthy heart can be replicated in a computer model with
Publisher’s Note: MDPI stays neutral      various degrees of detail, starting with the ion channels and ending with the spread of a
with regard to jurisdictional claims in   depolarization wave through the atria and the ventricles. Several diseases have been the
published maps and institutional affil-   focus of this research but many open questions remain: modeling can only be as good as
iations.                                  our basic understanding of the pathologies of the heart.
                                               On the other hand, after more than 100 years of ECG interpretation, the clinical
                                          knowledge about ECG and what it can tell us about cardiac diseases has reached an expert
                                          level. Most often, this knowledge is based on personal experience or empirical studies and
Copyright: © 2021 by the authors.         only coarse attempts are made to relate a decisive feature in the ECG to its pathological
Licensee MDPI, Basel, Switzerland.        origin inside the heart. The classical heart vector is a valuable tool for understanding the
This article is an open access article    general shape of the ECG, but it is not good enough to follow details of the spatial spread
distributed under the terms and           of de- and repolarization.
conditions of the Creative Commons             It is astounding that the number of articles where modeling of the heart is extended to
Attribution (CC BY) license (https://
                                          the calculation of the ECG and where this is used for better ECG interpretation is limited.
creativecommons.org/licenses/by/
                                          Table 1 shows the result of a literature survey.
4.0/).

Hearts 2021, 2, 350–368. https://doi.org/10.3390/hearts2030028                                                 https://www.mdpi.com/journal/hearts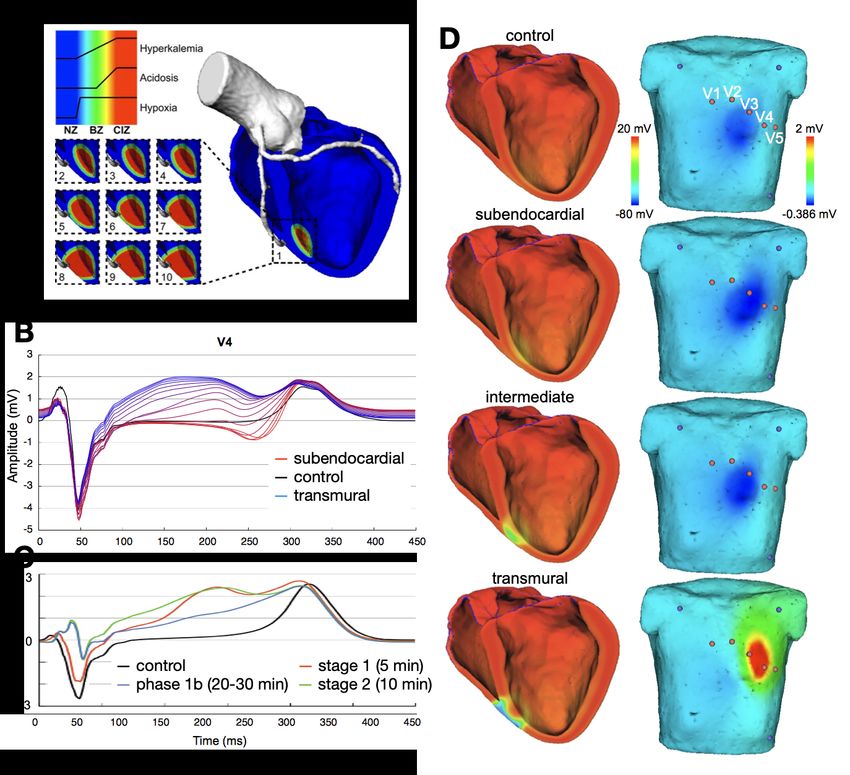
Hearts 2021, 2                                                                                               351

                 Table 1. Literature survey of research about modeling of the heart together with the correspond-
                 ing ECG.

                 Topic                           Modeling Challenge                        References
                 healthy heart—QRS               modeling the Purkinje tree                [1–9]
                 healthy heart—T-wave            modeling heterogeneity of repo-           [10–13]
                                                 larization
                 healthy heart—P-wave            modeling sinus node excitation            [14–22]
                                                 and pathways from right to left
                                                 atrium, anatomical variability
                 ischemia and infarc-            modeling the effect of hyper-             [23–30]
                 tion                            kalemia, acidosis, hypoxia and
                                                 cell-to-cell uncoupling
                 ventricular       ectopic       localization with 12-lead ECG             [31–34]
                 beats
                 ventricular    tachycar-        localization of exit points with          [29,35]
                 dia                             12-lead ECG
                 cardiomyopathy                  modeling typical changes of               [36]
                                                 QRS- and T-wave
                 bundle branch blocks            modeling asynchrony                       [37–40]
                 LBBB and RBBB
                 atrial ectopic beats            localization with 12-lead ECG             [32–34]
                 atrial tachycardia, flut-       modeling all types of flutter             [20,41–46]
                 ter
                 atrial fibrillation and fi-     modeling fibrosis and its distri-         [47–51]
                 brosis                          bution
                 genetic diseases                modeling LQT, SQT, Brugada                [52–54]
                 imbalance      of    elec-      hyper- and hypokalemia and                [13,55–60]
                 trolytes                        hyper- and hypocalcemia
                 drug-induced changes            effect of various channel blockers        [61–63]

                       Methods for calculation of the ECG (and the body surface potential map, BSPM) from
                 the source distribution in the heart have been described in several articles. The main
                 differences between the approaches are (a) the cellular models and their parameters,
                 (b) the method to calculate the spread of depolarization (bidomain, monodomain, eikonal,
                 reaction eikonal) and (c) the method of forward calculation (finite difference, finite ele-
                 ment, boundary element methods; homogeneous torso versus different organs considered).
                 The forward problem is obviously related to the inverse problem of ECG as used in ECG
                 imaging (ECGi). Thus, all articles dealing with fast and realistic methods of calculating the
                 lead field matrix that maps the sources in the heart to the body surface ECG are related to
                 the topic of this article but are not discussed in detail.
                       Published in 2004, the software package ECGSim allows for a fast and easy relation of
                 source patterns on the heart to the corresponding 12-lead ECG. The user can modify local
                 activation times, repolarization times and the slope of the transmembrane voltage [64].
                 Thus, these source distributions can be realistic or not—no model of excitation spread is
                 running in the background. Meanwhile, advanced software packages to simulate the elec-
                 trophysiology of the heart are available: openCARP [65,66], acCELLerate [67], FEniCS [68],
                 Chaste [69], propag-5 [70], and LifeV [71]. They all have been verified in an N-version
                 benchmark activity initiated by Niederer [72].
                       The literature survey yielded several articles that do not focus on a specific disease but
                 rather deal with the general concept of calculating the ECG from computer models of the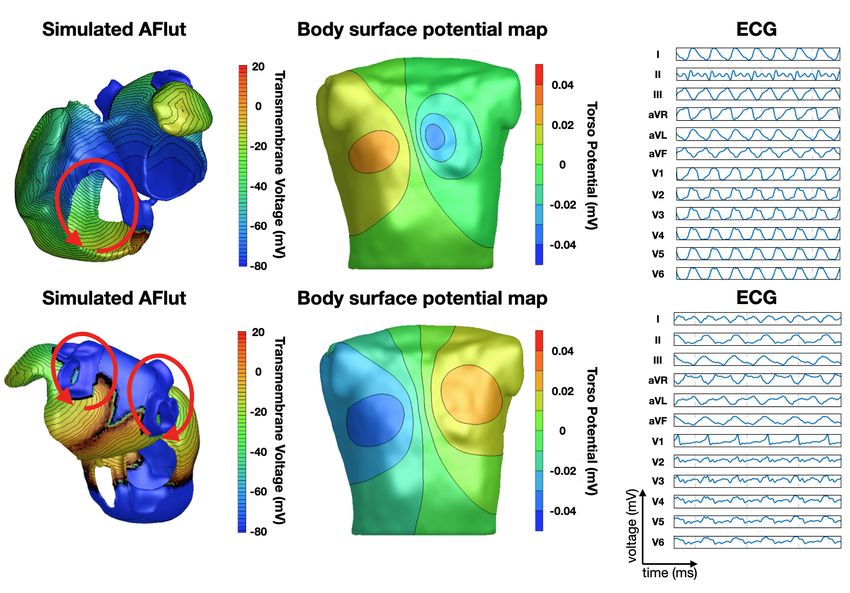
Hearts 2021, 2                                                                                                       352

                 heart. Lyon et al. gave an outline of a computational pipeline, listed examples of modeling
                 diseases together with the ECG and showed up several applications of modeling in ECG
                 interpretation [73]. Potse suggested a fast method for realistic ECG simulation without
                 oversimplifying the torso model by using a lead-field approach [74]. Building upon this
                 approach, Pezzuto et al. found an even faster method that allows for implementation on
                 a general-purpose graphic processing unit (GPGPU) [75]. Keller et al. investigated the
                 influence of tissue conductivities on the resulting ECG [76]. Schuler et al. [77] found a way
                 to downsample the fine grid necessary for calculating the spread of depolarization for the
                 forward calculation of the ECG—further reducing calculation time. Neic et al. developed a
                 reaction eikonal algorithm that simulates the spread of depolarization very fast and still
                 delivers realistic ECGs [78].
                       Calculation times for computing the spread of depolarization and repolarization,
                 the lead field matrix and the body surface potentials including the ECG strongly depend on
                 the methods employed: highly detailed cell models versus simplified phenomenological
                 models, high versus low spatial resolutions, etc. They can range from one day down to one
                 second. As an example, the calculation times of the P-waves shown in Figure 1 were 27 h
                 for the full bidomain model and the Courtemanche cell model, 1 h and 24 min for a pseudo-
                 bidomain model and 40 min for a monodomain simulation (heart mesh with 4.7 million
                 elements and 920 k nodes, desktop computer with 12 cores at 1.4 GHz). Fast calculation
                 times are important for the researcher aiming at the identification of new features in the
                 ECG, for creating a training dataset for machine learning and for personalization of a heart
                 model. They are not relevant any more if, for example, a machine learning algorithm is
                 finally used in clinics.

                 Figure 1. Simulated P-waves of the 12-lead ECG with various atrial shapes, several orientations of
                 the atria inside the torso and a variety of body shapes. The colors represent the total atrial volume in
                 blue, the torso size in red and the orientation angle around the medial-lateral axis in orange [50].

                 2. Modeling the ECG of a Healthy Heart
                 2.1. The QRS Complex and the Purkinje Tree
                       The morphology of the QRS complex is strongly determined by the topology of the
                 His-Purkinje system in the ventricular subendocardial layer [2]. An earlier approach
                 to fit a Punkinje network model to a measured ECG was published by Keller et al. in
                 2009 [1]. In total, 744 Purkinje muscle junctions were distributed across the ventricular
                 endocardial surface following specific rules. Other publications followed this scheme and
                 implemented “root points” coupled to thin endocardial layers with very fast conduction [3].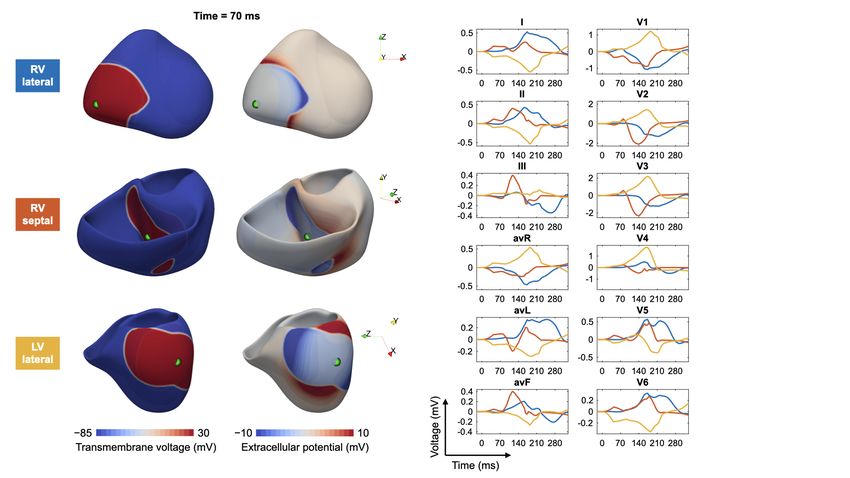
Hearts 2021, 2                                                                                             353

                 Automatic and reproducible manipulation of root node locations is facilitated by chamber-
                 specific coordinate systems [79–81]. Mincholé et al. investigated the impact of anatomical
                 variability on simulated QRS complexes [6]. They found that QRS duration is mainly
                 determined by myocardial volume and not affected by the position of the heart in the
                 torso. The latter influences QRS morphology in the precordial leads, whereas ventricular
                 anatomy dominates in the limb leads. Cranford et al. carried out a sensitivity study:
                 they implemented 1 to 4 “seed stimuli” and up to 384 “regional stimuli” and observed
                 the changes in the QRS complex while changing the number and topology of excitation
                 sites [5]. The topology of four seed stimuli at adapted positions was more relevant than a
                 large number of regional stimuli. Pezzuto et al. were able to reproduce the QRS complex of
                 11 patients using up to 11 of the earliest activation sites on the endocardium and adapted
                 the conduction velocity in the ventricles and in a fast endocardial layer [7]. Gillette et al.
                 proposed a comprehensive workflow to optimize the positioning of five root disks, timing,
                 and endocardial conduction velocities (10 parameters) to reproduce the QRS complex with
                 a personalized model [8].
                       The healthy QRS complex can be reproduced faithfully, meaning that adapted heart
                 models show an ECG with high correlation to measured ECGs. This does not prove that
                 the modeled spread of depolarization is the one present in the patient, but it is good to
                 see that there are no inconsistencies. Some relevant questions are: Which parameters
                 in the model are responsible for the natural variability of QRS complexes—both inter-
                 and intra-patient wise [4,6] (see also Section 2.5)? Is the heart axis that is visible in the
                 ECG mainly determined by the geometrical axis of the heart or by the properties of the
                 His-Purkinje system? Which simplifications of the thorax model are acceptable and where
                 do we need detailed models?

                 2.2. The T-Wave and the Repolarization
                      Modeling the T-wave is a challenging task. If all myocytes in the ventricles would
                 follow the same action potential, the T-wave would have the opposite sign as the R-peak.
                 Heterogeneity is a necessary condition for concordant T-waves. Keller et al. investigated
                 various schemes of heterogeneity of the IKs repolarization current (transmural, apico-basal,
                 left–right) and found that both transmural and apico-basal gradients can lead to realistic
                 T-waves, whereas a pure left–right heterogeneity creates a notch in the T-wave [11]. Even
                 though the focus of an article of Bukhari et al. was on the changes in the T-wave during
                 dialysis (see Section 3.9), this article also reported on the heterogeneity that is needed to
                 obtain a realistic T-wave in healthy hearts. They assume a solely transmural dispersion
                 of ion channel conductivities [13]. Xue et al. analyzed how transmural and apico-basal
                 heterogeneities change the morphology of the T-wave. They included heterogeneities
                 of the following ion channels: IKs , IKr , Ito . They concluded that mainly apico-basal gra-
                 dients contribute to a positive T-Wave [10]. The modeled heterogeneity scenarios are
                 informed by experimental cellular data [82]. However, the available data do not allow us
                 to draw definite conclusions and different heterogeneity patterns can lead to the similar
                 T-wave morphologies.
                      While contraction of the heart happens only after the P-wave and the early QRS
                 complex, it can influence the source distribution during the repolarization. How the
                 contraction of the heart affects the morphology of the simulated T-wave was investigated
                 by Moss et al. They observed an 8% increase in amplitude and a shift of the T-wave peak
                 by 7 ms [12].

                 2.3. The P-Wave
                      A review about computerized modeling of the atria including the corresponding ECG
                 was given by Doessel et al. in 2012 [15]. Krueger et al. were the first to set up an atrial
                 model that included realistic fiber orientation [14,83]. They also investigated the influence
                 of atrial heterogeneities on the morphology of the P-wave, created personalized models
                 and compared the ECGs of several patients [16].
Hearts 2021, 2 354
The contribution of the left and right atria to the P-wave was analyzed by Loewe et al. [17]
and Jacquemet et al. [18]. Even in the last third of the P-wave, one-third of the signal stems
from the right atrium [17]. Potse et al. discovered that a jigging morphology of the P-wave,
which was observed in computer simulations, was not an artefact but could be observed in
a similar way in healthy volunteers when carefully preventing smoothing through filtering
or averaging [19]. Loewe et al. investigated the influence of the earliest site of activation
in the right atrium (i.e., the sinus node exit site) on the morphology of the P-wave [20]
and could demonstrate that small shifts in the earliest excitation site and its proximity
to the inter-atrial connections can significantly change the terminal phase of the P-wave.
Andlauer et al. dissected the differential effects of atrial dilation and hypertrophy on
the morphology of the P-wave [21] and showed that left atrial dilation did not influence
P-wave duration significantly, but instead had a strong effect on P-wave amplitude and
thus P-wave Terminal Force in lead V1 (PTF-V1).
A literature survey of simulations of the P-wave and in particular of the P-wave in pa-
tients suffering from paroxysmal atrial fibrillation (AFib) was published by Filos et al. [43].
All the effects described in the literature that have an influence on the morphology of the P-
wave of AFib patients are outlined. Despite the very large number of articles, we conclude
that there is still a way to go before these results can be routinely used in clinical practice.
Nagel et al. analyzed the inter- and intra-patient variability of the P-wave in the
Physionet ECG database, aiming at the optimization of a simulated database of P-waves [84]
(see also Section 2.5). Figure 1 shows several examples of P-waves with various atrial
shapes, several orientations of the atria inside the torso and a variety of body shapes.
2.4. Modeling Rhythmic Features and Heart Rate Variability
Modeling of a heart beat most often starts with a stimulation either from an area
around the sinus node (atria) or from the model of the Purkinje tree (ventricles, see
Section 2.1). Modeling of the sinus node is an interesting research topic that goes beyond
the scope of this article.
The ECG fluctuates from beat to beat even in the healthy state. Both the RR interval
and also the morphology of the P-, QRS- and T-wave are not completely periodic. The fluc-
tuations of the RR interval are well known and analyzed by means of heart rate variability
(HRV), as reviewed by Rajendra et al. [85]. HRV is high in normal hearts and low when
there is a cardiac problem. The variation in the beat-to-beat RR interval is usually studied
in both the time domain and frequency domain. Not many clinicians make use of this
measure in daily clinical practice. On the modeling side, only few articles describe simula-
tions of beta-adrenergic and vagal tones on the sinus node [86]. It seems as if there is still a
“missing link” between computerized modeling of the heart and HRV interpretation [87].
2.5. Modeling Inter- and Intra-Patient Variability
The variety of ECG morphologies observed in a cohort of healthy humans is large.
This can be explained by different geometries of the heart [88] , different rotation inside the
thorax [6], and different shapes of the torso. Moreover, differences in electrophysiology also
contribute to the variability (see, for example, the discussion about the QRS morphology
and the Purkinje tree in Section 2.1).
As already mentioned in Section 2.3, Nagel et al. investigated the inter- and intra-
patient variability of the P-wave [84]. The beat-to-beat variability of the P-wave in case
of atrial fibrillation was investigated by Pezzuto et al. [42]. Already small variations (1 to
5 mm) in the location of the earliest activation site lead to changes in the morphology of
the P-wave. This effect was significantly enhanced if slow conducting regions were near
the earliest activation site.Hearts 2021, 2 355
3. Modeling Diseases and the Corresponding ECG
3.1. Ischemia and Infarction
Loewe at al. gave an outline of how computer modeling can support comprehension
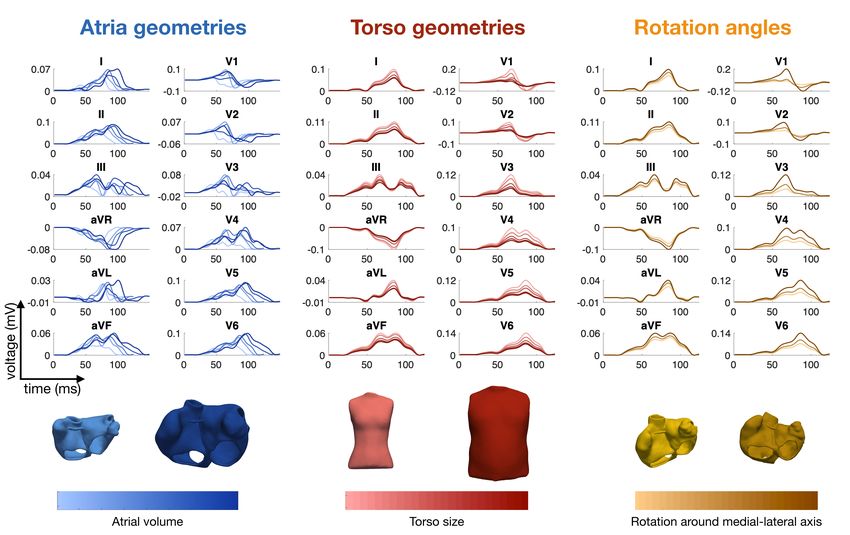
of cardiac ischemia and discussed the link to the corresponding ECG [28]. Figure 2 shows
several examples of ischemic regions together with the corresponding ECG. The parameters
of the ten Tusscher–Panfilov cell model which reflect the degree and temporal stage of
the occlusion were summarized by Wilhelms et al. [25]. They considered the cellular
effects due to hyperkalemia, acidosis and hypoxia as well as due to cellular uncoupling.
After clarifying the origin of ST-segment elevation (and depression), they also demonstrated
how several ischemic scenarios will not show any ST-segment change [26]. Thus, they
were able to explain the large group of non-ST-segment elevation myocardial infarctions
(NSTEMI). Potyagaylo et al. showed that these scenarios are not only electrically but
also magnetically “silent” [89]. Loewe at al.—using computer modeling—investigated
whether additional electrodes, optimized electrode placement or improved analysis of the
ST segment could lead to better diagnosis of patients with acute ischemia. They suggest
the deviation from baseline at the K-point as being superior to J-point analysis [27].
Figure 2. Examples of ischemic regions with varying transmural extent due to occlusion of the left
anterior descending coronary artery and the related levels of hyperkalemia, acidosis, and hypoxia (A).
ECG lead V4 for ischemia of varying transmural extent in temporal stage 2 (B) and varying duration of
a transmural ischemia (C). Ventricular transmembrane voltage and body surface potential distribution
during the action potential plateau (t = 200 ms) for ischemia of varying transmural extent in stage 2 (D).
The QRS complex was not optimized in this study. (Images reproduced with permission from [28].)
Ledezma et al. created populations of control and ischemic cell strands and observed
the corresponding pseudo-ECGs (which is the voltage between two virtual electrodes at or
near to the ends of a tissue strand immersed in an infinite homogeneous volume conductor).Hearts 2021, 2 356
Based on these data, they trained an artificial neural network that was able to determine
severity (mild or severe) and size of the ischemic region from the pseudo-ECG [30].
All these articles deal with ischemia and “fresh” infarctions (not older than a couple
of hours). The modeling of “old” infarction scars seems to be straightforward: the scar
areas cannot depolarize, they should be “switched off” during modeling. Basically. the
QRS complex will change. In particular, small bridges of viable tissue within a scar
area are of interest since they are likely to lead to ventricular tachycardia (VT). Lopez-
Perez et al. were able to set up a personalized model of a patient with an old infarction
with strong emphasis on modeling border zones. They were able to reproduce the 12-
lead ECG of a patient with a history of infarction both in sinus rhythm and during VT
(see Section 3.3) [29].
Electrocardiographic imaging of myocardial infarction was the subject of the Challenge
of the Computing in Cardiology conference in 2007. BSPMs of patients were provided for
the participants. Ghasemi et al. were very successful in finding the location and extent of
the infarction using only the heart vector and a very simplified model of the distribution
of depolarization during systole [90]. Farina et al. employed a model-based approach to
solve the task [23] and also reached very good results; however, based on the full BSPM.
Jiang et al. investigated the best electrode arrangements to localize an infarcted area in
the heart [24]. A dense set of electrodes including and extending the precordial leads was
essential. Optimal results were obtained when using at least 64 electrodes.
3.2. Ventricular Ectopic Beats and Extrasystoles
The localization of ventricular ectopic beats (premature ventricular contractions, PVCs)
is a major topic of the inverse problem of ECG. Any knowledge about the site of origin can
guide the cardiologist during an ablation procedure and thus shorten the duration of the
invasive procedure. Many publications contain chapters on calculating the body surface
potential map of ventricular ectopic beats using simulations of the spread of depolarization
(see, for example, Potyagaylo et al. [31]). Most of them assume that the individual body
shape and cardiac geometry is known, which is, however, not the setting of traditional
ECG analysis.
Figure 3 shows, as an example, a fast simulation of the spread of depolarization
(transmembrane voltage and epicardial potentials) and the corresponding 12-lead ECG for
three different ventricular extrasystoles.
3.3. Ventricular Tachycardia
Sapp et al. were able to localize the exit point of a ventricular tachycardia (VT) from
a 12-lead ECG based on an empirical study including 38 patients [91]. No modeling was
employed; nevertheless, an accuracy of 10 mm was achieved. It might be that the number
of patients was too small for drawing general conclusions. In 2007, Segal et al. suggested
features in the ECG that point to specific areas of exit points of VT (e.g., antero-lateral,
antero-apical, mid-septum, etc.) without any computer model [92]. Kania et al. localized
the exit point of a ventricular tachycardia using a personalized geometry for modeling and
only three ECG leads (Frank VCG) with an accuracy of 11.7 mm [35]. Additionally, in this
section, the article of Lopez-Perez et al. has to be mentioned: they reproduced the ECG
during VT of a personalized model of a patient with an old infarction [29].Hearts 2021, 2 357
Figure 3. Modeling of ectopic beats and the corresponding ECG: for three different trigger locations
in the right ventricle (RV) and left ventricle (LV), the transmembrane voltage (left column), the extra-
cellular potentials (middle column) and corresponding ECGs (right column) are shown. Excitation
propagation was computed by solving the anisotropic Eikonal equation.
3.4. Cardiomyopathy
Lyon et al. investigated ECG phenotypes resulting from hypertrophic cardiomyopathy
using computer modeling [36]. The objective was to better identify patients at high risk of
sudden cardiac death. An inverted T-wave with normal QRS was obtained with increased
apico-basal repolarization gradients in the septum and the apex. Lateral QRS abnormalities
were only obtained with abnormal Purkinje-myocardium coupling.
3.5. Bundle Branch Blocks
The most important feature visible in the ECG that points towards a bundle branch
block is a prolonged QRS complex. Modeling in this respect is mainly aiming at opti-
mization of cardiac resynchronization therapy. The bundle branch block is most often
simulated by only stimulating the Purkinje system in the right ventricle (left bundle branch
block, LBBB) or left ventricle (RBBB). Potse et al. investigated different hypotheses about
activation times for the LV endocardium, morphology of electrograms and ECG features in
patients with heart failure and LBBB using personalized computer modeling [37]. Simu-
lated and measured ECGs matched quite well (correlation coefficient between measured
and simulated activation times was r = 0.91 in one case and 0.87 in another case). Giffard-
Roisin et al. were able to match the 12-lead ECG of a patient with LBBB in a personalized
geometry by adjusting only 3 conduction velocities (CVs): in the myocardium, in the left
ventricular Purkinje system and in the right ventricular Purkinje system [39]. Personalized
models of five patients with heart failure and LBBB were created by Nguyen et al. [38].
They reached a very good agreement between simulated and measured 12-lead ECG and
demonstrated that the correct heart position and orientation has a strong impact on several
features of the ECG. A combined clinical (21 patients) and in-silico (3 simulated cases)
study of LBBB was presented by Nguyen et al. in 2018 [40]: the computer models were
personalized using endocardial mapping and the 12-lead ECG.Hearts 2021, 2 358
3.6. Atrial Ectopic Beats
The localization of atrial ectopic beats is of interest since the knowledge of their origin
could guide an ablation procedure. Localization of ectopic foci on the left atrium was
enabled by model-based computation of the spread of depolarization, forward calculation
to the body surface and comparison with “measured” BSPM by Potyagaylo et al. [93].
A “full search” method was applied, which cannot only deliver the location of the focus
but also a confidence region on the atria. Using only the first half of the P-wave improved
results. Feng et al. optimized a method to classify atrial ectopic beats, stable re-entries
and sinus rhythm in the 12-lead ECG by using simulated data [32]. Yang et al. trained a
convolutional neural network with simulated ectopic beats and applied it to nine patients
to localize ectopic beats from the 12-lead ECG by identifying the most likely origin from 25
cardiac segments. They achieved a localization error of 11 mm when using a personalized
model of the thorax of the patient [33]. Additionally, Ferrer-Albero et al. were able to
localize atrial ectopic beats using simulated body surface P-wave integral maps and a
machine learning approach (support vector machine). The computed ECGs compare well
with clinical ECGs. Dividing the atria in up to six regions (clusters), the origin of an
ectopic beat could be localized reliably, with the best accuracy of 96% achieved with four
clusters [34].
3.7. Atrial Tachycardia, Flutter and Fibrillation
Atrial flutter (AFlut) can be clearly diagnosed from the ECG. Typical and atypical
AFlut can be reliably recognised from the ECG by a trained cardiologist. However, the ques-
tion of which type of atypical atrial flutter the patient suffers from cannot be answered
directly from the ECG up to date. Again, this knowledge would speed up ablation pro-
cedures and could inform clinical decision making. It also could inform the cardiologist
about two alternating classes of AFlut that might be present. It could give evidence that
the type of flutter that is observed in the electrophysiology lab is identical with the type
that the patient suffers from out of hospital. Zhou et al. employed ECGi to classify several
types of AFlut in seven patients based on full BSPMs and personalized torso models [41].
On the other hand, Medi et al. were able to separate a few classes of atypical AFlut just
from the ECG without any modeling [94] such as, for example, focal versus macro-re-entry
and right atrial versus left atrial macro-re-entry. An approach with similar objectives—
classification of macro-re-entrant atrial tachycardia—but without any modeling should
be mentioned: Ruiperez-Campillo et al. analyzed loops of the atrial vectorcardiogram,
created “archetypes” of the loops of the four most frequent types of AFlut and determined
the similarity of the vectorcardiogram loop of a patient with the archetypes [95].
Luongo et al. were able to classify 20 different types of AFlut using the 12-lead ECG
based on a recurrence quantification analysis [45] in a computational study with a clinical
proof of concept. Figure 4 shows two examples. They also investigated the influence
of different atrial and torso geometries on the outcome of their algorithm [46]. Figure 4
shows two examples of simulated AFlut scenarios and the corresponding BSPMs and
12-lead ECGs.
Pezzuto et al. presented simulations of beat-to-beat variations of the P-waves in
patients with paroxysmal atrial fibrillation (AFib). They suggest that variations of the exit
location of the sinus node are responsible for P-wave fluctuations observed in patients [42]
(see also [20]). Filos et al. conducted a literature survey of articles about simulations of
the P-wave, the beat-to-beat variations with a particular focus on P-waves of patients
suffering from paroxysmal AFib. They showed how advances in computer models and
high performance computing could lead to the use of electrophysiological models of the
heart to improve quality of life of patients with AFib and optimize AFib treatment [43] (see
also Section 2.3).Hearts 2021, 2 359
Figure 4. Examples of simulated AFlut transmembrane voltage distributions and the corresponding
BSPMs and 12-lead ECGs. Top row: AFlut around the tricuspid valve in the counter-clockwise
direction. Bottom row: figure-8 macro-re-entry around the left and right pulmonary veins in the
anterior direction of rotation [45].
Atrial fibrillation remains a challenge regarding the relation of ECG features with
patterns of depolarization. In case several (more than three) re-entry mechanisms are
active simultaneously, it will probably be impossible to discriminate them from the ECG
only. Rodrigo et al. used BSPMs computed in personalized torso models and found that
areas of high dominant frequency and areas of large rotors can be localized [48]. However,
as mentioned before, this is not the setting of classical ECG interpretation. Nevertheless,
if only one ectopic center or one rotor is the driver of AFib, then important characteristics
can be deduced from the ECG. Luongo et al. were able to classify whether an AFib driver
is located in the vicinity of the pulmonary veins or not, and if not, whether it is in the right
or left atrium using a machine learning approach [51]. A decision tree was trained purely
on simulated data and performed favorably when subsequently being applied to a clinical
dataset comprising 46 patients.
Using computerized modeling, a method was proposed by Saha et al. that can monitor
an ablation procedure [47]. In total, 20 ablation patterns were investigated. A simulated
16-lead ECG (including V3R, V4R, V8 and V9) was analyzed in respect to P-wave duration
(PWD) and P-wave area. Several reconnections could be detected by comparing pre- and
post-ablation ECGs, but the settings of detection thresholds were quite demanding (5 ms
for PWD and 0.1 µVs for P-wave area). Regarding a real-time assessment of a typical
ablation procedure in case of perimitral flutter, the anterior mitral line, was demonstrated
by Lehrmann et al. in a clinical study that was enriched and mechanistically underpinned
using computer simulations [44]. The time from the stimulus in the left atrial appendage
to the P-wave peak in ECG lead V1 (“V1 delay”) can be used as a reliable measure for
blocking of the anterior mitral line. Even more predictive is the sudden jump of the P-wave
(“V1 jump”) upon completion of the line.
3.8. Genetic Diseases and Channelopathies
Modeling of genetic diseases leading to cardiac arrhythmias can be straightforward.
If the affected ion channel and its modification are known, the modified model of the ion
channel can be built into the computer model replacing the normal ion channel. If theHearts 2021, 2 360
dynamics of the ion channel are not affected, just the maximum channel conductance is
replaced by a modified value. Sometimes, it is not as easy as that: depending on how
the mutation affects the channel, a complete reparametrization or even reformulation of
the model can be required. Most frequent cases are the long QT syndromes (LQT1 to
LQT16), the short QT syndrome (SQT) and the Brugada syndrome. A review about the
modifications of ion channels for theses channelopathies was given by Schwartz et al. [96].
In a very early article, Shimizu and Antzelevitch described the link between transmu-
ral heterogeneity in LQT1 syndrome and features of the ECG, in particular concerning the
T-wave [97]. Numerous articles followed dealing with empirical clinical studies of ECG
morphology in LQT, SQT and Brugada patients but with no link to computer modeling.
On the other hand, many articles deal with computational studies about LQT (LQT1 to
LQT16), SQT and Brugada syndrome without calculating the corresponding ECG. A com-
puted pseudo-transmural ECG is shown sometimes but it only allows one to identify
gross morphological changes but no details in the ECG (for Long QT: Seemann et al., [52],
for Short QT: Weiss et al. [53]).
Seemann et al. carried out simulations of LQT1, LQT2 and LQT3 and calculated the
corresponding ECGs using a realistic torso model. The T-waves of a healthy control group
can clearly be distinguished from LQT patients and the simulated T-waves show good
correspondence to clinical data. However, the objective to classify the type of LQT from
the ECG was not achieved [54].
3.9. Imbalance of Electrolytes
Imbalance of electrolytes is dangerous in many respects. In particular, it can lead
to cardiac arrhythmias. Large deviations from homeostasis can be observed in patients
suffering from chronic kidney disease. A continuous monitoring of electrolyte plasma
concentration via ECG could be an important aid for patients. Several changes in the ECG
due to electrolyte imbalance are well known (see, for example, Wald [98]). Hyper- and
hypocalcemia and hyper- and hypokalemia show typical alterations in ECGs.
Bukhari et al. investigated the changes in morphology of the T-wave during hemodial-
ysis, both with modeling and with a clinical study [13]. They identified morphological
T-wave features (e.g., amplitude, upslope, and morphological variability) to reconstruct
[Ca2+ ] and [K+ ] concentrations. They also pointed out that the heterogeneity of action
potentials in the ventricles leading to the T-wave shows strong inter-individual variabil-
ity [99]. This complicates quantitative analysis and it will probably require a personalized
model to determine the electrolyte concentration from the ECG.
A review article about the classification and quantification of potassium and calcium
disorders using an ECG was published by Pilia et al. [59]. It contains a chapter on modeling
electrolyte disorders and the characteristic features in the ECG that can be derived from
modeling [55]. It also points out that classical ventricular cell models are not prepared to
show reasonable results for electrolyte concentrations that are far away from homeostasis—
they have to be adapted [100]. This group also presented a method to estimate blood
calcium concentration [58] and they suggested an optimized selection of features of the T-
wave and a polynomial regression method to reconstruct the potassium concentration from
the ECG [60]. Further on, they investigated various lead reduction techniques to extract
the most important information from a 12-lead ECG using computer simulations [56].
Loewe at al. contributed to the comprehension of the electrolytes on the sinus node
and thus on the heart rate [57]. They could demonstrate how the heart rate can be slowed
down during hypocalcemia.
3.10. Drug-Induced Changes in the ECG
Several antiarrhythmic drugs used today aim at specific modifications of the ion
channels. Class I agents are blockers of the fast sodium channel. Class II antiarrhythmics
are known to block β-receptors and thus attenuate the sympathetic nervous system. Class
III drugs block one or several outward potassium currents and class IV drugs block calciumHearts 2021, 2 361
channels. These modifications can be introduced into the electrophysiological cell models
of the heart and the specific changes in the action potential can be observed. Often times,
integrative modeling is a means to predict the net effect of multi-channel blockers when
experimental data are only available on the single channel level [101]. Predicting the effect
of specific ion channel modifications on the vulnerability of the heart for arrhythmias is a
very active field of research [102–104]. The effect on the ECG is not the major focus of most
of these studies.
Since drugs that prolong the QT interval are thought to be responsible for life threat-
ening arrhythmias (e.g., torsades de pointes), the effect of a drug on the QT interval
is investigated intensively even beyond antiarrhythmic drugs [105]. For that purpose,
a strongly simplified model of a strand of cells (e.g., 1 × 1 × 20 mm) representing a trans-
mural wedge can be sufficient under specific conditions. The electric voltage measured
from one end to the other is called a “transmural pseudo-ECG”. The morphology of this
signal cannot be directly compared to a real ECG, but the changes in QT interval due to a
drug can be represented. A prerequisite is to model the transmural heterogeneity properly,
as already discussed in Section 2.2.
One of the first studies which closed the gap between modeling drug effects on the
cellular and tissue level and the corresponding ECG was presented by Wilhelms et al. [61].
The effects of amiodarone and cisapride on human ventricular electrophysiology and the
corresponding ECG were analyzed. For cisapride, only a block of IKr is reported. In contrast,
amiodarone affects currents through several ion channels (IKr , INa , INaK , ICaL , INaCa , IKs ).
While cisapride only prolongs the QT interval, amiodarone in addition modifies the QRS
complex. Similar observations were confirmed by Zemzemi et al. [62]. They investigated
the influence of a 50% hERG channel block (IKr ) and of a 50% block of the fast sodium
channel (INa ). Both led to a prolongation of the QT interval but the hERG blocker did
not affect the QT interval, whereas the 50% sodium channel block prolonged the QRS
complex by 12%. Zemzemi et al. also investigated the effect of an ICaL blocker and the
combined effect with an IKr blocker at various combinations of doses [63]. The dose–
response dependency of the degree of block on concentration is modeled using the classical
Hill curve in these studies causing a pore block (by reducing gmax ) but not representing
any drug-induced changes in the channel dynamics.
A review about various approaches to additionally include the channel dynamics
using Markov-type models was published by Yuan et al. [106]. The action of amiodarone
and cisapride at the organ level is shown and pseudo-ECGs are presented. Several articles
followed with a large variety of objectives (e.g., unmasking LQT syndrome [107], designing
antiarrhythmic drugs for SQT patients [108], uncovering cardiac drug toxicity beyond QT
prolongation [109], understanding the antiarrhythmic effect of dofetelide [110], analyzing
the interaction of drugs with the cardiac conduction system [111], assessment of drug safety
regarding late sodium current (INaL ) blockers [112]) but they all end at the pseudo-ECG
level. They are important building blocks for in silico drug assessment and design, but they
are not in the focus of this article. The reader is also referred to the “Comprehensive
In Vitro Proarrhythmia Assay”(CiPA) initiative, promoting cardiac drug safety assessments
based on four approaches: ion channel data, myocyte data, human studies, and in silico
investigations [113].
In summary, modeling drug effects so far most often stopped at the pseudo-ECG level
and did not consider the realistic ECG derived by computing the field distribution in the
thorax induced by the spatio-temporal source distribution in the full heart. The potential to
validate in silico modeling with measured ECGs and the potential to enable the individual
optimization of the dose via quantification of features in the ECG is not fully realized yet.
4. Options of Modeling for Better Interpretation of the ECG
Computer modeling can contribute to a better understanding of the relation between
features in the ECG and the underlying cardiac condition or disease. This was demonstrated
in cases of genetic diseases, effect of drugs and imbalance of electrolytes. It can pave the wayHearts 2021, 2 362
for quantitative analysis of the ECG. As an example, the quantitative level of extracellular
[K+ ] can be estimated from the shape of the T-wave.
Model assisted ECG interpretation can guide the cardiologist to better localize ectopic
events or diseased areas. This was demonstrated for the localization of regions of infarction,
location of the origin of ectopic beats (atrial and ventricular) and the exit points of a VT.
Moreover, modeling can be a means to generate a very large database of perfectly
annotated ECGs as a training dataset for machine learning. Millions of ventricular extrasys-
toles with exact knowledge about the site of origin can be created for the development of
machine learning-based localization. Millions of atria with increasing levels of fibrosis can
be created to estimate the degree of fibrosis in the atria from the P-wave. Even though it has
to be stated that measured patient data would always be the ideal option for a database, we
have to accept that measured data are scarce, often contain incorrect annotations and nearly
always have a bias because the variety of diseases is rarely equally distributed among
study populations.
The objectives of linking computer modeling with the ECG can also be classified into
(a) personalization of a heart model (“digital twin”), (b) the investigation of fundamental
mechanisms using generic models and (c) the investigation of cohorts of patients [50,114].
All three play their role in better ECG interpretation but considering variability will become
more and more important to derive universally valid conclusions.
5. Summary and Outlook
Establishing a stronger link between computer modeling of the heart and the ECG
holds great potential. To consequently add at least the calculation of endocardial electro-
grams and compare with clinical data from the electrophysiology lab would add more
evidence to computerized modeling of the heart. Moreover, the forward calculation of the
ECG on the body surface is possible and allows for a comparison with the clinical ECG that
is most often available. It is a valuable test of the consistency of the modeling approach
and can lead to new insights about the relation between electrophysiological phenomena
in the heart and the corresponding ECG.
Likewise, if new (and most often computerized) methods of ECG analysis are pro-
posed, it would be important to make the results explainable by mechanistically under-
pinning the results, e.g., by backing up the hypotheses with state-of-the-art computer
simulations. In many cases, a “rule of thumb” using the classical heart vector for an expla-
nation can be misleading. If a feature in the ECG can be clearly linked to a source pattern
on the heart, the diagnostic value of ECG can be increased.
It might be possible to construct personalized models of the heart from the 12–lead
ECG [7,8]. However, often there will be ambiguities and spatially higher resolved BSPMs or
intracardiac electrograms will be needed. There are also other options for personalization:
e.g., measuring the ECG of a patient for one or two electrolytes or drug concentrations
and using computer modeling to predict (interpolate) intermediate values can enable a
quantitative interpretation of the ECG.
For making general conclusions about features in the ECG that point to specific
diseases, the analysis of computer simulations with just one geometry of heart and torso
will not be sufficient in the long run. A variety of heart shapes and body shapes can
be created using published shape models (for the atria see [22,115,116], for the ventricles
see [117,118], for the torso see [119]). Features in the ECG that are discovered with computer
simulations using only one heart and body geometry might easily lose their applicability
due to the large inter-patient variability of ECGs. Only features that can be discriminated
from the natural variety are useful.
In summary, bridging the gap between computerized modeling of the heart and
ECG analysis (as well as intracardiac electrograms) holds great potential to lead to better
comprehension of cardiac diseases, better diagnosis and optimized therapy planning.Hearts 2021, 2 363
Author Contributions: Conceptualization: O.D.; writing—original draft: O.D.; writing—review and
editing: A.L., C.N. and G.L.; visualization: A.L., C.N. and G.L. All authors have read and agreed to
the final version of the manuscript.
Funding: This work was supported by the EMPIR programme co-financed by the participating states
and from the European Union’s Horizon 2020 research and innovation programme under grant
MedalCare 18HLT07 and by the European Union’s Horizon 2020 programme under grant agreement
No. 766082, MY-ATRIA project. We gratefully acknowledge support by Deutsche Forschungsgemein-
schaft (DFG) (project ID 391128822, LO 2093/1-1). We acknowledge support by the KIT-Publication
Fund of the Karlsruhe Institute of Technology.
Institutional Review Board Statement: Not applicable.
Informed Consent Statement: Not applicable.
Data Availability Statement: Not applicable.
Acknowledgments: The authors thank Steffen Schuler for preparing Figure 3.
Conflicts of Interest: The authors declare no conflict of interest. The funders had no role in the design
of the study; in the collection, analyses, or interpretation of data; in the writing of the manuscript,
or in the decision to publish the results.
References
1. Keller, D.U.J.; Kalayciyan, R.; Dössel, O.; Seemann, G. Fast creation of endocardial stimulation profiles for the realistic simulation
of body surface ECGs. In Proceedings of the IFMBE World Congress on Medical Physics and Biomedical Engineering, Munich,
Germany, 7–12 September 2009; Volume 25/4, pp. 145–148.
2. Vigmond, E.J.; Stuyvers, B.D. Modeling our understanding of the His-Purkinje system. Prog. Biophys. Mol. Biol. 2016, 120, 179–188.
[CrossRef]
3. Cardone-Noott, L.; Bueno-Orovio, A.; Mincholé, A.; Zemzemi, N.; Rodriguez, B. Human ventricular activation sequence and the
simulation of the electrocardiographic QRS complex and its variability in healthy and intraventricular block conditions. EP Eur.
2016, 18, iv4–iv15. [CrossRef]
4. Kahlmann, W.; Poremba, E.; Potyagaylo, D.; Dössel, O.; Loewe, A. Modelling of patient-specific Purkinje activation based on
measured ECGs. Curr. Dir. Biomed. Eng. 2017, 3, 171–174. [CrossRef]
5. Cranford, J.P.; O’Hara, T.J.; Villongco, C.T.; Hafez, O.M.; Blake, R.C.; Loscalzo, J.; Fattebert, J.L.; Richards, D.F.; Zhang, X.;
Glosli, J.N.; et al. Efficient Computational Modeling of Human Ventricular Activation and Its Electrocardiographic Representation:
A Sensitivity Study. Cardiovasc. Eng. Technol. 2018, 9, 447–467. [CrossRef]
6. Mincholé, A.; Zacur, E.; Ariga, R.; Grau, V.; Rodriguez, B. MRI-Based Computational Torso/Biventricular Multiscale Models to
Investigate the Impact of Anatomical Variability on the ECG QRS Complex. Front. Physiol. 2019, 10, 1103. [CrossRef]
7. Pezzuto, S.; Prinzen, F.W.; Potse, M.; Maffessanti, F.; Regoli, F.; Caputo, M.L.; Conte, G.; Krause, R.; Auricchio, A. Reconstruction
of three-dimensional biventricular activation based on the 12-lead electrocardiogram via patient-specific modelling. EP Eur. 2021,
23, 640–647. [CrossRef]
8. Gillette, K.; Gsell, M.A.; Prassl, A.J.; Karabelas, E.; Reiter, U.; Reiter, G.; Grandits, T.; Peyer, C.; Štern, D.; Urschler, M.; et al.
A Framework for the Generation of Digital Twins of Cardiac Electrophysiology from Clinical 12-leads ECGs. Med. Image Anal.
2021, 71, 102080. [CrossRef] [PubMed]
9. Grandits, T.; Effland, A.; Pock, T.; Krause, R.; Plank, G.; Pezzuto, S. GEASI: Geodesic-based Earliest Activation Sites Identification
in cardiac models. arXiv 2021, arXiv:2102.09962v1.
10. Xue, J.; Chen, Y.; Han, X.; Gao, W. Electrocardiographic morphology changes with different type of repolarization dispersions.
J. Electrocardiol. 2010, 43, 553–559. [CrossRef]
11. Keller, D.U.J.; Weiss, D.L.; Dossel, O.; Seemann, G. Influence of I(Ks) heterogeneities on the genesis of the T-wave: A computational
evaluation. IEEE Trans. Biomed. Eng. 2012, 59, 311–322. [CrossRef]
12. Moss, R.; Moritz Wülfers, E.; Seemann, G. T-Wave Changes Due to Cardiac Deformation Are Dependent on the Temporal
Relationship Between Repolarization and Diastolic Phase. Comput. Cardiol. 2018, 45, 1–4. [CrossRef]
13. Bukhari, H.A.; Palmieri, F.; Ramirez, J.; Laguna, P.; Ruiz, J.E.; Ferreira, D.; Potse, M.; Sanchez, C.; Pueyo, E. Characterization of T
Wave Amplitude, Duration and Morphology Changes During Hemodialysis: Relationship with Serum Electrolyte Levels and
Heart Rate. IEEE Trans. Biomed. Eng. 2020, 1, ahead of print. [CrossRef]
14. Krueger, M.W.; Schmidt, V.; Tobón, C.; Weber, F.M.; Lorenz, C.; Keller, D.U.J.; Barschdorf, H.; Burdumy, M.; Neher, P.; Plank, G.;
et al. Modeling atrial fiber orientation in patient-specific geometries: A semi-automatic rule-based approach. In Functional Imaging
and Modeling of the Heart 2011; Lecture Notes in Computer Science; Axel, L., Metaxas, D., Eds.; Springer: Berlin/Heidelberg,
Germany, 2011; Volume 6666, pp. 223–232. [CrossRef]
15. Dössel, O.; Krueger, M.W.; Weber, F.M.; Wilhelms, M.; Seemann, G. Computational modeling of the human atrial anatomy and
electrophysiology. Med. Biol. Eng. Comput. 2012, 50, 773–799. [CrossRef]Hearts 2021, 2 364
16. Krueger, M.W.; Dorn, A.; Keller, D.U.J.; Holmqvist, F.; Carlson, J.; Platonov, P.G.; Rhode, K.S.; Razavi, R.; Seemann, G.; Dössel,
O. In-silico modeling of atrial repolarization in normal and atrial fibrillation remodeled state. Med. Biol. Eng. Comput. 2013,
51, 1105–1119. [CrossRef] [PubMed]
17. Loewe, A.; Krueger, M.W.; Platonov, P.G.; Holmqvist, F.; Dössel, O.; Seemann, G. Left and Right Atrial Contribution to the
P-wave in Realistic Computational Models; In Lecture Notes in Computer Science; Berlin/Heidelberg, Germany, 2015; Volume 9126,
pp. 439–447. [CrossRef]
18. Jacquemet, V. Modeling left and right atrial contributions to the ECG: A dipole-current source approach. Comput. Biol. Med. 2015,
65, 192–199. [CrossRef]
19. Potse, M.; Lankveld, T.A.R.; Zeemering, S.; Dagnelie, P.C.; Stehouwer, C.D.A.; Henry, R.M.; Linnenbank, A.C.; Kuijpers, N.H.L.;
Schotten, U. P-wave complexity in normal subjects and computer models. J. Electrocardiol. 2016, 49, 545–553. [CrossRef]
20. Loewe, A.; Krueger, M.W.; Holmqvist, F.; Dössel, O.; Seemann, G.; Platonov, P.G. Influence of the earliest right atrial activation
site and its proximity to interatrial connections on P-wave morphology. EP Eur. 2016, 18, iv35–iv43. [CrossRef]
21. Andlauer, R.; Seemann, G.; Baron, L.; Dössel, O.; Kohl, P.; Platonov, P.; Loewe, A. Influence of left atrial size on P-wave
morphology: Differential effects of dilation and hypertrophy. EP Eur. 2018, 20, iii36–iii44. [CrossRef]
22. Nagel, C.; Schuler, S.; Dössel, O.; Loewe, A. A bi-atrial statistical shape model for large-scale in silico studies of human atria:
Model development and application to ECG simulations. arXiv 2021, arXiv:2102.10838.
23. Farina, D.; Dössel, O. Model-based approach to the localization of infarction. Comput. Cardiol. 2007, 34, 173–176. [CrossRef]
24. Jiang, Y.; Qian, C.; Hanna, R.; Farina, D.; Dössel, O. Optimization of the electrode positions of multichannel ECG for the
reconstruction of ischemic areas by solving the inverse electrocardiographic problem. Int. J. Bioelectromagn. 2009, 11, 27–37
25. Wilhelms, M.; Dössel, O.; Seemann, G. Comparing Simulated Electrocardiograms of Different Stages of Acute Cardiac Ischemia.
In Proceedings of the International Conference on Functional Imaging and Modeling of the Hear, LNCS, New York, NY, USA,
25–27 May 2011; Volume 6666, pp. 11–19. [CrossRef]
26. Wilhelms, M.; Dössel, O.; Seemann, G. In silico investigation of electrically silent acute cardiac ischemia in the human ventricles.
IEEE Trans. Biomed. Eng. 2011, 58, 2961–2964. [CrossRef]
27. Loewe, A.; Schulze, W.H.W.; Jiang, Y.; Wilhelms, M.; Luik, A.; Dössel, O.; Seemann, G. ECG-Based Detection of Early Myocardial
Ischemia in a Computational Model: Impact of Additional Electrodes, Optimal Placement, and a New Feature for ST Deviation.
BioMed Res. Int. Artic. 2014, 2015, 530352. [CrossRef]
28. Loewe, A.; Wülfers, E.M.; Seemann, G. Cardiac ischemia-insights from computational models. Herzschrittmachertherapie
Elektrophysiologie 2018, 29, 48–56. [CrossRef]
29. Lopez-Perez, A.; Sebastian, R.; Izquierdo, M.; Ruiz, R.; Bishop, M.; Ferrero, J.M. Personalized Cardiac Computational Models:
From Clinical Data to Simulation of Infarct-Related Ventricular Tachycardia. Front. Physiol. 2019, 10, 580. [CrossRef]
30. Ledezma, C.A.; Zhou, X.; Rodríguez, B.; Tan, P.J.; Díaz-Zuccarini, V. A modeling and machine learning approach to ECG feature
engineering for the detection of ischemia using pseudo-ECG. PLoS ONE 2019, 14, e0220294. [CrossRef] [PubMed]
31. Potyagaylo, D.; Chmelevsky, M.; van Dam, P.; Budanova, M.; Zubarev, S.; Treshkur, T.; Lebedev, D. ECG Adapted Fastest Route
Algorithm to Localize the Ectopic Excitation Origin in CRT Patients. Front. Physiol. 2019, 10, 183. [CrossRef]
32. Feng, Y.; Roney, C.; Hocini, M.; Niederer, S.; Vigmond, E. Robust Atrial Ectopic Beat Classification From Surface ECG Using
Second-Order Blind Source Separation. Comput. Cardiol. 2020, 47. [CrossRef]
33. Yang, T.; Yu, L.; Jin, Q.; Wu, L.; He, B. Localization of Origins of Premature Ventricular Contraction by Means of Convolutional
Neural Network From 12-Lead ECG. IEEE Trans. Biomed. Eng. 2018, 65, 1662–1671. [CrossRef]
34. Ferrer-Albero, A.; Godoy, E.J.; Lozano, M.; Martínez-Mateu, L.; Atienza, F.; Saiz, J.; Sebastian, R. Non-invasive localization of
atrial ectopic beats by using simulated body surface P-wave integral maps. PLoS ONE 2017, 12, e0181263. [CrossRef] [PubMed]
35. Kania, M.; Coudière, Y.; Cochet, H.; Haissaguerre, M.; Jais, P.; Potse, M. Prediction of the Exit Site of Ventricular Tachycardia
Based on Different ECG Lead Systems. Comput. Cardiol. 2017, 44. [CrossRef]
36. Lyon, A.; Bueno-Orovio, A.; Zacur, E.; Ariga, R.; Grau, V.; Neubauer, S.; Watkins, H.; Rodriguez, B.; Mincholé, A. Electrocar-
diogram phenotypes in hypertrophic cardiomyopathy caused by distinct mechanisms: Apico-basal repolarization gradients vs.
Purkinje-myocardial coupling abnormalities. EP Eur. 2018, 20, iii102–iii112. [CrossRef]
37. Potse, M.; Krause, D.; Kroon, W.; Murzilli, R.; Muzzarelli, S.; Regoli, F.; Caiani, E.; Prinzen, F.W.; Krause, R.; Auricchio, A.
Patient-specific modelling of cardiac electrophysiology in heart-failure patients. EP Eur. 2014, 16 (Suppl. 4), iv56–iv61. [CrossRef]
38. Nguyen, U.C.; Potse, M.; Regoli, F.; Caputo, M.L.; Conte, G.; Murzilli, R.; Muzzarelli, S.; Moccetti, T.; Caiani, E.G.;
Prinzen, F.W.; et al. An in-silico analysis of the effect of heart position and orientation on the ECG morphology and
vectorcardiogram parameters in patients with heart failure and intraventricular conduction defects. J. Electrocardiol. 2015,
48, 617–625. [CrossRef] [PubMed]
39. Giffard-Roisin, S.; Fovargue, L.; Webb, J.; Molléro, R.; Lee, J.; Delingette, H.; Ayache, N.; Razavi, R.; Sermesant, M. Estimation
of Purkinje Activation from ECG: An Intermittent Left Bundle Branch Block Study. Lect. Notes Comput. Sci. 2017, 10124
10124, 135–142. [CrossRef]
40. Nguyên, U.C.; Potse, M.; Vernooy, K.; Mafi-Rad, M.; Heijman, J.; Caputo, M.L.; Conte, G.; Regoli, F.; Krause, R.; Moccetti, T.; et al.
A left bundle branch block activation sequence and ventricular pacing influence voltage amplitudes: An in vivo and in silico
study. EP Eur. 2018, 20, iii77–iii86. [CrossRef]You can also read