To Fish or Not to Fish - Economic Perspectives of the Pelagic Northeast Atlantic Mackerel and Herring Fishery
←
→
Page content transcription
If your browser does not render page correctly, please read the page content below
ORIGINAL RESEARCH
                                                                                                                                            published: 28 July 2020
                                                                                                                                    doi: 10.3389/fmars.2020.00625

                                            To Fish or Not to Fish – Economic
                                            Perspectives of the Pelagic
                                            Northeast Atlantic Mackerel and
                                            Herring Fishery
                                            Sandra Rybicki 1* , Katell G. Hamon 2 , Sarah Simons 1 and Axel Temming 3
                                            1
                                              Institute of Sea Fisheries, Johann Heinrich von Thünen Institute, Bremerhaven, Germany, 2 Wageningen Economic
                                            Research, Wageningen, Netherlands, 3 Institute of Marine Ecosystem and Fishery Science, University of Hamburg, Hamburg,
                                            Germany

                                            Environmental, political, and economic conditions influence fishermen’s decisions, which
                                            in turn have consequences on the profitability of fishing fleets. We applied the bio-
                                            economic model FishRent to understand the response of eight fleets operating in
                                            the Northeast Atlantic mackerel and North Sea autumn spawning herring fishery to
                                            a number of scenarios, including changes in recruitment, the quota allocation key,
                                            and disruptions in fish and fuel prices. In all scenarios, both the Irish and German
                           Edited by:
                     Fabio A. Madau,
                                            fleets were close to the break-even point, making them more vulnerable to additional
            University of Sassari, Italy    disturbances than other fleets. Yet, these events are expected to occur simultaneously
                        Reviewed by:        and a larger margin between costs and revenue would enhance the fleets resilience.
                     Tommaso Russo,         The replacement of the historical quota allocation key to countries by an allocation
  University of Rome Tor Vergata, Italy
                  Brian R. MacKenzie,       according to biomass distribution negatively affected the German fleet most (−450%
     Technical University of Denmark,       profitable within 1 year from 2020 to 2021), followed by the Dutch and Danish fleets
                             Denmark
                                            (−175% profitable on average among those fleets), while the United Kingdom and
                 *Correspondence:
                      Sandra Rybicki
                                            Ireland increased their profitability by more than 250%. The differences among fleets
          sandra.rybicki@thuenen.de;        highlights the sensitivity of a historical allocation key revision. In case of a continued
              sandra.rybicki@gmx.de         herring recruitment failure, the profitability of most fleets targeting herring decreased but
                  Specialty section:
                                            none of the fleets had to disinvest. Declines in fish prices (16% for frozen mackerel and
        This article was submitted to       herring, 81% for fresh herring, and 105% for fresh mackerel on average) and increases
        Marine Fisheries, Aquaculture
                                            in fuel prices (17% on average) forced the United Kingdom, Icelandic, and large-scale
               and Living Resources,
              a section of the journal      (>40 m) Irish fleets to reduce their number of vessels by up to 40%.
         Frontiers in Marine Science
                                            Keywords: bio-economic model, Northeast Atlantic, pelagic fishery, mackerel, herring
             Received: 22 April 2020
             Accepted: 08 July 2020
             Published: 28 July 2020
                                            INTRODUCTION
                            Citation:
    Rybicki S, Hamon KG, Simons S           It is well established that many aspects, such as changes in the environment, economy and political
and Temming A (2020) To Fish or Not
                                            decisions, influence the behavior of fishermen and hence the profitability of fleets (e.g., Pascoe et al.,
    to Fish – Economic Perspectives
     of the Pelagic Northeast Atlantic
                                            2008; Hamon et al., 2014; Maynou et al., 2014; Bartelings et al., 2015; Spijkers and Boonstra, 2017).
        Mackerel and Herring Fishery.       The pelagic fisheries for Northeast Atlantic (NEA) mackerel and North Sea autumn spawning
               Front. Mar. Sci. 7:625.      (NSAS) herring have very high economic value in the European (EU) pelagic fishery sector,
     doi: 10.3389/fmars.2020.00625          i.e., 21% (herring) and 32% (mackerel) of total value (pelagic EU fleets, average of 2013–2017;

Frontiers in Marine Science | www.frontiersin.org                                1                                                July 2020 | Volume 7 | Article 625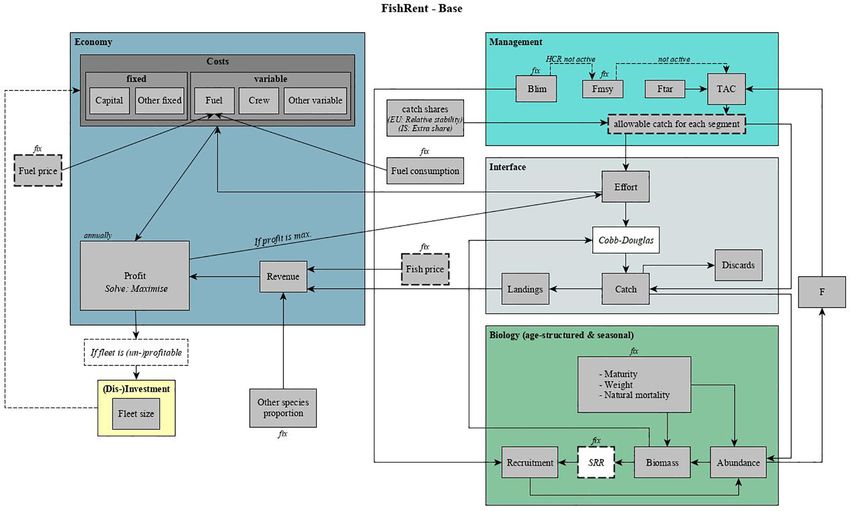
Rybicki et al.                                                                                      Economic Perspectives of European Pelagic Fisheries

Scientific, Technical, and Economic Committee for Fisheries                 relative stability principle might need to be reconsidered by, for
[STECF], 2019). Hence, they are listed as the most important                example, matching the changing biological dynamics. For the
species in terms of landed weight and are within the top                    respective pelagic fisheries, altering the relative stability principle
five species regarding landed value (Scientific, Technical, and             might be substantial.
Economic Committee for Fisheries [STECF], 2018). Moreover,                      Furthermore, fish and fuel prices have a great impact on
the EU pelagic sector employed 23% of fishermen on average                  fleet profitability and large year-to-year differences are common.
from 2012 to 2016 (Scientific, Technical, and Economic                      Influenced by a number of causes (e.g., natural disasters, political
Committee for Fisheries [STECF], 2019). For job security reasons            disputes, and overfishing) price shocks may be a result. In recent
as well as the growing demand for food with increasing human                years, political decisions also had an impact on fish prices. After
population, it is important to evaluate the magnitude of current            the Brexit vote, the pound dropped in 2016 and 2017 affecting the
environmental, economic and political changes.                              exchange rate and fish prices in general (Scientific, Technical, and
    In case of NSAS herring, for example, continued low                     Economic Committee for Fisheries [STECF], 2018). Currently,
recruitment is expected to have a large impact on the                       European fish prices increased, especially in case of herring
corresponding fisheries and their economic performance. Recent              (EUMOFA, 2018). This trend started in 2014 and by 2017, they
low recruitment has occurred, despite high biomass levels (e.g.,            had reached 10% higher prices than in 2013. Between 2009 and
Nash et al., 2009; ICES, 2018b). Two main causes are suggested              2014, during the NEA mackerel “war,” Iceland joined into the
for this problem: (a) A shift in the planktonic community of the            mackerel fishery due to an increased abundance within their
North Sea due to oceanic climate changes, which results in less             EEZ. This lead to a decrease in mackerel market prices as the
food availability and suitability impairing the survival of young           catch volume increased drastically (Scientific, Technical, and
NSAS herring larvae (Gröger et al., 2009; Payne et al., 2009),              Economic Committee for Fisheries [STECF], 2012; Jensen et al.,
and (b) Changes in the physical environment, such as increasing             2015; EUMOFA, 2018). Yet, these shocks can not only affect fish
bottom-water temperatures close to the main spawning areas,                 but also fuel prices, which in turn have one of the largest effects
affecting the development times and metabolic rates of herring              on fleet profitability as fuel cost account for 15–22% of total costs.
larvae (e.g., Nash and Dickey-Collas, 2005; Corten, 2013).                  Additionally, a strategy “for a climate neutral Europe by 2050”
    In addition to low recruitment, recent changes in biomass               was released in 2018 by the European Commission (EC) seeking
distribution caused problems regarding access rights in the NEA.            innovation techniques that significantly reduce the greenhouse
Currently, total allowable catches (TACs) are partitioned among             gas emissions by 80% in the time frame of 1991 to 2050 (European
EU countries by applying a fixed allocation key called the “relative        Commission, 2018). In case of the fishing industry a respective
stability.” It was defined based on three principles: (1) Traditional       regulation is already in force since 2015, prohibiting fishing
fishing activities between 1973 and 1978, (2) the establishment             vessels to use crude oil in the Emission Control Areas (ECAs)
of Exclusive Economic Zones (EEZs) and the corresponding loss               and hence reducing the emission of sulfur oxides. This covers the
of potential fishing grounds in third countries’ waters, and (3)            EEZs of the North and Baltic Sea as well as of North America
the enlargement of the EU, which involved prioritizing countries            (Biermann et al., 2015). Additionally, a sulfur content reduction
particularly dependent on fisheries (Hoefnagel et al., 2015; Penas          in marine fuels was enforced outside ECAs from January 1st 2020,
Lado, 2016; Sobrino and Sobrido, 2017). Every year, EU countries            only leaving the more expensive marine gasoil as compliant fuel
receive a fixed share of the EU quotas based on the stock-                  option for European fleets (Kazokoglu and Jakštas, 2019).
specific relative stability, then quotas are swapped within the EU              Bio-economic models can be used to estimate the effects of the
in order to match the expected catch. The increased usage of                major sources of impacts to a fishery. Traditional bio-economic
quota swaps is already a sign of economic interests not being               models are static and based on modeling fish populations
entirely met (Hoefnagel et al., 2015; Penas Lado, 2016; Hoefnagel           solely as total biomass, disregarding reproductive success, age-
and de Vos, 2017). The growing problem is, however, that                    specific growth, and catchability (Schaefer, 1954; Doll, 1988; Pan
several conditions have changed over time: new fishing strategies,          et al., 2007; Bjørndal and Munro, 2012; Tahvonen et al., 2013).
changes in demand, the evolution of fleets, and changes in stock            Recently, dynamic age-structured bio-economic models were
productivity and their distribution (Sobrino and Sobrido, 2017).            used as tools for fisheries management. They incorporate and
In the case of NSAS herring, most of the biomass occurs in the              integrate anthropogenic as well as natural processes to generate
United Kingdom EEZ during the main fishing season in autumn                 a better understanding of feedback mechanisms between the two
and winter. This causes questions regarding access rights and               systems (Bastardie et al., 2013; Tahvonen et al., 2013; Maynou
represents a major topic in discussions about Brexit (Doering               et al., 2014; Simons et al., 2015; Pascoe et al., 2016; Nielsen
et al., 2017). These factors do not only affect members of the              et al., 2017; Da-Rocha et al., 2017). Equilibrium or “end-to-
EU. The NEA mackerel stock was noticed to shift and/or expand               end” models such as Atlantis, Ecosim with Ecopath (EWE) or
to the North-west since approximately 2007 (Astthorsson et al.,             SMART, usually have an increased focus on the complexity of
2012; Bruge et al., 2016; ICES, 2018c). Since 2012, mackerel catch          the whole ecosystem, including food webs, detailed functional
off Iceland and Greenland increased significantly (Hannesson,               groups and different human uses (e.g., Fulton et al., 2015; Wang
2013). In 2014, the EU, Norway, and the Faroe Islands agreed                et al., 2015; D’Andrea et al., 2020). In this study, we however
on a joint management strategy for 2015 and the subsequent                  apply the simulation and optimization model, FishRent, which
5 years, which Iceland and Greenland did not join yet (ICES,                is more focused on certain aspects of a system. It links an age-
2018c). These are all indications that access rights and the                structured population model with highly resolved catch and effort

Frontiers in Marine Science | www.frontiersin.org                       2                                              July 2020 | Volume 7 | Article 625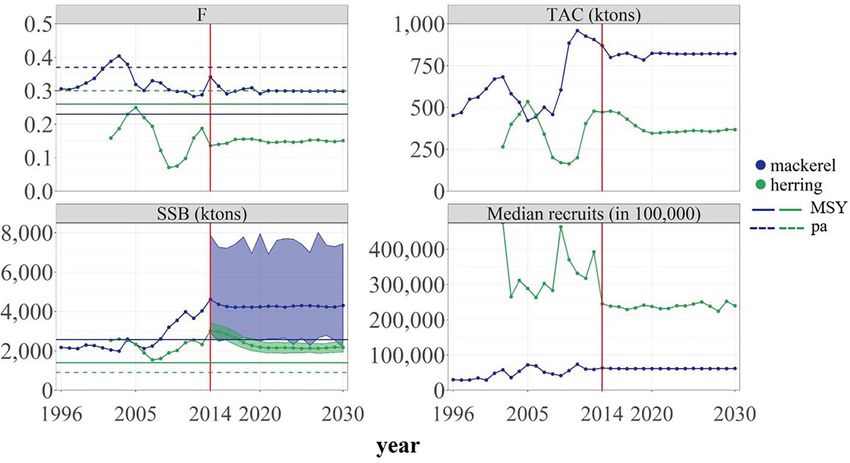
Rybicki et al.                                                                                                     Economic Perspectives of European Pelagic Fisheries

data as well as the detailed cost structure of different fleets                        solver (for a detailed description see Drud, 1994) to calculate
(Salz et al., 2011; Simons et al., 2015). It has been previously                       effort, maximizing the annual profit of a fishery given the current
used to study the impact of different management measures                              ecological, regulatory and economic conditions (Figure 1). To
on demersal European fleets (Bartelings et al., 2015; Simons                           avoid unrealistic interannual variation of effort, future simulated
et al., 2015). In this study, it was adopted and applied to                            effort of individual fleets may vary between a lower and
the NEA mackerel and NSAS herring fishery concentrating on                             upper limit set at 60% of historically observed total effort and
Danish, Dutch, German, Irish, United Kingdom, and Icelandic                            historically observed maximal total effort per vessel (for more
fleets. First, we compared the costs structure of those fleets in                      detail see Supplementary Table S3).
order to understand the underlying data and illustrate possible
differences. With the support of the FishRent model, we then
investigated the following factors with regard to their impact                         Economy
on the profitability of those eight fleets targeting the two focus                     The calculation of profitability includes: (1) revenue of
species: (1) changes in recruitment, (2) a quota repartition key                       fishing activities, (2) Capital and other fixed costs (e.g.,
adaptation according to biomass distributions, and (3) variations                      insurance, administration, maintenance, accountancy costs,
in fish and fuel prices.                                                               interest payments and annual depreciation costs), and (3)
                                                                                       operating costs including fuel, crew, and other variable costs
                                                                                       (e.g., income tax, expendables, landings, and sales costs) (Salz
MATERIALS AND METHODS                                                                  et al., 2011; Bartelings et al., 2015; Simons et al., 2015). Catch
                                                                                       and fish prices determine revenue and effort, revenue and fuel
Model Description                                                                      price determine the operating costs (see Equations S1–S7 in
FishRent includes the economics of multiple fleets (basic agent),                      Supplementary Material), whereas the number of active vessels
the impact of fishing on stock development, and the temporal                           sets the level of fixed costs. Discarding was not considered
interplay between fleets and fish stocks (Salz et al., 2011; Simons                    in this study since reported discards by pelagic fleets are
et al., 2015; Figure 1). The model is written in the General                           usually extremely low. More information concerning parameter
Algebraic Modeling System (GAMS) and uses the CONOPT                                   estimations can be found in Supplementary Material S2.

  FIGURE 1 | Schematic of the model process and the interaction between different sub-modules in FishRent. The effort is calculated until the maximum profit for all
  modeled fleet segments is estimated. This is used to calculate the catch by using the Cobb–Douglas production function, which has then an impact on the
  abundance, fishing mortality (F), biomass and, by applying and stock-recruitment relationship (SRR) function, recruitment calculation for the next time step. Boxes
  with bold dashed outlines signify parameters that were changed according to different scenarios.

Frontiers in Marine Science | www.frontiersin.org                                  3                                                   July 2020 | Volume 7 | Article 625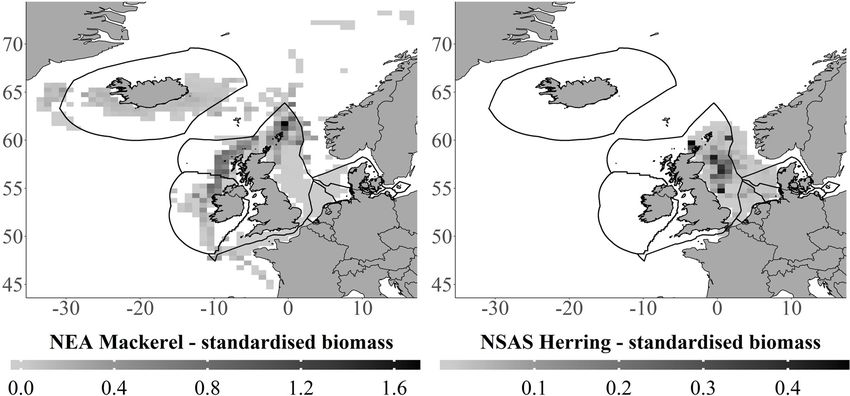
Rybicki et al.                                                                                        Economic Perspectives of European Pelagic Fisheries

(Dis-)investment                                                              WKPELA (ICES, 2018a; Equation 4a and 4b; Supplementary
Depending on the profitability of each fleet, fleet size can increase         Figure S3).
or decrease (in terms of number of vessels) after the first modeled                                α2 × SSBt
                                                                                                             × exp(D×CV−0.5×CV )
                                                                                                                              2
year. If fleets are profitable, reach their effort capacity, and are                        Rt =                                                       (3)
                                                                                                   β2 + SSBt
below their maximum investment limit, they can invest into new
vessels. If fleets are unprofitable, they are allowed to disinvest to a
                                                                                                   Rt = α2 × SSB × exp(D×CV−0.5×CV
                                                                                                                                             2)
maximum of 10% per year.                                                             SSB < Blim                                                      (4a)

Interface                                                                     Else
                                                                                                   Rt = α2 × Blim × exp(D×CV−0.5×CV
                                                                                                                                             2)
The fishing effort as well as the total stock biomass are used in the                SSB ≥ Blim                                                      (4b)
Cobb–Douglas catch production function, which assumes a non-
linear relationship between catch and effort as well as between                   The parameters α2 , β2 and Blim are species specific (Table 1). D
catch and stock size (Equation 1; Frost et al., 2009).                        is a standard normal deviate and CV is the coefficient of variation
                                                                              (CV = standard deviation/mean), which was estimated based on
                                             α1j    β1j
                        Ct,i,j = ct,i,j × Et,j × CBt,i             (1)        historical stock sizes for herring from 2012 to 2016 and for NEA
                                                                              mackerel from 2012 to 2014 (ICES, 2018b, 2019a). At the end of
where Ct,i,j is catch, ct,i,j is the catchability coefficient of ith          each year, all individuals within one age class are transferred to
age, and jth fleet at time t. Et,j is the fishing effort of jth fleet         the next and those older than the maximum age are aggregated in
at time t, CBt,i is the biomass at ith age at time t, and α1j                 the last age class.
and β1j determine the degree of non-linearity in the relation of                  Moreover, the age-specific fishing mortality Ft,i is calculated
catch and effort for a given stock size (Salz et al., 2011; García            using the estimated number of individuals from before
et al., 2014). The application of the Cobb-Douglas function is                (Equation 5).
of particular importance in case of pelagic fisheries, because fish
                                                                                                                  Nt,i

usually form large schools and a non-linear relationship between                                  Ft,i = −log              − Mi                 (5)
                                                                                                                Nt+1,i+1
effort and biomass levels in the catch is common (Frost et al.,
2009; Cruz-Rivera et al., 2018). The settings of the two parameters           Management
α1 and β1 have a significant influence on the estimation of                   Within the European Union, the TAC is now supposed to be set
maximum profitability and the remaining results, which is why                 according to the MSY approach. Within the start years (average
a sensitivity analysis of those parameters was performed (see                 2012–2014), fishing mortality (F) of mackerel was 32% higher
Supplementary Material S2).                                                   than the advised Fmsy (ICES, 2019a). This is mainly due to the
                                                                              fact, that no internationally agreed quotas existed as well as no
Biology                                                                       harvest control rules being active at this time, which still has not
With the calculated catch, the number of individuals Nt,i is                  changed. As to NSAS herring, fishing mortality was on average
estimated using Pope’s approximation (Pope, 1972; Equation 2).                44% below the advised Fmsy since 2007 (ICES, 2018b). In the
                                  P                                           scenarios of this study, we decided to keep the level of the actual
                            −Mi     j Ct−1,i−1,j    Mi
                                                                              fishing mortalities by adding a multiplier (the average F/Fmsy ratio
        Nt,i = Nt−1,i−1 exp     −        P exp− 2           (2)
                                  wt,i × j sj                                 of the last eight years from 2008 onward) to the advised Fmsy
                                                                              (Equation 6).
where wt,i is weight at age and sj is the catch share. Catch share                                                       F̄
                                                                                                   Ftar = FMSYadvice ×                         (6)
is a multiplier that determines total catch, hence accounting for
                                                                                                                          F MSY
the remaining fishing mortality by fleets not included in the
model. It is the proportion of each fleets catch from the TAC,                Ftar is not age-class specific. Thus, in order to account for an
also including Iceland, i.e., representing their quota shares (see            age-structured stock, partial fishing mortalities at age (Ftact,i ) are
Supplementary Table S4). The instantaneous natural mortality                  calculated by using the fishing mortality of the average age classes
rate is represented by Mi . Both catch share and natural mortality            that are considered to be fully exploited in the assessments (Ft ;
are constant over time.                                                       Equation 7).
                                                                                                               Ftar × Ft−1,i
    In addition, 1000 random stochastic iterations are computed                                     Ftact,i =                                     (7)
while applying the stock-recruitment (SR) function in order                                                         Ft−1
to include a standard error for recruitment and SSB. Median                   Together with the natural mortality (Mi ) a total mortality rate,
recruitment and spawning stock biomass (SSB) values are then                  called Ztact,i can be determined. These two parameters combined
used for further calculations. For NEA mackerel the Beverton and              with the abundance and weight at age are used in the Baranov
Holt SR function was applied using all years available at the time            Catch equation in order to calculate a catch according to Ftar
of the study (1980–2016) (Beverton and Holt, 1957; Equation                   (Baranov, 1918; Supplementary Figure S4; Equation 8).
3; Supplementary Table S1 and Supplementary Figure S2),                                       X           Ftact,i

because this showed the best fit to SR data (ICES, 2019a). For                 Catchtart,i =         Nt,i ×         × (1 − exp(−Ztact,i ) ) × wt,i
herring a restricted (Blim ) hockey-stick SR function was chosen                                            Ztact,i
                                                                                               i
for years 2002–2016, following Payne et al. (2009) and ICES                                                                                       (8)

Frontiers in Marine Science | www.frontiersin.org                         4                                              July 2020 | Volume 7 | Article 625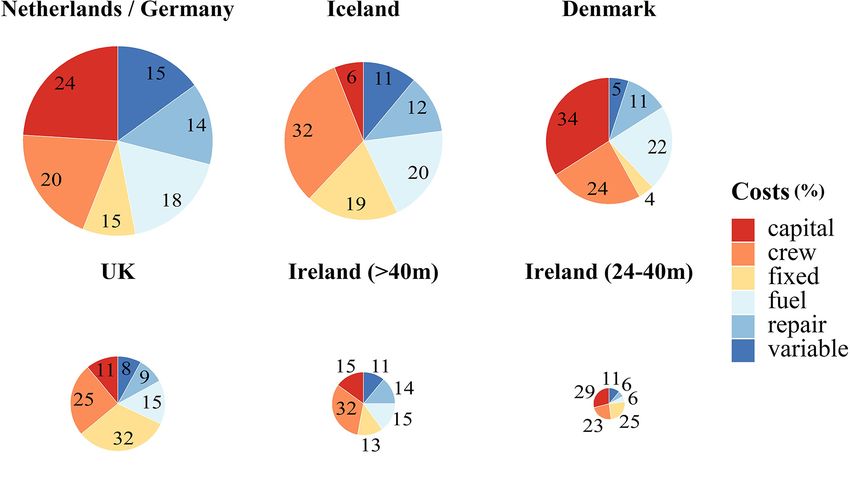
Rybicki et al.                                                                                                           Economic Perspectives of European Pelagic Fisheries

TABLE 1 | Overview of the baseline scenario and the specific parameter changes for the three alternative scenarios.

                                  Baseline (Scenario 1)             Scenario 2               Scenario 3                    Scenario 4                        Sources

Management         Objective      Current level of F cont.          As in baseline                                                                           ICES, 2018b,
Framework                                                                                                                                                    2019a
                   Instruments    Catch < Quota Catch < 95%         As in baseline                                         Quota repartition key according   Hoefnagel
                                  Biomass RS principle                                                                     to biomass distribution           et al., 2015;
                                                                                                                           NSAS herring (%): D (2.12), DK    ICES, 2018b,
                                                                                                                           (2.38), UK (64.82), NL (8.27)     2019a
                                                                                                                           NEA mackerel (%): D (0.005),
                                                                                                                           DK (0.0031), UK (61.79), IR
                                                                                                                           (21.32), NL (0.01), IS (14)
Economic           Fish Price     Current situation cont.           As in baseline           Increase and decrease         As in baseline                    EUMOFA,
Framework                                                                                    to historic first sale                                          2019a
                                                                                             max. and min. (frozen:
                                                                                             NL, D; fresh: IS, IR, UK,
                                                                                             DK)
                   Fuel Price     Current situation cont.           As in baseline           Increase and decrease         As in baseline                    EUMOFA,
                                                                                             to historic max. and                                            2019b
                                                                                             min. (marine gasoil)
Ecological         Stock-         NSAS herring: α2 = 41             (1) NSAS herring:        As in baseline                                                  ICES, 2019a,
Framework          Recruitment    β2 /Blim = 800,000                α2 = 24.3                                                                                2018a
                   Relationship   NEA mackerel: α2 = 10,269,723     (2) NSAS herring:
                                  β2 = 2,854,680                    α2 = 7.6
                                                                    Both: until 2030

Fish and fuel price changes are in nominal terms. Country abbreviations: Germany (D), Denmark (DK), United Kingdom (UK), Netherlands (NL), Ireland (IR), Iceland (IS).

This is used as the new TAC on a species level for the next                                  In order to set up the model, detailed biological data at
year. Ftar is not adjusted annually in any scenario, again due                           age such as abundance, natural mortality and weight as well as
to the fact that for neither of the two species a harvest control                        spawning stock biomass (SSB) and recruitment was incorporated
rule is currently in place. In general, all fleets are not allowed                       from the most recent stock assessments at the beginning of this
to fish more than their quota, which is a fixed proportion (i.e.,                        study (ICES, 2018b, 2019a). Data for mackerel was however
the previously introduced catch shares) of the TAC. This is an                           updated due a significant change in the scientific assessment at
additional restriction to the effort limits wherein the model is                         the beginning of 2019 (ICES, 2019a). In the new assessment,
allowed to operate. Moreover, total catch cannot be larger than                          biological data was adjusted due to a different weighting
95% of the total biomass of the stock.                                                   procedure of three scientific surveys, which lead to the tagging
                                                                                         data having a larger influence on the assessment results than
Data and Settings                                                                        before (ICES, 2019a). Hence, a much more positive perception of
FishRent was run for a period of 16 years (2014–2030) using                              the population was estimated, also leading to an improved catch
five fleets (one Dutch, United Kingdom, and German as well as                            advice for the NEA mackerel stock. We used the default average
two Danish) targeting both NEA mackerel and NSAS herring                                 of 3 years (2012–2014) as biological input for the starting year
directly and three fleets (one Icelandic and two Irish) exclusively                      2014. For NSAS herring, an average of 5 years (2012–2016) was
targeting NEA mackerel (Figure 2). Only fleets where mackerel                            chosen due to significant biological changes after 2014, especially
and herring constituted more than 25% of the total landings                              in fishing mortality and weight at age (ICES, 2018b).
value for at least one of the two species were considered
in the modeling approach. Fleets consist of multiple vessels                             Scenarios
and were classified by vessel length (vl in meters) using two                            Scenario 1: The Baseline
categories ranging from 24 to 40 m and over 40 m as well                                 In the baseline scenario, FishRent projects the optimal behavior
as two predominant gear types [pelagic trawlers (TM) and                                 of fishermen in order to maximize the fleets profitability for
purse seiners (PS)]. This uses the classification of the European                        16 years using current conditions of F, the quota repartition key,
data collection framework as implemented by the Scientific,                              fish and fuel prices, and the SR relationships. It is the basis for the
Technical and Economic Committee for Fisheries (Scientific,                              other scenarios (Table 1).
Technical, and Economic Committee for Fisheries [STECF],
2018). Detailed economic data (e.g., costs, effort, profit etc.)                         Scenario 2: Reduced Recruitment of NSAS Herring
was received directly from national labs, also averaged over the                         As continued low recruitment of NSAS herring may have a
years 2012 to 2014. Although Norway is also a major fishing                              large impact on the corresponding fisheries and their economic
nation targeting NEA mackerel and NSAS herring, we did                                   performance, different magnitudes of reduced recruitment were
unfortunately not receive any data in the detail and resolution                          tested: (1) Extreme and (2) Medium. This was done by adjusting
needed for the model.                                                                    the density-independent parameter α2 (i.e., the amount of

Frontiers in Marine Science | www.frontiersin.org                                    5                                                      July 2020 | Volume 7 | Article 625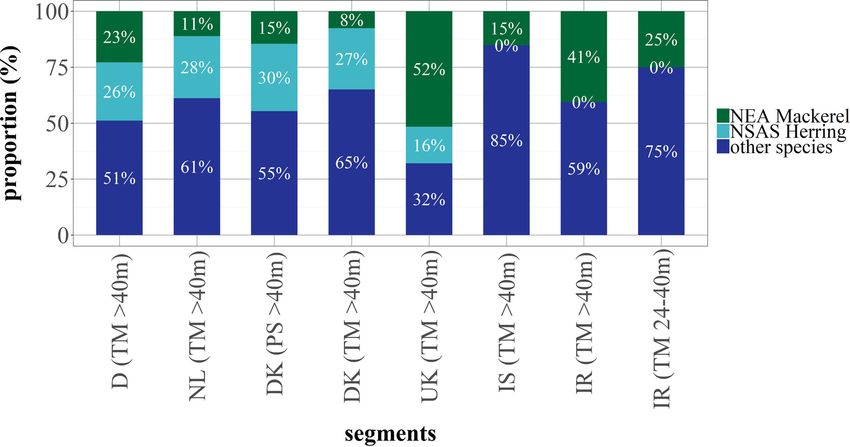
Rybicki et al.                                                                                                      Economic Perspectives of European Pelagic Fisheries

  FIGURE 2 | Catch composition of NSAS herring (%, light blue), NEA mackerel (%, green) and other species (%, dark blue) for the eight modeled fleets at the starting
  point (2014). The proportion of other species stays fixed throughout the model runs.

recruits per unit of biomass) in the SR relationship. For                             TABLE 2 | Model prices for each fleet [fish prices (€kg−1 ): landings value divided
the extreme setting, the lowest historic recruitment-SSB-ratio                        by landings weight, fuel prices (€l−1 ): fuel price divided by fuel consumption] also
                                                                                      shown are nominal historic prices (extremes) of first sale for fish (€kg−1 ) and
observed since 2002 was determined, which occurred in 2003
                                                                                      marine gasoil (€l−1 ) in between 2008 and 2019.
(ICES, 2018b; Table 1). This is also the period considered in the
SR relationship of the NSAS herring assessment. The resulting                         Segment               Product               Model         Minimum         Maximum
value of α2 = 7.6 was then used as a target for the final modeling                                                                price          price           price
year 2030. For the second (medium) setting, the mean between                          NL (TM > 40 m)        Frozen Herring         0.35            0.35              1
the current (α2 = 41) and the extreme was applied to be attained                      D (TM > 40 m)         Frozen Herring         0.46
until 2030, which was α2 = 24.3 (Table 1).                                            UK (TM > 40 m)        Fresh Herring          0.43            0.25             1.55
                                                                                      DK (TM > 40 m)        Fresh Herring          0.46
Scenario 3: Fish and Fuel Price Variations                                            DK (PS > 40 m)        Fresh Herring          0.47
Fish and fuel prices and their effect on the fleets are                               NL (TM > 40 m)        Frozen Mackerel        1.18            0.9               3
hard to predict. In this study, historic first sale fish and                          D (TM > 40 m)         Frozen Mackerel         0.9
marine gasoil price time-series data (2008–2016) were obtained                        UK (TM > 40 m)        Fresh Mackerel         1.05            0.5               10
from the European Market Observatory for Fisheries and                                DK (TM > 40 m)        Fresh Mackerel         1.04
Aquaculture Products (EUMOFA) data portal (EUMOFA,                                    DK (PS > 40 m)        Fresh Mackerel         1.02
2019a,b; Tables 1, 2). First sale price for fish was available for                    IR (TM > 40 m)        Fresh Mackerel         0.76
either fresh or frozen products. For the German and Dutch                             IR (TM 24–40 m)       Fresh Mackerel         0.79
fleets, herring and mackerel first sale prices for frozen products                    IS (TM > 40 m)        Fresh Mackerel         1.49
were used, whereas for the remaining six fleets (Ireland, Iceland,                    NL (TM > 40 m)        Marine gasoil          0.49            0.33             0.85
United Kingdom, and Denmark) fresh first sale prices were                             D (TM > 40 m)         Marine gasoil          0.42
incorporated. The information about the main processing type                          UK (TM > 40 m)        Marine gasoil          0.66
(fresh or frozen) being used by each fleet was also obtained from                     DK (TM > 40 m)        Marine gasoil          0.63
national labs. The most rapid change in price over the mentioned                      DK (PS > 40 m)        Marine gasoil          0.63
time period was identified for each focus species and fleet. This                     IR (TM > 40 m)        Marine gasoil          0.73
was, on average, a year-to-year change (EUMOFA, 2019a,b).                             IR (TM 24–40 m)       Marine gasoil          0.74
Hence, historic price peaks and low points then replaced the                          IS (TM > 40 m)        Marine gasoil          0.66
original start values as a sudden, from year-to-year change from
                                                                                      For all, except fresh mackerel, the mean price per country and year was used. In
year 2020 onward (Tables 1, 2). This year was chosen as a                             case of fresh mackerel, the unresolved price data per month, year, and country was
reference year, as it marks a point where historic biological                         integrated (EUMOFA, 2019a,b).

Frontiers in Marine Science | www.frontiersin.org                                 6                                                       July 2020 | Volume 7 | Article 625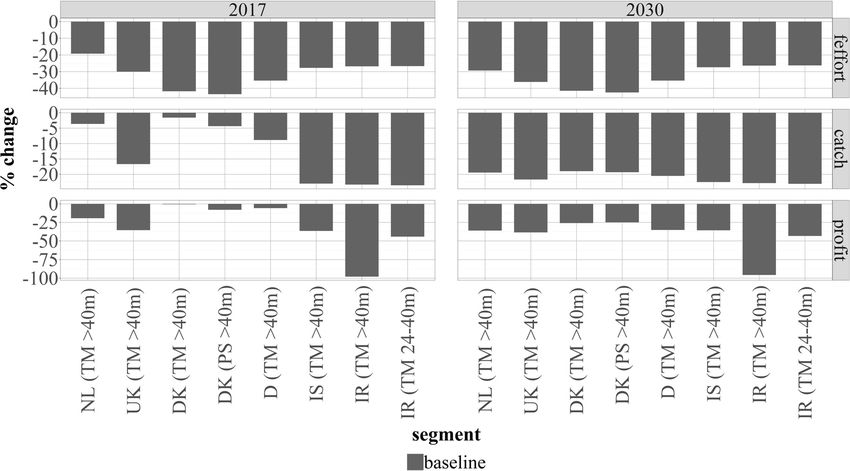
Rybicki et al.                                                                                           Economic Perspectives of European Pelagic Fisheries

  FIGURE 3 | Standardized biomass: NSAS Herring (mean 2012–2017) calculated from the NS-IBTS (3rd quarter) standardized CPUE per age and subarea and NEA
  mackerel (mean 2012–2014) calculated from the standardized commercial CPUE of each modeled fleet segment. Shown are all age classes summarized (ICES,
  2018b, 2019a).

effects are less predominant, hence showing actual effects of                   in order to account for the different gear techniques applied
the price alterations. Fish and fuel price scenarios were run                   by the fleets. This standardized CPUE was used as a proxy to
separately as well as in combinations (e.g., low fish, high fuel                calculate the standardized biomass (Figures 3, 4; ICES, 2019a).
price, and vice versa).                                                         The approach assumes that fishermen would, through experience
                                                                                and sonar techniques, always know where schooling fish is
Scenario 4: Adapting the Quota Repartition Key                                  located. In reality, this behavior can actually be observed when
An alternative approach other than the relative stability (RS)                  targeting pelagic species with well-developed sonar techniques.
principle was employed, primarily reflecting political forcing                  The approach should thus provide a rough estimate of mackerel
such as Brexit or the “mackerel war” (Ørebech, 2013; European                   proportions in each EEZ at the time when the modeled fleets
Parliament, 2017; Table 1). This was an attempt to adapt the                    target mackerel in order to see the main effects of implementing
quota repartition key to the current biomass distribution of                    an adapted quota repartition key.
both focus species. For this, two different approaches had to
be used, one for each species. For NSAS herring, total biomass
was calculated from abundance data in each ICES rectangle                       RESULTS
(mean 2012–2017) of the North Sea International Bottom Trawl
Survey (NS-IBTS of the 3rd quarter; “CPUE per age and subarea”                  All economic results presented in the following section are either
downloaded from DATRAS on the 10th of March 2019), which                        given as percentage change over time or, in case of absolute
was standardized. Weight-at-age (kg) in the stock data (mean                    numbers, aggregated into clusters of more than 10 vessels
2012–2017) from the HAWG Report (ICES, 2018b) was then                          where appropriate.
applied to the standardized abundance-at-age data in order to
obtain a standardized biomass within the North Sea area. The                    Cost Structure of Modeled Fleets – The
proportions of NSAS herring biomass in each EEZ of the modeled                  Input
fleets were then determined by using a geospatial intersect                     The cost structure of the eight modeled fleets was investigated
operation in ArcGIS (Version 10.5.1) and were finally used as                   and showed unexpected differences (Figure 5). Capital costs,
each fleets new quota repartition key (Figures 3, 4 and Table 1).               which also include annual depreciation costs, varied from 6% of
    For NEA mackerel, it was difficult to find standardized                     total costs (Iceland) to 34% (Denmark). A similar observation
abundance or biomass data including not only the European                       could be made concerning fixed costs, which include insurances,
EEZs but the whole NEA, i.e., also the entire Icelandic EEZ.                    administration and accountancy as well as fees such as harbor
However, as Iceland is included as a modeled fleet and as                       dues. The Danish fleets showed the smallest fixed costs share
mackerel now keeps migrating into the Icelandic EEZ, this area is               of only 4% per kg landed fish, whereas the United Kingdom
of high importance for future management strategies and should                  fleet had the largest share of fixed costs (32%) (Figure 5). Crew
also be incorporated into the analysis. Therefore, catch- and                   costs share, on the other hand, were very similar among fleets
effort-at-age data of the modeled fleets were used to calculate                 (average: 26% per kg landed fish) and seemed to be independent
catch-per-unit-effort (CPUE), which was in turn standardized                    from vessel sizes and fishing technique. The same applies to

Frontiers in Marine Science | www.frontiersin.org                           7                                               July 2020 | Volume 7 | Article 625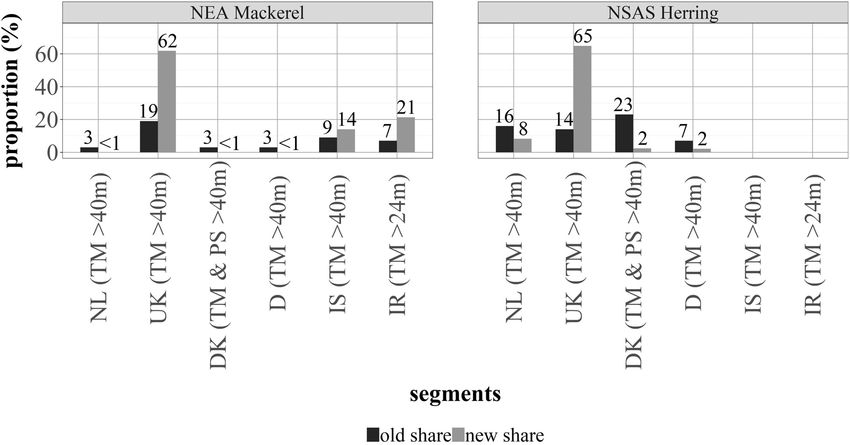
Rybicki et al.                                                                                                   Economic Perspectives of European Pelagic Fisheries

  FIGURE 4 | Old (for all fleets catching > 25% of both species, black) and new (gray) quota partition keys (%) for NSAS herring and NEA mackerel.

  FIGURE 5 | Cost structure [proportion (%) per kg landed] of the eight modeled fleets, average of years 2012 to 2014. The size of each pie chart shows the
  proportion of total costs per vessel in comparison to the other segments. Due to data privacy reasons the Dutch and German fleets as well as the two Danish fleets
  were aggregated (all segments shown here contain > 10 vessels). The cost structure of the Icelandic fleet was estimated by using United Kingdom costs structure.

Frontiers in Marine Science | www.frontiersin.org                                 8                                                  July 2020 | Volume 7 | Article 625
Rybicki et al.                                                                                                 Economic Perspectives of European Pelagic Fisheries

  FIGURE 6 | Total costs and revenue (Euro per kg landed) of the eight modeled fleets with an average of years 2012 to 2014. This also includes revenue from other
  species caught by those segments. Due to data privacy reasons the Dutch and German fleets as well as the two Danish fleets were aggregated (all segments shown
  here contain > 10 vessels). The cost structure of the Icelandic fleet was estimated by using United Kingdom costs structure.

the fuel (18% on average of the fleets) and repair costs share                       2018, similarly to the observed data from the assessment but
(12% on average). The only exception was the Irish fleet (24–                        remained 35% higher on average (Figure 7).
40 m) with a fuel and repair costs share of only 6% per kg                              Further, when examining the biological results of the baseline
landed. Variable costs share, containing income tax, expandable                      scenario until 2030, a decrease in SSB from nearly 5,000 ktons
material, landing and sales fees, subsistence and travel expenses                    in 2014 to 4,000 ktons from 2017 on could be noticed for NEA
as well as radio costs, was on average 10% per kg landed fish.                       mackerel (Figure 8). As to NSAS herring SSB decreased from
Again, only the Danish fleets stood out with only 5% of variable                     3,000 ktons to 2,000 ktons in 2020, after which year this level
costs share. In general, the Netherlands and Germany had the                         was maintained (Figure 8). This is a level that corresponds to the
largest amount of costs compared to the other modeled fleets,                        average historic trend between 1996 and 2013. Hence, the SSB
followed by Iceland, the Danish, United Kingdom, and Irish                           peaks observed in historic data between 2012 and 2014 seemed
fleets (Figure 5).                                                                   to represent rather exceptional years caused by high recruitment
    As to the relation of total costs and revenue per kg of                          in 2009 and 2013.
landings, revenue of seven out of eight fleets was 57% higher                           Moreover, as SSB decreased, the TAC of both NEA mackerel
on average than the total costs per kg landed (Figure 6).                            and NSAS herring also declined until after 2020 it became
One exception was the large-scale Irish fleet (>40 m) with                           relatively stable (Figure 8). Both SSB and Ftar influence the
only 13% difference between revenue and total costs. This                            TAC level. Yet, the latter has less influence in all scenarios
fleet received 0.13 €kg−1 more on average than the other                             because it is kept on a similar level as the actually observed F of
seven fleets, but had a significantly higher proportion of                           the last few years.
total costs at the same time (0.25 €kg−1 more on average).
This made the large-scale Irish fleet more vulnerable to any                         Economy
negative effects implemented than the other modeled fleets.                          As a result of the biomass decline of NEA mackerel and NSAS
The two fleets with the largest difference between total costs                       herring in the baseline scenario, total catch of the modeled
and revenue (0.22 €kg−1 ) and therefore being least vulnerable                       fleets decreased (Figure 9, gray bars). The fleets affected most
to harmful impacts were the smaller Irish (24–40 m) and the                          within the first three years were the two Irish, the Icelandic,
United Kingdom fleets.                                                               and the United Kingdom fleets. From the two focus species,
                                                                                     the United Kingdom fleet catches mainly mackerel but the Irish
                                                                                     and Icelandic fleets catch exclusively mackerel (Figure 2). Those
Scenario 1: The Baseline                                                             four fleets caught between 15 and 25% less in 2017 compared
Biology                                                                              to the start year 2014. Until 2030, the United Kingdom catch
When comparing the baseline scenario to data of the                                  decreased by another 5%. The fleets targeting primarily NSAS
corresponding mackerel assessment reports, trends were                               herring were not affected as fast: The German fleet was impacted
similar and model results were also within the 95% CI (Figure 7).                    most, catching 10% less in 2017 and 19% less in 2030. Catch of
The trend of NSAS herring SSB output from the baseline                               the other three fleets was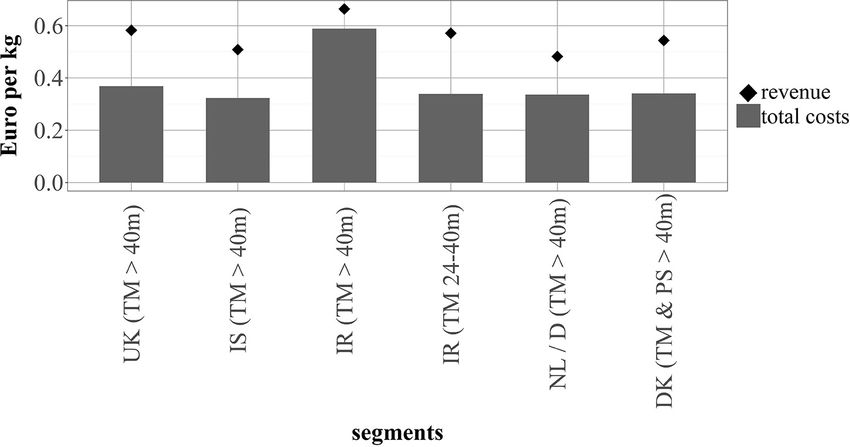
Rybicki et al. Economic Perspectives of European Pelagic Fisheries
FIGURE 7 | Comparison of the baseline scenarios SSB in tons (median of 1000 iterations; gray) with its 95% CI in comparison to the assessments SSB in tons
(black). This was performed for NSAS herring with data from the 2018 assessment report (ICES, 2018b) as well as for NEA mackerel with data from the updated
assessment in 2019 (ICES, 2019a).
FIGURE 8 | Biological output (SSB and median recruitment) as well as TAC and F from the baseline scenario for NSAS herring (green) and NEA mackerel (blue). The
Beverton-Holt SR relationship was used for mackerel (α2 = 10,269,723, β2 = 2,854,680) and the restricted hockey-stick relationship for herring (α2 = 41;
β2 = Blim = 800,000t). SSB is shown with the 95% CI calculated from 1000 iterations; median recruitment is shown without the corresponding CI, because it
displayed enormous variations from nearly none up to 2.5 trillion with some peaks even higher in case of herring. After 2010, TAC values for mackerel represent the
sum of unilateral quotas as no international agreed quotas exist. Start year of the model was 2014 (red line). Horizontal solid lines represent the MSY and dashed
lines represent the precautionary limit of F and SSB for NSAS herring (green) and NEA mackerel (blue).
by decreasing their total and fishing effort. By 2017, the large- decrease in recruitment with the moderate setting of 24.3 could
scale Irish fleet (>40 m) was already up to 100% less profitable be observed in 2030 compared to the baseline scenario and a 58%
(Figure 9). The profitability of the two Danish fleets was affected decrease with the extremer setting of 7.6. This consequently led to
least and only decreased by 25% in 2030, whereas most other a reduction in total abundance, SSB and total stock biomass, the
fleets were 40% less profitable compared to the start year. extent depending on the degree of change (More information can
be found in Supplementary Figures S5, S6). The α2 = 24.3 setting
lead to 18% less SSB until 2030 compared to the baseline scenario,
Scenario 2: Reduced NSAS Herring whereas in the α2 = 7.6 setting SSB decreased by 48%. Changes
Recruitment in α2 had by far the most influence on herring SSB compared to
When reducing the parameter α2 (i.e., the amount of recruits per all other scenarios and affected catch and the related economic
unit of biomass) in the SR relationship of NSAS herring, a 23% parameters of the fleets accordingly (Figure 10).
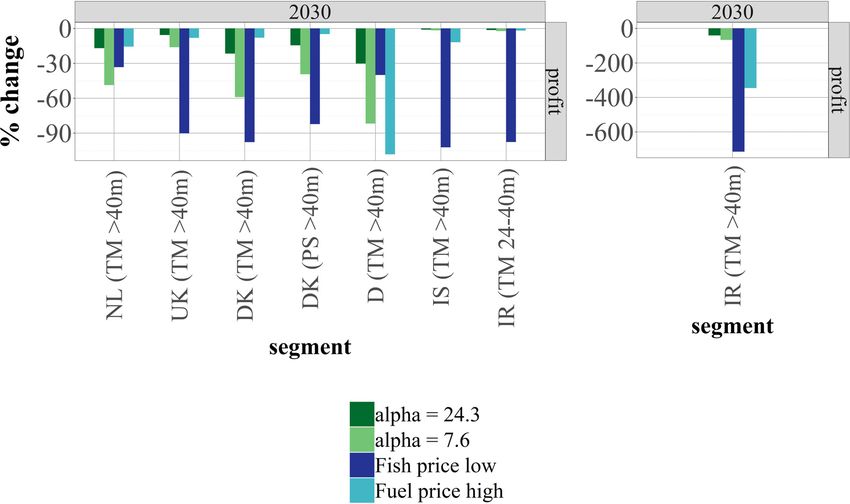
Frontiers in Marine Science | www.frontiersin.org 10 July 2020 | Volume 7 | Article 625Rybicki et al. Economic Perspectives of European Pelagic Fisheries FIGURE 9 | Economic output of each modeled fleet from the baseline scenario: fishing effort (feffort), catch, and profit in 2017 and 2030 relative to the start year 2014. FIGURE 10 | (A) Change in profitability of eight modeled fleets compared to the baseline scenario when reducing recruitment (scenario 2 - green shades, here results of both settings of alpha are shown: alpha = 24.3 is the medium setting and alpha = 7.6 the extreme setting), lowering fish price (scenario 3 – dark blue), and increasing fuel price (scenario 3 – light blue). A different scale was used for the large scale (>40 m) Irish fleet in (B). Frontiers in Marine Science | www.frontiersin.org 11 July 2020 | Volume 7 | Article 625
Rybicki et al.                                                                                        Economic Perspectives of European Pelagic Fisheries

    Fleets catching NSAS herring all decreased in profitability over          Scenario 4: Adapting the Quota
time compared to the baseline scenario (Figure 10). The Icelandic             Repartition key
and Irish fleets do not show large differences. As to the other five
fleets, the influence of the α2 = 24.3 scenario on profitability was          The analysis of the spatial biomass distributions showed the
not as strong as in the α2 = 7.6 setting: Profit in the former only           largest proportions of NEA mackerel and NSAS herring situated
decreased in between 5 and 30%. The α2 = 7.6 setting had a larger             in the United Kingdom EEZ, followed by Ireland and Iceland.
effect on fleet profitability, where the Dutch and Danish fleets had          Since the biomass proportion of both species was very low in the
a 45% reduction of profit on average and the German fleet even                Danish, German, and Dutch EEZs, the share for those countries
up to 80% (Figure 10).                                                        was also very low (
Rybicki et al. Economic Perspectives of European Pelagic Fisheries
FIGURE 11 | Change in profitability of eight modeled fleets compared to 2020 (A,B) when implementing new catch shares in 2021. In 2020, the old catch shares
were still intact. A different scale was used for the large scale (>40 m) Irish fleet in (B).
DISCUSSION the effort of more frequent returning trips to the fishing grounds
by the RSW trawler seem to outweigh each other, generating
Pre-analysis: Cost Structure of Modeled this similarity. One exception was the smaller Irish fleet (24–
40 m), which had a fuel cost share of 3% of revenue. This is
Fleets
due to the smaller number of sea days compared to the >40 m
In order to be able to interpret the model outcomes from
fleets (approximately 13% less), which might in turn be a reason
the different scenarios a data pre-analysis was conducted.
why their fixed costs share was the second largest of all fleets
Although all vessels were >24 m in length the cost structure
(25% of revenue).
differed in some cases.
Fixed Costs Crew Costs
One example were fixed costs (incl. insurances, administration, The crew costs share was also surprisingly similar amongst
accounting and harbor dues): The United Kingdom and Irish all fleets (av.: 16% of revenue), independent of vessel size.
fleets as well as the Icelandic fleet had a very high share in fixed Freezer trawler were expected to have a lower share of
costs (15% of revenue on average) compared to the German, crew costs compared to RSW vessels, being floating factories
Dutch, and Danish fleets (4% of revenue on average). This and using automated processing machines that substitute
difference can be explained by the various fishing techniques labor to some extent (KNARR, 2019a,b). Onboard freezer
used. The German and Dutch fleets, for example, use pelagic trawler, labor costs are not entirely fishing but also processing
freezer trawlers that can actively trawl for a longer period of labor and enables corresponding companies to reduce their
time while processing the catch directly on board. Refrigerated labor costs on land. Findings of Tietze et al. (2001, 2005),
Seawater (RSW) trawlers as used by the United Kingdom, Irish, suggest a decline in labor cost share between 1995 and
Danish, and Icelandic fleets, on the other hand, apply tanks filled 2003 with increasing technological advances: For example,
with water in order to cool the fish caught and need to return to between 1995 and 1997, labor costs share of the German
the harbor more often as the storage capacity is smaller (KNARR, pelagic trawler fleet (90–120 m in length) made up 44%
2019a,b). They might therefore have a higher share of fixed costs of total costs (Tietze et al., 2001). In 2002 and 2003,
due to more frequent discharges in the harbor. The difference it was only 36% (Tietze et al., 2005) and in this study
is also reflected in vessel sizes: The freezer trawler, with a much even less (18% of total costs as an average of 2012-2014
larger storage capacity, are around 110m in size, whereas the RSW combined with the Dutch fleet). Concerning the Dutch fleet
trawler tend to be around 50–60 m. only, crew costs in general seemed to decrease by 22%
from 2008 until 2016 (Scientific, Technical, and Economic
Fuel and Repair Costs Committee for Fisheries [STECF], 2017). At the same time
The storage capacity and technique, on the other hand, does number of vessels were half in 2016 compared to 2008,
not seem to affect fuel and repair costs share. Usually freezer but the total number of crew members also decreased by
trawler cover a much larger area in contrast to the RSW trawler, 27%. Crew costs can, however, also be influenced by other
which need to stay closer to the harbor. Hence, one might parameters than just technological advances. These are usually
expect the former to have a larger amount of fuel costs share fish prices as well as the amount of fish caught. This is
compared to the latter; however, both were in between 10–13% mainly because the major proportion of the salary depends
of revenue. Hence, the large area covered by freezer-trawler and on the amount of fish caught. Crew members receive a
Frontiers in Marine Science | www.frontiersin.org 13 July 2020 | Volume 7 | Article 625Rybicki et al. Economic Perspectives of European Pelagic Fisheries
certain proportion of the catch value, depending on the to represent the most profitable decision. Other external factors
position they hold. may have occurred which could not be influenced by fishermen
(i.e., storms, vessel break-down). Moreover, the assumptions in
Capital Costs the model do not always correspond with the knowledge of
The share of capital costs, which include depreciation and the fishermen, who rather fish according to past experience.
interest, was similar amongst six out of eight fleets ranging from This might have then affected fishing mortality in another
14–21% of revenue. Two fleets, Iceland and the United Kingdom, way than estimated by the model, in turn also affecting the
however, only had a capital cost share between 4 and 7% of biomass differently.
revenue. This can occur due to four possibilities: (1) High In the biological output from the baseline model recruitment,
proportion of self-financing, (2) cost transfers within companies abundance, and biomass of both NEA mackerel and NSAS
operating pan-European, (3) better terms of credit, and (4) herring decreased and stayed stable after 2020. This stable
high vessel ages that are maintained with the company’s own pattern occurs due to the amount of 1000 random iterations
holdings. In case of the United Kingdom, average vessel age for recruitment and SSB and the consequent usage of the
increased over time, but this is also valid for all other fleets median. The calculated confidence intervals (CI’s) show how
(Scientific, Technical, and Economic Committee for Fisheries large the error might actually be, which is extremely high
[STECF], 2017). Additionally, the average United Kingdom especially for herring from nearly none up to 2.5 trillion.
vessel age is the lowest: 13 years between 2008 and 2016, Yet, this is still in line with the 95% CI from assessment
which indicates a larger capital cost share due to newer reports (ICES, 2018b, 2019a). Moreover, the SSB trend of
vessels and a larger amount of depreciation. For most other the baseline scenario was similar for both species compared
fleets, on the other hand, average vessel age was more than to the assessment. Some differences could still be noticed,
19 years in the same time-period (Scientific, Technical, and particularly concerning herring SSB. A reason for differences
Economic Committee for Fisheries [STECF], 2017). Therefore, between the baseline scenario and assessment values is the
the first two possibilities mentioned before may be the usage of an optimization routine in FishRent. This is not
most likely concerning the United Kingdom. First, a high included in assessments, as these try to describe the actual
proportion of financing from own resources is possible if condition of the population in order to recommend a sustainable
vessels are mainly owned by large-scale, pan-European operating management advice, not what would be most profitable for the
companies through a process called “quota hopping.” It is fleets. Unfortunately, it was not possible to incorporate any
usually defined as the process where companies buy vessels data prior to 2012 in this study, which is why baseline model
and flag them in other countries. Second, profit and cost outputs to assessment values could not be compared to a longer
transfers within those large-scale companies are also common. time-period. To get a clearer picture of how well the model
In Germany, depreciations (included in capital costs) as well results reflect the observed trend of assessments it would be
as subsidiary profits can be transferred to the parent company recommendable to include a larger number of years. Yet, for
through a so-called profit transfer agreement (Gelder and the years that could be used, the differences are only small
Spaargaren, 2011). This can be a reason why the German and fit well to what has been observed. This indicates that
fleet had a smaller capital costs share and was close to the decisions made by the model of what is most optimal in
the break-even point in all scenarios, whereas the Dutch terms of profitability also fits roughly to decisions made by
fleet was far more profitable with a much larger share fishermen in reality.
of capital costs.
In case of Iceland, the actual cost data was lacking. From all (Dis-)Investment
modeled fleets, the United Kingdom fleet had most similarities In the decrease in fish price setting from the price variation
to the Icelandic fleet especially in terms of the amount of fishing scenario, three fleets disinvested and therefore reduced their
days per vessel and vessel age. Moreover, both fleets use primarily vessel numbers because they were unprofitable, i.e., the costs
RSW trawlers to catch mackerel. Hence, the United Kingdom were higher than the revenue. In reality, fishermen or companies
costs structure was used to estimate capital, other fixed, crew, would not directly sell their vessels in case a fishery turns
repair, fuel, and variable costs for the Icelandic fleet. This might unprofitable. The system is very inertial, which is partly due
therefore generate a relatively small share of capital costs for to the fact that licensing for quotas is needed, making it
Iceland as well as the United Kingdom. particularly difficult to sell large vessels in Europe. In the
A more detailed discussion of capital costs and model, also several conditions control fleet size changes: First,
problems concerning their estimation can be found in (dis-)investment can only occur after the first modeled year.
Supplementary Material S1. Second, if fleets are profitable, reached their effort capacity
and are below their maximum investment limit, they can
Robustness of the Biology Module invest into new vessels. Third, if fleets are unprofitable, they
FishRent is an age-structured profit maximization model, not are allowed to disinvest a maximum of 10% per year. The
a stock assessment model, and the baseline scenario does not investment limits in this model version were determined by
represent a status quo. Hence, modeled fleets will always aspire to the maximal change of investment and disinvestment observed
be as profitable as possible under the given circumstances. How within the last 10 years (Scientific, Technical, and Economic
fleets actually behaved in reality does, however, not always have Committee for Fisheries [STECF], 2016). This approach was also
Frontiers in Marine Science | www.frontiersin.org 14 July 2020 | Volume 7 | Article 625Rybicki et al. Economic Perspectives of European Pelagic Fisheries
used by Bartelings et al. (2015) and Simons et al. (2015). Yet, historic price (herring: 0.35€kg−1 , mackerel: 0.90 €kg−1 ; Table 2)
Frost et al. (2013) note the sparseness of empirical evidence was only 31% and none in case of mackerel. For all other
for the investment behavior of fleets, but also emphasize fleets, fish prices were reduced by at least 70% to reach the
the importance of such module in economic models that low historic price of our scenario. The effect of reducing fish
display long-term resource rent developments. Disinvestment prices thus did not have a very large effect on the German fleet
in these model runs are therefore interpreted as a sign of compared to altering fuel price. Additionally, the German as well
overcapacity within a fleet. as the large-scale Irish fleets were close to the break-even point
from the beginning, making them more vulnerable to further
Scenarios disturbances than other fleets in all scenarios. The large-scale
In this study, the scenario affecting the profitability of all Irish fleet additionally received the smallest value per kg fresh
fleets the most was the adaptation of the quota repartition mackerel (0.76 €kg−1 ). Hence, the difference to the low fish
key scenario according to the biomass distribution of NEA price scenario was by 52%. Furthermore, their margin between
mackerel and NSAS herring. The degree of profitability largely revenue and total costs per kg was only 0.10 €kg−1 , whereas for
depended on the newly calculated shares and hence the the others it was on average double (0.21 €kg−1 ). These are all
amount of mackerel and herring each fleet was allowed to reasons for the extreme sensitivity of the large-scale Irish fleet
catch. Not many other studies have been conducted in a to any alteration induced by the scenarios tested, most of all
similar way. Léopold et al. (2013) evaluated the biological lowering the fish price.
and economical success of spatial collective quotas concerning Both, fish and fuel prices alterations, where implemented as
an artisanal sea cucumber fishery in New Caledonia. Their a sudden event. In our results, the Dutch fleet was affected
results showed a higher stock resilience, buffering effects of least by any changes implemented into the model. The quota
market fluctuations and periodic overfishing. Holland already concentration and enterprise enlargement imply profit and costs
stated in Holland (2004), that costs (e.g., for monitoring transfers, as already discussed earlier. This could be a reason
and enforcement) may be higher when implementing spatial for their larger revenue-costs margin compared to the other
fishery quotas, although such management may provide a more fleets, which nearly reached their break-even point until 2030.
optimal usage of resources. In the case of the NEA mackerel This enhances their resilience to any additional impacts that
and NSAS herring fishery, the German, Dutch, and Danish may occur and often these events do not appear one at a time.
fleets would, however, lose two highly important fisheries. The Yet, one shock where a massive disinvestment in the Dutch
United Kingdom and Irish fleets, on the other hand, would fleet due to high fuel prices coinciding with low fish prices was
gain a significant amount of both species also increasing their actually observed, occurred after the latest financial crisis. While
value massively. cutter companies were still resilient during other economic crises,
Moreover, in a real quota repartition key adaptation process many could not overcome this one (Hoefnagel and de Vos,
the fixed proportion of other species included in the revenue 2017). Especially, the larger pelagic companies had the resources
calculation might also change and therefore have a different to buy quotas of the insolvent cutter companies because they
effect on the revenue of the pelagic fleets. Actually, this might either merged with a quota holding enterprise, bought the whole
worsen the situation for the Dutch, German, and Danish fleets enterprise or held already quotas themselves (Hoefnagel and de
since other pelagic species caught by those fleets (e.g., blue Vos, 2017). This situation further increased quota concentration
whiting, horse mackerel, and sprat) also primarily occur in within the Netherlands.
Irish, Faroese, and United Kingdom waters (Doering et al., Additionally, fuel prices increased since the mid-90s, reducing
2017). Another possibility to provide more flexibility to the economic benefits of the fleets. Jones et al. (2015) found fuel
relative stability principle, would be the more widespread prices to have increased from 0.65 £l−1 in 1992 to 1.20£l−1 (1.76
use of individual transferrable quotas (ITQs), shifting more €l−1 ) in 2007 when using global cost of fishing database for
responsibilities back toward the industry. However, this system the United Kingdom. This is more than the upper fuel price of
is controversial, raising concerns about the concentration of 0.85 €l−1 that we used in our scenarios, indicating that a longer
fishing rights in larger companies (Hoefnagel et al., 2015). time-series might be worth considering to test for the effects
Implementing an ITQ system and determining its effects on of potential fuel price shocks on the profitability of the pelagic
the pelagic fleets as a more flexible application of the relative fishery. Cheilari et al. (2013), on the other hand, identified a
stability principle might be another scenario worth considering fuel cost increase from 0.25 €l−1 in 2002 to 0.63 €l−1 in 2008
for future modeling work. using data from data of the Annual Economic Report in 2010.
The second strongest effects were associated with the fish This is more in accordance to our assumptions. They estimated
and fuel price alteration scenario. One fleet that stood out, the effects of the fuel price crises on the economic performance
because it was the only one showing more extreme reactions on 54 European fishing fleets and found the number of vessels
when altering fuel price than fish price, was the German fleet. as well as landings decreasing over time because of increasing
This was because the share of fuel costs was 6% higher than fuel prices. The situation of fuel prices is likely to worsen from
for the others. Moreover, the starting fish price (an average 2020 on, which is when marine crude oil will be prohibited,
of the years 2012–2014) was already at 0.46 €kg−1 for frozen and companies have to buy the much more expensive marine
herring and 0.90 €kg−1 for frozen mackerel. Therefore, the gasoil (Kazokoglu and Jakštas, 2019). In this case, stakeholders
difference between frozen herring start price and the low-level expect a fuel price increase of up to 30%. This is 14% more than
Frontiers in Marine Science | www.frontiersin.org 15 July 2020 | Volume 7 | Article 625You can also read