Implementation of the Macroeconomic Imbalance Procedure: State of play August 2020
←
→
Page content transcription
If your browser does not render page correctly, please read the page content below
IN-DEPTH ANALYSIS
Implementation of the Macroeconomic
Imbalance Procedure: State of play
August 2020
This note presents the EU Member States' situation with respect to the Macroeconomic Imbalance Procedure,
taking into account the most recent assessments and decisions by the European Commission and the Council. It
also gives an overview of relevant positions taken on the MIP by EU institutions. A separate EGOV note describes
the MIP procedure. This document is regularly updated.
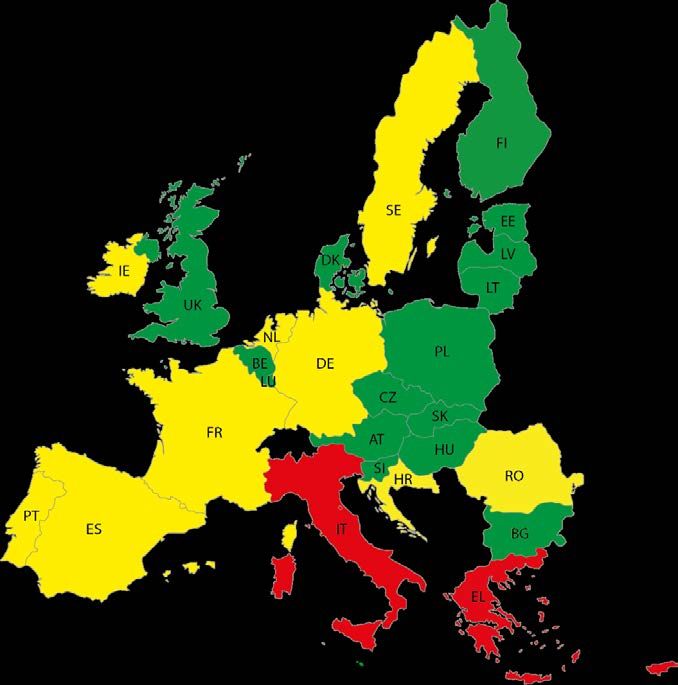
In February 2020, the Commission concluded that:
• 16 Member States are not considered at risk of “macroeconomic imbalances”
• 9 Member States are considered experiencing “macroeconomic imbalances”
• 3 Member States are considered being in a situation of “excessive macroeconomic imbalances”.
Source: EGOV based on European Commission, 2020
Economic Governance Support Unit (EGOV)
Author: Alice Zoppè
Directorate-General for Internal Policies EN
PE 497.739 - August 2020IPOL | Economic Governance Support Unit
CONTENTS
Implementation of the Macroeconomic Imbalance Procedure: State of play June 2020 1
1. Implementation of the MIP in the 2020 Semester 3
1.1 Main findings from the AMR 2020................................................................................................................ 3
1.2 February 2020: the Country reports, the In-depth-reviews and their conclusions ......................... 4
1.3 The “European Semester 2020 Spring Package” ...................................................................................... 6
1.4 The review of the Economic governance Framework............................................................................. 7
1.5 Next procedural and institutional steps...................................................................................................... 9
2. Implementation of MIP over time 11
2.1 Member States assessed as having macro-economic imbalances .................................................... 11
2.2 Implementation of CSRs underpinned by MIP........................................................................................ 12
Annex 1: The 2020 MIP scoreboard for the identification of possible macro-economic imbalances
(reference year 2018) ...................................................................................................................................................................16
Annex 2: 2019 Country Specific Recommendations underpinned by MIP and their
implementation assessment .....................................................................................................................................................17
Annex 3: Commission proposals for 2020 Country Specific Recommendations underpinned by
MIP..................................................................................................................................................................................................... 24
Annex 4: Procedural changes to the MIP ............................................................................................................................. 28
Annex 5: Summaries of three studies on the functioning of the MIP and presenting proposals for
its improvement........................................................................................................................................................................... 30
2 PE 497.739Implementation of the Macroeconomic Imbalance Procedure: State of play - August 2020
1. Implementation of the MIP in the 2020 Semester
The Commission published in December 2019 its latest Alert Mechanism Report (AMR). This report
presented the analysis of the macroeconomic situation and imbalances in the EU and in individual Member
States, as well as in the euro area. The AMR launched the ninth annual round of the Macroeconomic
Imbalance Procedure (see an EGOV note for a description of the MIP procedure). It identified thirteen
Member States as at risk of macroeconomic imbalances (Section 1.1).
In February 2020, the Commission published its 2020 Communication on Macroeconomic imbalances and
the Country Reports, which include the in-depth-reviews of the thirteen countries considered deserving
further analysis in December 2019. Twelve Member States were considered as experiencing macroeconomic
imbalances, three of them excessive (Section 1.2).
On 20 May 2020, the Commission published the draft Country Specific Recommendations (CSRs): whilst
relying on the analysis included in the Country Reports, they mainly refer to the crisis following the Covid
pandemic and the Spring 2020 Forecast. For Member States experiencing macroeconomic imbalances,
some CSRs are underpinned by the MIP procedure. In July, the Council adopted the CSRs, after endorsement
by the European Council. (Section 1.3).
Meanwhile, the Commission launched a review of the EU economic governance framework, in accordance
with the relevant legislation, of which the MIP is an important component (Section 1.4).
1.1 Main findings from the AMR 2020 - December 2019
The analysis of the overall macroeconomic situation in the EU showed a weakening of the economic
expansion that Europe had previously experienced, shown in the Autumn 2019 Forecast. Positive but slow
growth was expected for 2020 in all Member States, with decrease of net exports and of manufacturing
output. The Commission stated “Downward risks to the economic outlook relate in particular to trade tensions
and the disruption of global value chains, a stronger than expected slowdown in emerging markets, the
aggravation of geo-political tensions”.
On the basis of an economic reading of the “MIP scoreboard” and its auxiliary indicators (see Figure 1 and
Annex 1), the Commission identified 13 Member States that required in-depth reviews:
• Greece, Cyprus and Italy (that were experiencing excessive macroeconomic imbalances during the
2019 cycle),
• Bulgaria, France, Germany, Cyprus, Ireland, the Netherlands, Portugal, Romania, Spain and Sweden
(that were experiencing macroeconomic imbalances during the 2019 cycle).
The Commission’s analysis showed that:
• There was still a need to rebalance current accounts and external positions. Only two countries
(Cyprus and the United Kingdom) had recorded external deficits beyond the MIP threshold in 2018, while
several countries were requested to make further efforts to reduce their stock of net foreign liabilities. In
contrast, elevated current accounts surpluses continued in some countries: Denmark, Germany, Malta
and the Netherlands.
• Cost competitiveness conditions were becoming less favourable for several Member States:
labour cost was growing at a fast rate in a majority of countries (especially in central and Eastern Europe),
not completely in line with productivity growth, implying risks of losses in cost competitiveness.
• Real effective exchange rates had been appreciating in all EU Member States except Sweden and the
UK.
PE 497.739 3IPOL | Economic Governance Support Unit
• The private sector was deleveraging, and the private debt-to-GDP ratio was decreasing, mainly due
to high nominal GDP growth, but at a slower pace than in previous years. Deleveraging was mostly
visible in the business sector, whilst households were increasing borrowing. Public debt was declining
in most, but not all, high-debt countries.
• House prices continued growing in most Member States, with several cases pointing to over-evaluation;
nevertheless, the acceleration decreased in 2018 compared to previous years, especially in countries
with over-evaluation and high households’ debt.
• The resilience of the EU banking sector was improving. Non-Performing-Loans ratios were declining,
notably in those Member States with high stocks, but challenges remained in countries characterised by
low capitalisation and profitability.
• Unemployment indicators and activity rates were showing a general improvement, but with
differences among Member States. Wage growth was gradually resuming.
Figure 1: MIP scoreboard - Member States with values beyond the thresholds
Euro Area Member States
External imbalances indicators
CA Current Account Balance as % of GDP, 3 years average
NIP Net International Investment Position as % of GDP
RER Real Effective Exchange Rate with HICP deflators, 3 year % change
BE EXP Export Market Shares, 5 years % change
DE ULC Nominal Unit Labour Cost, 3 years % change
BG BE IE
IE DK EL Internal imbalances
EL IE ES HOU Change in deflated House Prices, 1 year % change
ES ES FR CRE Private Sector credit Flow as % of GDP
HR BG FR HR PRD Private Sector Debt as % of GDP
CY CZ CZ CY IT GGD General Government Debt as % of GDP
DK LV BE EE IE LU CY TFSL Total Financial Sector Liabilities, 1 year % change
DE HU CZ LV LV NL HU EL
CY PL DE LT HU PT AT ES Employment indicators
MT PT EE HU NL FI PT HR UNE Unemployment rate, 3 year average
NL RO LT RO PT SE SI IT ES ACT Activity rate % of total population (age 15-64), 3 years change in pp
UK SK UK SE SK SI UK UK FI CY HR LTU Long Term Unemployment Rate (age 15-74), 3 years change in pp
CA NIP RER EXP ULC HOU CRE PRD GGD TFSL UNE ACT LTU YUN YUN Youth Unemployment Rate (age 15-24), 3 years change in pp
Source: EGOV based on 2020 Alert Mechanism Report. Values for 2018.
For the euro area, the Commission noted that it continued to have the world's largest current account
surplus. It was expected to decrease, because of slowing export demand, reflecting the weakening of global
trade and the higher energy deficit. The euro area surplus should be reduced to help overcoming the low-
inflation and the low-interest rate environment, and to reduce the dependency on foreign demand (Box 1
presents some positions on the current account imbalance in the euro area taken by various institutions).
The Commission concluded that “All in all, sources of potential imbalances are broadly the same as those
identified in the AMR 2019, but prospects appear to be worsening in a number of respects.”
The ECOFIN Council discussed the AMR in February 2020 and drew its conclusions (see Box 2).
1.2 February 2020: the Country reports, the In-depth-reviews and their conclusions
On 26 February 2020, the Commission published the so-called “Winter package”, composed of the
Communication “Assessment of progress on structural reforms, prevention and correction of
macroeconomic imbalances, and results of in-depth-reviews” and the 28 “Country reports”.
4 PE 497.739Implementation of the Macroeconomic Imbalance Procedure: State of play - August 2020
The Communication provided an overview of the evolution of macroeconomic imbalances in the MIP
context, relying on the economic agenda presented in the latest Annual Sustainable Growth Strategy, aimed
at “competitive sustainability” and its four dimensions:
• environmental sustainability
• productivity gains
• fairness
• macroeconomic stability.
The Country reports provided a detailed analysis of the key socio-economic challenges of macroeconomic
relevance and also the Commission assessment of the Member States’ progress with the implementation of
the Country Specific Reccomendations: Annex 2 presents the 2019 CSRs underpinned by the MIP procedure,
together with the Commission’s assessment of their implementation (see also Section 2.2 below).
This year, these reports included also some new features, namely:
• monitoring the elements of macroeconomic relevance in the National Energy and Climate Plans
(submitted by Member States in December 2019) in the wider and more recent context of the
European Green Deal;
• monitoring the Sustainable Developments Goals, with focus on the macroeconomic and
employment policies that can help to deliver them;
• focusing on those regions and sectors most challenged by the transition towards climate neutrality,
in view of guiding the use of the Just Transition Fund.
For the thirteen countries identified in November 2019, the Country reports also included the In-depth-
reviews (IDRs), which focus on macroeconomic imbalances and possible spill-over effects.
The Commission assessed whether imbalances or excessive imbalances exist, and concluded that:
• 3 Member States are considered being in a situation of “excessive macroeconomic imbalances”:
Cyprus, Greece and Italy.
• 9 Member States are considered experiencing “macroeconomic imbalances”: Germany, Ireland,
Spain, France, Croatia, the Netherlands, Portugal, Romania and Sweden.
• 16 Member States are not considered at risk of “macroeconomic imbalances”: Belgium, Bulgaria,
Czechia, Denmark, Estonia, Latvia, Lithuania, Luxembourg, Malta, Hungary, Austria, Poland, Slovenia,
Slovakia, Finland and UK. (Bulgaria, submitted to IDR, was considered not a risk of imbalances).
Once again, the Commission did not propose the opening of the Excessive Imbalance Procedure: despite
being advocated by many (see Box 3), this procedure has never been proposed.
The Country reports usually constitute the analytical basis for dialogues between the Commission and the
Member States before the submission of their National Reform Programmes (NRPs) in April, as well as for
the formulation of the Commission's proposals for the 2020 Country Specific Recommendations. The break-
up of the pandemic crisis disrupted the traditional running of the European Semester. On 16 April, the
ECOFIN Council agreed on the simplification of information requirements: “The simplified process is intended
to preserve the European Semester's main milestones, while taking into account the challenging times Member
States are facing. In particular, there would be a streamlined approach for the submission of national reform and
stability or convergence programmes by Member States.” All Member States (except Italy) submitted the 2020
National Reform Programmes.
In May 2020, the Council drew its conclusions on the In-depth reviews and the implementation of the 2019
CSRs (see Box 2). This year, the Economic Policy Committee prepared and discussed summaries of the review
of each individual country report and the classification of imbalances from the in-depth-reviews, including
PE 497.739 5IPOL | Economic Governance Support Unit
a stock-taking of the CSRs implementation. These summaries also presented methodological suggestions
addressing the Commission’ analysis.
1.3 The “European Semester 2020 Spring Package”
The Commission presented on 20 May a Communication and the 28 draft 2020 Country Specific
Recommendations. The CSRs are prioritising the mitigation of the socio-economic impact of the pandemic
and subsequent economic recovery. To this scope, the CSRs focus on two aspects:
• First, the immediate fiscal, economic, employment and social responses to the crisis, with specific
emphasis on health related aspects.
• Second, the medium-term reform and investment priorities, to put the economies back on track to
growth, while integrating the green transition and the digital transformation.
The Commission stated “The country reports can provide input on the areas for future growth once the
exceptional circumstances (e.g. confinement) are over.“.
It is worth noting that the fiscal elements of the CSRs were adapted to take into account the activation of
the general escape clause of the Stability and Growth Pact. Nevertheless, the Commission highlighted that
previous cycles of the European Semester - prior to the onset of the pandemic - covered reforms deemed
essential to address medium and long-term structural challenges, and that those challenges are still
relevant. Those recommendations remain pertinent and would still be subject to monitoring.
Furthermore, the Commission notes “The unprecedented situation has required a specific approach of this
year’s European Semester. Over the past decade, the European Semester has become the key tool for the
coordination of national economic and employment policies. It is currently an integral part of the EU’s effort
to contain the spread of the virus, support national health systems, protect and save lives, and counter the social
and economic impact of the pandemic. Therefore, the proposed recommendations highlight economic and
employment policies adapted to the new socio-economic priorities of the COVID-19 crisis in areas of
common concern. This approach has only been possible with even closer cooperation between the
Commission and Member States. Close contact and intensive dialogue have been key to understanding and
identifying policies and best practices adopted to mitigate and address the socio-economic impact of the virus.
As a result, the Commission has updated its analysis of the Member States’ social and economic situation
presented in the 2020 country reports to reflect the current economic and social circumstances in each
Member State. The Commission has held bilateral meetings with Member States via videoconference during the
month of April and has maintained a continuous dialogue with Member States multilaterally and bilaterally,
including through the relevant Committees and with the European Semester Officers in the capitals... Close
alignment between the EU budget and the European Semester is essential to ensure stability, productivity
and fairness in the economic recovery across the EU with the twin green and digital transitions at its heart.“.
On 9 June, the ECOFIN Council took stock of the preparations of Country Specific Recommendations for this
year's European Semester exercise. On 20 July the Council formally adopted the CSRs, after the European
Cuncil had endorsed them.
For Member States experiencing macroeconomic imbalances or excessive macroeconomic imbalances, the
CSRs may be partly or totally underpinned by the MIP: Annex 3 presents the draft 2020 CSRs for each
Member State concerned. None of the CSRs proposed for Sweden addresses its macroeconomic imbalances,
despite Sweden being considered as experiencing macroeconomic imbalances. Among the 45 CSRs
targeting the twelve Member States with macroeconomic imbalances, 31 have the MIP as a legal basis.
Section 2.2 below provides details on the evolution of MIP-related CSRs and their implementation over time.
6 PE 497.739Implementation of the Macroeconomic Imbalance Procedure: State of play - August 2020
Box 1: Some institutional positions on current account imbalances in the euro area
The Commission noted in the AMR 2020 that “The euro area current account balance has peaked, but still
records very elevatedlevels.The current account balance of the euro area has moved from a broadly-balanced
pre-crisis position to a peak of 3.2 % of GDP in 2016. Since then, its value has come down very slightly, reaching
3.1% of GDP in 2018( ... ) It mainly reflects the largesurplusesrecordedin Germany and the Netherlands, whose
combined external balances accounted for 2.8% of euro area GDP in 2018. At unchanged policies, the euro
area adjusted current account surplus is expected to fall in 2019 according to the European Commission
autumn 2019 forecast, reaching 2.7% of GDP, and to further decline to 2.5% of GDP by 2020 (... ). The ongoing
reduction in the euro area surplus is mainly the result of a weakening trade balance.” Furthermore, the
Commission states “...rebalancing of both current account deficits and surpluses is pressing in the current
economic context and would be beneficial for all Member States.”. It can be noted that in the Spring 2020
Forecast the Commission published the following estimates /projections of current account: 3.3%, 3.4%
and 3.6% of GDP for 2019, 2020 and 2021respectively.
In its conclusions on the the Alert Mechanism Report of February 2020, the ECOFIN noted that “large
current account deficits have generally been corrected, while the reduction of the largest current account
surpluses has been modest. The aggregate surplus of the euro area remains at an elevated level. (... ) Member
States with large current account surpluses should further strengthen the conditions to promote wage
growth, while respecting the role of social partners, and implement as a priority measures that foster public
and private investment, support domestic demand and growth potential, thereby also facilitating
rebalancing. Acknowledges that symmetric rebalancing of current account can be beneficial for all Member
States, generally supporting deleveraging in the euro area as a whole. (…)”.
In its resolution on “the European Semester for economic policy coordination: Annual Growth Survey
2019” of 13 March 2019, the European Parliament pointed out that “some Member States with good fiscal
space have consolidated even further, thereby contributing to the euro area’s current account surplus” It also
“ Welcomed the Commission’s efforts to encourage those Member States with current account deficits or high
external debt to improve their competitiveness, and those with large current account surpluses to promote
demand by increasing wage growth in line with productivity growth and to foster productivity growth by
promoting investment”.
The ECB occasional paper of June 2018 on “Macroeconomic imbalances in the euro area: where do we
stand?” reads “Most of the euro area countries are currently running a surplus, with the notable exceptionof
France. Across countries, a debate has emerged in recent years regarding the nature of the large current
account surplus, in particular in the larger euro area countries such as Germany and the Netherlands. Drivers
of the German current account surplus are the high household saving rate and the increasing saving ratesof
the corporate and government sectors. It is also driven by weak investment dynamics, notably in the public
sector, as evidenced by a persisting public sector investment differential compared to the euro area. Stronger
investment demand in Germany would likely contribute to a more symmetric average euro area rebalancing
(...) While current account balances have turned positive for many euro area countries, their levels are not
high enough to foster quicker adjustment of the stock of external debt”.
In its 2020 External Sector Report: Global Imbalances and the Covid-19 crisis, the IMF noted (p. 1) that in
2019 “The euro area surplus declined by 0.4 percentage point of GDP, to 2.7 percent of GDP, reflecting
weaknesses in services and investment income balances”. Furtehrmore, the euro area presents a
configuration of overall external positions - compared with their estimated desirable levels - stronger
than the level consistent with medium-term fundamentals and desirable policies (p. 4). It also
recommended (p. 24) : “Contain the COVID-19 outbreak and its economic consequences and provide relief
to households and corporates to reduce scarring from the crisis; maintain accommodative monetary policy.
Implement area-wide initiatives (banking and capital markets union and fiscal capacity for macro-
stabilization) to further reinvigorate investment”. As for 2020, “the current account surplus is projected to
narrow by 0.4 percentage point of GDP to a surplus of 2.3 percent of GDP amid the decline in global trade and
investment income... Nevertheless, imbalances that existed prior to the COVID-19 outbreak could remain
sizable at the national level” (p. 70) . The Fund adds “As with the CA, the aggregate REER gap masks a large
degree of heterogeneity in REER gaps across euro area member states, ranging from an undervaluation of 11
percent in Germany to overvaluations of 0 to 9 percent in several small to mid-sized euro area member states.
The large differences in REER gaps ... highlight the continued need for net external debtor countries to improve
their external competitiveness and for net external creditor countries to boost domestic demand” (Table 3.7).
PE 497.739 7IPOL | Economic Governance Support Unit
1.4 The review of the Economic Governance framework
In accordance with Regulation 1176/2011(Article 16) and Regulation 1174/2011 (Article 7), the Commission
published in February 2020 a Communication on “Economic governance review 1”. The MIP, is, together
with the Stability and Growth Pact, an important component of the Economic Governance framework. The
purpose of this Communication was to start a public debate on the extent to which the different surveillance
elements introduced or amended by the 2011 and 2013 reforms have been effective in achieving their key
objectives, namely:
(i) ensuring sustainable government finances and growth, as well as avoiding macroeconomic
imbalances,
(ii) providing an integrated surveillance framework that enables closer coordination of economic
policies in particular in the euro area, and
(iii) promoting the convergence of economic performances among Member States.
Over the years, the Commission had introduced several procedural and methodological changes in the
Economic Governance Framework and in the European Semester, in line with the Communication "On steps
towards completing Economic and Monetary Union" of October 2015. Annex 4 presents these changes in
the context of the MIP: they aimed at streamlining the procedure, improving its transparency and
predictability 2, as well as at increasing the focus on employment and social issues. In 2018, a Special Report
of the Court of Auditors examined the implementation of the MIP, and found that “Although the MIP is
generally well designed, the Commission is not implementing it in a way that would ensure effective prevention
and correction of imbalances... We therefore make a number of Recommendations to the Commission to
substantially improve certain aspects of its management and to give greater prominence.” (see also Box 4).
Section 2.2 of the Communication of February 2020 is specifically devoted to the MIP, and the Commission
states “Despite progress made for a transparent implementation of the MIP, further efforts could be pursued on
the link between the MIP analysis and recommendations and the interplay between the MIP and other
surveillance procedures.“.
The Commission then launched a public debate, to give stakeholders the opportunity to provide their views
on the functioning of surveillance so far and on possible ways to enhance the effectiveness of the framework
in delivering on its key objectives.
Originally, citizens and institutions were invited to submit their responses to the questions set in the
Communication by 30 June 2020. However, the public debate on the future of the economic surveillance
framework has been impacted by the need to focus on the immediate challenges of the coronavirus
crisis. Therefore, the period of public consultation has been extended and the Commission is expected to
return to the review exercise when the immediate challenges have been addressed.
The Coordinators of the ECON Committee requested EGOV to provide three papers, written by academic
experts, aimed at analysing how the procedure worked so far and making proposals on its improvement.
The following papers were published between February and May 2020:
• How has the macro-economic imbalances procedure worked in practice to improve the
resilience of the euro area? By Agnès Bénassy-Quéré (Chief Economist at Treasury - France, and
Sorbonne University), Guntram Wolff (Director, Bruegel).
• Macroeconomic Imbalances Procedure: has it worked in practice to improve the resilience of
the euro area? By Lorenzo Codogno.
1
“Report on the application of Regulations (EU) No 1173/2011, 1174/2011, 1175/2011, 1176/2011, 1177/2011, 472/2013 and
473/2013 and on the suitability of Council Directive 2011/85/EU”, i.e. the set of legal acts comprising the provisions on the EU
economic governance framework, published in 2011 and 2013, also known as “Six-pack” and “Two-pack”.
2
See also the Commission publication “The Macroeconomic Imbalance Procedure - Rationale, Process, Application: a Compendium”
of November 2016, which provides an overview of how the framework functions and how its application has evolved over time.
8 PE 497.739Implementation of the Macroeconomic Imbalance Procedure: State of play - August 2020
• How has the macro-economic imbalances procedure worked in practice to improve the
resilience of the euro area? By Alexander Kriwoluzky and Malte Rieth - DIW Berlin and Freie
Universität Berlin.
Annex 5 to this document provides a summary of the three papers.
1.5 Next procedural and institutional steps
The 2020 Europan Semester cycle was concluded on 20 July 2020 with the Council’s adoption of the Country
Specific Recommendations.
For those countries that have been identified as experiencing imbalances, the Commission carries specific
monitoring activities on a continuous basis.
In addition, Economic dialogues with representatives of the relevant institutions (Commission, the
Eurogroup and the Council) are held in ECON, the competent committee of the European Parliament.
PE 497.739 9IPOL | Economic Governance Support Unit
Box 2: Excerpts from Council conclusions related to MIP in 2020
May 2020, Conclusions on In-depth-reviews and implementation of 2019 CSRs. The Coucil, while noting that
the Commission package was adopted prior to the pandemic crisis:
• Recognises that for tackling unprecedented severe socio-economic consequences of the COVID-19
pandemic, a coordinated and comprehensive response to the pandemic is crucial to prepare the ground
for the recovery across the Union. Stresses the need for making full use of the flexibility of the EU
economic policy coordination framework, as strengthened in the light of the previous global economic
and financial crisis.
• Calls for swift and targeted coordinated policy action for rapidly overcoming the economic crisis and
building a basis for sustainable and inclusive growth... The European Semester provides the
framework for continued economic policy coordination in the EU, as well as for identification of
new emerging challenges.
• Welcomed the Commission’s publication of the European Semester 2020 country reports.
• Recalls that the multiannual assessment by the Commission illustrates that a number of country-specific
recommendations relate to long-term structural issues that take time to be addressed and that tangible
results take time to materialise. Nevertheless, notes that the overall implementation rate of the 2019
country-specific recommendations remained low, despite a rather favourable economic
environment over the last years. Reform implementation continued to vary across policy areas and
countries and has been strong in financial services and active labour market policies. Progress has
remained slow in addressing competition in services and with regard to the long-term sustainability of
public finances.
• Considers that the in-depth reviews present a high-quality and comprehensive analysis of the country
situation in each Member State under review. Acknowledges that relevant analytical tools,
complemented by substantive qualitative analysis, have been applied in view of the specific
challenges of each economy. Recognises that the in-depth reviews provide an assessment of the
situation before the outbreak of the pandemic and the subsequent economic downturn. Stresses that
the evolution of these imbalances should be monitored against the background of the pandemic.
• Agrees that 12 Member States analysed in the in-depth reviews ... are experiencing macroeconomic
imbalances of various nature and degree of severity under the MIP... Agrees that excessive imbalances
exist in three Member States (Cyprus, Greece and Italy).
• Highlights the role of the MIP for detecting, preventing and correcting macroeconomic imbalances and
thereby strengthening economic resilience, and the importance of maintaining a regular review of
developments, including in the framework of specific monitoring.
• Recalls that the Council will discuss Macroeconomic Imbalance Procedure as part of the review of the
economic governance legislation.
February 2020, Conclusions on the 2020 AMR. The Council:
• Broadly agrees with the Commission's horizontal analysis of the adjustment of macroeconomic
imbalances in the EU and within the euro area. Welcomes that the gradual correction of existing
imbalances has continued amid favourable economic conditions. Notes that the reduction of large
stocks of private and government debt has continued in most Member States on the back of nominal
GDP growth, but government debt ratios have generally not been sufficiently reduced in Member
States where they are the highest. Net savings in the private sector have declined especially for the
household sector. Notes therefore that vulnerabilities linked to still large stock imbalances persist,
and that the likely more modest economic growth, low interest rate environment and remaining
uncertainties may imply a slower adjustment of existing imbalances or the materialisation of new risks.
• Agrees that to ensure stability, potential sources of domestic and external imbalances need to be
addressed through structural reforms. Stresses that subdued productivity growth remains a particular
concern in the current challenging economic context, and calls for structural reforms and investment to
raise productivity and the growth potential, and policies to bring forward the correction of existing
imbalances.
10 PE 497.739Implementation of the Macroeconomic Imbalance Procedure: State of play - August 2020
2. Implementation of MIP over time
2.1 Member States assessed as having macro-economic imbalances
From the MIP's inception until the 2015 round, an increasing number of countries had been both covered
by in-depth reviews and classified as having excessive imbalances, but the trend seems to be reversed in
the latest rounds 3. Table 1 below shows that the number of Member States:
• subject to an IDR increased from 12 to 19 between 2012 and 2016, declined to 12 in 2018, were 13 in
2019 and stabilised at 13 in the context of the 2020 European Semester cycle;
• considered as experiencing imbalances rose from 12 to 16 between 2012 and 2015, fell to 11 in 2018,
to 10 in 2019 and to 9 in 2020;
• considered as experiencing excessive imbalances increased from 0 to 6 between 2012 and 2017, but
fell to 3 in 2018 and stabilized to 3 in 2019 and in 2020.
The Commission has not yet proposed to open the Excessive Imbalance Procedure (EIP): a Member State
subject to this procedure would be classified in Table 1 as experiencing "excessive imbalances with corrective
action" (see also Box 3 “Selected statements/positions on the corrective arm of MIP”). In 2016 the
Commission had threatened to recommend to the Council an EIP (for Croatia and Portugal), taking into
account the level of ambition of their National Reform Programmes. Based on its assessment of the policy
commitments of both Member States and on the presumption that there would be a swift and full
implementation of the reforms set out in their CSRs, the Commission eventually concluded that there was
no need to step up the MIP. In 2019, the Commission has threatened the same for Italy.
Table 1: MIP stylized facts
Semester/MIP cycle
2012 2013 2014 2015 2016 2017 2018 2019 2020
(1) Countries under adjustment programme 4 5 4 2 1 1 1 0 0
(2) Countries subject to IDR, out of which*: 12 13 17 16 19 13 12 13 13
(2.1) Excessive imbalances with corrective action 0 0 0 0 0 0 0 0 0
(2.2) Excessive imbalances 0 2 3 5 6 6 3 3 3
(2.3) Imbalances 12 11 11 11 7 6 8 10 9
(2.4) No imbalances detected in IDR 0 0 3 0 6 1 1 0 1
(3) Countries not subject to IDR (No imbalances) 11 9 7 10 8 14 15 15 15
Total = (1) + (2) + (3) 27 27 28 28 28 28 28 28 28
Source: European Commission and EGOV.
Note: * The table refers to the streamlined categories applied from the 2016 cycle onwards.
Table 2 depicts the situation of Member States with respect to MIP since its inception in 2012. Italy has been
experiencing excessive imbalances for seven consecutive years, and Excessive imbalances are identified in
Cyprus for the fifth year in a row. It can also be noted that one Member State (Sweden) is experiencing
imbalances since 2012, while the Netherlands since 2013 and Germany since 2014.
3
See also the Commission publication “The Macroeconomic Imbalance Procedure - Rationale, Process, Application: a Compendium”
that provides an overview of how the framework functions and how its application has evolved over time.
PE 497.739 11IPOL | Economic Governance Support Unit
Table 2: Commission's conclusions under MIP
No Imbalances Imbalances Excessive imbalances
2012 2013 2014 2015 2016 2017 2018 2019 2020 2012 2013 2014 2015 2016 2017 2018 2019 2020 2012 2013 2014 2015 2016 2017 2018 2019 2020
CZ* CZ* CZ* CZ* BE BE* BE* BE* BE* BE BE BE BE DE DE BG BG DE ES HR BG BG BG HR IT IT
DE* DE* DK DK* CZ* CZ* CZ* CZ* BG BG BG BG DE IE IE DE DE FR SI IT FR FR FR IT CY CY
EE* EE* EE* EE* DK* DK* DK* DK* CZ* DK DK DE IE ES ES FR FR HR SI HR HR HR CY EL EL
LV* LV* LV* LV* EE EE* EE* EE* DK* ES FR IE ES NL NL IE HR IE IT IT IT
LT* LT* LT* LT* LV* LV* LV* LV* EE* FR IT ES HU SI SI ES IE ES PT PT PT
LU* LU* LU LU* LT* LT* LT* LT* LV* IT HU FR NL FI SE NL ES NL CY CY
MT* AT* MT MT* LU* LU* LU* LU* LT* CY MT HU RO SE PT NL PT
NL* PL* AT* AT* HU HU* HU* HU* LU* HU NL NL SI SE PT RO
AT* SK* PL* PL* MT* MT* MT* MT* HU* SI FI FI FI RO SE
PL* SK* SK* AT AT* AT* AT* MT* FI SE SE SE SE
SK* PL* PL* PL* PL* AT* SE UK UK UK
RO RO* RO* SK* PL* UK
SK* SK* SK* SI* SK*
UK UK* SI FI* SI*
FI FI* UK* FI*
UK UK*
Source: EGOV based on European Commission.
Note: The table refers only to the streamlined categories applied from the 2016 cycle onwards.
(*) Countries not considered at risk of macroeconomic imbalances, therefore not subject to in-depth reviews according to the AMR.
2.2 Implementation of CSRs underpinned by MIP
The credibility of the MIP, as part of the European Semester, depends inter alia on countries’ implementation
of the Country Specific Recommendations, which is measured by their implementation track record. The
Commission applies a multi-annual perspective in its assessment of the implementation of the CSRs, “(...) to
account for the time needed for the full implementation of critical reforms”. The 2020 Communication on the
CSRs presents an Annex on “Progress in the implementation of the Counry Specific Recommendations”, that
reads “Since the start of the European Semester in 2011, some implementation progress has been achieved for
more than two-thirds of the country-specific recommendations. Implementation continues on a stable path, as
in previous years... However, reform implementation differs significantly across policy areas. In particular,
Member States have made most progress over the past years in financial services, followed by progress on
employment protection legislation. On the other hand, progress has been particularly slow on broadening the
tax base, as well as on health and long-term care, with the healthcare systems being further challenged because
of the COVID-19.”.
With regard to the implementation of the CSRs underpinned by the MIP, Figure 2 below shows the annual
implementation rate of MIP-specific CSRs. The percentage of MIP-CSRs showing limited/no progress
increased again in 2019, to 60%, after a slight decrease in 2018 and a continuous increase from 2014 to 2017.
The percentage of MIP-CSRs showing full/substantial progress decrease again to none, after a slight increase
in 2018 4.
4
Macroeconomic imbalances typically take several years to correct, as different types of structural reforms produce the expected
effects over variable time horizons; an IMF study shows that reforms in labour market may have a negative impact in the short term,
while reforms in goods and services markets are visible in a shorter time lag. See also the Annex to the Commission Communcation
on Country Reports, where the Commission considers the “multiannual assessment of the CSRs implementation” .
12 PE 497.739Implementation of the Macroeconomic Imbalance Procedure: State of play - August 2020
Figure 2: Annual implementation rate of CSRs based on MIP (2012-2019)
2012 2013 2014 2015 2016 2017 2018 2019
6% 5% 5% 7% 2%
6%
17%
43% 47% 37% 41% 40%
52% 44% 40%
52% 46% 58% 63% 60%
78% 53%
Total
MIP- 36 56 66 57 45 35 32 40
CSRs
Mem
ber 12 13 14 16 13 12 11 13
States
Source: EGOV based on European Commission assessments.
Note: The assessment grid of CSRs implementation is as follows: full/substantial progress, some progress and limited/no progress.
Table 3 shows that Member States experiencing excessive imbalances during the 2019 cycle implemented
recommendations underpinned by the MIP and joint SGP/MIP legal bases quite poorly; the progress in the
implementation was assessed in the Country reports published by the Commission in February 2020. Greece
showed some progress for both its recommendations; Italy showed some progress for three out of five CSRs;
Cyprus implemented three out of five CSRs to a limited extent.
Table 3: Commission's assessment on the implementation of 2019 CSRs for Member States with excessive
imbalances during 2019 MIP Cycle
Joint SGP and MIP
MIP legal base
legal base
EL CSR1 CSR2
IT CSR1 CSR2 CSR3 CSR4 CSR5
CY CSR1 CSR2 CSR3 CSR4 CSR5
Source: EGOV based on European Commission assessments.
Note: The assessment grid of CSRs implementation is as follows: full/substantial progress, some progress and
limited/no progress.
Annex 4 presents the 2019 MIP-related CSRs and the assessment of their implementation (see a separate
EGOV document for a presentation of all the 2018 CSRs, the Commission’s assessments of their
implementation, the 2019 CSRs and theis implementation assessment).
PE 497.739 13IPOL | Economic Governance Support Unit
Box 3: Selected statements/positions on the corrective arm of MIP
ECOFIN Council
The Council, in its conclusions of May 2020, “Reiterates that the Macroeconomic Imbalance Procedure should
be used to its full potential and in a transparent and consistent way, ensuring Member States’ ownership of the
procedure, including the activation of the excessive imbalance procedure where appropriate. Maintains that
whenever the Commission concludes that a Member State is experiencing excessive imbalances, but does not
propose to the Council the opening of the excessive imbalance procedure, it should explain clearly and publicly its
reasons.”. Similar text was included in the ECOFIN conclusions of February 2020, May 2019, January 2019,
January and March 2018, January and May 2017.
European Central Bank
In its publication of June 2018, the ECB stated “from 2015 to 2017 three to four countries were continuously
included in the excessive imbalance group. One country has been assessed as having had excessive imbalances for
5 years in a row. Despite the unchanged assessment, these countries continued to be part of the preventive arm of
the MIP. A situation with persistently excessive imbalances warrants a strong policy response, as past
experience has shown that the correction of imbalances accumulated over a long period of time is very
costly. This is the reason why the ECB has consistently argued that the MIP tools – including the full corrective arm
of the procedure – should be fully employed in relation to those countries with excessive imbalances... The use of
such tools is desirable not only in order to increase the economic prospects of the relevant country itself, but alsoto
help facilitate economic adjustment processes inside the euro area and enhance the resilience of the euro area. It is
thus in the interest of the euro area as a whole, in particular given the fact that a tool, the EIP, has already beenset
up to deal with those cases. “
In July 2017, the ECB had called again on the Commission to make use of the MIP corrective arm. “The number
of CSRs has been reduced for countries with excessive imbalances and in several cases the level of urgency
has been reduced, insofar as the CSRs contain significantly fewer deadlines compared with last year’s
recommendations. This comes despite the limited implementation of CSRs for countries with excessive
imbalances. Given the difficulties of strengthening reform implementation in the context of the preventive arm of
the macroeconomic imbalance procedure, there seems to be a strong case for applying the corrective armof
this procedure for all countries with excessive imbalances. This tool, which has not been used so far, offers a
well-defined process ensuring greater traction on reform implementation for the most vulnerable Member States.”
Previous similar statements were published in March 2017, March and February 2016.
The Five Presidents Report
The Five President Report on "Completing Europe's Economic and Monetary Union" of June 2015 affirms the
need to use the MIP "to its full potential. This requires action on two fronts in particular:
• It should be used not just to detect imbalances but also to encourage structural reforms through the
European Semester. Its corrective arm should be used forcefully. It should be triggered as soon as
excessive imbalances are identified and be used to monitor reform implementation.
• The procedure should also better capture imbalances for the euro area as a whole, not just for each
individual country. For this, it needs to continue to focus on correcting harmful external deficits, given the
risk they pose to the smooth functioning of the euro area ..."
IMF
In the context of the 2017 Art. IV consultation report on the euro area, “IMF Directors reiterated their call for
stricter enforcement of the Macroeconomic Imbalances Procedure combined with incentives for structural
reforms, such as targeted support from central funds and outcome based benchmarks.” The staff report reads (p.
18) “The weak implementation of CSRs in most countries, including by those six countries identified with excessive
imbalances under the MIP, suggests that the EU instruments are currently not being used effectively. To build
credibility, stronger enforcement of the governance framework is needed.” The accompanying footnote reads
“While considering progress toward correcting excessive external imbalances in February 2017, the EC has again
used its discretionary powers not to open the excessive imbalances procedure in six cases, despite these
countries having made only ‘limited’ or ‘some’ progress in implementing CSRs.”
European Court of Auditor
The Auditors’ Report on the MIP notes that the Commission has never recommended activating the excessive
imbalance procedure, despite several member States having been identified with excessive imbalances over
a prolonged period (see also Box 4).
14 PE 497.739Implementation of the Macroeconomic Imbalance Procedure: State of play - August 2020
Box 4: The Special Report of the European Court of Auditors on the MIP
On 23 January 2018, the European Court of Auditors (ECA) published its Special Report on the
Macroeconomic Imbalance Procedure.
The ECA examined the Commission’s implementation of the Macroeconomic Imbalance Procedure, on the
basis - inter alia - on stakeholders’ opinion and detailed analysis of four Member States (Bulgaria, Slovenia,
France and Spain).
The ECA found that although the MIP is generally well designed, the Commission is not implementing it in
a way that would ensure effective prevention and correction of imbalances. More specifically:
• the classification of Member States with imbalances lacks transparency;
• the Commission’s in-depth analysis - despite being of a good standard - has become less visible;
• the country specific recommendations do not stem from identified imbalances;
• there is lack of public awareness of the procedure and its implications.
Furthermore, the ECA pointed to the political rather than technical process on the opening of the EIP (paras
61-66) and addresses the weakness of the MIP scoreboard (paras 88-96).
The ECA made six Recommendations to the Commission, aimed at to substantially improve certain aspects
of its management and to give greater prominence to the MIP. They can be summarised as follows:
1. clearly link MIP country specific recommendations to specific macroeconomic imbalances;
2. in its IDRs, clearly characterise the severity of the imbalances that Member States are facing. The
Commission should, unless there are specific circumstances, recommend activating an excessive
imbalance procedure when there is evidence that a Member State is facing excessive imbalances.
Propose an amendment to the MIP regulation on this process;
3. separate the IDR from the Country report, to allow for a comprehensive analysis of the
macroeconomic imbalances;
4. use the MIP to make fiscal recommendations to Member States when fiscal policy directly affects
external imbalances and competitiveness. MIP-CSRs should be made consistent with
recommendations for the euro area, including on the overall fiscal stance;
5. give greater prominence to the MIP by improving all communication aspects. When it assesses
imbalances as excessive, make the relevant Commissioners available to Member State parliaments
to explain the MIP related policy recommendations.
The publication includes a detailed reply by the Commission to each section of the ECA Reports’. As far as
the ECA’s recommendations are concerned, the Commission accepts all the Recommendations, with the
exception of 2(ii), on the codification of the definition of imbalances or excessive imbalances; and 2(iv) on the
amendment of the MIP regulation concerning the opening of the EIP.
The President of the ECA presented the report at the ECOFIN Council of 13 March 2018, which drew its
conclusions. The Council welcomed that the Commission accepted most of the ECA’s recommendations.
In its conclusions of the meeting of January 2019, the Council invited the Commission to take note of the ECA
recommendations when the Commission will review and report on the application of the MIP at the latest
by December 2019, in accordance with Regulation 1176/2011 on the MIP.
Disclaimer and copyright. The opinions expressed in this document are the sole responsibility of the authors and do not necessarily represent
the official position of the European Parliament. Reproduction and translation for non-commercial purposes are authorised, provided the
source is acknowledged and the European Parliament is given prior notice and sent a copy. © European Union, 2020.
Contact: egov@ep.europa.eu
This document is available on the internet at: www.europarl.europa.eu/supporting-analyses
PE 497.739 15IPOL | Economic Governance Support Unit
Annex 1: The 2020 MIP scoreboard for the identification of possible macro-economic imbalances (reference year 2018)
External imbalances and competitiveness Internal imbalances Employment Indicators
Total
Long term Youth
Real Effective Financial
Current Net Export House Prices Activity rate unemployme unemployme
Exchange Nominal ULC Private Private General Sector
Account International Market index Unemployme % of total nt rate nt rate
Year Rate with (2010=100) Sector Credit Sector Debt, Government Liabilities,
Balance Investment Shares deflated nt rate pop. aged 15- % of active % of active
2018 HICP deflator 3 year % Flow consolidated Gross Debt non-
% of GDP Position 5 year 1 year % 3 year average 64 pop. aged 15- pop. aged 15-
3 year % change % of GDP % of GDP % of GDP consolidated 3 year change
3 year average % of GDP % change change 74 24
change 1 year % 3 year change 3 year change
change
±5% (EA)
+9% (EA)
Thresholds -4/+6% -35% ±11% (non- -6% +6% 14% 133% 60% 10% 16.5% -0.2 pp 0.5 pp 2 pp
12% (non-EA)
EA)
BE 0.3 41.3 6.9 -1.5 3.7 1.0 0.8 178.5 100.0 7.0 -2.9 1.0 -1.5 -6.3
BG 4.0 -35.2 3.9 13.4 18.3 4.5 3.9 95.0 22.3 6.3 6.8 2.2 -2.6 -8.9
CZ 1.2 -23.5 11.0 11.9 13.5 6.1p 5.3 70.7 32.6 3.0 7.4 2.6 -1.7 -5.9
DK 7.5 48.5 2.6 -1.5 1.6 3.5 3.5 198.3 34.2 5.6 -4.1 0.9 -0.6 -1.6
DE 8.0 62.0 5.3 3.1 5.6 5.1 6.5 102.1 61.9 3.8 2.0 1.0 -0.6 -1.0
EE 2.1 -27.7 7.7 0.7 14.3 2.1 3.7 101.5 8.4 6.0 6.9 2.4 -1.1 -1.2
IE 2.3 -165.0 2.3 77.4 -2.8 8.3 -7.8 223.2 63.6 7.0 5.1 0.8 -3.2 -6.4
EL -2.2 -143.3 3.6 6.8 1.4 1.3e -1.1 115.3 181.2 21.5 -5.0 0.4 -4.6 -9.9
ES 2.6 -80.4 4.1 4.6 0.7 5.3 0.4 133.5 97.6 17.4 -2.2 -0.6 -5.0 -14.0
FR -0.6 -16.4 4.5 -0.2 2.4 1.5 7.9 148.9 98.4 9.5 1.6 0.6 -0.8 -3.9
HR 2.4 -57.9 4.2 22.9 -2.1 4.6 2.3 93.9 74.8 10.9 4.6 -0.6 -6.8 -19.0
IT 2.6 -4.7 3.3 0.3 2.7 -1.6 1.6 107.0 134.8 11.2 -0.1 1.6 -0.7 -8.1
CY -4.6 -120.8 1.8 16.6 -0.4 0.2 8.4 282.6 100.6 10.8 0.3 1.1 -4.1 -12.6
LV 0.6 -49.0 4.9 8.6 14.7 6.6 -0.2 70.3 36.4 8.6 -3.0 2.0 -1.4 -4.1
LT -0.1 -31.0 6.4 3.5 16.5 4.6 4.3 56.4 34.1 7.1 8.2 3.2 -1.9 -5.2
LU 4.9 59.8 3.3 16.7 7.9 4.9 -0.5 306.5 21.0 5.8 -2.0 0.2 -0.5 -2.5
HU 2.1 -52.0 2.0 8.4 12.4 10.9 4.3 69.3 70.2 4.3 -9.2 3.3 -1.7 -7.1
MT 8.9 62.7 4.9 24.0 3.3 5.1 7.5 129.2 45.8 4.1 2.3 5.9 -1.3 -2.5
NL 9.9 70.7 3.2 1.7 3.0 7.4 4.5 241.6 52.4 4.9 -3.3 0.7 -1.6 -4.1
AT 2.2 3.7 4.8 3.9 4.7 2.5 3.9 121.0 74.0 5.5 1.7 1.3 -0.3 -1.2
PL -0.5 -55.8 0.1 25.7 8.0 4.9 3.4 76.1 48.9 5.0 3.0 2.0 -2.0 -9.1
PT 0.9 -105.6 3.1 9.4 5.3 8.9 0.8 155.4 122.2 9.1 0.5 1.7 -4.1 -11.7
RO -3.3 -44.1 -0.7 23.7 29.6 1.8 1.9 47.4 35.0 5.0 3.3 1.7 -1.2 -5.5
SI 5.5 -18.9 2.0 20.4 6.1 7.4 1.3 72.8 70.4 6.6 4.1 3.2 -2.5 -7.5
SK -2.4 -68.1 2.5 3.2 10.9 5.0 2.0 90.9 49.4 8.1 8.9 1.5 -3.5 -11.6
FI -1.4 -2.0 3.0 -3.0 -2.6 -0.2 1.6 142.1 59.0 8.3 19.9 2.1 -0.7 -5.4
SE 2.8 10.3 -4.0 -6.3 7.6 -3.0 9.0 200.0 38.8 6.6 -2.9 1.0 -0.4 -3.0
UK -4.3 -10.5 -13.0 -3.7 7.9 0.7 4.4 163.3 85.9 4.4 -0.8 1.0 -0.5 -3.3
Source: 2020 AMR. Boxes shaded in grey indicate values outside the threshold. A dedicated Eurostat website presents the latest available figures
16 PE 497.739Implementation of the Macroeconomic Imbalance Procedure: State of play - August 2020
Annex 2: 2019 Country Specific Recommendations underpinned by MIP and their
implementation assessment
These tables are extracted from the detailed EGOV document “Country Specific recommendations for 2018
and 2019 - A tabular comparison and overview of implementation”. For each concerned Member State, the
tables present only the MIP-related CSRs and its general implementation assessment.
2019 CSRs
BG SGP: -
MIP: CSR 2
Assessment of implementation of 2019 CSRs
2. Ensure the stability of the banking sector by reinforcing supervision, promoting adequate valuation of
assets, including bank collateral, and promoting a functioning secondary market for non-performing
loans. Ensure effective supervision and the enforcement of the AML framework. Strengthen the non-
banking financial sector by effectively enforcing risk-based supervision, the recently adopted valuation
guidelines and group-level supervision. Implement the forthcoming roadmap tackling the gaps identified
in the insolvency framework. Foster the stability of the car insurance sector by addressing market
challenges and remaining structural weaknesses.
Some Progress.
DE 2019 CSRs
MIP: CSR 1, 2
Assessment of implementation of 2019 CSRs
1. While respecting the MTO, use fiscal and structural policies to achieve a sustained upward trend in
private and public investment, in particular at regional and municipal level. Focus investment-related
economic policy on education; research and innovation; digitalisation and very-high capacity broadband;
sustainable transport as well as energy networks and affordable housing, taking into account regional
disparities. Shift taxes away from labour to sources less detrimental to inclusive and sustainable growth.
Strengthen competition in business services and regulated professions.
Limited Progress.
2. Reduce disincentives to work more hours, including the high tax wedge, in particular for low-wage and
second earners. Take measures to safeguard the long-term sustainability of the pension system, while
preserving adequacy. Strengthen the conditions that support higher wage growth, while respecting the
role of the social partners. Improve educational outcomes and skills levels of disadvantaged groups.
Some Progress.
2019 CSRs
IE SGP: -
MIP: CSR 1, 3
Assessment of implementation of 2019 CSRs
1. Achieve the MTO objective in 2020. Use windfall gains to accelerate the reduction of the general
government debt ratio. Limit the scope and number of tax expenditures, and broaden the tax base.
Continue to address features of the tax system that may facilitate aggressive tax planning, and focus in
particular on outbound payments. Address the expected increase in age-related expenditure by making
the healthcare system more cost-effective and by fully implementing pension reform plans.
Limited Progress (this overall assessment of country-specific recommendation 1 does not include an
assessment of compliance with the Stability and Growth Pact)
3. Focus investment-related economic policy on low carbon and energy transition, the reduction of
greenhouse gas emissions, sustainable transport, water, digital infrastructure and affordable and social
housing, taking into account regional disparities. Implement measures, including those in the Future Jobs
strategy, to diversify the economy and improve the productivity of Irish firms — SMEs in particular — by
using more direct funding instruments to stimulate research and innovation and by reducing regulatory
barriers to entrepreneurship.
Some Progress.
PE 497.739 17You can also read