Economic Business Review - 1H 2021 Clients and Industries, July 2021 - Deloitte

Page created by Margaret Arnold
 
CONTINUE READING
Economic Business Review - 1H 2021 Clients and Industries, July 2021 - Deloitte
Economic Business Review
1H 2021
Clients and Industries, July 2021
Economic Business Review - 1H 2021 Clients and Industries, July 2021 - Deloitte
Topical Views from our expert
                                                                 in Restructuring/Turnaround

                                                                                                                 The Secret Sauce of Driving
                                                                                                                 Successful Digital
                                                                                                                 Transformation

                                                                                             Industry Sector Update

                                                   Economic Outlook 2021

© 2021 Deloitte Touche Tohmatsu Jaiyos Co., Ltd.                                                                                    Economic Business Review | 1H 2021   2
Economic Business Review - 1H 2021 Clients and Industries, July 2021 - Deloitte
COVID-19 update

© 2021 Deloitte Touche Tohmatsu Jaiyos Co., Ltd.   Economic Business Review | 1H 2021   3
Economic Business Review - 1H 2021 Clients and Industries, July 2021 - Deloitte
Thanks to the ongoing vaccinations, especially in the United States, the daily new confirmed COVID-19
cases are finally dropping. However, path of recovery remains uneven across the world. Cases are rising
across Asia again amid new waves.
Daily new confirmed COVID-19 cases
Unit: Cases per day
                                                                 South America      Oceania   North America    Europe          Asia          Africa
1,000,000

   900,000

   800,000

   700,000

   600,000

   500,000

   400,000

   300,000

   200,000

   100,000

            0
             Jan          Feb           Mar         Apr   May         Jun     Jul      Aug     Sep    Oct     Nov       Dec           Jan         Feb   Mar          Apr        May           Jun
            2020         2020           2020       2020   2020       2020    2020      2020   2020   2020     2020      2020          2021       2021   2021        2021        2021         2021
Note: Information as of June 27, 2021
Source: WHO

© 2021 Deloitte Touche Tohmatsu Jaiyos Co., Ltd.                                                                                                        Economic Business Review | 1H 2021          4
Economic Business Review - 1H 2021 Clients and Industries, July 2021 - Deloitte
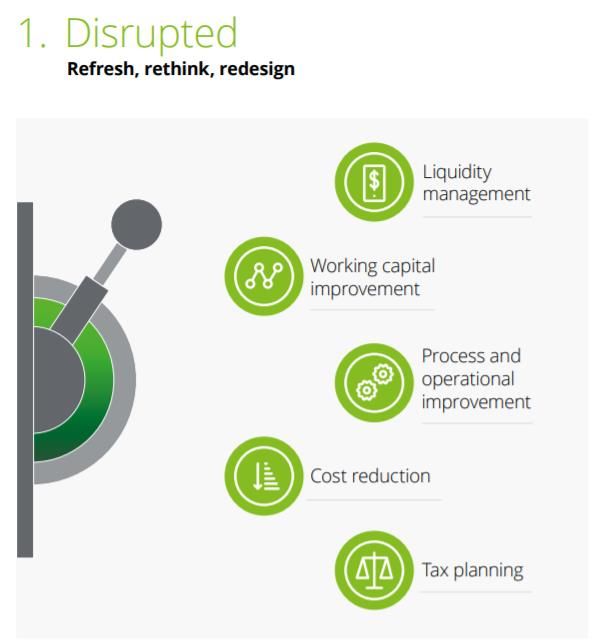
Top 10 new confirmed COVID-19 cases in the world, with India facing the highest number,
replacing the US.

Top 10 new confirmed COVID-19 cases in the world on June 27, 2021
Unit: Cases
       46,148

                               33,704
                                                    32,376

                                                               21,342     20,169

                                                                                   15,036   14,633
                                                                                                       12,105
                                                                                                                        9,758
                                                                                                                                              6,081

        India                  Brazil              Colombia   Indonesia   Russia   South     United   Argentina          Iran             Philippines
                                                                                   Africa   Kingdom

Source: WHO

© 2021 Deloitte Touche Tohmatsu Jaiyos Co., Ltd.                                                                  Economic Business Review | 1H 2021    5
Economic Business Review - 1H 2021 Clients and Industries, July 2021 - Deloitte
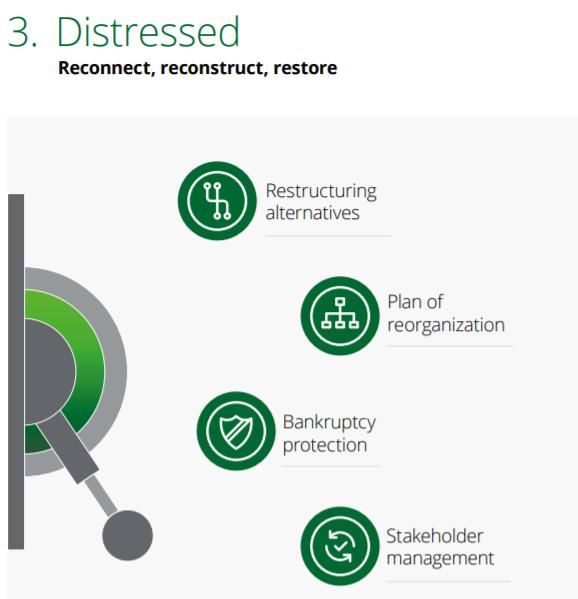
Among Southeast Asia, Indonesia witnesses the highest number of new cases. Thailand ranks at 4th
place with cases hovering around 4,000—5,000 cases per day.

Southeast Asia New confirmed COVID-19 cases on June 27, 2021
Unit: Cases
       21,342

                            6,081                  5,586
                                                            3,995

                                                                        839        804       415      56        14                 10                    0

   Indonesia            Philippines            Malaysia    Thailand   Cambodia   Myanmar   Vietnam   Timor   Singapore           Laos                Brunei

Source: WHO

© 2021 Deloitte Touche Tohmatsu Jaiyos Co., Ltd.                                                                         Economic Business Review | 1H 2021   6
Economic Business Review - 1H 2021 Clients and Industries, July 2021 - Deloitte
Global Economy

© 2021 Deloitte Touche Tohmatsu Jaiyos Co., Ltd.   Economic Business Review | 1H 2021   7
Economic Business Review - 1H 2021 Clients and Industries, July 2021 - Deloitte
As a result of the COVID-19 pandemic, 2020 was the worst-hit to global GDP since the Great
Depression. However, the IMF projects stronger 2021 growth by 6% amid pandemic rebound.

2021 Real GDP Growth Projections
Unit: Year-on-year percentage change (%)

                                               +0.5
                      +0.3                                          • Global growth is projected to grow at 6% in 2021.
                                                          6.0
                                   5.5                              • Thanks to the ongoing vaccination, re-openings and various policy supports, global
           5.2                                                        growth has been upwardly upgraded.
                                                                    • The positive revision is mainly due to upgrades for advanced economies, especially
                                                                      the United States.

     Forecasted               Forecasted               Forecasted
     in Oct 2020              in Jan 2021             in Apr 2021

Source: IMF WEO Apr 2021

© 2021 Deloitte Touche Tohmatsu Jaiyos Co., Ltd.                                                                          Economic Business Review | 1H 2021   8
Economic Business Review - 1H 2021 Clients and Industries, July 2021 - Deloitte
The positive revision in global growth for 2021 is mainly due to upgrades for advanced economies,
particularly to a sizable upgrade for the United States. China’s growth forecast remains the highest
among major economies.
2021 Real GDP Growth Projections
Unit: Year-on-year percentage change (%)

                                                     Forecasted in Oct 2020   Forecasted in Jan 2021   Forecasted in Apr 2021

                                                                                                                                   +0.2

                                                                                                                                8.2 8.1 8.4
                                       +3.3
                                                                                      -0.6
                                               6.4            -0.8              5.9
                                       5.1              5.2                                  5.3
                                                                                      4.5                      +1.0
                                                              4.2 4.4
                               3.1                                                                             3.1 3.3
                                                                                                         2.3

                                        US                     EU                     UK                       Japan               China

Source: IMF WEO April 2021

© 2021 Deloitte Touche Tohmatsu Jaiyos Co., Ltd.                                                                                     Economic Business Review | 1H 2021   9
Economic Business Review - 1H 2021 Clients and Industries, July 2021 - Deloitte
Thai Economy

© 2021 Deloitte Touche Tohmatsu Jaiyos Co., Ltd.   Economic Business Review | 1H 2021   10
Thailand
Following the new outbreak, BOT slashed its Thailand’s GDP growth forecast for 2021 down to 1-2%.
Depending on the procurement and distribution of COVID-19 vaccines as well as foreign tourism.
GDP Forecast under three scenarios of estimated vaccinations and time to reach Herd Immunity

                                                          Base Case                   Worse Case                    Worst Case
                                              Procurement and distribution   Procurement and distribution   Procurement and distribution
                                                 of 100 million doses of        of 64.6 million doses of      of < 64.6 million doses of
                                                    vaccines in 2021                vaccines in 2021               vaccines in 2021

  Herd Immunity                                            Q1/2022                    Q3/2022                       Q4/2022

                                                   2021               2022     2021                2022     2021               2022

  International Tourist
                                                   1.2                 15       1                   12       0.8                 8
  Arrivals (millions)

  GDP (%YoY)                                        2                 4.7      1.5                 2.8        1                  1.1

Source: Bank of Thailand as of May 6

© 2021 Deloitte Touche Tohmatsu Jaiyos Co., Ltd.                                                                                       Economic Business Review | 1H 2021   11
Thailand
In 2020, Thailand’s GDP registered a contraction of 6.1%, its deepest slump since the 1997 Asian Financial Crisis. In 2021,
it is expected to recover at a slow pace due to a sluggish tourism recovery and scarring effects from the crisis. However,
it will receive support from export recovery and government spending.
GDP
Unit: Year-on-year percentage change (%)

                                                                               2020   2021F
                                                                                                                          10.0
                  1.9                                                                         8.7
                                                                  4.9                  5.7                  5.2
                                                                               4.3
                                                     1.9
                                                                         0.8

                                              -1.0

                                                           -8.4

                                                                                                                  -13.3

         -6.1                                                                                       -19.4

        GDP growth

                                             Private         Private       Public        Public      Exports       Imports
                                           consumption     investment   consumption   investment

Source: NESDC and SCB EIC (Outlook Q2/2021)

© 2021 Deloitte Touche Tohmatsu Jaiyos Co., Ltd.                                                                      Economic Business Review | 1H 2021   12
Tourism, a key engine of Thailand's economic growth, has been one of the hardest-hit sectors
by the crisis. Despite vaccination rollouts in many countries, foreign tourist arrivals are expected
to reach only 0.4 millions in 2021 due to new variant concerns and gradual reopening policy
stance from other economies.
Foreign Tourist arrivals
Unit: Million persons, %YoY

                                                          Foreign Tourists     %YoY

                                                                        39.8
 40                                                38.3                                                                                   40
                          35.0
 35                                                                                                                                       20
 30
                                                                                                                                          0
 25
                                                                                                                                          -20
 20
                                                                                                                                          -40
 15
                                                                                                                                          -60
 10
                                                                                              6.7              -94%
  5                                                                                   -83%                                                -80
                                                                                                                0.4
  0                                                                                                                                       -100
                         2017                      2018                 2019                 2020F             2021F

Source: BOT and SCB EIC (Outlook Q2/2021)

© 2021 Deloitte Touche Tohmatsu Jaiyos Co., Ltd.                                                     Economic Business Review | 1H 2021        13
Bank of Thailand cuts its key interest rate by 75 basis points to its all time low of 0.5 percent and is
expected to keep at this rate at 0.5% throughout 2021.

Policy rate
Unit: %

                                                                                                     Forecasted
3.5

3.0

                                                                                                                  In addition to the low policy rate, the central
2.5                                                                                                               bank announced a limited debt moratorium until
                                                                                                                  year-end to help small and medium-sized
2.0                                                                                                               businesses impacted by the outbreak.
                                                                                      1.75

1.5

                                                                                       1.25
1.0

0.5
                                                                                              0.50
0.0
   2010          2011         2012          2013   2014   2015   2016   2017   2018   2019    2020     2021

Source: BOT and SCB EIC (Outlook 2Q/2021)

© 2021 Deloitte Touche Tohmatsu Jaiyos Co., Ltd.                                                                                Economic Business Review | 1H 2021   14
In the remaining year of 2021, the baht is expected to depreciate due to slower-than-expected
recovery of the Thai economy and current account deficits.

Exchange rate
Unit: THB/USD

                                                   Actual    Forecast                     Forecast
    33.0

    32.5

    32.0                                                                                                 32   • The Thai baht has already weakened by 4%
                                                                                                                since the beginning of the year to close at 31.2
    31.5                                                                                                        baht per USD on May 31, 2021.
                                                                                                              • The depreciation degree is considered
    31.0                                                                                                 31
                                                                                                                significant compared to other regional
    30.5                                                                                                        currencies.

    30.0

    29.5

    29.0

    28.5
        Jan 19                    Jun 19                Jan 20          Jun 20   Jun 21         Dec 21

Source: BOT and SCB EIC (Outlook 2Q/2021)

© 2021 Deloitte Touche Tohmatsu Jaiyos Co., Ltd.                                                                             Economic Business Review | 1H 2021   15
Topical Views from our expert
                                                                           in Restructuring/Turnaround

                                                                                                                             The Secret Sauce of Driving
                                                                                                                             Successful Digital
                                                                                                                             Transformation

                                                                                                         Industry Sector Update

                                                   Economic Outlook 2021

© 2021 Deloitte Touche Tohmatsu Jaiyos Co., Ltd.                                                                                                Economic Business Review | 1H 2021   16
Views from our expert—Restructuring/Turnaround Activities

What have been the common actions taken by companies             unknown. Only a few companies have recognized working
in order to sustain their balance sheet and preserve             capital optimization, which is an example of a more
liquidity in response to the current economic conditions         sustainable measure to improve cash flow despite longer
during the past 12 months?                                       timelines for implementation.
As part of the government relief measures, financial             In addition, some companies have considered selling their
institutions have been the first port of call for struggling     assets for liquidity. It is undeniable that the sale of non-core
corporates to request for waivers and payment holidays on        assets is one of the options that all restructurings
principal and interest. In my view, this may not be the most     practitioners have advised companies. However, identifying
the sustainable solution for generating liquidity as the         non-core assets for sale is crucial and can have a significant
obligation to make payment against debt facilities remains       impact on the future strategic position. As a result, I would
and future repayments are likely to be higher because of         suggest companies redefine their strategic priorities first.
the deferrals. The ability to further amend and extend debt      Moreover, questions on the timing and sale process should
facilities remains to be seen, especially given the more         be rephrased -- whether it is the right time, whether there
stringent capital requirements for distressed positions. It is   is sufficient market appetite. Structured well-prepared sale
clear that the financial institutions have taken a pragmatic     processes take time from the decision to divest until the
view and waived events of default to avoid systemic failure      completion -- whether the sale proceeds are worth time
and widespread insolvency.                                       and effort spent.
Most companies also rationalize operating costs by               Also, this might not be common under this situation but
deferring non-essential and major capital expenditure            there are few companies successfully accessing to the new
regarded as ‘quick fixes’ rather than sustainable measures       fund by drawdown on existing debt facilities, issuance of
to improve the balance sheet. This should be carefully           new instruments, or shareholders’ support to improve
considered as the long-term strategic consequence of the         liquidity position.
delayed or cancelled capital expenditure projects is

© 2021 Deloitte Touche Tohmatsu Jaiyos Co., Ltd.                                                                                    Economic Business Review | 1H 2021   17
Views from our expert—Restructuring/Turnaround Activities (cont.)

What restructuring/turnaround actions would you suggest
companies to consider?
In fact, whatever actions companies take, those should be carried
strategically. Two companies may execute exact same actions with
different approaches yet achieve completely different results. The
current downturns are challenging with many unknowns -- overall
uncertainty around global conditions, the vaccine rollout, the path of
recovery of the virus, supply chain risks, ongoing weak businesses, and
consumer confidence. Thus, doing nothing is not an option.
For some businesses, the need for immediate action may be painfully
obvious. For instance, for an international airline, its operating model
has been severely damaged. Some have been in deep trouble and
sought for court protection in order to reorganize and shed liabilities.
For these companies, the approach is more narrow and traditional
sense of restructurings. Conversely, the companies with less financial
stress should take more deliberate steps to reposition themselves and
opt for long-term instead of short-term survival only.
Deloitte sees responsive actions grouped into three categories based
on the spectrum of situations -- “Disrupted”, “Disadvantaged” and
“Distressed”. These three categories are to highlight the available
approaches a restructuring/turnaround mindset can bring. To avoid
long-term disadvantages, these categories can help you see
circumstances clearly and weigh through prudent approach in order to
balance between fixing short-term problem and maintaining long-term
competitiveness before taking any restructuring/turnaround action.

© 2021 Deloitte Touche Tohmatsu Jaiyos Co., Ltd.                           Economic Business Review | 1H 2021   18
Views from our expert—Restructuring/Turnaround Activities (cont.)

In the disrupted situation, a company may want to refresh its go-to-market model,              turnaround planning in order to categorize non-focused businesses with less
brand positioning, or other parts of its strategy. By being willing to rethink the business,   competitiveness or profitability. The effort to rebalance and reconfigure might involve
leadership may find new ways to thrive amid shifts in customer behaviors, supply chain         selling or even winding down a severely impaired unit that has little prospect of
disruptions, or changes in capital requirements or availability. Where impacts are             returning to profitability to help strengthen other operations.
lasting, they may consider reasons to redesign specific business processes. For instance,      Some distressed companies may reach a level of strain that requires difficult issues to
one of the responsive actions may be around optimization of its business portfolio. To         be addressed urgently, using the tools and proceedings that fit the narrow and
ease liquidity pressure, a disrupted company should take a holistic approach when              traditional restructuring. In addition, they should become vital to reconnect with
deciding cost saving. Rather than immediately cutting costs, such companies may
                                                                                               shareholders, creditors, and other stakeholders such as employees, customers, and
rethink how spending can support their business value creation and by how much. Also,          suppliers. Moreover, they have to reconstruct themselves by making changes in capital
companies should refresh its communication on cost reduction program by promoting              structure. If successful, these steps should lead directly to a long-term mandate to
productivity -- not only money saving (efficiency) but also performance (effectiveness) --     restore trust in the company and its purpose. Perhaps a distressed company that
and redesign how they spend budgets from a zero-based budgeting approach.                      embraces a full reorganization will likely involve a pressing need to reconstruct the
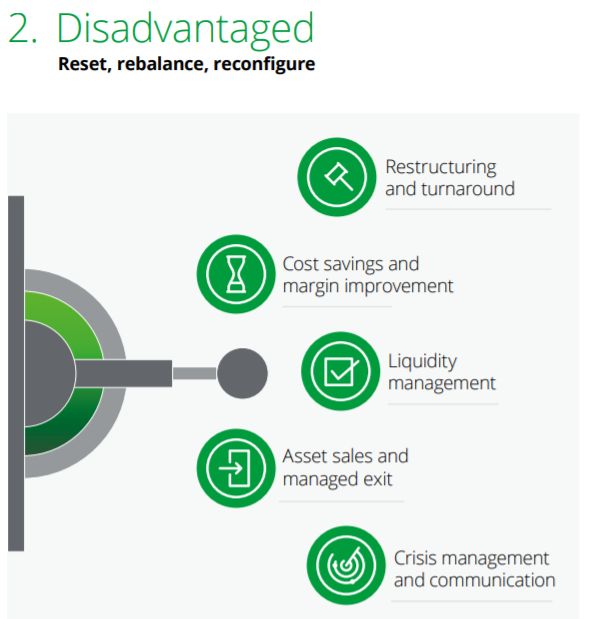
Some companies may find themselves in a disadvantaged situation where the                      capital structure by renegotiating terms with existing debt holders and other creditors.
disruption of a business or an industry has been more lasting or severe; hence, they           To do this requires a viable plan to restore the company to viability. The plan has to take
require additional initiatives or a deeper transformation. There may be a need to reset        into account changes in the current business environment, or the structure of capital,
relationships by making significant changes in the supply chain or developing market           debt and assets, along with the increased uncertainty. Any such plan or strategy needs
efforts. There may be a need to rebalance financial and tax condition by strengthening         to reconnect with the business’s customers, including potential new investors. Selling
the balance sheet or making better use of available capital. Companies may need to             assets may well be part of the effort to raise capital and restore the parts of the
reconfigure its workforce by reducing the number of employees or dramatically                  business that have the greatest value as a going concern. Practically, the Business
changing the mix of job titles. Also, actions companies may consider include putting           Rehabilitation under Thai Bankruptcy Act can support a distressed company by shedding
themselves on a solid financial footing. For example, a disadvantaged company needs to         obligations that other options cannot. This plan should not be seen as the endpoint, but
shore up its finances through a divestiture or a managed exit. By identifying and              as an available approach that makes possible to restore things in ways that would not
shedding business units, a company should reset its strategic priorities with business         be possible any other way, reconstruct itself and reconnect to its purpose.

© 2021 Deloitte Touche Tohmatsu Jaiyos Co., Ltd.                                                                                                     Economic Business Review | 1H 2021   19
Views from our expert—Restructuring/Turnaround Activities (cont.)

In summary, when considering restructuring/turnaround actions, a company should                                         activities will play an ever-increasing role. My concern is that there are now many
understand the levers that can be applied across the spectrum of situations, whether                                    restructuring tools and options businesses can choose from, this consequently may
the disruption is mild, or the distress is severe. This understanding can help you                                      allow them to delay a holistic restructuring. Then, until they run out of cash and become
embrace changes, find opportunities in a longer term, anticipate what comes next, and                                   up to the end, there would be too little time to do so. Based on recent studies of how
thrive in the future through turnaround planning process with the different magnitude                                   companies came out of the last recession, the businesses that managed not only to
of mindset and actions -- “Refresh, Rethink, Redesign”, “Reset, Rebalance, Reconfigure”,                                survive but also to thrive outperforming peers.[1] Hence, I would recommend companies
or “Reconnect, Reconstruct, Restore”.                                                                                   to do this exercise for the long-term purpose.
Under this economic downturn, it is expected to see a rise in restructuring or                                          In case you are looking for a talent to lead the restructuring/turnaround project in your
turnaround trend. Some companies may look for a talent to handle this particular                                        organization, the top five critical skills and characteristics of such person are turnaround
work within a company. Can you provide suggestions about the characteristics and                                        and crisis management, strategic thinking, reliability, decisiveness, and stakeholder
skills that a leader of restructuring/turnaround function should possess?                                               communication. This person will be responsible for leading the development of the
                                                                                                                        turnaround plan, negotiating terms of restructuring (both financial and operational
While it was not the case for Thailand, restructuring/turnaround activities trend has
                                                                                                                        terms) on behalf of the company, and implementing the plan. Importantly, you should
been on the rise around the world even before the COVID-19 crisis hit. With the
                                                                                                                        ensure that the major stakeholders can work well with this person. As developing the
recovery of the pandemic and re-openings, the government support and debt
                                                                                                                        professional career in this field, the personality fit with the client is another key criteria
moratorium schemes will eventually be lifted. Companies that does not prepare for the
                                                                                                                        for the resource assignment.
end of support may face vulnerability. Thus, it is expected that restructuring/turnaround

[1]   Kevin Laczkowski and Mihir Mysore, “What Companies Should Di to Prepare for a Recession”, Harvard Business Review, May 2019

© 2021 Deloitte Touche Tohmatsu Jaiyos Co., Ltd.                                                                                                                                Economic Business Review | 1H 2021   20
Views from our expert—Restructuring/Turnaround Activities

                                     Kamolwan Chunhagsikarn
                                     Partner, Restructuring and Value Creation Services

© 2021 Deloitte Touche Tohmatsu Jaiyos Co., Ltd.                                          Economic Business Review | 1H 2021   21
Industry Sector Update

                                                                                                       The Secret Sauce of Driving
                                                                                                       Successful Digital
                                                                                                       Transformation

                                                                       Topical Views from our expert
                                                                       in Restructuring/Turnaround

                                                   Thailand Economic
                                                   Review 2021

© 2021 Deloitte Touche Tohmatsu Jaiyos Co., Ltd.                                                                         Economic Business Review | 1H 2021   22
Executive summary
Based on 2020 performance, sectors can be grouped as Deceleration, Recovery and Expansion.

                              Deceleration                                      Recovery                                              Expansion

                                                                                      In 2020, most of the                                 Pharmaceutical sales
                                Consumption of petroleum
                                                                                      consumer goods yielded                               increased by 4.5% in 2020
                                products dropped 12% in 2020   Consumer
           Oil & Gas                                                                  lower market value              Life Sciences        due to a higher number of
                                especially Jet fuel, due to    Product
                                                                                      because of COVID-19                                  medicines distributed
                                airline service slowdown.
                                                                                      pandemic.                                            through hospital.
                                                                                      Automotive sales in
                                                               Automotive             Thailand decreased to 0.8
                                                                                      million in 2020, dropping                            Healthcare spending
                                                                                      by 21%.                                              increased substantially by
                                Banking market value in 2020
           Banking                                                                                                    Healthcare           7% in 2020 partially due to
                                declined by 7% YoY.
                                                                                      The COVID-19 pandemic                                the increasing trend of
                                                               Power, Utilities &                                                          aging population.
                                                               Renewables             and the national lockdown
                                                                                      reduced annual electricity
                                                                                      demand by 3% in 2020.
                                                                                                                                           Manufacturing PMI
                                                                                                                                           recovered from a rock
                                Insurance market dropped by                           Domestic consumption of
                                                                                                                      Industrial           bottom point in April 2020,
                                -3.1% in 2020 while non-life   Chemical               petrochemicals dropped
           Insurance                                                                                                  Product &            which coincided with the
                                insurance increased by 1.8%                           by 3.0% in 2020.
                                                                                                                      Construction         beginning of the COVID-19
                                in 2020.
                                                                                                                                           lockdown, to 50.7 in April
                                                                                                                                           2021.
                                                                                      In 2020, the modern trade
                                                               Wholesale &            industry experienced a
                                                               retail                 historic contraction in
                                                                                      sales, falling by 10.0-12.0%.

© 2021 Deloitte Touche Tohmatsu Jaiyos Co., Ltd.                                                                                   Economic Business Review | 1H 2021   23
Consumer product

© 2021 Deloitte Touche Tohmatsu Jaiyos Co., Ltd.   Economic Business Review | 1H 2021   24
In 2020, most of the consumer goods faced with the lower market value because of COVID-19
pandemic. However, laundry care saw a positive value growth due to stockpiling behaviour due to
COVID-19 lockdown.
Market Value by Sector in Thailand (THB billion)

Mass beauty and personal care                              Laundry care                         Bath and shower
                                                   198                    +11%
                      -6%                                                                                  -14%
                                                                                  41     43                                            26
         154                                                    37                                 22
                                  145
                                                                                                                     19

        2019                     2020              2023F       2019              2020   2023F     2019              2020            2023F

Source: Deloitte analysis based on Euromonitor

© 2021 Deloitte Touche Tohmatsu Jaiyos Co., Ltd.                                                         Economic Business Review | 1H 2021   25
In 2019, the total sales value of packaged food in Thailand reached around 14.2 billion US dollars,
increasing since 2015.

Packaged Food market in Thailand

Total Sales of Packaged Food in Thailand from 2015-2019 ($ USD)   Driving Forces

                                                                   Welfare card             Convenience store                  E-commerce
                                                                     holder                    expansion

                                                                  Restraining Forces

                                                                                Economic slowdown                  Household
                                                                             due to COVID-19 pandemic                debt

Source: Deloitte analysis based on Kanar and Neilson, Statista
© 2021 Deloitte Touche Tohmatsu Jaiyos Co., Ltd.                                                           Economic Business Review | 1H 2021   26
Industrial Product & Construction

© 2021 Deloitte Touche Tohmatsu Jaiyos Co., Ltd.   Economic Business Review | 1H 2021   27
Manufacturing PMI recovered from a rock bottom point in April 2020

Manufacturing PMI (Index) 2017-4M2021

                                                       Expansion

                                                                     Manufacturing PMI recovered from a rock
                                                                     bottom point in April 2020, which coincided
                                                                     with the beginning of the COVID-19
                                                                     lockdown, to 50.7 in April 2021, the highest
                                                                     rate since before COVID-19 period. However,
                                                       Contraction   the PMI number has not yet taken into
                                                                     account the current third wave which could
                                                                     lead to a lower number.

Source: Deloitte analysis based on Trading economics

© 2021 Deloitte Touche Tohmatsu Jaiyos Co., Ltd.                                    Economic Business Review | 1H 2021   28
Constant YoY decline in Capital Goods with 11% CAGR decrease in 2020. Nonetheless, a positive sign of
8% increase in Q1 2021 from Q1 2020 can be found.

Import value of Capital Goods (THB Trillion)                                           Change 3M2020 vs 3M2021 (%YoY)

                          Machinery, equipment, and supplies             Others
                                                                                       Computer                                                                      42%

                             -8%                                                       Telecommunication
                                                                                                                                                              37%
                                                                                       equipments
                                       -11%                                            Power-generating
 1.84 1.84                                                                                                                                    27%
                      1.74 1.74                                                        machinery and parts
        18%                                 1.54 1.54
                             17%                                                       Office automations
                                                                        +8%                                                             23%
                                                      15%                              & parts (excl. computer)
                                                                               0.42    Transformers, generators,
                                                                0.39                                                           17%
                                                                               13%     motors, and accumulators
                                                                16%
        82%                  83%                                                       Rubber equipments
                                                      85%                                                                10%
                                                                                       and parts
                                                                84%            87%
                                                                                       Measuring, checking,
                                                                                                                    9%
                                                                                       and precision instruments
                                                                                       Medicinal and surgical
                                                                                                                   5%
       2018                  2019                  2020        3M2020         3M2021   equipment and supplies

Source: Deloitte analysis based on Bank of Thailand

© 2021 Deloitte Touche Tohmatsu Jaiyos Co., Ltd.                                                                                     Economic Business Review | 1H 2021    29
Steady YoY decline in import value of raw materials and intermediate goods with -12% 2020 YoY
decrease. However, there was an increase of 6% in Q1 2021 compared to Q1 2020.

Import value of raw materials and intermediate goods (THB Trillion)                           Change 3M2020 vs 3M2021 (%YoY)

      Minerals                                              Fuel
      Agricultural and agro-manufacturing products          Non-agro manufacturing products

                             -11%
                                                                                                                      Minerals                        12

        4.5                             -12%
          3%                 4.1
      7%
                               3%                    3.6
                           7%                                                                                             Fuel   -14
        29%                                            2%                +6%
                                                   8%
                             27%
                                                      23%                       1.1
                                                                   1.0
                                                                   0.1   0.0            0.0                   Agricultural and
                                                                                0.2     0.1                                                 2
                                                                   0.3                             agro-manufacturing products
        62%                  63%                      67%
                                                                   0.6          0.7

                                                                                               Non-agro manufacturing products                             16
        2018                 2019                  2020        3M2020          3M2021

Source: Deloitte analysis based on Bank of Thailand

© 2021 Deloitte Touche Tohmatsu Jaiyos Co., Ltd.                                                                                       Economic Business Review | 1H 2021   30
Automotive

© 2021 Deloitte Touche Tohmatsu Jaiyos Co., Ltd.   Economic Business Review | 1H 2021   31
Automotive sales in Thailand decreased to 0.8 million in 2020, dropping by 21%YoY due to the COVID-
19 crisis. A cumulative -6% decline during Q1 2021 YoY can be seen despite a substantial increase in
Mar YoY at 33%, due to steep declines in Jan and Feb 2021 YoY, especially in commercial cars.
Thailand’s Automotive Sales (THB million)
                            1st car scheme

                                                                 The expiry of 5-year lock-up
                                                                           period
                                 1.44                                                                                                        Growth
                                                                                                       COVID-19
                                            1.33
                                                                                                                                             3M2020-3M2021

                                                                                     1.04       1.01
                                 53%
                                            53%                                                                                                   Commercial car          -24%
                                                   0.88                     0.87
         0.80        0.80                                 0.80     0.77                                 0.79                                      Passenger car            6%
                                                                                                                          -6%
                                                                                     62%        60%                                    49%
                                                   58%                      60%                                    0.20
         57%         55%                                  63%                                                                   0.19
                                                                   64%                                  65%

                                 47%                                                                               61%          68%
                                            47%
         43%         45%                           42%                      40%      38%        40%
                                                          37%      36%                                  35%        39%          32%

        2010        2011         2012       2013   2014   2015    2016     2017     2018        2019    2020      3M2020    3M2021

Source: Deloitte analysis based on FTI

© 2021 Deloitte Touche Tohmatsu Jaiyos Co., Ltd.                                                                                             Economic Business Review | 1H 2021   32
All important key figures show signs of automotive sector recovery.

Production                                                          Domestic sales                                            Export
Thousand units                                                      Thousand units                                            Thousand units
 200                                                                 120                                                        120
                                                                     100                                                        100
 150
                                                                      80                                                          80
 100                                                                  60                                                          60                                            +414%
                                                   +558%                                                  +147%
                                                                      40                                                          40
   50
                                                                      20                                                          20
    0                                                                  0                                                           0
    Jul-20 Apr-20 Jan-21 Oct-20 Jan-21 Apr-21                          Jul-20 Apr-20 Jan-21 Oct-20 Jan-21 Apr-21                   Jul-20 Apr-20 Jan-21 Oct-20 Jan-21 Apr-21

Motor Vehicle Parts and Accessories Manufacturing
       Industrial production index                           Finished goods inventory index                        Utilization rate                              Labor index

                                 101
                                                                                                                              83
                                                                                                                                                                             91
                                                                                 177

   Jan-20      Jul-20      Jan-21        Jul-21            Jan-20   Jul-20   Jan-21    Jul-21        Jan-20   Jul-20     Jan-21       Jul-21    Jan-20     Jul-20      Jan-21       Jul-21
Source: Deloitte analysis based on OIE

© 2021 Deloitte Touche Tohmatsu Jaiyos Co., Ltd.                                                                                               Economic Business Review | 1H 2021       33
Vehicle sales increased by 33% YoY in March 2021 where Toyota remained the market leader. Honda had
 the highest overall growth at 37% YoY with a 47% increase in passenger cars. Toyota had the highest
 growth in commercial cars at 42%, nearly surpassing Isuzu, the market leader in commercial car sales.
Share of new vehicle sales in March 2021 (YoY %)
Total (+33%)                                                                Passenger cars (+46%)                         Commercial cars (+26%)

                                                                                                       Toyota
                                                                                                                                  Others
                                                       Toyota                                       18% 0%
                                                                                                                                           25%
                                                   28%   +29%                                                                                                                      Isuzu
Others                                                                                                                                                                      35% +29%
            37%
                                                                            Others 44%                      9%   Nissan

                                                                                                                 +34%     Mitsubishi 6%

                                               22%                                                                          +4%
                                                                                                    30%
                        13%                                                                                                                           34%
                                                     Isuzu
            Honda                                                                                     Honda
                                                       +29%                                                                                      Toyota
                                                                                                          +47%
            +37%                                                                                                                                 +42%

 Source: Deloitte analysis based on Toyota Motor Thailand Co., Ltd. (TMT)

© 2021 Deloitte Touche Tohmatsu Jaiyos Co., Ltd.                                                                                                   Economic Business Review | 1H 2021      34
Technology, Eco-friendly and Sharing economy are key mega trends in the automotive industry.

                                                         Technology                                     EV has high potential in Thailand

                                                                                                                         EV roadmap
                                                      Autonomous car
                                                       Connected car

                                 Main focus                                                             • A roadmap to make the country a hub of electrified vehicles in
                                                                                                          the ASEAN region in five years
                                    Electric vehicle                                                    • The EV master plan aims to increase EV production to 30% of
                                                                                                          total annual car production, or about 750,000 units out of 2.5
                                                                                                          million units by 2030
                                                                                                        • The government is working on developing EV charging
                                                                              Ride-sharing                infrastructure in the country. PTT and EGAT will help one another
                                                                                                          in building more charging stations in the country

               Eco-Friendly                                                           Sharing economy

Source: Deloitte analysis based on BOI
Note: Electrified vehicles—including hybrids, plug-in hybrids, and battery electric vehicles (BEVs)

© 2021 Deloitte Touche Tohmatsu Jaiyos Co., Ltd.                                                                                                      Economic Business Review | 1H 2021   35
In order to realise the full potential benefits of electrification, there are five different enablers that
should be addressed to increase the feasibility and attractiveness of EV adoption.

   Five enablers for electrification

               Total cost of ownership

                                                   Despite a recent increase in EV adoption in Thailand, overall numbers remain low.

                                                   Overall, the cost of EV in Thailand is significantly higher compared to ICEV.
               Battery range and life
                                                   Increased incentives may be required, such as lower excise taxes and the introduction of EV-only
                                                   lanes, to stimulate greater demand. Fleet use cases are also set to witness increased adoption.

                                                   The challenge for EV in Thailand lies in limited fleet charging networks. The charging infrastructure
               Charging networks                   needs to be improved, for example, by implementing battery swapping systems for two-wheelers, and
                                                   adapting power grids for solar-powered chargers.

                                                   Currently, Thailand’s value chain capabilities and customer demand are also mostly focused on PHEVs,
                                                   rather than BEVs. Industry players should consider ways to leverage the initial interest in PHEVs to
               Regulatory environment              generate a stronger BEV network, by integrating EV charging infrastructure at existing gas stations.

               Value chain potential

Source: Deloitte analysis

© 2021 Deloitte Touche Tohmatsu Jaiyos Co., Ltd.                                                                                   Economic Business Review | 1H 2021   36
Newly registered electric vehicles in Thailand skyrocketed in 2020, especially BEV.

Newly Registered Electric Vehicle in Thailand (Thousand Units)

                2018            2019          2020          3M2021                                2018            2019   2020   3M021

                                                                        Others                                                  Motorcycle
                                                                          0                                                                1
                          3.0                                           (1%)                                                             (5%)
                                                                                         Car          30.7 32.3
                                                                                   0
                                                                                 (37%)
                                                                                               20.3
                  1.6
                                  1.3                             1                                               14.2
                                                                (62%)
                                                   Motorcycle
          0.3                                                                                                                                  13
                                                                                                                                             (95%)

                       BEV                                                                            HEV/PHEV                                  Car

Source: Deloitte analysis based on EVAT

© 2021 Deloitte Touche Tohmatsu Jaiyos Co., Ltd.                                                                                Economic Business Review | 1H 2021   37
Banking

© 2021 Deloitte Touche Tohmatsu Jaiyos Co., Ltd.   Economic Business Review | 1H 2021   38
Banking market value in Thailand grew by 0.3% CAGR with a 7% decline 2020 YoY, mainly because of
lower other operating and interest income.

Banking market value
Unit: THB billion

                                                                                                 CAGR                                       Growth
                                                                                               2016-2020                                 1Q2020-1Q2021
                                         0.3%
                                                              -7%
                                                      1,004
                                          964          5%
       917              929                                         929
                                          5%
       5%               4%                                          6%     Others operating income         7.4%
                                                      20%
                                          21%
      20%               21%                                         20%    Fees and service income         -0.3%    262
                                                                                                                    11%
                                                                                                                             213
                                                                                                                    18%      4%      Others operating income           -73.8%
                                                                                                                             22%     Fees and service income           +0.2%

                                          75%         75%
      75%               75%                                         74%    Interest income                 0.0%
                                                                                                                    71%
                                                                                                                             74%     Interest income                   -15.0%

      2016              2017             2018         2019          2020                                           1Q2020   1Q2021

Source: Deloitte analysis based on Bank of Thailand

© 2021 Deloitte Touche Tohmatsu Jaiyos Co., Ltd.                                                                                        Economic Business Review | 1H 2021      39
In 2020, Corporate Loan growth surpassed that of Consumer Loan for the first time as a result of a
weak household purchasing power due to COVID-19.

Loan growth classified by loan portfolios and Share of total loans
Unit: %

                                                                                                   18%
                                                                                     Share of
     10                                                                             total loan
       9                                                                                                       8%          8%
                                                      7.5
       8
       7                                                                                                                                          2%

       6                                                         5.4
                                                                 4.6    Corporate     36%        Mortgage   Automotive   Personal            Credit card
       5
                                                                        Consumer
       4
       3                                                                              64%
                                                                                                             32%
       2                                                                                                                      23%
       1
       0                                              -0.8
      -1
        2016          2017          2018           2019          2020                                        SME         Large corporate

Note: Large corporate and SME are excluding financial business
Source: Deloitte analysis based on Bank of Thailand

© 2021 Deloitte Touche Tohmatsu Jaiyos Co., Ltd.                                                                                Economic Business Review | 1H 2021   40
Consumer loan quality declined across all portfolios, except mortgage which showed a positive sign.

                                 Mortgage                               Auto                                Credit card                          Personal
                                                                                                                                  10.1                                       11.8
 Consumer loan growth by

                                 Unit: %
       portfolio

                                                                                        7.6
                                                                                                                                                                                             6.2

                                                                                                   2.4
                                                                 5.9                                                                      -2.1
                                                          5.4

                                2017         2018         2019   2020    2017   2018   2019       2020      2017          2018   2019     2020   2017         2018          2019             2020

                                 Unit: % of total loans
 Stage 3 (NPL) and stage 2 by

                                                                 5.8
                                                                                                                                         6.5                                            6.2
           portfolio

                                                                                                   9.5
                                                           1.9            7.2   7.1    7.4
                                       1.9      1.8                                                            1.9                                 2.4          2.3         2.3
                                                                                                                          1.7    2.0

                                       3.2      3.3        3.7   3.8
                                                                                                               2.6        2.3    2.4     2.4       2.5          2.5         2.3         2.4
                                                                          1.6   1.7    1.9         1.4
                                    2017       2018       2019   2020    2017   2018   2019       2020        2017        2018   2019    2020     2017         2018        2019       2020

Source: Deloitte analysis based on Bank of Thailand                                           Stage 2    Stage 3

© 2021 Deloitte Touche Tohmatsu Jaiyos Co., Ltd.                                                                                                        Economic Business Review | 1H 2021          41
Commercial Banks must adjust to the New Normal era due to COVID-19.

The impacts of the COVID-19 pandemic on the commercial banking business                     4 major developments

                                                                  Cashless payment

                                                                                                                   The increasing role
                                                                                                                     of contactless
                                    The speed of disruption    Familiar with technology
                                                                                                                        payment
                                      has become faster

                                                                Competition from non-
                                                                       banks

   COVID-19 and                                                                                                                                Credit policy has
  Social distancing                                                                            New business
                                                                                                                                              been changed and
                                                              New economic environment         opportunities
                                                                                                                                                   revised

                                          “New Normal"        Changing business practices
                                           environment
                                                                                                                       Growing
                                                                                                                   importance of cost
                                                               New consumer behavior                                   efficiency
Source: Deloitte analysis based on KResearch

© 2021 Deloitte Touche Tohmatsu Jaiyos Co., Ltd.                                                                             Economic Business Review | 1H 2021    42
Insurance

© 2021 Deloitte Touche Tohmatsu Jaiyos Co., Ltd.   Economic Business Review | 1H 2021   43
Insurance market dropped by -3.1% in 2020 while non-life insurance increased by 1.8% in 2020 YoY.

Insurance’s market size by type (THB billion)
Million Baht

                                                                                                                          CAGR                    Growth
                                                                                       -3.1%                            2007-2019                2019-2020
                                                          +4.8%
                                                                         860    855
                                                                  819                          828
                                                          784
                                                   747
                                         709                             27%    29%
                                                                  27%                          30% Non-life Insurance     4.5%                      1.8%
                        646                               28%
                                                   28%
        571                              29%
                        31%
        31%

                                                                  73%    73%    71%            70% Life Insurance         6.5%                      -5.0%
                                                   72%    72%
                                         71%
                        69%
        69%

       2012            2013              2014      2015   2016    2017   2018   2019           2020

Source: Deloitte analysis based on OIC

© 2021 Deloitte Touche Tohmatsu Jaiyos Co., Ltd.                                                                         Economic Business Review | 1H 2021   44
Total Life Insurance direct premium declined by -2% YoY despite an 8% increase among riders, as they
accounted for only 19% of total Life Insurance direct premiums.

Life Insurance direct premium by type of contract (THB Billion)

                                                                                  THB 600 billion in 2020                                         2019       2020
          +6%                                                                             (-2%)                     -4%

              86                                                                                                  412
        80                                                                                                              394

                                                                     Rider 19%                      81% Main
                              +11%
                                                         +8%                                                                  -9%
                                                                                                            -2%                         +2%        +16%             -7%             +6%
                             15 17
                                                                                                                              45 41
                                                                                                                                       25 25       12 14           6   5           5     5

        Health             Accident                                                                               Ordinary    Group   Unit-link   Pension       Industrial       Personal
                                                                                                                                                                                 Accident

Note: Others refer to Annuity, Industrial, Personal Accident and Universal Life
Source: Deloitte analysis based on OIC

© 2021 Deloitte Touche Tohmatsu Jaiyos Co., Ltd.                                                                                                    Economic Business Review | 1H 2021       45
Miscellaneous businesses saw the highest YoY growth at 8% across non-life insurance portfolio mix,
while marine was the only business with a -3% decline.

Non-life Insurance direct premium by type of contract (THB Billion)

                                                                                     2019   2020
                            +1%

                     144            146

                                                                          +8%
                                                                                91
                                                                     84

                                                                                                        0%
                                                                                                                                -3%
                                                                                                   10          10
                                                                                                                          5             5

                           Motor                                     Miscellaneous                      Fire                  Marine
Note: Others refer to Other Miscellaneous, Health, Fire and Marine
Source: Deloitte analysis based on OIC, EMIS and TGIA

© 2021 Deloitte Touche Tohmatsu Jaiyos Co., Ltd.                                                                    Economic Business Review | 1H 2021   46
Power, Utilities & Renewables

© 2021 Deloitte Touche Tohmatsu Jaiyos Co., Ltd.   Economic Business Review | 1H 2021   47
The state-owned Electricity Generating Authority of Thailand (EGAT) and Independent
Power Producers (IPPs) dominate electricity generation in Thailand with a combined
market share of 61.2% as of Feb 2021.
System Generating Capacity

Total 49,600 MW As of Feb 2021
                                                                                          PEA&DEDE
                                                                                   VSPP
                                                                                    8.3%
                                                                  Import                   0.1%
                                                                                                                    EGAT
                                                                           10.9%
                                                                                                           31.1%

                                                                       19.4%
                                                                 SPP

                                                                                              30.1%

                                                                                                  IPP

Source: Deloitte analysis based on EPPO

© 2021 Deloitte Touche Tohmatsu Jaiyos Co., Ltd.                                             Economic Business Review | 1H 2021   48
Key Figures Update: Power, Utilities & Renewables

Electricity Consumption Growth

                   %YoY (RHS)                      Electricity Consumption (LHS)
200                                                                                          10
                                                                                             8
150                                                                                                  For full-year 2020, the COVID-19 pandemic and the national lockdown reduced
                                                                                             6       annual electricity demand by 3%
                                                                                             4
100
                                                                                             2
  50                                                                                         0
                                                                                      -3%    -2
   0                                                                                         -4
          2012      2013      2014      2015        2016    2017       2018   2019    2020

Electricity Consumption Classified by Sector

  10
                                                                                0%
    0                                                                                                The Business sector saw the most drastic decline since the start of 2020 due to
                                                                                       Industrial
                                                                                                     COVID-19 and generated the lowest consumption compared to industrial and
                                                                               -4%     Residential
 -10                                                                                                 residential sector
                                                                                       Business
 -20                                                                           -15%
    2014        2015       2016       2017          2018        2019   2020 3M2021
Source: Deloitte analysis based on EPPO and Krungsri Research

© 2021 Deloitte Touche Tohmatsu Jaiyos Co., Ltd.                                                                                                       Economic Business Review | 1H 2021   49
Oil & Gas

© 2021 Deloitte Touche Tohmatsu Jaiyos Co., Ltd.   Economic Business Review | 1H 2021   50
Consumption of petroleum products dropped by 12% in 2020, especially Jet fuel due to
airline services slowdown.

Consumption of petroleum products
Unit: %

50,722 million litres in 2020                                                                           2018     2019            2020

                                   Fuel oil
                        Jet Fuel                                10
                                                                                           4        3   4        4                      5                   4
                                          3%                          3    2         1
                                5%                                                                                                          1
                                                                 0
                                                                                               -3           -1       -1
                                                                -10
          LPG                                                                  -12                                                                              -10 -11
                                                                                                                           -12
                  21%                                           -20
                                                   47% Diesel
                                                                -30

                                                                -40

                                                                -50

                            23%                                 -60
                                                                                                                                                -62
                  Gasoline                                      -70
                                                                          Total          Diesel     Gasoline         LPG                Jet Fuel             Fuel oil

Source: Deloitte analysis based on EPPO

© 2021 Deloitte Touche Tohmatsu Jaiyos Co., Ltd.                                                                                  Economic Business Review | 1H 2021      51
PTTEP is the largest E&P company in Thailand, while Thai Oil maintained its position as the leading
domestic refinery.

Top E&P Companies by Production Volume, 2019                            Top Petroleum Refining Companies by Refining Output, 2019
Unit: %                                                                 Unit: %

                                          Others                                                     BSP
                                              10%                                                      12%
                         Total sa
                                    7%
                                                                                                                              30%
                                                                PTTEP
                                                          37%                                 12%
                petronas 9%

                              9%                                                              13%
                   Moeco                                                               SPRC

                                                                                                                          18%
                                                                                                        15%                   Pttgc
                                                    28%
                                                                                                     IRPC

Source: Deloitte analysis based on EMIS

© 2021 Deloitte Touche Tohmatsu Jaiyos Co., Ltd.                                                                        Economic Business Review | 1H 2021   52
Chemicals

© 2021 Deloitte Touche Tohmatsu Jaiyos Co., Ltd.   Economic Business Review | 1H 2021   53
Players in Chemicals will be exposed to several risks and challenges in the upcoming 2020-2022 period
that could rein in on growth in the Thai petrochemicals industry

Risks                                                                          Challenges
• US-China trade tension
                                                                                                   1. New technology and Circular Economy
• Fluctuations in oil prices
                                                                                                       — The use of new technology to add value to their
• Plans to increase production capacity for some petrochemical products,                                 processes, especially in packaging, automobiles and
  especially PX and Benzene, largely in China, Vietnam, and the Middle East.                             electronics in response to the emergence of the circular
    — This would cap prices of these products despite stronger demand                                    economy.
    — Thai producers will see weaker demand for their goods.                                           — Demand to shift from commodity-grade goods to a
                                                                                                         greater need for specialty products and the
                                                                                 Internal
                                                                                                         petrochemical industry would be forced to change.
                                                                                 factors
                                                                                                       — Deloitte estimates that although over the next 15 years
                                                                                                         (from 2018), the global market for petrochemicals will
                                                                                                         grow by about 3% per year, demand for specialty
                                                                                                         petrochemical products will expand by 4.5%
                                                                                                   2. Self-sufficiency plan in major export destinations

                                                                                 Shift from supply-driven consumption to demand-driven
                                                                                 production.

                                                                                        Before—Ability to source inputs and control costs
                                                                                        After—Ability to produce a wide variety of products to                    External
                                                                                        meet market needs, to build relationships with                             factors
                                                                                        businesses in other sectors, and to develop and exploit
                                                                                        new technologies and processes.
Source: Deloitte analysis based on Krungsri Research

© 2021 Deloitte Touche Tohmatsu Jaiyos Co., Ltd.                                                                                    Economic Business Review | 1H 2021       54
Life Sciences

© 2021 Deloitte Touche Tohmatsu Jaiyos Co., Ltd.   Economic Business Review | 1H 2021   55
Pharmaceutical Overview

• Increasing pharmaceutical sales are arising from the implementation of universal health insurance, and growing number of medicines distributed through hospital.
• Export values continue to rise due to expanding markets in ASEAN, especially Vietnam. However, import values dipped in 2019 due to strong THB relative to main import
  countries such as Germany, USA and India.
Pharmaceutical sales                                                                     Pharmaceutical Exports
Unit: THB million                                                                        Unit: THB billion
                                                                                                                                   +3%
                                 Prescription drug sales   OTC medicine sales                                                                       15,288               15,805
         121                                                                                   14,111           14,423           14,836
                                                                           117
                                                            112
                                                    107
                                 102

                                                                                               2018              2019             2020              2021F                 2022F
          98                                                                95
                                                            91                           Pharmaceutical Imports
                                  83                 86
                                                                                         Unit: THB billion
                                                                                                                                   +1%
                                                                                               76,256                                               73,095               78,246
                                                                                                                64,455           68,548

          23                      20                 20     21              22

        2018                    2019                2020   2021F          2022F                2018              2019             2020              2021F                 2022F
Source: Deloitte analysis based on Fitch Solution

© 2021 Deloitte Touche Tohmatsu Jaiyos Co., Ltd.                                                                                              Economic Business Review | 1H 2021   56
Thailand is the leading importer and exporter of medical devices (by value) in ASEAN with durable
medical devices accounting for most of the exports and single-use devices for most of the imports

ASEAN Top 5 Markets for Medical Devices                                                                          Thailand Export 10M2020
10M2020
                                                                                                                                           Reagent and test kit
Unit: THB million
                                                                                                                                                    2%
                                                                       Export       Import

  Singapore                                  57%                                       43%             575,479        Single-use device
                                                                                                                                          38%

                                                                                                                                                          60%
    Thailand                                  70%                                30%         483,869                                                              Durable medical device

    Malaysia                             73%                           27%      372,451
                                                                                                                 Thailand Import 10M2020
   Indonesia              50%           50%        176,624
                                                                                                                             Reagent and test kit
                                                                                                                                                10%
 Philippines            77%        78,827
                              23%
                                                                                                                                                           48% Single-use device
       Brunei      99% 6,219
                                                                                                                                          42%
                       1%                                                                                        Durable medical device

Source: Deloitte analysis based on Medical Device Intelligence Unit (MeDIU)

© 2021 Deloitte Touche Tohmatsu Jaiyos Co., Ltd.                                                                                                         Economic Business Review | 1H 2021   57
Thailand consists mostly of small manufacturers. However, large manufactures receive the greatest
proportion of revenues

Medical Device Manufacturers

Number by size (2020)                                          Revenue of manufacturer of medical instruments and supplies (except dental instruments and supplies) in 2019
                                                               Unit: THB mn
         Medium Large
                                                                               Hoya Lens Thailand Ltd                                                                              21,257
                   6%
                     4%                                                               Nipro (Thailand)                                7,450
                                                                                Asahi Intecc (Thailand)                  4,712
                                                                     Kawasumi Laboratories (Thailand)            2,612
                         91%                                             GE Medical System (Thailand)           2,222
                            Small

 Revenue by size (2018)                                        Revenue of manufacturer of dental instruments and supplies in 2019
                                                               Unit: THB mn
                              Small
                                                                                    M.E.Nikkiso Co.Ltd                                                     1,015
                          15%
                                                                                   Hexa Cream Co.Ltd                                432
                               14% Medium
                                                                                     Siamdent Co.,Ltd                         349
              71%                                                      P C Dental Lab Company Limited                   272
      Large                                                        Sainamtip Dental Laboratory Co.,Ltd           177

Source: Deloitte analysis based on BOL and Krungsri Research

© 2021 Deloitte Touche Tohmatsu Jaiyos Co., Ltd.                                                                                                            Economic Business Review | 1H 2021   58
Healthcare

© 2021 Deloitte Touche Tohmatsu Jaiyos Co., Ltd.   Economic Business Review | 1H 2021   59
The government's further commitment to the development and improvement of the healthcare system
is expected to contribute to the government continuous expenditure growth

Healthcare Expenditure Trends

Historical Data                                                                             Forecast Data
Unit: THB million
                                                                                                                       +7%                                  890
                                                                                                                                     827
                                                                                                                       770                                  171
                                                                                                                718                  162
                                                   +2%                                         672                     153
                                                                       627                                      146
             594                      579                    597
                                                                                               139
                                                                       131
             117                      121                    126

                                                                                                                                                            719
                                                                                                                       616           665
                                                                                               533              573
             477                      457                    471       496

             2016                    2017                    2018     2019                    2020f            2021f   2022f        2023f                  2024f

                                                                    Private health spend   Government health spend

Source: Deloitte analysis based on WHO and Fitch Solutions

© 2021 Deloitte Touche Tohmatsu Jaiyos Co., Ltd.                                                                               Economic Business Review | 1H 2021   60
Total revenue of the Healthcare sector is expected to decrease solely because of significantly lower
revenue from non-Thai patients due to the Covid-19 pandemic

Revenue breakdown by nation                                                      Revenue breakdown by patient type
Unit: THB million                                                                Unit: THB million

             19,521                                                                            19,521

                                          16,719   16,593                                                            16,719                 16,593

                                                                                               9,175
             13,665                                                                                                  8,192                   8,131         OPD

                                          13,877   13,772    Thai patients

                                                                                               10,346
                                                                                                                     8,527                   8,462         IPD
             5,856
                                          2,842     2,821    Non-Thai patients

            Q42019                       Q32020    Q42020F                                    Q42019                 Q32020                Q42020F

Source: Deloitte analysis based on KGI research

© 2021 Deloitte Touche Tohmatsu Jaiyos Co., Ltd.                                                                              Economic Business Review | 1H 2021   61
Wholesale, Retail and
Distribution

© 2021 Deloitte Touche Tohmatsu Jaiyos Co., Ltd.   Economic Business Review | 1H 2021   62
Wholesale and retail trade value increased by 6% CAGR. However, in 2020 the value decreased by 7%
due to economic slow down

Wholesale & Retail Trade Value
Unit: THB trillion

                                                                 +6%                 2.8
                                                                              2.6                              2.6
                                                                       2.4
                                                          2.2
                                                   2.0
                                           1.8
             1.7

            2013                           2014    2015   2016         2017   2018   2019P                    2020P

Source: Deloitte analysis based on NESDC

© 2021 Deloitte Touche Tohmatsu Jaiyos Co., Ltd.                                      Economic Business Review | 1H 2021   63
Due to the global COVID-19 pandemic in 2020, the modern trade industry experienced a historic
contraction in sales, falling by 10.0-12.0%

Retail business growth by type of store
Unit: % YoY
                               Supermarkets            Department Stores    Convenience Stores       Discount Stores
18
                                                                                                                        Store type                2020E                2021-23F
16
                                                                                                                        Supermarkets           -10 to -12               2.8-4.7
14
                                                                                                                        Department Stores      -13 to -15               2.0-3.0
12
                                                                                                                        Convenience Stores      -9 to -10               1.7-2.8
10
                                                                                                                        Discount Stores        -10 to -12               1.3-2.3
  8
                                                                                                 6.5%
  6
                                                                                                 4.5%
                                                                                                              4.0%
  4                                                                                              3.4%
                                                                                                                 3.5%
                                                                                                                 2.9%
  2                                                                                              3.0%         2.7%

  0
   2012               2013               2014           2015         2016        2017            2018E       2019P

Source: Deloitte analysis based on Krungsri research

© 2021 Deloitte Touche Tohmatsu Jaiyos Co., Ltd.                                                                                             Economic Business Review | 1H 2021   64
Traditional grocery retailers remain the biggest players in Thai grocery retailing subsector, accounting
for approximately half of the total subsector sales in 2019. However, modern retail has a gradual
market share increase
Grocery Market Share by Value (2019)                                             Grocery Sale Growth (2019)
                                                                                                                                        8.0%

                         Supermarket

                                      9.5%
      Cash and Carry                                                                                                                                          4.6%
                          9.9%
                                                                                                        3.2%

                                                           Traditional Grocery         1.4%
 Hypermarket 12.2%                                 50.3%
                                                           Retailers

                               18.1%                                                                                  -1.3%
         Convenience Store                                                          Traditional      Convenience   Hypermarket    Cash and Carry          Supermarket
                                                                                 Grocery Retailers      Store

Source: Deloitte analysis based on EMIS

© 2021 Deloitte Touche Tohmatsu Jaiyos Co., Ltd.                                                                                 Economic Business Review | 1H 2021   65
The Secret Sauce of
                                                                                                                  Driving Successful
                                                                                                                  Digital Transformation

                                                                                                           Industry Sector
                                                                                                           Update

                                                                           Topical Views from our expert
                                                                           in Restructuring/Turnaround

                                                   Economic Outlook 2021

© 2021 Deloitte Touche Tohmatsu Jaiyos Co., Ltd.                                                                             Economic Business Review | 1H 2021   66
The Secret Sauce of
Driving Successful Digital
Transformation
The roles and characteristics of Chief Digital Officer
(CDO) and how CDO can help orchestrate the digital
transformation journey

As information technology has dramatically reshaped all industries, many
companies are pursuing and driving the digital transformation initiatives, in
an effort to capture the benefits of these trends or simply catch up their
peers. Yet, success in these transformations
is not guaranteed, and in fact, facing a highly challenging as being
observed from Deloitte’s Thailand Digital Transformation survey.

© 2021 Deloitte Touche Tohmatsu Jaiyos Co., Ltd.                                Economic Business Review | 1H 2021   67
The Secret Sauce of Driving Successful Digital Transformation
The roles and characteristics of Chief Digital Officer (CDO) and how CDO can help orchestrate the
digital transformation journey

                                     THE CDO ENHANCES THE REST OF THE C-SUITE
                                                                                                                              • To make digital industrial
                                                                                                                                transformation a reality, a company
                                                                   CEO                                                          needs both a nerve center and a
                    CFO                              Be the catalysts for the                                                   dedicated digital function.
                                                 transformation and innovation
  Drive better outcomes to the
                                                       agenda of the CEO.
                                                                                                             CMO
                                                                                                                              • Creating an operational structure with
   bottom line. With the right                                                                                                  digital leader is key to drive the
                                                                                                Support the shift from
 mandate and direction, digital
  becomes an enabler to save
                                                                                              transactional marketing to        transformation successfully.
                                                                                                engagement served up
 money and drive new revenue.
 Either way, gross margins can
                                                                                                through social, mobile,       • The organization would need to appoint
                                                                                                search and wearables.           so-called a chief digital officer (CDO), a
               rise.
                                                                                                                                senior leader responsible for the
                                                                                                                                organization’s long-term digital vision and
                                                                                                                                the subsequent execution of the
                                                             The CDO                                                            transformation efforts.
                                                               can:

                                                                                                           CIO
                                                                                                                              • CDO think holistically about how a
                    CSO                                                                                                         company’s strategy is executed across all
                                                                                            Build a complementary team of
Support the strategic direction of
                                                                                                                                digital channels. They own and drive
                                                                                             technical resources with new
the organization by creating new                                                            skills, new outputs and time to     digital strategy throughout the
   opportunities to enter new                                                                 value.CDO = front end;CIO =       organization to help business unit leaders
markets, drive new opportunities                                    COO                                 back end
 and change the direction of the
                                                                                                                                unlock value.
            company.
                                                 Enable operational efficiencies in the
                                                 organization. This includes digitizing
                                              internal operations as well as creating end
                                               user tools that can lessen the burden on
                                                      contract centre resources.
Core leaderships skills for CDO
Many required core leadership skills remain the same whether it is a business or digital leader, there are some demands
of digital disruption call for certain new skills.

                                                                • Transformative vision and forward-
                                                                  looking perspective—the most important
                                  Transformative Vision &         skill which includes the ability to anticipate
                                  Forward-looking perspective     markets and trends, make savvy business
                                                                  decisions and solve tough problems in
                                                                  turbulent times.
                                                                • Digital literacy—a must-have skill, the
                                                                  leader needs to have general digital
                                                                  literacy, as opposed to hard-core technical
                                                                  skills. It is often much easier and more
                                                                  effective to equip the business leaders
                        CDO                                       become digitally literate than it is to teach
                     Leadership
                                                                  technologists the strategic and business
                        Skills
                                                                  knowledge.
                                                                • Adaptability—as the pace of change in
                                                                  digital world, a leader must also be change
                                                                  oriented—that is open-minded, adaptable,
                                                                  and innovative.
     Adaptability                             Digital
                                              Literacy
Chief Digital Officer Archetypes
Digital Leaders are categorized into one of the four archetypes, with each driving distinct strategic objectives

                The                     The innovative              The market-minded                        The technology          • The Disrupter—focus on transforming existing
            disrupter                     integrator                       maven                               integrator              business models and ways of working who
                                                                                                                                       typically reporting to the CEO
                                                                                                                                     • The innovative integrator—integrates customer
                                                                                                                                       sensing and insights with operational capability
 ARCHETYPE DESCRIPTION           ARCHETYPE DESCRIPTION            ARCHETYPE DESCRIPTION               ARCHETYPE DESCRIPTION
                                                                                                                                       improvements. Primarily focus on the highest-
 CDO has mandate to transform    CDO integrates customer          CDO drives new digital              CDO is technology- centric
 existing business models and    sensing and insights with        solutions for customer-             and uses digital innovation      priority innovations and may lack of full control
 ways of working                 operational capability           facing channels and                 to accelerate change             over all digital execution.
                                 improvements                     routes to market
 REPORTING INTO
                                                                  REPORTING
                                                                                                      REPORTING INTO                 • The market-minded maven—drives digital
                                 REPORTING INTO                                                                                        initiatives for customer-facing channels and
 CEO                                                              INTO CMO/CRO                        CIO/CTO
                                 CEO                              PROS                                                                 routes to market. Focus on customer growth and
 PROS                                                                                                 PROS
 • High decision efficiency
                                 PROS                             • Digital initiatives prioritized
                                                                                                      • Stable demands and work
                                                                                                                                       customer experience, downsides may be
                                                                    on customer and growth
 • Very agile and responsive     • Focused on highest-
                                                                    impact                              plans increase development     disconnected from other ‘non’ front-end business
   to customer demands             priority innovations                                                 efficiency                       units.
                                                                  • Accountability for end-
                                 • Able to respond with agility                                       • Focus on single outcomes
                                                                    to-end ustomer
                                   to customer need
                                                                    experience                          can result in optimized      • The technology integrator—technology- centric
                                                                                                        operations                     and uses digital innovation to accelerate change in
                                                                  CONS
                                                                                                      CONS                             the organization. Usually report to CIO or CTO
                                                                  • Removed from CEO, which
 CONS                            CONS
                                                                    could restrict large              • Less adaptable to changing     with single-outcome initiatives and highly stable
 • Too many changes at once      • May not have full control        investments                         business needs                 workplans, might be limit perspective and not
   may overwhelm the               over all digital execution                                         • Key components of business
                                                                  • Disconnected from business
                                                                                                        strategy may be overlooked
                                                                                                                                       quick enough to adapt to the changing business
   organization                    (e.g., product RandD)            units, which may limit
 • Accountability falls all on                                      adoption
                                                                                                                                       needs.
   the CDO
Digital Function
The key elements that will help CDOs achieving their vision and goals delivery of
transformation initiatives across the company.

       Digital strategy
                                                                                                                     • Digital strategy—acts as a digital North star to help better communicate
        Establishes a well-defined digital strategy and policies that align with the broader business                   and guide all digital initiatives across the enterprise. Organization should
        priorities, and develops a prioritized road map for digital transformation efforts
                                                                                                                       seek inputs from various stakeholders (customers, partners,
                                                                                                                       shareholders, communities), prioritize and schedule the plan and finally
       Digital investment
                                                                                                                       get validated.
        Develops the funding governance mechanism for transformation efforts, drives alignment of investments
        to the strategy, and attains cross-functional buy-in on the road map                                         • Digital investment—CDO should oversee the investment
                                                                                                                       governance model to help creating influence across the
       Digital operations                                                                                              organization.
        Drives accountability across the organization through scorecards and business capability maps; facilitates   • Digital operations—served as a backbone of all digital activities. It must
        alignment and execution of road map across business and technical teams
                                                                                                                       be clearly lay out governance, accountability and metrics to consistently
                                                                                                                       monitor digital initiatives’ efficiency and execution.
       Customer-centricity
        Implements structured mechanism to aggregate customer feedback and develops customer-sensing capabilities    • Digitalization of customer journey—may begin with the
        that use insights to deliver solutions that respond to customer needs                                          development of a sense-and-respond capability to gather customer
                                                                                                                       information and leverage feedback to take action to deliver business
       Digital DNA                                                                                                     capability improvements.
        Embeds an adaptive and responsive culture across the business to strengthen the adoption of digital          • Digital DNA—which is centered around embedded a digital-first
        mindset, especially a product-centric mindset and agile ways of working
                                                                                                                       mindset and ways of working into an organization. It can serve as a
                                                                                                                       blueprint for bringing a digital transformation to life, to help companies
                                                                                                                       to organize, operate and behave in digital ways.
Digital Operations
Three primary operating models are used during digital transformations

                                                                           Key
                                                                                                                                                        • The decentralized model—for well-communicated and
                                                           Level of digital function control
                                                                                                                                                          relatively high maturity of digital literacy in an openness
                                                High                                               Low
                                                                                                                                                          and trusted environment. CDO team acts as a center of
                                                                                                                                                          excellence that shares knowledge and enables delivery
                                                                                                                                                          teams.
                                                                                                                                                        • Federated model—for organizations that executives in
                       Digital                                          Digital                                               Digital                     other units are mandated to deliver sustainable
                     Function                                         Function                                              Function
                                                                                                                                                          operational change plus the initiatives that affect and
                                                                                                                                                          require multiple or cross-functional collaboration team for
                                                                                                                                                          success. In this model, digital team member is embedded
  Function 1       Function 2      Function 3    Function 1         Function 2        Function 3         Function 1       Function 2       Function 3     within the business unit’s delivery teams.
     Decentralized                                                                                                                          Unified      • Unified model—for organizations that has relatively low
                                                                                                                                                          levels of digital capability maturity or the digital strategy is
           The decentralized model                           The federated model                                      The unified model                    focused on specific and limited scope in less complex
                                                                                                                                                          organizational structure. The CDO team will owns end-to-
                                                                                                                                                          end execution teams for all initiatives.
         Digital function acts as a center of            Digital function collaborates with                  Digital function establishes strategy
       excellence that shares knowledge and            functions to create strategic direction                and evaluates all digital initiatives
               enables delivery teams
                                                   A digital team member is embedded                            The digital function owns end-
                                                   within the delivery teams to drive end-                   to-end execution teams
                                                       to-end execution of initiatives                            for all digital initiatives

Source: Deloitte analysis.
Contributors

Narain Chutijirawong, Ph.D.                        Malee Ekviriyakit           Chananya Bunyalug
Director                                           Consultant                  Analyst
Clients and Industries                             Clients and Industries      Clients and Industries
nchutijirawong@deloitte.com                        mekviriyakit@deloitte.com   cbunyalug@deloitte.com

© 2021 Deloitte Touche Tohmatsu Jaiyos Co., Ltd.                                                        Economic Business Review | 1H 2021   73
Deloitte refers to one or more of Deloitte Touche Tohmatsu Limited (“DTTL”), its global network of member firms, and their related entities. DTTL (also
referred to as “Deloitte Global”) and each of its member firms and their affiliated entities are legally separate and independent entities. DTTL does not
provide services to clients. Please see www.deloitte.com/about to learn more.

Deloitte is a leading global provider of audit and assurance, consulting, financial advisory, risk advisory, tax & legal and related services. Our global
network of member firms and related entities in more than 150 countries and territories (collectively, the “Deloitte organisation”) serves four out of five
Fortune Global 500® companies. Learn how Deloitte’s approximately 312,000 people make an impact that matters at www.deloitte.com.

Deloitte Asia Pacific Limited is a company limited by guarantee and a member firm of DTTL. Members of Deloitte Asia Pacific Limited and their related
entities, each of which are separate and independent legal entities, provide services from more than 100 cities across the region, including Auckland,
Bangkok, Beijing, Hanoi, Ho Chi Minh City, Hong Kong, Jakarta, Kuala Lumpur, Manila, Melbourne, Osaka, Shanghai, Singapore, Sydney, Taipei, Tokyo
and Yangon.

About Deloitte Thailand
In Thailand, services are provided by Deloitte Touche Tohmatsu Jaiyos Co., Ltd. and its subsidiaries and affiliates.

This communication contains general information only, and none of Deloitte Touche Tohmatsu Limited, its member firms, or their related entities
(collectively, the “Deloitte Network”) is, by means of this communication, rendering professional advice or services. Before making any decision or
taking any action that may affect your finances or your business, you should consult a qualified professional adviser. No entity in the Deloitte Network
shall be responsible for any loss whatsoever sustained by any person who relies on this communication.

© 2021 Deloitte Touche Tohmatsu Jaiyos Co., Ltd.
You can also read