COVID-19: Channels of transmission
to food and agriculture
←
→
Page content transcription
If your browser does not render page correctly, please read the page content below
COVID-19: Channels of transmission to food and agriculture
COVID-19: Channels of transmission to
food and agriculture
      Josef Schmidhuber, Jonathan Pound and Bing Qiao
     Trade and Market Division Economic and Social Development Department

       Food and Agriculture Organization of the United Nations
                                Rome, 2020
Required citation: J. Schmidhuber, J. Pound, B. Qiao. 2020. COVID-19: Channels of transmission to food and agriculture. Rome, FAO. https://doi.org/10.4060/ca8430en The designations employed and the presentation of material in this information product do not imply the expression of any opinion whatsoever on the part of the Food and Agriculture Organization of the United Nations (FAO) concerning the legal or development status of any country, territory, city or area or of its authorities, or concerning the delimitation of its frontiers or boundaries. The mention of specific companies or products of manufacturers, whether or not these have been patented, does not imply that these have been endorsed or recommended by FAO in preference to others of a similar nature that are not mentioned. The views expressed in this information product are those of the author(s) and do not necessarily reflect the views or policies of FAO. ISBN 978-92-5-132354-0 © FAO, 2020 Some rights reserved. This work is made available under the Creative Commons Attribution-NonCommercial-ShareAlike 3.0 IGO licence (CC BY-NC-SA 3.0 IGO; https://creativecommons.org/licenses/by-nc-sa/3.0/igo/legalcode). Under the terms of this licence, this work may be copied, redistributed and adapted for non-commercial purposes, provided that the work is appropriately cited. In any use of this work, there should be no suggestion that FAO endorses any specific organization, products or services. The use of the FAO logo is not permitted. If the work is adapted, then it must be licensed under the same or equivalent Creative Commons licence. If a translation of this work is created, it must include the following disclaimer along with the required citation: “This translation was not created by the Food and Agri- culture Organization of the United Nations (FAO). FAO is not responsible for the content or accuracy of this translation. The original [Language] edition shall be the authoritative edition.” Disputes arising under the licence that cannot be settled amicably will be resolved by mediation and arbitration as de- scribed in Article 8 of the licence except as otherwise provided herein. The applicable mediation rules will be the media- tion rules of the World Intellectual Property Organization http://www.wipo.int/amc/en/mediation/rules and any arbitration will be conducted in accordance with the Arbitration Rules of the United Nations Commission on International Trade Law (UNCITRAL). Third-party materials. Users wishing to reuse material from this work that is attributed to a third party, such as tables, figures or images, are responsible for determining whether permission is needed for that reuse and for obtaining permis- sion from the copyright holder. The risk of claims resulting from infringement of any third-party-owned component in the work rests solely with the user. Sales, rights and licensing. FAO information products are available on the FAO website (www.fao.org/publications) and can be purchased through publications-sales@fao.org. Requests for commercial use should be submitted via: www. fao.org/contact-us/licence-request. Queries regarding rights and licensing should be submitted to: copyright@fao.org.
COVID-19: Channels of transmission to food and agriculture

ABOUT THIS PAPER
FAO is analysing and providing updates on the emerging COVID-19 pandemic’s effects on
agricultural markets—effects that are still largely unknown. Most current assessments generally
foresee a contraction in both supply of and demand for agricultural products, and point to
possible disruptions in trade and logistics.
On the supply side, widely different views remain on the duration of the shocks, the price
dynamics, differential impacts between domestic and international markets, differences across
countries and commodities, the likely paths of recovery, and the policy actions to remedy the
various shock waves.
On the demand side, there is near ubiquitous agreement that agricultural demand and trade
would slow-down, with contractions stemming from a deceleration in overall economic activity
(GDP growth) and rising rates of unemployment. While food and agricultural systems are
exposed to both demand and supply side shocks (symmetric), these shocks are not expected to
take place in parallel (asynchronous) since, inter alia, consumers can draw on savings, food
stocks and safety nets.
This paper makes no attempt to produce an impact assessment of the COVID-19-
induced outbreak. Instead, it aims to identify the channels of transmissions into the food and
agriculture sectors and, based on this, to delineate the degrees of exposure to the COVID-19-
induced shock by geographic region. The initial aim was to examine all elements of the food
system. However, data availability limited the empirical analysis largely to primary
production, trade and final consumption. These elements are analyzed in detail and, where
possible, quantified. Based on results of the analysis, a country taxonomy of the exposure is
developed and presented.
The identification of the primary channels of transmission and a classification of countries based
on exposure to the effects of the COVID-19-induced pandemic could help assist countries and
international organizations in formulating remedial interventions.

                                          Page 5 of 44
COVID-19: Channels of transmission to food and agriculture
EXECUTIVE SUMMARY
The COVID-19-induced pandemic affects the entire food system. It exerts a symmetric, but
asynchronous shock on global and national food systems. Its impacts will affect both supply and
demand channels, but they will be felt at different points in time. They will affect all elements of
the food system, from primary supply, to processing, to trade as well as national and international
logistics systems, to intermediate and final demand. It also affects factor markets, namely labour
and capital, and intermediate inputs of production. The channels of transmission into food and
agricultural demand include numerous macroeconomic factors, notably swings in exchange rates,
in energy and credit markets, and, most importantly, the expected surge in unemployment and
the contractions in overall economic activity.
We have assessed the exposure of countries to a selected number of these channels of
transmission. We quantify the impacts of agricultural factor markets, trade and final demand. We
present more qualitatively the effects of credit markets, energy markets or possible disruptions
in the supply chains and the various choke points therein.
The composition of the factors of production for primary agriculture differs along the stages of
development and of course the type of output. In general, agriculture in high-income countries
is a capital-intensive industry, exposed to possible disruptions of supplies of intermediate inputs
in the short term and fixed capital items in the longer term. The same holds for some agricultural
systems in low-income countries, but their exposure to a pandemic shock can differ markedly.
For instance, production of row crops is capital-intensive and labour-saving in both North and
South America. Both systems are, however, exposed to different debt/equity shares and
differential impacts from credit markets. Current evidence suggests that capital-intensive row
crop producers in North America are likely to benefit from lower interest rates, while their
counterparts in South America could suffer from higher interest rates and clogged credit markets.
At the same time, North American producers have seen a noticeable appreciation of their
currency, which may offset the gains in credit markets, potentially even overcompensating them.
Lack of inputs affects a growing number of farmers around the world. Low supplies of pesticides
for instance is already affecting crop protection efforts in countries affected at an early stage and
will likely reduce yields later in the year. A lack of pesticides is also hampering efforts to contain
pest outbreaks, including the current locust outbreak in East Africa.
With 80 percent of countries, accounting for 92 percent of global GDP2, under social distancing
provisions, labour availability for agricultural supply chains has become a near ubiquitous
problem. In general, low-income countries employ higher shares of labour for primary
production, which makes them more exposed to direct disruptions in labour supply, including the
farmer’s own labour force. The same holds for labour-intensive production more generally.
Various examples illustrate that fruit and vegetable as well as meat or dairy production have
already been adversely affected by COVID-induced labour shortages3. Such deficits can be caused
by domestic labour supply disruptions, as well as by shortages of seasonal and migrant workers.
In addition, also macroeconomic channels of transmission affect agricultural supply, trade and
final demand. The precipitous fall in oil and metal prices, for instance, exerted downward
pressure on the exchange rates of many commodity exporting countries (“commodity
currencies”). While the downward pressure on exchange rates, triggered by price declines in non-
food commodities, affects all tradeable commodities, including food. It makes food supplies
2 As at end March 2020, see e.g. https://www.cnbc.com/2020/03/30/coronavirus-goldman-says-pandemic-will-permanently-alter-
oil-markets.html
3 The same holds for global fisheries. The sector is not analyzed in detail in this paper, largely reflecting a lack of the necessary data.
Page 6 of 44COVID-19: Channels of transmission to food and agriculture
internationally more competitive, at least in the short term, and supports exports of food. In
response to these changes, some commodity exporters have started to impose export restrictions
on food and agricultural products to avoid compromising domestic supplies.
Sporadic export restrictions notwithstanding, the current supply-demand situation is markedly
different from the situation at the start of the last global food crisis in 2007–08. Overall, carry-
over stocks are high, the prospects for the next crop are good and, instead of an expansion of
demand through a burgeoning biofuels sector, demand is likely to contract; food demand is likely
to stagnate or even decline given the expected contraction in global GDP, while demand in the
non-food sector is likely to be capped in view of the sharply lower prices for fossil energy. Possible
logistical bottlenecks notwithstanding, these factors would not support an outlook of a looming
global food security crisis arising from supply shortages. The extent of a possible demand
contraction is still unclear. In the case of a substantial global GDP contraction, the data presented
in this document suggest that low-income countries may find themselves not in a price-induced
food security crisis, but an income-induced one.
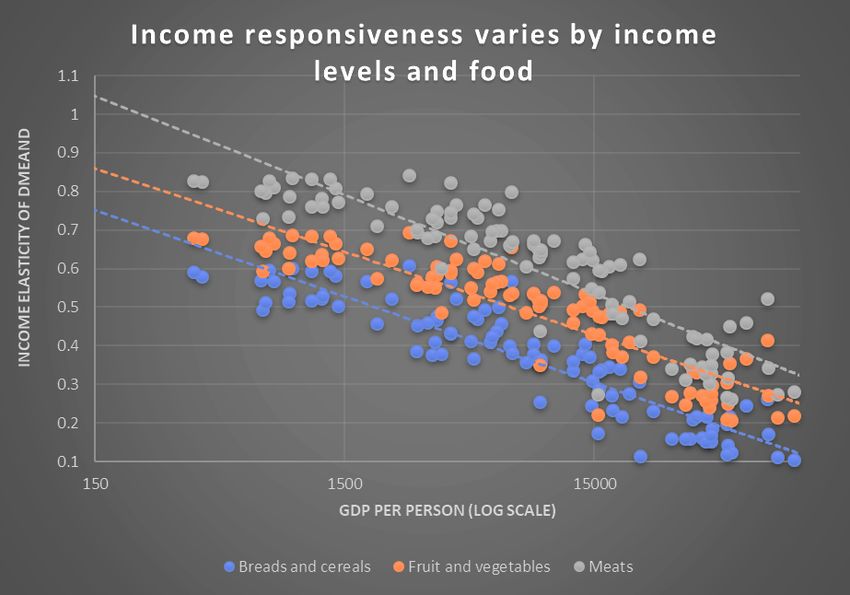
Finally, and arguably most importantly, COVID-19 will exert a shock on final food demand by
lowering overall purchasing power, especially for an increasing number of unemployed people.
The extent of the impacts on food demand will depend on numerous factors, including the depth
and length of the macroeconomic shock, the availability of savings and access to credit and safety-
net mechanisms. These factors determine the responsiveness of demand, which is used to gauge
the differences in reactions across countries and food commodity groups. While neither the final
income nor the final price impacts are clear at this early stage, the availability of food staples and
the greater exposure of labour intensive foods such as vegetables and dairy products to adverse
effects emanating from this pandemic, suggests a deterioration in the quality of the diet rather
than increases in calorie deficits.
Page 7 of 44COVID-19: Channels of transmission to food and agriculture
TABLE OF CONTENTS
About this paper ............................................................................................................................... 5
Executive summary........................................................................................................................... 6
Channels of transmission ............................................................................................................... 10
Overview ................................................................................................................................. 10
Agricultural supply .......................................................................................................................... 10
Factor intensity of production as channel of transmission ................................................... 11
Capital intensity of agricultural production ........................................................................... 11
Labour intensity of agricultural production ........................................................................... 13
Exchange rates as a channel of transmission ............................................................................ 15
Energy markets as a channel of transmission............................................................................ 17
High concentration in global fertilizer trade.......................................................................... 18
Credit markets as a channel of transmission ............................................................................. 19
Trade as a channel of transmission ................................................................................................ 21
Agricultural exports .................................................................................................................... 21
Agricultural imports .................................................................................................................... 22
Agricultural demand and macroeconomic channels of transmission ........................................... 24
Impact on food consumption ..................................................................................................... 26
Differential impacts across countries and commodities ....................................................... 26
Possible time lags in the demand shock ................................................................................ 27
Exposure to COVID-19 – a taxonomy of countries ........................................................................ 28
A regional overview of supply side exposures ........................................................................... 28
A regional overview of demand side exposures ........................................................................ 29
Annex .............................................................................................................................................. 32
Exposure to supply and demand shocks: A country taxonomy................................................. 32
Page 8 of 44COVID-19: Channels of transmission to food and agriculture
List of figures
Figure 1: The basic channels of transmission ................................................................................ 10
Figure 2: Intermediate inputs across countries ............................................................................. 12
Figure 3: Fixed costs of production across countries .................................................................... 13
Figure 4: Labour intensity across countries ................................................................................... 14
Figure 5: Net trade in agriculture and energy, data based on UN Comtrade ............................... 17
Figure 6: Fertiliser and natural gas prices, ..................................................................................... 18
Figure 7: Dependency on agricultural exports............................................................................... 21
Figure 8 Dependency on agricultural exports, top 30 exporters .................................................. 22
Figure 9: Dependency on agricultural imports .............................................................................. 23
Figure 10: Dependency on agricultural imports, top 30 importers .............................................. 24
Figure 11: Income elasticities by product group and income level .............................................. 26
Figure 12: Food expenditure shares by income level .................................................................... 27
Figure 13: Overall supply exposure ................................................................................................ 28
Figure 14: Overall demand exposure ............................................................................................. 29
Figure 15: Share of intermediate inputs in gross output .............................................................. 38
Figure 16: Consumption of fixed capital per agricultural employee ............................................. 39
Figure 17: Gross Output per agricultural employee ...................................................................... 40
Figure 18: Kazakhstan’s exports of merchandise trade, HS2 ........................................................ 41
Figure 19: Changes in exchange rates against the US Dollar, January 2020 – mid March 2020. . 42
List of tables
Table 1: Energy and metal prices since January 2020 ................................................................... 15
Table 2: Concentration ratios of fertilizer exports......................................................................... 19
Page 9 of 44COVID-19: Channels of transmission to food and agriculture
CHANNELS OF TRANSMISSION
Overview
The COVID-19 pandemic affects the entire food system. It exerts a symmetric, but asynchronous
shock on the global food system. It will affect all elements of the food system, from primary
supply, to processing, to trade as well as national and international logistics systems, to
intermediate and final demand. It also affects factor markets, namely labour and capital inputs of
production. The channels of transmission to food and agricultural demand include numerous
macroeconomic factors, notably swings in exchange rates and energy and credit markets, and,
most importantly, the expected surge in unemployment and the contractions in overall economic
activity.
This paper focuses only on the main channels of transmission described above. The analysis starts
with agricultural supply, covers imports and exports and eventually looks at demand for food and
agricultural products. It also examines the effects of energy and credit markets, as well as changes
in exchange rates, all of which can affect supply, demand and trade. Figure 1 illustrates the main
transmission channels and possible links between them.
Agricultural Trade
Imports Exports
Capital Intensity of
production
Food expenditures Intermediate inputs
Agricultural
markets Food
Food
national & Fixed capital
demand supply
international
Income elasticities on
demand Labour Intensity of
production
Other channels
Energy markets
Exchange rates
Credit markets
Figure 1: The basic channels of transmission
Page 10 of 44COVID-19: Channels of transmission to food and agriculture
AGRICULTURAL SUPPLY
Factor intensity of production as channel of transmission
Agriculture is an input-intensive industry. The intensity of use of each factor of production can
vary considerably across agricultural systems and expose farmers to changes in input costs. These
changes can be brought about by numerous factors, including disruptions in transportation
systems, clogged ports or roads, delays in customs clearance, but also a lack of credit, higher
interest rates and capital costs or swings in exchange rates, which can make inputs excessively
expensive. Typically, these supply-side shocks precede those on the demand side. The following
section highlights how countries depend on different levels of agricultural inputs and how
disruptions to input supply chains could affect agricultural production systems. To examine the
degrees of exposure we first present the dependency of countries to the three principal
categories of agricultural inputs, namely: (i) intermediate inputs; ii) fixed capital; and (iii) labour.
We start with an analysis of the capital intensity of agricultural production. The units of analysis
are individual countries and the sources of data are national accounts. An analysis based on
activity-specific data (crops and livestock) would be highly desirable for understanding specific
supply chains, such data are, however, limited to very few countries.
Capital intensity of agricultural production
iate inputs
Intermediate inputs include fertiliser, pesticides, seeds, feeds and power. Disruptions in the
supply of these inputs are likely to result in reductions in outputs and, depending on the
importance of these inputs for specific outputs, in potentially large supply interruptions. We
assess the degree of the input dependency by examining the value share of intermediate inputs
in the gross value of agricultural output. The data depicted in Figure 2 suggest a strong correlation
between the share of inputs and the degree of overall development, captured by the level of GDP
per person. High-income countries generally use a larger quantity of intermediate inputs for their
agricultural production processes. This share can exceed 80 percent of the value of the output in
high-income countries but can remain below 10 percent in low-income countries. This means that
on average, low-income countries are less exposed to disruptions in intermediate input supplies,
as production is less reliant on their utilization. Conversely, high-income countries depend more
on intermediate inputs and are hence more susceptible to a disruption in the input supplies, as
potentially would be caused by a pandemic, such as COVID-19.
Grain and oilseeds production in the European Union, the United States of America or Canada,
for example, depend heavily on these intermediate inputs, notably energy, seeds, fertiliser and
pesticides. If COVID-19 were to disrupt the flow of these inputs either from local or international
suppliers to the farm level, this could result in an immediate decline in outputs. Developing
countries, by contrast, would be less exposed to these input supply shocks, in consideration of
the low utilization of such inputs. For instance, in Kenya, Tanzania, or Bhutan, the share of
intermediate inputs in the value of output is below 15 percent, and in The Gambia or Chad it is
lower than 10 percent (Figure 2).
COVID-19 has already had impacts on the availability of farm inputs, particularly in countries that
were affected at an early stage. In China, for instance, the production of pesticides declined
sharply and only resumes gradually after production plants were shut down following the
Page 11 of 44COVID-19: Channels of transmission to food and agriculture
outbreak4. Low availability and/or high prices of inputs such as pesticides could weigh on yields
and crop production in 2020.
A lack of pesticides is also having direct and indirect effects on countries’ ability to contain pests.
For instance, as transportation costs of pesticides to East Africa have increased by a factor of
three and shipping is delayed due to fewer flights to the region, this has hampered the ability to
contain the local locust outbreak and is heightening the threat to food security5.
Dependency on intermediate agricultural inputs is much higher
in HIC, 2015
Arab States, developing East Asia and the Pacific, developing Europe and Central Asia, developing
0.9 Latin America and the Caribbean, developing South Asia, developing Sub-Saharan Africa, developing
Share of intermediate inputs in total output
0.8 Developed countries
0.7 AUS
0.6
JPN USA
0.5 y = 0.2301ln(x) - RUS
BRA
0.4 TUR
CPR
NGAIDN
0.3
0.2 IND
0.1
0
USD 100 USD 1 000 USD 10 000 USD 100 000
GDP per person (log scale)
Source: Share of intermediate inputs in gross agricultural output and GDP per person are based on data from national acounts with authors calculations and imputations.
Figure 2: Intermediate inputs across countries
Dependency on fixed capital
Agricultural production depends not only on intermediate inputs, but also on fixed capital such
as “structures” and machinery. A disruption in the supply chain may not only affect the availability
of intermediate inputs, but also disrupt access to fixed factors of production, such as spare parts
for machines or replacements needed to maintain structures such as barns, stables or storage
facilities. Typically, these inputs would not cause an immediate reduction in production; however,
if the pandemic were to extend, the lack of spare parts or replacement investments could slow
growth in production over the medium term. At the very least, a shortage of these capital goods
may mean that farmers have to replace fixed capital (machinery) with labour, which would, other
things being equal, reduce the profitability of their operations.
The dependency of countries on fixed capital was measured by calculating the amount of fixed
capital used (“consumed”) in relation to the monetary value of gross output. Analogous to
intermediate inputs, a clear cross-country relationship is evident, with an increasing dependency
on fixed capital in tandem with rises in the overall level of development, measured by GDP per
capita (Figure 3). This is a very intuitive outcome. Particularly in countries with a GDP level of less
than USD 10 000 per person, the amount of annual fixed capital available per agricultural
employee is very low, typically below USD 1 000. By contrast, agricultural outputs in high-income
countries are substantially more dependent on fixed capital, with values often exceeding
USD 50 000 per employee per year (Figure 4). In conjunction with the high level of intermediate
inputs, this makes their agricultural sector also susceptible to shocks in supplies for inputs and
spare parts used for capital goods.
4 http://news.agropages.com/News/NewsDetail---34690-e.htm
5 https://www.bloomberg.com/news/articles/2020-03-22/coronavirus-slowing-desert-locust-response-in-east-africa
Page 12 of 44COVID-19: Channels of transmission to food and agriculture
Fixed costs per worker much higher in HIC, 2015
Arab States, developing East Asia and the Pacific, developing Europe and Central Asia, developing
Latin America and the Caribbean, developing South Asia, developing Sub-Saharan Africa, developing
Developed countries
100 000
Consumption of fixed capital per agricultural worker (USD)
AUS
USA
10 000
JPN
1 000 RUS
BRA
TUR
ln(y) = 1.7936ln(x) CPR
100
-4.3976 IND IDN
10
NGA
1
USD 100 USD 1 000 USD 10 000 USD 100 000
0
GDP per person (log scale)
0
Source: Comsuption of fiexed capital per agricultural worker and GDP per person are based on data from national acounts with authors calculations and imputations.
Figure 3: Fixed costs of production across countries
Labour intensity of agricultural production
Agriculture is not only a capital-intensive industry, but also labour-intensive. Where access to
capital is limited and/or labour is abundant, labour becomes a critical component in agricultural
production. Typically, capital-intensive agriculture of high-income countries is a labour-saving
economic activity, while the labour-dependent agricultural systems of low-income countries are
a capital-saving activity. This relationship is captured by Figure 4, displaying the number of
agricultural employees per unit of output against GDP per person.
Figure 4 illustrates a clear relationship between labour intensity and per capita income. This
portends that countries with labour-intensive agricultural systems may find their supply chains
disrupted and outputs compromised, if the pandemic in general and quarantine restrictions in
particular cause labour shortages. In consideration that pandemics can lead to a decline in the
availability of agricultural labour through multiple channels - illness that reduces physical
capacity, aversion behaviour and quarantine restrictions - low-income countries that are highly
dependent on labour inputs are particularly exposed to COVID-19-like shocks. For example, in
Brazil’s leading grain-producing state, Mato Grosso, operations at industrial sites, including
agricultural processing facilities, have been suspended in efforts to minimise the community
transmission of the virus6.
6 Source: REFINITIV, Inside Agriculture, at:
https://www.refinitiv.com/en?utm_source=Eloqua&utm_medium=email&utm_campaign=00008BU_InsideAgriculture_Newsletter2
&utm_content=Newsletter_InsideAgriculture_24Mar20&elqTrackId=28422a38646a4230b28511863d99d895&elq=264e889f5a2d4
1d094462e121c75414c&elqaid=62543&elqat=1&elqCampaignId=6372
Page 13 of 44COVID-19: Channels of transmission to food and agriculture
Labour input is much higher in LIC, 2015
Arab States, developing East Asia and the Pacific, developing
Europe and Central Asia, developing Latin America and the Caribbean, developing
South Asia, developing Sub-Saharan Africa, developing
Developed countries
USD 1000 000
AUS
USA
Gross output per agricultural worker (usd)
USD 100 000
JPN
RUS
USD 10 000 BRATUR
ln(y) = 1.2662ln(x) NGA CPR
-0.9366 IDN
USD 1 000
IND
USD 100
USD 100 USD 1 000 GDP per person (log scale)USD 10 000 USD 100 000
Source: Share of gross output per agricultural worker and GDP per person are based on data from national acounts with authors calculations and imputations.
Figure 4: Labour intensity across countries
Examining possible impacts at the level of an entire country can mask differences in important
effects across sectors within a country. For instance, while most agricultural commodities in high-
income countries are produced in capital-intensive systems, some high-valued crops require high
inputs of labour. Harvesting of fruits and vegetables, or operating meat processing systems, are
highly labour-intensive activities also in high-income countries.
There is growing evidence that such labour-intensive production systems are being affected by
the COVID-19 pandemic, largely owing to direct health effects or indirect effects of shutdowns.
There is also growing evidence that these effects occur across both high and low-income
countries and that they are sector-specific rather than country-specific. For instance, the closure
of the United States Embassy and consulates in Mexico raises the risk of labour supply shortages
for farms in the United States of America, notably for fruit and vegetable producers. With the
closure of consulates in Mexico, the so-called H-2A visa programme, which brings some 200 000
foreign workers to United States of America farms each year, will not provide access to workers
needed to harvest fruits and vegetables in the southern and western states of the United States.
At the same time, there are reports7 that migrant labour residents in California who were
previously working in the hospitality sector are now available and could be employed in local
agriculture.
In China, a lack of workers in the labour-intensive meat processing industry has taken a toll on
meat supplies, over and above the impacts of the African swine fever8. Abattoirs cannot work at
full capacity as some employees are under quarantine. This has resulted in a shortage of meat
supplies and markedly higher prices in local meat markets, including in the Xinfadi market,
Beijing’s largest wholesale market. The Beijing market is also affected by labour shortages in
north-eastern provinces where only eleven slaughterhouses were operating during February.
Similar issues exist in other provinces. For example, only seven slaughterhouse facilities were
7 https://agfundernews.com/quick-hires-are-on-the-menu-to-pick-fresh-berries-amid-a-sea-of-layoffs.html
8 See e.g. Josef Schmidhuber, FAO, Food Outlook May 2019, Special Feature.
Page 14 of 44COVID-19: Channels of transmission to food and agriculture
operating in Liaoning, and just two each in Heilongjiang and Inner Mongolia. In addition to
shortages in labour supplies for abattoirs, there is growing evidence that transportation
bottlenecks are affecting the local meat supply chain. Up until early March 2020, only large-scale
farms were able to deliver finished hogs. Family farms cannot market hogs as trucks cannot enter
villages, many of which are still under lockdown to prevent the spread of COVID-19.
Exchange rates as a channel of transmission
One of the immediate reactions to the COVID-19 pandemic was a change in exchange rates.
Figure 19 (Annex) of this document presents the shifts in exchange rates since January 2020 for
all major currencies. While the exact reasons for the rapid movements in exchange rates are still
to be determined, a common feature was a significant appreciation of the United States dollar
against almost all other currencies. The same holds, albeit to a lesser extent, for the Euro.
Another common feature was a particularly noticeable depreciation of the so-called commodity
currencies, i.e. the currencies of commodity exporters, such as the Argentinian Peso and the
Brazilian real, but also the Canadian and the Australian dollar. The devaluation and/or
depreciation of these currencies reflected, at least to a certain degree, the sharp decline in
commodity prices, notably those of petroleum, metals and energy and to a lesser extent those of
agricultural products.
Table 1: Energy and metal prices since January 2020
Unit Price Unit Price Unit Price Mar/Feb Mar/Jan
(Mar20) (Feb20) (Jan20)
Oil, WTI (USD/Barrel) 22.43 53.78 58.34 -58.3% -61.6%
Platinum (USD/Ounce) 600.48 982.10 1020.20 -38.9% -41.1%
Palladium (USD/Ounce) 1703.56 2677.30 2496.41 -36.4% -31.8%
Silver (USD/Ounce) 12.85 18.40 18.06 -30.2% -28.9%
Copper (USD/Ton) 4854.85 5729.00 6244.50 -15.3% -22.3%
Nickel (USD/Ton) 11370.00 12681.50 13842.50 -10.3% -17.9%
Lead (USD/Ton) 1673.00 1938.75 1952.85 -13.7% -14.3%
Aluminum (USD/Ton) 1583.00 1711.15 1815.74 -7.5% -12.8%
Iron ore (USD/DM Ton) 89.57 86.15 94.80 4.0% -5.5%
Gold (USD/Ounce) 1506.95 1621.31 1560.82 -7.1% -3.5%
While lower exchange rates were often driven by lower prices for non-food commodities (Table
1), these changes affect the competitiveness of all tradables, including food and agricultural
products. Exchange rate swings will therefore affect both the quantity and price of foods available
to domestic consumers. They may also trigger endogenous policy changes. To understand the
effects on domestic consumers, it is convenient to distinguish two basic trade positions.
Commodity exporters with agricultural surpluses. The lower global growth prospects have already
placed a significant downward pressure on international commodity prices and weakened the
Page 15 of 44COVID-19: Channels of transmission to food and agriculture
exchange rates of commodity exporters (“commodity currencies”) against the main benchmark
currencies, notably the United States Dollar and the Euro. These devaluations/depreciations
affect the competitiveness of all commodities, food and non-food alike. While a higher
competitiveness for non-food exports is often welcome, an outflow of food could undermine
domestic food supplies and eventually entice policy makers to export restrictions to ensure
domestic food security. A proliferation of export restrictions could, as in previous food crises,
result in global supply shortages and eventually food higher international prices.
High stocks and good crop prospects suggest that such fears are currently unwarranted. A few
exceptions exist, however, including the recent export restrictions imposed by Kazakhstan.
Kazakhstan’s economy is heavily dependent on exports of minerals and metals, which account for
more than 85 percent of total merchandise exports (Figure 17, Annex). Sharply lower prices of
these non-agricultural products exerted downward pressure on the country’s currency, the
tenge, which lost nearly 10 percent of its value against the United States dollar since the start of
the pandemic (Figure 18). This also triggered fears of an outflow of basic foods. On 24 March, the
Ministry of Agriculture of Kazakhstan imposed a ban on the exports of food products, including
wheat flour, sunflower seed and sunflower oil. The list of banned products also included
buckwheat, sugar, potatoes and certain types of vegetables.
Similarly, on March 25, it was reported that Argentine soybean and maize farmers are holding
back their crops from the market, even after the Government moved to resolve coronavirus-
related problems that have slowed delivery to the country's export hubs. This was attributed to
the uncertainty over the fast-spreading COVID-19 pandemic, with expectations of higher
commodities prices ahead9.
Commodity exporters with agricultural deficits. These countries could be confronted with a
situation where the dwindling revenues from exports of non-agricultural products could
undermine their ability to purchase enough food on the international markets. This would
particularly be the case, if the prices of agricultural products rise on international markets. Many
countries in the MENA region fall in this rubric, many of which are exporters of “hydrocarbons
and importers of carbohydrates” (Figure 5). Particularly poorer countries of the region could find
themselves in a situation where the benefits from lower international food prices are outweighed
by lower revenues from exports of hydrocarbons, metals and minerals.
9 Inside Agriculture:
http://share.thomsonreuters.com/assets/newsletters/Inside_Agriculture/IA_STORIES_03262020.pdf?utm_source=Eloqua&utm_me
dium=email&utm_campaign=00008BU_InsideAgriculture_Newsletter2&utm_content=Newsletter_InsideAgriculture_26Mar20
Page 16 of 44COVID 19: Channels of transmission to food and agriculture
Net exports of agriculture vs. Net exports of energy, 2016-18
Arab States, developing East Asia and the Pacific, developing Europe and Central Asia, developing
Latin America and the Caribbean, developing South Asia, developing Sub-Saharan Africa, developing
Developed countries
6
Agriculture net exports,
USD millions (log scale)
Net agricultural exporters/ energy importers Net agricultural exporters/ energy exporters
BRA
FRA AUS
4 IDN CAN
USA ECU MYS
IND MEX
TUR
COL
2
AB 0
Energy net exports, USD millions (log scale)
D C
-6 -4 -2 0 2 4 6
Net agricultural importers/ energy importers Net agricultural importers/ energy exporters
-2
SDN
PAK VEN NGA
IRN RUS
-4
CPR
JPN
Note: Net exports (originally in usd millions) are presented on a logarithmic scale. For negative values (net imports),
we take the logarithm of the absolute value and the values as negative ones.
-6
Figure 5: Net trade in agriculture and energy, data based on UN Comtrade
Figure 5 depicts the exposure of different countries to both energy and agricultural trade. All
flows are expressed as net values expressed in US Dollars, i.e. “exports minus imports”. By
presenting countries along their net trade positions for both commodity groups, four clusters
emerge, reflecting different country exposures to price transmission from agriculture and energy
markets. The lower left quadrant, for instance, depicts countries that are net importers of both
energy and agricultural products. They stand to benefit in the current situation, at least as long
as both energy and agricultural prices are under downward pressure. This is by far the largest
group of countries. By contrast, countries in the upper right quadrant are likely to suffer from
lower export prices of both energy and agricultural products. Those in the upper left quadrant
benefit from lower energy export prices and suffer from lower export agricultural prices, while
the reverse holds for those in the lower right quadrant.
Energy markets as a channel of transmission
Amid the lower GDP growth forecasts, crude oil prices have fallen sharply. While the extent and
the depth of a possible economic contraction are still unknown, lower growth and reduced
movements of goods and people are likely to take a particularly high toll on energy prices. Lower
energy prices affect agricultural systems through both input and output markets.
Page 17 of 44COVID-19: Channels of transmission to food and agriculture
On the agricultural output side, lower energy prices will reduce the amounts of agricultural
feedstocks used for the production of biofuels, probably limiting biofuel use to the amounts
mandated by policies. The typical feedstocks, such as sugar cane and maize, are likely to see the
most pronounced contractions in demand and the most significant downward pressure on prices.
On the agricultural input side, lower energy costs would translate into reduced production costs,
particularly in the capital-intensive farming systems. Lower energy costs would affect agricultural
production costs through several channels. The direct impacts include lower costs of energy for
all forms of mechanisation, including power needed to till fields, for irrigation and for
transportation. The indirect impacts will be channelled through lower costs of energy-intensive
inputs such as fertilizers (Figure 6), lubes, pesticides and electricity. These lower input costs would
act as an automatic stabiliser for farm incomes and attenuate the direct impacts of lower energy
prices and the COVID pandemic more generally.
Fertilizer and energy prices 2000-2020
Urea US$/t Natural gas US$/BTU
900 16
800 14
700
12
NATURAL GAS, USD/BTU
600
10
UREA, USD/T
500
8
400
6
300
4
200
100 2
0 0
01-Feb-00
01-Feb-01
01-Feb-02
01-Feb-03
01-Feb-04
01-Feb-05
01-Feb-06
01-Feb-07
01-Feb-08
01-Feb-09
01-Feb-10
01-Feb-11
01-Feb-12
01-Feb-13
01-Feb-14
01-Feb-15
01-Feb-16
01-Feb-17
01-Feb-18
01-Feb-19
01-Feb-20
Source: Index mundi
Figure 6: Fertiliser and natural gas prices,
High concentration in global fertilizer trade
The prospects for a longer global economic slump are likely to keep a lid on energy prices, and
hence on the prices of fertilizers and all other energy intensive inputs. Overall, this should help
stabilize agricultural incomes, boost production and keep food prices under downward pressure
beyond the short-term. The only reason for concern arises from the high concentration of
fertilizer exports, suggesting that imports are dependent on functioning transportation and
logistics systems across a multitude of importers. The concentration of exports for both pesticides
and different types of fertilizers are summarized in Table 2.
Page 18 of 44COVID-19: Channels of transmission to food and agriculture
Table 2: Concentration ratios of fertilizer exports
CR3 of Exporters CR5 of CR7 of
Exporters Exporters
Fertilizers, Nutrient nitrogen N 37% 46% 53%
Fertilizers, Nutrient phosphate P2O5 54% 75% 82%
Fertilizers, Nutrient potash K2O 72% 85% 89%
Pesticides 37% 55% 65%
Data: FAOSTAT
Credit markets as a channel of transmission
The preceding section has shown that agriculture can be a very capital-intensive economic
activity, particularly in high-income countries. Over the past decades, these countries have
increased the proportionate utilization of fixed capital (machines, etc.) and intermediate inputs
(fertilizer, etc.), concomitantly replacing farm labour. However, this trend was not limited to high-
income countries; also capital-intensive production in many low-income countries (“row crops”)
has become a labour-saving activity. For instance, the production of maize or soybeans in
countries like Argentina, Brazil or Paraguay is nearly as capital-intensive as in the United States of
America.
While capital intensity in both country groups have reached comparable levels, the financing
structure (debt/equity) and the financing costs are markedly different. Typically, farmers in Latin
America not only produce with high debt shares, but their capital costs (interest rates) are
significantly higher than in high-income countries. They are, therefore, more exposed to a
possible shock in the cost of capital, potentially arising from changes in interest rates. For these
farms, credit markets could be a key channel of transmission, potentially weighing the supply of
capital-intensive production. While refinancing of fixed capital goods may be delayed and the
reaction on the supply side could be limited, higher financing costs for intermediate inputs could
result in a rather sudden contraction of supply. The extent of the contraction will depend on the
debt/equity share and changes in interest rates/borrowing costs.
Page 19 of 44COVID-19: Channels of transmission to food and agriculture
Differential impacts due to differential changes in interest rates
Since the outbreak of COVID-19, interest rates have changed around the world. In general, rates
have fallen in high-income countries, following the interventions of central banks, which are
lowering refinancing rates for commercial banks and reducing market rates through open market
interventions. By 23 March 2020, 39 central banks10 had lowered interest rates or increased
liquidity. Despite these interventions, market rates for borrowing fresh capital have often risen11,
particularly in low-income countries. A Jubilee Debt Campaign12 report states that interest rates
have on average risen by 3.5 percentage points for low- and middle-income countries since mid-
February, and that costs for new borrowing stood at 10 percent. At the same time, prices of
products coming from capital-intensive systems, such as maize or soybeans, have fallen, further
squeezing profit margins for these products, particularly in low-income countries.
The different exposures to borrowing costs by high and low-income countries could have
differential effects on the supply of these capital-intensive products. In general, it would enhance
competitiveness of supplies from high-income countries (United States of America, European
Union) and weigh on competitiveness of producers in low-income countries (Latin American
producers). How long these effects will last is difficult to predict and, indeed, not the objective of
this analysis. There are, however, first signs of a possible global credit crisis, which could be large
in magnitude and long in duration. To stave off the potential impact on farmers, the United States
of America’s Farm Credit Administration, the regulatory body overseeing the credit system, is
encouraging financial institutions to implement relief mechanisms, such as extending the terms
of loan repayments.13
A recent report by the United Nations Conference on Trade and Development (UNCTAD)14 shows
how sustained debts could pose a larger problem for the global economy and financial system.
According to UNCTAD, in 2018, total debt (private, public, domestic and external) across
developing countries was equal to almost twice their combined GDP—the highest ever. The build-
up of private debt by non-financial corporations, which now amounts to nearly three-quarters of
total debt in developing countries (a much higher ratio than in advanced economies), is seen as
particularly concerning. According to UNCTAD, inherently volatile “foreign shadow financial
institutions” have played a major role in fuelling this accumulation, such that around one-third of
private non-financial corporate debt is located in low-income countries. Similarly, a report by the
International Monetary Fund15 (IMF) shows that rising debt levels have led to increased debt
vulnerabilities in many low-income developing countries (LIDCs). While debt vulnerabilities
remain contained in the majority of LIDCs, some 40 percent of LIDCs now face significant debt-
related challenges, up from 21 percent in 2013. Nine of twelve countries that moved from
“low/moderate risk” to “high risk/in debt distress” are in sub-Saharan Africa.
With rising costs for capital, the impacts would also be felt in agriculture, notably capital-intensive
forms of production. Credit markets could become an important channel of transmission,
adversely affecting capital-intensive agriculture. Capital intensive production in low-income
countries (e.g. row crops in Latin America) could be particularly hard hit. This would further
10 Inter alia, the Central Banks of the US (Fed), Euro Area (ECB), UK (BoE), Brazil, Chile, Hongkong, Indonesia, South Korea, Mexico,
New Zealand, Norway, Peru, The Philippines, Poland, Romania, South Africa, Thailand, and Turkey.
11 There are several factors that led to higher interest rates. Importantly, the rapid price declines in other asset classes, notably
equities, forced many investors to sell bonds (including T-bill and German Bunds). This in turn led to downward pressure on bond
prices and increases in the underlying yields (interest rates).
12 https://jubileedebt.org.uk/
13 FCA encourages Farm Credit System institutions to work with borrowers affected by COVID-19. Farm Credit Association, 17 March
2020. https://www.fca.gov/newsroom/news
14 https://unctad.org/en/PublicationsLibrary/gds_tdr2019_update_coronavirus.pdf?user=1653
15 https://www.imf.org/en/Publications/Policy-Papers/Issues/2018/03/22/pp021518macroeconomic-developments-and-prospects-
in-lidcs
Page 20 of 44COVID-19: Channels of transmission to food and agriculture
deteriorate the commodity terms of trade for many commodity dependent LIDCs that has been
underway since the last price hike in 2012.
TRADE AS A CHANNEL OF TRANSMISSION
The preceding section examined the dependency of different farming systems on the various
factors of production. But farming is not only exposed to disruptions in domestic factor markets,
it is also subject to possible disruptions in trade and international supply chains. The quantitative
analysis will be limited to disruptions in agricultural outputs. Exposure through imports and
exports will be presented separately.
Agricultural exports
Many low-income countries depend on agriculture for much of their export earnings. A high
portion of export earnings from agriculture and possibly from very few commodities within
agriculture means that these countries are particularly exposed to shocks that may emanate from
global agricultural markets. Some Latin American countries are particularly exposed to such
shocks. For instance, in countries like Paraguay, Argentina or Guatemala, 50 percent or more of
total export earnings come from exports of agricultural products (excluding tourism). Even more
exposed are the smaller countries where export earnings not only depend on agriculture overall
but are concentrated on a few agricultural commodities. Examples include Guinea-Bissau, Kiribati
and or Malawi, all of which receive more than 70 percent of their export earnings from agriculture
and even larger shares from primary commodities16 (Figure 7 and Figure 8).
Top-30 export-dependent countries/regions for food and
agriculture (2016/2018)
100%
SHARE OF AG IN TOTAL TRADE
90%
80%
70%
60%
50%
40%
30%
20%
10%
0%
Republic of Moldova
Madagascar
Paraguay
Ethiopia
Uruguay
Nicaragua
Kenya
Guatemala
Grenada
Argentina
Somalia
Uganda
Costa Rica
Syrian Arab Republic
Guinea-Bissau
New Zealand
Benin
Sao Tome and Principe
Comoros
Côte d'Ivoire
Belize
Seychelles
Cabo Verde
Sudan
Ukraine
Malawi
Burundi
Fiji
Ecuador
Cuba
Figure 7: Dependency on agricultural exports
16
Available export data excludes tourism as a potentially important export sector. This was imposed by the lack of comprehensive
data rather than analytical reasons. Where data on tourism are available, these suggest that some countries can be exposed not only
to a slump in agricultural exports or a supply side shock that reverberates through a labour-intensive agricultural sector, but also to a
slump in export earnings from tourism. This holds for many SIDS, both in the Caribbean and in the Pacific.
Page 21 of 44COVID-19: Channels of transmission to food and agriculture
Top-30 ag exporters (2016/2018)
Share of ag-Exports ag-Export values
70% USD 160
AG TRADE VALUES, USD BILLIONS
60% USD 140
SHARE OF AG TRADE
50% USD 120
USD 100
40%
USD 80
30%
USD 60
20% USD 40
10% USD 20
0% USD 0
Ze nd
Fr zil
Ch e
Tu e
Br y
n
Au ium
er a
ria
itz ore
Ca aly
Sw p e
ge ia
d
Ne . Ir d
de sia
nm n
nd
Th xico
ia Ma and
Uk am
an P dia
a
M sia
et k
Ire ey
Au nd
rm s
Be da
do a
Ge and
an
Vi ar
c
th ric
in
in
l
In ntin
ai
De tio
lan
N n
Ar tral
Sin Chi
a
w ela
an
rk
na
st
la
la
ne
d ola
F e l ay
It
Sp
ra
n
N
Ne me
lg
al
ra
e
I
ai
er
a
l
s
g
A
of
es
n
at
n
ss
ai
St
Ru
rit
d
ite
tB
Un
ea
Gr
of
m
do
ng
Ki
d
ite
Un
Figure 8 Dependency on agricultural exports, top 30 exporters
Specialising in agricultural production also means that these countries can be exposed to supply
side risks. For instance, a high share of labour in the value of gross output infers that countries
could be confronted with at least some temporary shortages in labour supply as a direct effect of
the spread of the virus.
Smaller countries, in particular the Small Island Developing States (SIDS), often specialise in the
production of capital-saving but labour-intensive goods (fruits and vegetables, livestock), many
of which are also highly perishable or vulnerable to disruptions in supply chains. The first impacts
have already been reported from countries that were first exposed to the COVID-19 outbreak.
For instance, shipments of tropical fruits from South-East Asia, which are in season at this time of
year, were disrupted through congestions at ports of Shanghai and Tianjin17. Reefer containers
could not be offloaded on time. This has caused significant losses due to the perishability of the
produce. Cargo disruptions have been amplified by severe container shortages stemming from
increased imports of pork in response to African swine fever. The closure of some wholesale
markets due to quarantine measures has further impeded sales. Wholesale prices of Thailand’s
red-flesh dragon fruit, which has a short shelf-life and is dependent on the Chinese market,
dropped by almost 85 percent after exports to China stopped. Similarly, the prices of longan fruit
from Cambodia have plummeted in response to disruptions to shipments to China.
Agricultural imports
Global economic forecasts suggest a (sharp) decline in overall economic activity, which, in turn,
is a factor weighing on international commodity prices. Net agricultural importers would stand to
benefit from lower import prices, easing possible contractions in purchasing power that may arise
from internal economic recessions. Indeed, lower import prices could function as an automatic
stabiliser for food security in low-income food-importing developing countries, allowing them to
import larger quantities at lower prices.
17 http://www.fruitnet.com/asiafruit/article/181021/coronavirus-measuring-the-market-impact
Page 22 of 44COVID-19: Channels of transmission to food and agriculture
Disruptions of import supply
High import dependency, however, could also expose countries to disruptions in international
supply chains, owing, for instance, to a lack of labour and functioning transportation capacity, or
clogged ports and storage facilities, or limited discharge capacities due to a lack of personnel at
ports and critical connection points for merchandise trade. Such impacts, whilst only illustrative
and non-representative, have already been observed. In China, for instance, processing of
soybeans has been impeded due to a slowdown in exports from Brazil, on account of a lack of
freight capacity from Mato Grosso to the country’s ports. This has led to a shortage of soybeans
for crushers in China, a situation that, according to China Oil and Foodstuffs Corporation (COFCO),
could last for a longer period.18 Similarly, the virtual standstill in passenger flights that are used to
transport fruits and vegetables in the cargo body has reduced the availability of certain fruits and
vegetables, notably tropical fruits. India, for instance, reported a sizeable reduction in exports of
fruits and vegetables.
Jammed wharfs and warehouses also affect imports of produce from Latin America. Some 20 000
tonnes of Chilean cherries were blocked in Chinese ports and are waiting to be sold. The fruit has
begun to move again as wholesale markets are reopening. While the 20,000 tonnes represent
only 10 percent of the 220 000 tonnes of cherries shipped by Chile to China in 2019/20, the
financial impact is still substantial. Chilean industry officials estimated the lost revenues at
USD 70-80 million for cherries and USD 100 million if other fruits are included19.
Top-30 import-dependent countries/regions for food
and agriculture (2016/2018)
60%
SHARE OF AG IN TOTAL TRADE
50%
40%
30%
20%
10%
0%
Yemen
Turks and Caicos Islands
Timor-Leste
Afghanistan
Cabo Verde
Iraq
Sudan
Kiribati
Tonga
Niger
Equatorial Guinea
Somalia
Cuba
Eritrea
Libya
Gambia
Grenada
Samoa
Syrian Arab Republic
Lesotho
South Sudan
Sierra Leone
Sao Tome and Principe
Guinea-Bissau
Benin
Gabon
Palestine
Comoros
Cook Islands
Haiti
Figure 9: Dependency on agricultural imports
Similarly, the decision by China and Islamic Republic of Iran to halt the importation of tea
contributed to a fall in prices, weighing on export earnings; at the same time, the postponement
18 Source: REFINITIV, Inside Agriculture, at:
https://www.refinitiv.com/en?utm_source=Eloqua&utm_medium=email&utm_campaign=00008BU_InsideAgriculture_Newsletter2
&utm_content=Newsletter_InsideAgriculture_24Mar20&elqTrackId=28422a38646a4230b28511863d99d895&elq=264e889f5a2d4
1d094462e121c75414c&elqaid=62543&elqat=1&elqCampaignId=6372
19 http://www.fruitnet.com/asiafruit/article/181021/coronavirus-measuring-the-market-impact
Page 23 of 44You can also read