ANALYSIS OF BYTEDANCE - WITH A CLOSE LOOK ON DOUYIN / TIKTOK
←
→
Page content transcription
If your browser does not render page correctly, please read the page content below
——————————————————
 Analysis of ByteDance
 with a close look on Douyin / TikTok
 ——————————————————

Author: Xiaoye SHI
Supervisor: Prof. Dr. Didier SORNETTE

 A thesis submitted to the
 Department of Management, Technology and Economics (D-MTEC)
 of the
 Swiss Federal Institute of Technology Zurich (ETHZ)
 in partial fulfilment of the requirements for the degree of
 Master of Science in Management, Technology and Economics

 June 2019
Acknowledgements

I would like to thank my supervisor Prof. Dr. Didier Sornette, who has kindly given me countless
guidance and advice throughout the Master thesis. I appreciate the opportunity to work on this
interesting topic under the Chair of Entrepreneurial Risks and is deeply grateful for all the help
received along the process.

I also want to express my deepest gratitude to my parents, who have been supportive and encouraging
under all circumstances. Without them, I would not be able to become the person I am today.

 -2-
Abstract

In 2018, ByteDance, a young Internet company with only 6 years of history, broke out on various
news headlines as the highest valued unicorn. With the acquisitions of musical.ly and Flipgram, the
company’s flagship product Douyin strikes to develop its global presence under the name TikTok.
This thesis analyzed Douyin’s historical growth and revenue model. As a main revenue driver, future
user growth is predicted and calibrated by extending the methodology proposed in earlier studies by
Cauwels and Sornette. We considered three growth scenarios – base, high and extreme, and estimated
Douyin as well as ByteDance’s value based on comparable company analysis. ByteDance’s key
performance metrics and multiples were compared with four other firms in the similar industry,
Facebook, Weibo, Momo and iQIYI. The study found out that in order to support the company’s
current valuation, Douyin needs to keep its user growth at a pace similar to the extreme growth
scenario. However, it appears that with its current MAU reaching the maximum carrying capacity
suggested in the high growth scenario, its future user growth rate is likely to slow down or even stop
in the following years. With other products of the company growing at their current pace, ByteDance’s
current valuation of 75 billion USD is considered to be too high.

Keywords: mobile internet, short video industry, in-feed ads, logistic function, comparable company
analysis

 -3-
Table of Contents

Acronyms and Vocabulary -5-
1 Introduction -6-
 1.1 Context -6-
 1.1.1 Internet -6-
 1.1.2 ByteDance -8-
 1.2 Motivation - 12 -
2 Theoretical Background - 14 -
 2.1 Traditional Valuation Methods - 14 -
 2.1.1 Income approach - 14 -
 2.1.2 Asset-based approach - 15 -
 2.1.3 Market approach - 16 -
3 Method - 18 -
 3.1 User Growth Analysis - 18 -
 3.1.1 Discrete Growth Rate - 18 -
 3.1.2 Logistic Function - 20 -
 3.2 Comparable Company Analysis (CCA) - 21 -
4 Data and Analysis - 25 -
 4.1 Revenue Breakdown - 26 -
 4.1.1 Revenue Analysis - 31 -
 4.1.1 Revenue Projection - 34 -
 4.2 Cost and Profit - 53 -
 4.3 Valuation Analysis and Discussion - 54 -
5 Conclusion - 59 -
References - 62 -
Appendix - 68 -
 Appendix A Global share of mobile Internet traffic - 69 -
 Appendix B Countries with the most Internet users - 69 -
 Appendix C Percentage of mobile apps that have been used only once - 70 -
 Appendix D Official pricing of ads on Douyin app - 70 -
 Appendix E Accumulated Downloads of Douyin & Kuaishou - 71 -
 Appendix G User development of Douyin - 71 -
 Appendix H Daily usage from overlapping users - 72 -

 -4-
Acronyms and Vocabulary

In alphabetical order:

 ARPU average revenue per user, calculated as the revenue divided by the number of
 users (often yearly revenue divided by average MAU of the year)
 CCA comparable company analysis
 CPC cost per click
 CPM cost per mille, also known as cost per thousand views
 CPT cost per time
 DAU daily active user – the number of unique, engaged users per day
 DAU/MAU the proportion of monthly users who use the product on a daily basis –
 reflects user stickiness
 DCF discounted cash flow
 EBITDA earnings before interest, tax, depreciation, and amortization
 EV enterprise value, as the total market value of the company net of cash
 FMV fair market value
 MAU monthly active user – the number of unique, engaged users per month
 M&A mergers and acquisitions
 MC market capitalization
 p.a. per annum
 P/E price-to-earnings ratio, calculated as the market price (per share) divided by
 earnings (per share) from the most recent financial year
 P/S price-to-sales ratio, also known as sales multiple, calculated as the market price
 (per share) divided by sales (per share) from the most recent financial year
 UGC user generated content

 -5-
1 Introduction
1.1 Context
1.1.1 Internet

Internet, the contraction of interconnected network, is a network of networks of all sorts of types and
scopes connected by various technologies. It carries a wide range of resources and services. Originated
in the twentieth century, Internet kept gaining popularity globally.

As shown in Figure 1, the global number of Internet users has been growing since 2005. By the end
of 2018, 3.9 billion people had access to Internet, 52 inhabitants out of a hundred were using Internet
services. If we break down countries around the world into three categories based on the level of
development they are currently at, we can see that the positive trend of user growth does not only
occur in one category. Countries of all three categories have experienced upward growth curve – the
increasing demand and usage of internet is universal and phenomenal.

The rapid adoption of Internet, the fast development and convergence of digital technologies further
stimulated the innovation and widened its reach. Mobile phone became more prevalent. Instead of
accessing Internet through fixed-line devices like computers, people could browse web anywhere, with
some pocket-sized, multi-purpose devices that function fully as computers – we call them
smartphones.

The ubiquity of mobile internet and smartphones opened up a large new market. Internet now serves
as a medium of a broad spectrum of areas including content services, communications, and commerce
(Kim, Chan, & Gupta, 2007; McKnight & Bailey, 1995). In November 2018, 48% of the global web
traffic come from mobile internet, with Asia in the leading position (StatCounter., n.d.). We can see
from Figure 2 that, by January 2019, Internet already has almost four and a half billion active users,
out of which nearly 90% are also active mobile internet users, 74% of which are active on mobile

 -6-
social media (We Are Social, & DataReportal, n.d.). No doubt, the mobile social media sector is
becoming one of the most promising and lucrative market.

 90 4,500

 Number of Internet Users Worldwide [mn]
 80 4,000
 Internet Users per 100 Inhabitants

 70 3,500
 60 3,000
 51.2
 50 2,500
 40 2,000
 30 1,500
 20 1,000
 10 500
 0 0

 Year
 Developed Developing World LDCs

Figure 1: Internet users per 100 inhabitants from 1997 to 2018 (primary axis)1; number of Internet users worldwide from
2005 to 2018, in millions (secondary axis)2

Note: rounded values; * represents estimates

1
 The number of Internet users is grouped into three categories: world, developed countries,
developing countries, and LDCs (least developed countries, data is available only from 2005).
Classifications of countries into developed/developing/LDCs are based on the UN M49
(http://www.itu.int/en/ITU-D/Statistics/Pages/definitions/regions.aspx). Lines were plotted in
two different styles, with 1997-2005 being dotted and 2005-2018 being solid, as the two sets of time-
series data were retrieved from different sources. Source: ITU World Telecommunication (solid line)
/ ICT Indicators database (dotted line)
2
 Source: ITU World Telecommunication / ICT Indicators database

 -7-
5,000 100% 100%
 4,500 91% 90%

 Percentage of All Internet Users [%]
 4,000 79% 80%
 74%
 Number of Users [mn]

 3,500 70%
 3,000 60%
 2,500 50%
 4,388
 2,000 40%
 1,500 30%
 1,000 20%
 500 10%
 0 0%
 Active internet users Unique mobile internet Active social media users Active mobile social
 users media users

 Worldwide digital population as of January 2019 Nomalization

Figure 2: Global digital population as of January 2019, in millions (primary axis) and in percentage (secondary axis)3

With nearly 772 million internet users by end of 2017, 21% of the world total number, China is
undoubtfully the biggest market for Internet services. Leveraging the tremendous market size, more
and more Internet companies were set up. ByteDance was one of them.

1.1.2 ByteDance

Founded by Yiming Zhang in March 2012, Beijing ByteDance Technology Co Ltd. (later referred to
as “ByteDance”) is now considered the most valuable unicorn4 in the world. With the closure of a
funding from SoftBank Group Corp., KKR&Co., and General Atlantic, the company is now valued
at $75 billion, surpassing of Uber Technologies Inc., valued at $72 billion 5 (Ramli, Wang, & Chen,
2018).

3
 The number of users worldwide were normalized to percentage with the number of active internet
users (totaled 4,388 million) being 100%. Source: Statista
4
 The concept of unicorn was coined by Aileen Lee in 2013, referring to a privately held company
valued over 1 billion US Dollars.
5
 Source: CB Insights by October 2018

 -8-
ByteDance has a global presence – its products and services are available in over 150 countries in the
world, in more than 75 languages. As a breakthrough point of the company, ByteDance established
its own artificial intelligence (AI) lab that focuses on utilizing machine learning and deep learning into
its products and services (ByteDance, 2018).

Taking a closer look at ByteDance, the company has four products, all operating under AI technology.
Counting all its products and services, ByteDance has a total monthly active users (MAU) of 598
million by December 2018, accounting for 52.9% of the total MAU of mobile Internet. The number
excludes overlapping users of multiple platforms (QuestMobile, 2019). Out of all products, Toutiao
(TopBuzz) and Douyin (TikTok) are the two flagship products and contribute to a substantial
proportion of the company’s revenue (Byford, 2018).

A brief overview on each product was given below.

Douyin (TikTok)

Douyin, known as TikTok internationally, is an online short-video mobile application that allows users
to create, post, and share self-created videos (Lam & Li, 2018). Launched by ByteDance in September
2016, it is now one of the leading social network apps by number of downloads as well as active users
(ByteDance, 2018).

In February and November 2017, ByteDance acquired short video apps Flipgram and musical.ly,
respectively and has been expanding its international presence ever since. Up until the end of 2018,
Douyin is available in over 150 countries and regions, and has been on the top of the lists of the most
downloaded mobile app in many countries, including Japan, Thailand, and China. As shown in Figure
3, with a MAU of 500 million, Douyin (TikTok) has the 9th highest number of monthly active users
worldwide by January 2019, among all other popular social network apps, combing iOS and Android
downloads.

 -9-
Number of Active Users [mn]
 0 500 1,000 1,500 2,000 2,500
 Facebook
 YouTube
 WhatsApp
 Facebook Messenger
 WeChat
 Instagram
 QQ
 QZone
 Douyin / Tik Tok
 Sina Weibo
 Reddit
 Twitter
 Douban
 LinkedIn**
 Baidu Tieba*
 Skype*
 Snapchat**
 Viber*
 Pinterest
 LINE

Figure 3: Most popular social networks worldwide as of January 2019, ranked by number of active users (in millions)6

Douyin is designed for young audience with a focus on Generation Z (Yang, 2018). With a customized
background music, users can create a 15-second video with unique effects and share it with friends or
the broader audience out in the world (ByteDance, 2018). It is also very popular to do lip sync along
different music with the app.

By December 2018, Douyin has a MAU of 426 million in China (QuestMobile, 2019).

Toutiao (TopBuzz)

Toutiao, with a meaning of “headline” in Chinese, is the first product of ByteDance. It is an online
platform that aggregates news and content, and recommends and delivers them based on user’s
interests (ByteDance, 2018). With the employment of AI technology, Toutiao could analyze user’s
reaction and interaction of past content. The technology will study if users taped the news title into

6
 Source: Statista

 - 10 -
the detailed page, if they liked it, or even the length of time they spend on reading each post. The app
would thereby generate individualized feeds of contents through the machine learning algorithm and
deliver them to the corresponding end users (Hariharan, 2017; Jing, 2018). Every time users open or
refresh the app, new feeds would be automatically pushed, loaded, and displayed without them actively
searching for contents. These contents recommended to the users in the end are thought to be of their
interests, habits, and preferences (Smolentceva, 2019).

By December 2018, Toutiao has a MAU of 240 million in China (QuestMobile, 2019).

Topbuzz is the international version of Toutiao that is available for users overseas. Except utilizing
the company’s AI technology, like all the other products, ByteDance also aims at partnering with local
media to collect and generate the content (Knight, 2018).

Huoshan (Vigo Video)

Huoshan, known as Vigo Video internationally, is a short-video app that is similar to Douyin on many
aspects. It empowers users to create and edit videos with a wide range of tools, stickers and effects
(ByteDance, 2018). Similar to Douyin, all videos posted and shared on Huoshan are restricted to a
time limit of 15 seconds. However, Huoshan focuses more on user-generated contents, with most
content being related to funny acts, live broadcasting of people eating, and square dancing (Borak,
2019).

By December 2018, Huoshan has a MAU of 99 million in China (QuestMobile, 2019).

Xigua Video (Buzz Video)

Xigua Video, known as Buzz Video outside China, is an online platform that aims for content sharing
in the form of videos with no time limits (Tang, 2019). Though most videos are over four to five
minutes in length (Borak, 2019). Users would get a completely new lists of videos for every refresh
they do in the app. Different from Douyin and Huoshan, users have to apply and become a registered
user, content creator and provider of Toutiao to be eligible for sharing contents on Xigua. There are

 - 11 -
more than 1.5 million registered content creators on the platform by the end of 2018 (QuestMobile,
2019).

By December 2018, Xigua has a MAU of 121 million in China (QuestMobile, 2019).

The company has been growing at a rapid speed. In 2017, the company reached its 15 billion CNY
(2.1 billion US dollars) target with a slim profit (Dredge, 2019). In 2018, the company made a total
revenue of 50 billion CNY (7.1 billion US dollars) – this was at the lower end of the company’s annual
target, which is 50 to 55 billion CNY (L. Y. Chen & Wang, 2019). Note that the company made a 1.2
billion US dollars net loss on TikTok’s overseas expansion the same year, giving a profit margin of -
16.9% (Zhang & Osawa, 2019). 7

For 2019, ByteDance has set its revenue target to 100 billion CNY (14.3 billion US dollars), double
the amount realized in 2018 (Xu, 2019).

1.2 Motivation

The rapidly evolving industry accelerates all forms of related capital operations, for example, mergers
and acquisitions (M&As) are carried out more frequently (Calipha, Tarba, & Brock, 2010; Holterman
& van de Pol, 2016). Under the fast growing economy, it is ultimately important to choose an adequate
valuation method in order to reach a fair valuation of the company. Approaches that are based on
market, cost, and earnings are widely used. However, as most Internet technology firms are still at
their early stage of development, their business model and characteristics of are fundamentally
different from those of traditional industries. For instance, most have relatively high costs and unstable
profitability, making the traditional valuation based on earnings less appropriate.

7 In this thesis, the foreign exchange rate for USD/CNY is assumed to be fixed at 7(1 USD = 7
CNY, 1 CNY = 0.14 USD), long-term, unless otherwise stated.

 - 12 -
This thesis aims to discuss the applications as well as limits of traditional valuation methods. Variations
and modifications of the model will be proposed based on the unique characteristic of the industry.
We will then take a closer look at ByteDance’s core products in order to examine the accuracy of its
current valuation.

The thesis is structured as follows.

In Section 2, theoretical background is provided. Three traditional valuation approaches are
introduced and the widely used valuation methods as well as metrics are discussed. In Section 3, we
introduce our methodology based on prior theories. Section 4 presents the research results followed
by the analysis and discussion. In Section 5 we concludes our research. Discussions on the theoretical
and practical implications of model, as well as potential opportunities for future research is also given
in the section.

 - 13 -
2 Theoretical Background
2.1 Traditional Valuation Methods

Internet companies exhibit unique characteristics that are fundamentally different from those of
traditional industries. Companies in traditional industries are more dependent on factors of production,
whereas Internet companies have more intangible assets.

Prior studies categorized the most used valuation methods into three main approaches: income, asset-
based, and market approach (Kirk & Wishing, 2018; Saari, 2012). We discussed these three approach
one by one and examined their suitability for valuing internet companies.

2.1.1 Income approach

Income approach values the company with a focus on its income statement or cash flow statement.
One widely used method under income approach is discounted cash flow (DCF) method.

Under the DCF method, the value of a company is derived from discounting all of its expected future
cash flows to the present value at a risk-free rate (Damodaran, 2019a). This is shown in equation (2.1).

 ∞
 1 2
 = 1 + 2 +⋯+ =∑
 (1 + ) (1 + ) (1 + ) (1 + ) (2.1)
 =

Where V denotes value, CF denotes projected cash flow, denotes risk-free interest rate, n denotes
time period from one to infinity.

 - 14 -
However, in reality it is difficult to calculate values based on a time horizon of perpetuity. Equation
(2.1) also does not take into account the cash growth every year (Nogueira Reis & Augusto, 2013).
Thus, terminal value is introduced to simplify the calculation process. A common way to estimated
terminal value is by incorporating Gordon Growth Model (GGM) – terminal value is given by dividing
the multiplication of final year cash flow and long-term cash growth rate by the difference between
risk-free rate and long-term growth rate of cash (Folger, 2018; Jennergren, 2008). This is shown in
equation (2.2).

 ∗ (1 + )
 =
 − (2.2)

Where TV denotes terminal value, t denotes the terminal year of the time period considered, g denotes
long term growth rate for cash.

 =∑
 +
 (1 + ) (1 + ) (2.3)
 =1

Note that with TV being considered, n in equation (2.3) still denotes time period, but instead of one
to infinity as in equation (2.1), it denotes time period from one to the terminal year (1 to t).

The DCF method is built on the assumption that the company is able to generate stable economic
benefits in the future in the form of cash flow (Beqiraj & Davis, 2016; Dannible & McKee LLP, 2019).
In our case, Douyin is a rather young company with only 7 years of history and its business model is
yet to be proven profitable – it does not possess positive cash flows necessary for DCF calculation.
Looking ahead, its future cash flow is subject to many factors that are macro-economic, political,
industry-specific, and corporate, we therefore don’t think DCF is a suitable method for valuing
Douyin.

2.1.2 Asset-based approach

 - 15 -
Asset-based approach values the company with a focus on its balance sheet. One widely used method
under this approach is net asset value method. It derives values from the combination of fair market
value (FMV) of the company’s individual assets and is commonly performed when the company is
under acquisition, liquidation, or audit under different accounting standards (Damodaran, 2019b).

Main procedures of the approach includes the definition of business ownership interest subject to
valuation, definition of standard and date of the valuation, and evaluation of the total assets and
liabilities (Kirk & Wishing, 2018).

In mathematically terms, net asset value method can be shown as:

 = ∑ − ∑ (2.4)

Where V denotes the estimated value of the company.

Asset-based approach is most useful when valuing holding companies, asset-intensive companies such
as banks and distressed entities that aren’t worth more than their net tangible value (Dannible &
McKee LLP, 2019). However, it relies heavily on historical acquisition cost of the assets, and does not
take into account unrecorded intangible assets such as the company’s employees, their knowledge and
expertise, or its user base.

Internet companies are not as intensive in tangible assets – most of the company’s assets are intangible,
such as intellectual property, brand recognition and customer loyalty. Douyin is thus not very suitable
to be valued under net asset value method.

2.1.3 Market approach

Market approach bases the value of the company on comparable publicly traded companies. The main
mechanism of market approach is to find a publicly traded company (“the comparable”) that operates

 - 16 -
in the same industry, evaluate its key pricing or performance multiples, and compare them to the
company that is being valued (“the company”) (Meitner, 2006).

Market approach belongs to relative valuation and is suitable when valuing public companies or
privates companies that are mature and large enough because of easy data retrieval. It reflects not only
company value but also market perceptions, which are not covered by the other two approaches
(Damodaran, 2019b). However, prerequisites for market approach do exist in order to ensure a fair
comparison and valuation. One is to have a large data set that is readily available, the other is to have
minimal difference between the company and the comparable. If these conditions are not satisfied,
one could still value the company under the market approach, but the final estimation might be
erroneous.

Main procedures of market approach includes definition, analysis, and application of the multiple.

A commonly used method under market approach is comparable company analysis. It would be
introduced in more details in Section 3.

 - 17 -
3 Method
3.1 User Growth Analysis
3.1.1 Discrete Growth Rate

The user growth rate of a company is often depicted by a differential equation:

 = ∗ ∗ (1 − ) (3.1)

Where P represents the user amount, r refers to the initial growth rate, and K refers to the maximum
carrying capacity.

Equation (3.1) can be explained in a sense that exponential growth takes place at a rate of r when user
amount P is much smaller than the maximum carrying capacity K, whereas the growth rate decreases
by time and eventually stops when these two parameters, K and P, reach even – in other words, when
the maximum carrying capacity is reached.

By rearranging terms in equation (3.1), we obtain a formula on continuous growth rate of users:

 1
 = ∗ = ∗ (1 − ) (3.2)

Where depicts discrete growth rate, P represents the user amount, r refers to the initial growth rate,
and K refers to the maximum carrying capacity.

Alternatively, one can also look at a company’s discrete growth rate of users. The discrete growth rate
refers to the amount of user growth between two points in time can be derived from the above
equation:

 - 18 -
 ln( )
 −1
 =
 − −1 (3.3)

Where depicts discrete growth rate, i represents the point in time, t refers to the time period, and
 refers to the user population at the time i.

Discrete growth rate model can be fitted into the continuous one, as proposed in prior studies by
Cauwels and Sornette:

 + −1
 ln ( )
 = ∗ (1 − 2 )= −1
 =
 − −1
 (3.4)

Expressing equation (3.3) as a linear function = + , y and x can be represented in terms of
discrete growth rate, , and user population from different time, + −1 :

 = (3.5)

 = + −1 (3.6)

We can then express r and K accordingly,

 = (3.7)

 =− (3.8)

When plotting the time-series data of Douyin’s user population along with its linear regression, we
would obtain its discrete growth rate as a linear function in form of = + , thus obtaining values
of a and b. From there we could calculate, under equation (3.7) and (3.8), to get the values of r and K.

 - 19 -
3.1.2 Logistic Function

The growth rate is then incorporated into a logistic function to predict future user growth. Logistic
function is important in understanding and depicting the evolution of user growth. It provides a means
for predicting future user growth of Internet companies. Prior research has shown that the growth of
user base follows the natural growth law, an S-shaped logistic curve (Cauwels & Sornette, 2012).

A standard logistic function is often written as:

 ( ) = (3.9)
 1 + − ∗( − 0)

Replacing the parameters with user-growth specific ones, we get:

 ( ) = (3.10)
 1 + − ∗( − 0)

Where t represents different time periods, P(t) represents the user amount over time, r refers to the
initial growth rate, and K refers to the maximum carrying capacity.

Therefore, setting t=0, we get:

 (0) = 0 = = (3.11)
 1+ − ∗( − 0) 1 + 0

By rearranging the terms in the equation, we get:

 0 = −1
 0 (3.12)

 - 20 -
Substituting equation (3.6) into equation (3.4), we get:
 0
 ( ) =
 + 0 ( − 1) (3.13)

Once both values of r and K are known as well, the remaining unknown parameter, initial user
population, P0 can be derived by rearranging equation (3.13) for the specific time point i. Detailed
explanations can be found in the original study by Cauwels and Sornette.

Equation (3.13) would be used later in this thesis to predict Douyin’s user growth.

3.2 Comparable Company Analysis (CCA)

A comparable company analysis (CCA) is an often used method in relative valuation under market
approach that estimates the value of the target company based on a comparison its financial metrics,
usually in forms of value-to-earnings multiples, with those of other similar listed companies (Capital
City Training & Consulting, 2011; Godek, McCann, Simundza, & Taveras, 2011). The comparable
companies are often publicly traded companies, and they usually share similar value drivers and
operate in the similar industry as the target company that is being analyzed (Meitner, 2006).

The steps of CCA consists of:
 1. Finding comparable companies with similar business models or financial profiles that operate
 in the same or very similar industry
 2. Collecting the operational and financial data of comparable companies – easier with publicly
 traded listed companies for their readily available data
 3. Evaluating performance metrics and multiples of comparable companies
 4. Analyzing the target company using the multiples of its peers
 5. Validating the analysis with strengths and shortcomings

 - 21 -
Most commonly used multiples include price-to-earnings ratio (P/E), price-to-sales ratio (P/S),
enterprise value-to-sales ratio (EV/S), enterprise-to-earnings-before-interest-tax-depreciation-and-
amortization ratio (EV/EBITDA) etc. These multiples are defined and their relevance for this thesis
are discussed below.

Price-to-earnings ratio (P/E)

P/E is calculated by dividing market price per share to earnings per share from the most recent
financial year. It is the most widely used earnings multiple and shows how much investors are willing
to pay per dollar of earnings (Damodaran, 2019b).

 ℎ
 =
 ℎ ( ) (3.1)

P/E is mostly used for companies that are generating positive earnings and stable profits. However,
earnings of Internet companies tend to fluctuate a lot and not all Internet companies are earnings
positive at their current stage (Essence Securities, 2018). Thus, P/E is thought not the best metric to
use in valuing Douyin.

Due to their unique business models, user base and user stickiness are two very important performance
indicator for Internet companies. Internet companies make a substantial amount of revenue from
advertisements, and these two indicators relate directly to the amount of revenue the company would
make that corresponding year (Essence Securities, 2018). In the case of Douyin, a higher number of
daily or monthly active users and a higher ratio of DAU/MAU would make the app more attractive
for advertisement providers because of potential wider exposure and higher visibility (Cuffe, Narayan,
Narayanan, Wadhar, & Wang, 2018). Increasing ad display in turn drives revenue growth, which is
then converted to a higher valuation. Moreover, sales value is thought to reflect and take into account
market perception and sentiment, leading to a relatively small deviations over time (Klobucnik &
Sievers, 2013). Another advantage of using sales as the metric is that it is less dependent on accounting
methods and is thus considered to be more objective than earnings, which could be manipulated by
the company management (Foye, 2008). Thus, when valuing Internet companies, sales-related metrics
are often used, such as P/S and EV/sales.

 - 22 -
Price-to-sales ratio (P/S)

P/S can be calculated by dividing market price per share by sales per share from the most recent
financial year. Alternatively, by cancelling out the number of shares, one can obtain P/S by dividing
market capitalization by total sales of the year.

 ℎ
 = =
 ℎ (3.2)

P/S is often used for valuing companies that experience rapid growth of revenues but fluctuating,
relatively little or even negative net income – it is suitable for valuing Internet companies that are yet
to be profitable (Essence Securities, 2018). It shows how much investors value and are willing to pay
for every dollar of the company’s sales (McClure, 2019).

Enterprise value-to-sales ratio (EV/S)

EV/Sales is an expansion of P/S and is calculated by dividing company’s enterprise value by its total
sales. Enterprise value is the total market value of the company net of cash, it can be obtained by the
addition of market value of equity and debt minus the company’s cash position.

 + − ℎ
 = (3.3)

EV/Sales is usually perceived to be a better metric than P/S since it takes into consideration of the
company’s capital structure, including the company’s long-term debt and cash position (Kenton, 2019).
However, EV/Sales involves more steps and the information needed for obtaining EV is not readily
available for all companies (Hargrave, 2019). When both companies in comparison are in the same
industry and share a similar capital structure, EV/sales should result in a similar company valuation as
P/S would.

 - 23 -
Enterprise value-to-earnings-before-interest-tax-depreciation-and-amortization ratio
(EV/EBITDA)

EV/EBITDA, also known as enterprise multiple, is a widely used metric in company valuation
(Mauboussin, 2018). It is calculated as It is calculated as the company’s enterprise value divided by its
ETBITDA, which means the total market value of the company net of cash, divided by the its earnings
before interest, tax, depreciation, and amortization (Damodaran, 2019b).

 + − ℎ
 =
 , , , (3.4)

EBITDA is a measure of the company’s profits and is widely accepted and used in mergers and
acquisitions (M&A) transactions and valuation analysis (Tracy & Tracy, n.d.). However, it does has its
limits. EBITDA is subject to management manipulation and does not take into account other factors
including the risks, working capital changes, or quality of earnings (Luciano, 2003). As Douyin is a
private company, it is hard to obtain both its EV and EBITDA. Thus, we exclude the usage this
multiple in future analysis.

In our analysis, P/S ratio is used as the valuation metric for the comparable company analysis.

 - 24 -
4 Data and Analysis

Short video industry is experiencing rapid growth in recent years. As shown in Figure 4 and Figure 5,
the number of users in the short video industry in China reached 501 million in 2018, a 107% increase
from 2017; the fast growing user based create more demand in the market, pushing market size to
11.69 billion CNY in 2018, a 109.5% increase from the 5.58 billion in 2017.

 800 120.0%

 700 107.0%
 100.0%
 600
 Number of Users [mn]

 80.0%

 YoY Growth [%]
 500 73.9%

 400 57.1% 58.2% 60.0%
 722
 300 47.4% 627
 501 40.0%
 200
 25.1%
 242 20.0%
 100 15.2%
 153
 38 56 88
 0 0.0%
 2013 2014 2015 2016 2017 2018 2019* 2020*

 Number of Users [mn] YoY growth

Figure 4: Number of users in the short video industry in China, 2013-20208

Note: * represents estimates

8
 Source: iiMedia Research Group

 - 25 -
40 200.0%
 184.7% 180.0%
 35
 160.0%
 30
 Market Size [bn, CNY]

 140.0%

 YoY Growth [%]
 25 120.0%
 109.5%
 20 99.7% 38.09 100.0%

 15 80.0%

 23.35 63.1% 60.0%
 10
 40.0%
 5 11.69
 20.0%
 1.96 5.58
 0 0.0%
 2016 2017 2018 2019* 2020*

 Market Size [bn, CNY] YoY growth

Figure 5: Market size of short video industry in China, 2016-20209

Note: * represents estimates

However, as we can see from Figure 4 and Figure 5, even though both the amount of users and market
size of the industry are growing over the last years, the growth is expected to continue at a much lower
rate in the near future. The general market condition plays an important role in determining Douyin’s
future potential and would be discussed in later section.

4.1 Revenue Breakdown

To understand Douyin’s current valuation and to forecast its future potential, it is essential to
understand its cost and revenue model.

In this thesis, we propose that Douyin’s revenue source can be broken down and summarized into
the four following pillars:

9
 Source: iiMedia Research Group

 - 26 -
1. Advertisement
 a. The main type of advertisement on traditional video platforms are pre-roll adverts.
 Pre-roll advertisements are sponsored video clips that are automatically displayed
 before the actual video content (Campbell, Mattison Thompson, Grimm, & Robson,
 2017; Li & Lo, 2015). One main video could have several pre-roll ads of any length.
 However, due to the unique nature of short videos, advertisements before the each
 video would deteriorate user experience (Levy, 2017). The dominant types of
 advertisements on Douyin are, instead, initial app-opening advertisements and in-feed
 advertisements.
 i. Initial app-opening advertisements are, by literal means, displayed when users
 first open the app. It has the widest reach and can be displayed in three forms:
 images, gifs, and videos.
 ii. In-feed advertisements are displayed in user’s news feed based on their specific
 portraits. They are shown in the form of short videos, equating content to
 advertisement, and are thus more widely accepted by users.
2. Online streaming / In-app purchase
 a. As short videos on Douyin are limited to a 15-second time constraints and means of
 interaction is limited to comments, Douyin now also supports live streaming. It is
 widely used by key opinion leaders (KOL), who in turn monetize by virtual gifts sent
 by their followers. Users purchase virtual gifts with virtual currency developed by
 Douyin, which can be loaded by and converted from real money.
3. Embedded e-commerce
 a. E-commerce platforms (e.g. Alibaba) are recently introduced into the Douyin app – a
 shopping cart icon is displayed at top right corner of the video, showing the items used
 or mentioned in the respective video. This development made it more convenient for
 users to purchase the items they are interested without exiting Douyin and opening
 the shopping app. This development is currently still in the testing phase and is only
 applicable to users with more than a million followers.
4. Online & offline interactive marketing / brand campaigns
 a. As a user generated content- (UGC-) centered social video platform, Douyin’s
 characteristic cultivates a new type of advertisement. Major brands are now holding
 campaigns. With an award mechanism, these campaigns encourage and incentivize

 - 27 -
users to produce and upload UGCs that are related to the theme of the campaign. This
 way, users help to spread the adverts even further and become a medium of
 communication. Brand images are then reinforced and products are promoted at an
 exponential speed.

All revenue sources are highly dependent on the amount of users and the traffic generated. Currently,
Douyin’s revenue streams mainly from advertisement display and campaigns (T. Chen, 2017). In-app
purchase and linked e-commerce are premature and in the testing phase, respectively.

To put Douyin’s revenue model into more mathematical language, we identified the following key
parameters and summarized them in Table 1.

Table 1: Parameters used in assessment of Douyin's revenue model

 Parameter Definition
 Daily ad traffic The amount of views an ad receives per day10
 Daily Active User (DAU) The number of unique, engaged users per day11
 Daily ad impressions per user The number of ads viewed per day per user 12
 The price for display the ad per unit, based on the ad type
 Unit price / Price per ad
 (CPM, CPT, CPC, etc.)
 The frequency of ad delivery, which is the ratio of ads to
 Ad load
 other main contents 13

10
 Source: MarketingTerms, retrieved from
https://www.marketingterms.com/dictionary/web_site_traffic/
11
 Source: MixPanel, retrieved from https://mixpanel.com/topics/daily-active-users/
12 Impression is counted when an ad enters the viewable area of the screen for the user. Note that
there is no universal way in how impressions are counted – wide variety exist among different
companies. Source: Facebook (https://www.facebook.com/help/publisher/1028565693903694 ,
https://www.facebook.com/help/publisher/1995974274064245)
13
 Source: Recode, retrieved from https://www.recode.net/2017/7/15/15973750/facebook-ads-
everywhere-instagram-messenger-whatsapp

 - 28 -
We summarized Douyin’s revenue components as well as the key parameters, and organized them
into the equations below.

In-feed ad load

In-feed ad load refers to the ratio of advertisements to other contents in the feed (Wagner, 2017).

It can be calculated as the division of advertisements displayed by other contents.

 − = ∗ 100%
 (4.1)

In-feed ad revenue

Initial app opening advertisements refers to the ones that are pushed and loaded when users open the
app. Douyin charges on this type of advertisement on a cost per time (CPT) basis, where cost incurs
on a fixed time basis, usually per day or per month.

In-feed ad revenue measures the amount of revenue generated by displaying advertisements in the
feeds of Douyin. It is highly dependent on the exposure and is thus charged by the amount of views,
as a proxy for the ad visibility. Douyin uses cost per mille (CPM), which refers to cost per thousand
views; cost incurs as long as the advertisement is displayed.

It can be obtained by multiply daily advertisement traffic with unit price of advertisement display and
the number of days in a year. Daily advertisement traffic can be calculated as DAU times daily
advertisement impressions per user, which can then be obtained by the multiplication of daily usage
per user in minutes, the number of videos displayed per minute, and Douyin’s in-feed ad load.

A more straight forward way for this explanation is to convert it into mathematical formula.

 - 29 -
 − = ∗ ∗ 365

 = ∗ ∗ ∗ 365
 1000
 = ∗ ∗ ∗

 − ∗ ∗ 365
 1000
 = ∗ ∗

 ∗ ∗ 100% ∗ ∗ 365
 1000
 ∗ (4.2)

Initial app-opening ad revenue

Initial app opening advertisements refers to the ones that are pushed and loaded when users open the
app. Douyin charges on this type of advertisement on a cost per time (CPT) basis, where cost incurs
on a fixed time basis, usually per day or per month.

Here the revenue of initial app-opening advertisements can be calculated as the number of days in a
year times the cost per day.

 − = ∗ ∗ 365
 = ∗ ∗ 365 (4.3)

Campaign revenue

Campaign revenue incurs on a per time basis – the cost is charged each time when a campaign is held.

It can be calculated by multiplying the number of campaigns held per year by cost per campaign.

 = ℎ ∗ (4.4)

 - 30 -
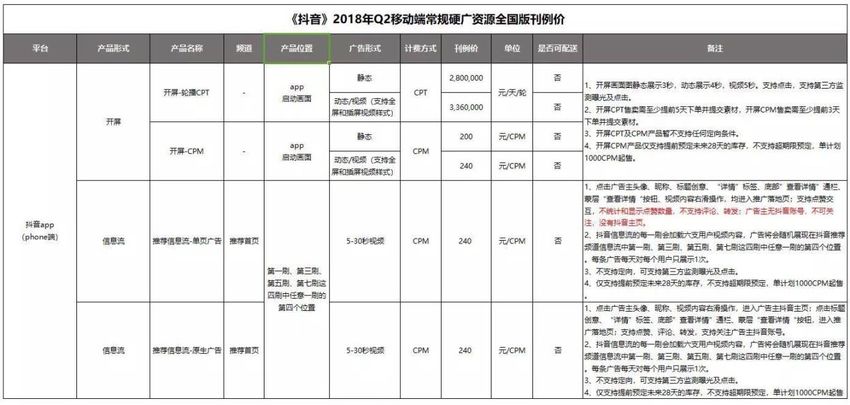
4.1.1 Revenue Analysis

As ByteDance is a privately held company and does not publish or announce any of its income, we
estimated its revenue on grounds of the main components. In order obtain a fair estimation, it is
important to look at Douyin’s pricing list, and the company’s regime of charging on the placements
of advertisements. Table 2 below describes and summarizes the most recent official pricing list
published by Douyin.

Table 2: Pricing list for advertisements on Douyin app 14

 Type of
 Product Product Cost
 Location Advertise- Price Unit Remarks
 Type Name Structure
 ment
 Stationary
 2,800,000
 / Image CNY/ day
 CPT CPT Images/ dynamic
 Dynamic / / round
 Initial 3,360,000 gifs/ videos are
 Initial screen Video
 App- displayed for
 at app opening Stationary
 Opening 200 3/4/5 seconds,
 / Picture
 CPM CPM CNY/CPM respectively
 Dynamic /
 240
 Video
 Single Each swipe loads
 page 6 UGC videos, ad
 The 4th feed of
 is displayed at
 the Video of 5-
 In-feed CPM 240 CNY/CPM random at the 4th
 1st/3rd/5th/7th 30 seconds
 Native feed of the
 swipe
 1st/3rd/5th/7th
 swipe
 Cost per CNY /
 Campaign - In app - 2,400,000 -
 campaign campaign

14
 Source: Bytdance, as of Q2 2018, http://toutiao.appun.cn/kanli/kanli.html

 - 31 -
As discussed, we broke down Douyin’s revenue stream to three main components: initial app-opening
ad, in-feed ad, and campaigns. Calculations of each component along with the totaled sum are shown
below in Table 3.

Table 3: Values of key parameters for ad and campaign revenue

 Data Value
 Daily Active User (DAU) [mn] 150
 Average Daily Usage Per User [min] 60
 Number of video clips per minute 4
 In-feed ad load 2.4%15
 Cost per view (CPM/1000) [CNY] 0.24
 Promotion factor for CPM 0.25
 Number of days in a year 365
 Estimated In-feed Ad Revenue [mn, CNY] 18,771
 Cost per time (CPT) [mn, CNY] 2.8
 Estimated Initial App-opening Ad Revenue
 1,022
 [mn, CNY]
 Number of campaigns 50
 Cost per campaign [mn, CNY] 2.4
 Estimated Campaign Revenue [mn, CNY] 120
 Estimated Total Revenue [mn, CNY] 19,913

To make sense of the values given in Table 3, certain assumptions and explanations are made:
 1. DAU is estimated at 150 million. According to third-party data from QuestMobile, the average
 DAU of Douyin in 2018 is calculated to be 137 million (QuestMobile, 2019).
 2. Average usage per day per user is estimated to be 60 minutes. According to third-party
 statistics, the average usage of Douyin per day per user in 2018 averaged 52 minutes (Iqbal,
 2019).

15
 Rounded value.

 - 32 -
3. Video clips uploaded in Douyin are subjective to a time limit of 15 seconds. In reality the
 length may vary, as accounts that fulfill certain requirements can apply for extending the limit
 up to 60 seconds. However, for simplicity reason, here we assume all videos are of a length of
 15 seconds, which gives us 4 video clips per minute.
 4. In-feed ad load is calculated according to equation (4.4) and the remarks shown in Table 2.

 1
 − = ∗ 100% = ∗ 100% ≅ 2.4%
 6∗7

 5. Per definition, CPM incurs for every thousand views. Therefore, cost per view is calculated to
 be 0.24 CNY.
 6. Table 2 shows the official pricing for advertisement for Douyin. However, promotion factor
 is usually applied in reality. Multiple sources have disclosed that the actual CPM for Douyin
 deviates from the official listing, we assume here that the actual CPM currently at 60 CNY
 ($ 8.6)16 , giving us a promotion factor of 0.25. As shown in Figure 6, the average CPM
 worldwide for social media at the end of 2018 is at the level of 6.52 USD, which is roughly 46
 CNY17, showing that 60 CNY is within reasonable range and is rather at the higher end of the
 pricing. We give this 30% premium the price because of Douyin’s increasing popularity and
 rapid growth of MAU – they offer higher bargaining power as more brands and commercials
 would like to place ads there to increase exposure and visibility. Thus giving Douyin the power
 to ask for a possibly higher price. Thus, the promotion factor of 0.25 is used here for further
 calculation.
 7. It is assumed to be 365 days in a year. Leap years, which are calendar years with 366 days, are
 not considered separately here.
 8. Initial app-opening ad is assumed to be requested and displayed all days around the year, with
 no break.
 9. We assume 50 campaigns are held per year by Douyin.

16
 Disclosed by internal staff of Douyin to media.
17
 In this thesis, the foreign exchange rate for USD/CNY is assumed to be fixed at 7(1 USD = 7
CNY, 1 CNY = 0.14 USD), long-term, unless otherwise stated.

 - 33 -
The final revenue derived in Table 3 was largely based on the assumptions made. Values might vary
in reality. In later section, we addressed all parameters separately to examine their impact to Douyin’s
future revenue growth and valuation.

 7 25%

 20%
 6
 15%
 5
 10%

 QoQ Grwoth [%]
 4 5%
 CPM [$]

 6.52 0%
 3 5.73
 5.24 5.54
 4.76 4.85 -5%
 2 4.29
 3.73
 -10%
 1
 -15%

 0 -20%
 Q1 2017 Q2 2017 Q3 2017 Q4 2017 Q1 2018 Q2 2018 Q3 2018 Q4 2018

Figure 6: Social media advertising cost-per-mille (CPM) worldwide from Q1 2017 to Q4 2018 [USD]18

4.1.1 Revenue Projection

We studied both the general market trend and company/app-specific variables to access the potential
growth of Douyin’s ad revenue in the future.

Macro market trend – short-video industry

On one hand, looking at the entire short video industry as a whole – despite the market is in general
growing in size, we see trend of decreasing proportion of revenue from the advertisements.

18
 Source: Statista

 - 34 -
Shown in Figure 7, revenues of the short video in industry in China are categorized into four main
groups based on the sources:
 1. Revenue from advertisement
 2. Revenue from paid content
 3. Revenue from copyright distribution
 4. Revenue from other sources

It is not hard to see that the proportion of revenue from advertisements decreased from 73.4% to
50.9% in 2016, and this percentage is expected to stay rather static in the following years. Revenue
from paid content is, however, gaining its space – it has been increasing over the years and the trend
is expected to continue in the future.

A very large percentage of Douyin’s revenue comes from advertisements. If we go back to the macro
market environment, Figure 5 shows that the estimated growth of market size in the upcoming years
– we can see from the graph that the growth is slowing down, with a year-on-year growth of 99.7% in
2019 and 63.1% in 2020. Combining messages behind these two figures, we can conclude that revenue
from advertisement is expected to grow at the same pace as the entire short video industry in the
following years.

So far, there exist no premium account or feature in Douyin, the revenue from paid content solely lies
on in-app purchase of virtual gifts from viewers and followers to live streamers. Living streaming is a
feature in Douyin that is still in the development stage. It faces intense competitions from existing
market-leading live-streaming apps such as Douyu, Inke, and Yizhibo – Douyin’s live-streaming
feature is yet to be mature.

As the majority of the content on Douyin are UGC and is available to be shared freely to other
platforms, the company currently has no revenue from copyright distribution. This is expected to
continue in the near future as ByteDance does not own any of the contents.

Thus, instead of sharing the market dividend from the industry growth, it is thought that Douyin’s
future growth would be more dependent on the development of company- and app-specific
parameters.

 - 35 -
100

 80
 Revenue Distribution [%]

 60

 40
 73.4 72.1
 61 57.7
 50.9 48.6 49 49.1 49.9 50.4
 20

 0
 2012 2013 2014 2015 2016 2017* 2018* 2019* 2020* 2021*

 Revenue from advertisement Revenue from paid content Revenue from copyright distribution Others

Figure 7: Revenue distribution in the online video industry in China up to 2021 19

Micro company trend – Douyin

On the other hand, we identified five parameters that are key to Douyin’s in-feed ad revenue, which
makes up a substantial amount of the company’s total revenue.
 1. Daily active user (DAU)
 2. Daily active usage per user
 3. Number of video clips per minute
 4. In-feed ad load
 5. Promotion factor

We examined these parameters separately carefully on the its possible variations in future and its
impact on Douyin’s revenue growth.

19
 Source: Statista

 - 36 -
Daily active user (DAU)

Looking at the macro environment, we could observe that, as shown in Figure 8, the penetration rate
of mobile internet in China has reached 98% in 2017 – 98 out of 100 internet users are users of the
mobile internet. This is over four folds of the penetration rate back in 2007, which was only 24%.
This huge amount of increase indicates the fast development of Chinese economy and the increasing
degree of Internet coverage but also shows that the future growth is very limited.

More specifically, if we look at the MAU of mobile Internet in China, we can see that the number is
still growing but at a slower speed, as compared to the same period last year even much slower to the
year before last year. As depicted and shown in Figure 9, the annual net gain of MAU was 61 million
in 2017 and 43 million in 2018. Looking at the growth rate, the year-on-year growth of MAU at the
end of 2018 is below 4.2%, whereas that of the end of 2017 and 2016 were 6.3% and 17.1%,
respectively. The dramatic decrease in the growth rate of MAU also indicates that the market has
reached the mature stage, potential increase in the future is restricted.

 100% 98%
 95%
 90%
 90% 86%
 81%
 80% 75%
 69%
 70% 66%
 Penetration Rate [%]

 61%
 60%

 50%
 40%
 40%

 30% 24%
 20%

 10%

 0%
 2007 2008 2009 2010 2011 2012 2013 2014 2015 2016 2017

Figure 8: Penetration rate of mobile Internet in China, 2007-201720

20
 Source: Statista

 - 37 -
1.2 1.131 25%
 1.088
 1.024 1.085
 1.0
 20%
 17.10%
 0.8

 YoY Growth [%]
 15%
 MAU [bn]

 0.6

 10%
 0.4
 6.25%
 4.24%
 5%
 0.2

 0.0 0%
 01.2017 04.2017 07.2017 10.2017 01.2018 04.2018 07.2018 10.2018

Figure 9: Development of Monthly Active Users (MAU) of mobile Internet in China, 2017-201821

Note: MAU data from 02.2018 to 11.2018 are interpolated for illustration purposes

If we take a closer look at Douyin’s user data, we can see that, shown in Figure 10, the growth of its
MAU has been slowing down. Ever since June 2018, the growth rate has been fluctuating within the
range of 2% to 10% – it is not hard to see that Douyin’s user growth has stagnated.

21 Source: QuestMobile Research Institute, QuestMobile: 2017 & 2018 China Mobile Internet Report

 - 38 -
500 200%
 450
 Number of Active Users [mn]

 400 150%
 350

 MoM Growth [%]
 300 100%
 250
 200 50%
 150
 100 0%
 50
 0 -50%

 01.2018
 02.2018
 03.2018
 01.2017
 02.2017
 03.2017
 04.2017
 05.2017
 06.2017
 07.2017
 08.2017
 09.2017
 10.2017
 11.2017
 12.2017

 04.2018
 05.2018
 06.2018
 07.2018
 08.2018
 09.2018
 10.2018
 11.2018
 12.2018
 01.2019
 MAU [mn] DAU [mn]

Figure 10: Development of monthly and daily active user of Douyin in China, 2017 – 2019, in millions 22

To give more context about the industry, we looked at the user development of Weibo and Facebook.
We chose these two companies as they are both one of the social media giants – Weibo provides
insight of the Chinese market whereas Facebook reflects the trend overseas.

Figure 11 and Figure 12 show the user development of Weibo and Facebook since they went public
in 2014 and 2010, respectively. We can see that both Weibo and Facebook have been experiencing a
rather steady growth of MAU over the years. The growth rate fluctuates in a very similar range of
Douyin. In 2018, Weibo’s MAU growth rate averaged around 5%. For Facebook, the trend is more
obvious, as the data available for Facebook’s user development spans a longer time horizon. We see
that the growth rate of MAU has significantly lowered since 2014. Over the past four years, Facebook’s
MAU growth rate has fluctuated with the range of 2% to 5%. This reinforced our assumption that the
rapid growth phase is over, Douyin has reached a rather mature stage in its user development.

22
 Source: QuestMobile, retrieved from https://www.questmobile.com.cn/research/report-new/58,
http://www.sohu.com/a/298518542_100005778

 - 39 -
500 16%
 450 14%
 Number of Active Users [mn]

 400
 12%
 350

 QoQ Growth [%]
 300 10%

 250 8%
 200 6%
 150
 4%
 100
 50 2%

 0 0%
 Q1 Q2 Q3 Q4 Q1 Q2 Q3 Q4 Q1 Q2 Q3 Q4 Q1 Q2 Q3 Q4 Q1 Q2 Q3 Q4
 2014 2014 2014 2014 2015 2015 2015 2015 2016 2016 2016 2016 2017 2017 2017 2017 2018 2018 2018 2018

 MAU [mn] DAU [mn]

Figure 11: Development of monthly and daily active user of Weibo worldwide, 2014 – 2018, in millions23

 2500 16%

 14%
 Number of Active Users [mn]

 2000
 12%

 QoQ Growth [%]
 1500 10%

 8%
 1000 6%

 4%
 500
 2%

 0 0%
 Q4 2010

 Q3 2013

 Q3 2015

 Q2 2016

 Q2 2018
 Q1 2010
 Q2 2010
 Q3 2010

 Q1 2011
 Q2 2011
 Q3 2011
 Q4 2011
 Q1 2012
 Q2 2012
 Q3 2012
 Q4 2012
 Q1 2013
 Q2 2013

 Q4 2013
 Q1 2014
 Q2 2014
 Q3 2014
 Q4 2014
 Q1 2015
 Q2 2015

 Q4 2015
 Q1 2016

 Q3 2016
 Q4 2016
 Q1 2017
 Q2 2017
 Q3 2017
 Q4 2017
 Q1 2018

 Q3 2018
 Q4 2018

 MAU [mn] DAU [mn]

Figure 12:Development of monthly and daily active users of Facebook worldwide, 2010 – 2018, in millions24

23
 Source: Weibo Annual Report, 2014 - 2018
24
 Source: Facebook Annual Report, 2010-2018

 - 40 -
Alongside MAU growth, there is also one important metric in determining the potential growth of
DAU – user stickiness. User stickiness refers to user’s willingness to return to and repeatedly use the
product (Chiang & Hsiao, 2015). In other words, it shows the frequency of user engagement of on
certain product. To put it in a quantifiable term, user stickiness can be explained by the ratio of DAU
to MAU (DAU/MAU) – the proportion of monthly users who use the product on a daily basis. A
DAU/MAU of 50% means that on average, users use the app 15 days out of a month; a DAU/MAU
of 100%, with the same principle, then reflects the every-day usage of the app in a month.

Figure 13 depicted the development of user stickiness of Douyin, Weibo, Facebook, and Douyin’s
biggest competitor in China – Kuaishou. We observe that the user stickiness of the two short video
apps are clearly lower than Facebook, but are slightly higher than Weibo. However, as Facebook and
Weibo has been established for a longer time period thus are at a rather mature stage, it makes limited
sense to compare Douyin with them – though it gives an overview on the industry.

 70%

 60%

 50%

 40%

 30%

 20%

 10%

 0%
 Q2 2011

 Q1 2012

 Q3 2015

 Q2 2016
 Q1 2010
 Q2 2010
 Q3 2010
 Q4 2010
 Q1 2011

 Q3 2011
 Q4 2011

 Q2 2012
 Q3 2012
 Q4 2012
 Q1 2013
 Q2 2013
 Q3 2013
 Q4 2013
 Q1 2014
 Q2 2014
 Q3 2014
 Q4 2014
 Q1 2015
 Q2 2015

 Q4 2015
 Q1 2016

 Q3 2016
 Q4 2016
 Q1 2017
 Q2 2017
 Q3 2017
 Q4 2017
 Q1 2018
 Q2 2018
 Q3 2018
 Q4 2018

 Douyin Kuaishou Weibo Facebook

Figure 13: Development of user stickiness of Douyin, Kuaishou, Weibo, and Facebook 25

Zooming in to look closer into the two competitors, Douyin’s users seem to be less ‘sticky’ than
Kuaishou – users of Kuaishou use the app on more days than those of Douyin do. Founded in 2011

25
 Source: Weibo Annual Report, 2014 – 2018; Facebook Annual Report, 2010 – 2018; QuestMobile

 - 41 -
as a photo-sharing app, Kuaishou later pivoted into a platform that allows users to create and share
short videos. Backed by the tech giant Tencent, Kuaishou also has a gaming interface and allows users
to play mini-games within the app without downloading and registering for another stand-alone app
separately (Huang, 2018). Serving almost the same function with highly similar features, Kuaishou and
Douyin has a large amount of overlapping users. By December 2018, Kuaishou sported a MAU of
285 million (QuestMobile, 2019). Kuaishou’s business model is also very similar to Douyin, with
advertising as the substantial part of its revenue. We therefore think Kuaishou is a good proxy to
compare Douyin’s user stickiness to.

From Figure 14 we can see that Douyin’s user stickiness has been around 48% for most of the 2018
and shows no sign of improvement. As said, user stickiness is critical in social media as it reflects the
actual engagement level, which can also be seen as customer’s loyalty. The flat curve of Douyin’s user
stickiness also implies that the user growth is very likely stagnated at its current status.

 70%

 56% 56% 58% 58%
 60% 53%
 52% 51%
 48% 48% 49%
 50% 47% 46% 47%
 DAU/MAU [%]

 48% 49% 50% 50% 49% 49%
 47% 48% 47%
 40% 46%
 41%
 30% 36% 37%

 20%

 10%

 0%

 Douyin Kuaishou

Figure 14: Development of user stickiness of Douyin and Kuaishou, 2018-201926

We projected Douyin’s future growth of MAU and DAU to support and justify the argument. The
result is shown in Figure 15 below.

26
 Source: QuestMobile

 - 42 -
You can also read