On Atlas and Mercury User Manual - Procentec
←
→
Page content transcription
If your browser does not render page correctly, please read the page content below
on Atlas and Mercury
     User Manual
Safety Guidelines
This manual contains notices which you should observe to ensure your own personal safety, as well as to
protect the product and connected equipment. These notices are highlighted in the manual by a warning sign
and are marked as followed according to the level of danger:
Draws your attention to important information on handling the product, a particular part of the
documentation or the correct functioning of the product.
Warning
This device and its components may only be used for the applications described in this manual and only in
connection with devices or components that comply with Industrial Ethernet interfaces.
This product can only function correctly and safely if it is transported, stored, set up, installed, operated and
maintained as recommended. Atlas and/ or Mercury is a CE class A product. In a domestic environment it may
cause radio interference in which case the user may be required to take adequate measures.
Warranty
Warranty is void if you open Atlas and/or Mercury.
Qualified Technicians
Only qualified technicians should be allowed to install and work with this equipment. Qualified technicians are
defined as persons who are authorized to commission, to ground, to tag circuits and systems in accordance
with established safety practices and standards. It is recommended that the technicians carry a Certified
PROFINET Installer or Certified PROFINET Engineer certificate.
Disclaimer of Liability
We have checked the contents of this manual as much as possible. Since deviations cannot be precluded
entirely, we cannot guarantee full agreement. However, the content in this manual is reviewed regularly and
necessary corrections will be included in subsequent editions. Suggestions for improvements are welcome.
Copyright © 2019 PROCENTEC
All rights reserved. No part of this publication may be reproduced, stored in a retrieval system, or transmitted,
in any form or by any means, electronic, mechanical, photocopying, recording or otherwise, without the prior
written permission of the publisher.
Osiris / Atlas / Mercury | User Manual v1.1.70 | January 2019 | © PROCENTEC 2/81
Important information
Purpose of the Manual
This user manual provides information how to work with Alas or Mercury.
Mercury is based on Panasonic Thoughpad FZ-M1 tablet. This manual does not describe usage of the tablet
itself. For a manual of the tablet, refer to the manual of FZ-M1 on the Panasonic website
Support
In case of a defective product or unanswered questions, please get in contact with the support department:
T: +31-(0)174-671800
F: +31-(0)174-671801
E: support@procentec.com
Recycling and Disposal
The parts of the Mercury can be recycled.
“WARNING, BATTERY INSIDE; Battery may explode if mistreated. Do not disassemble or dispose of
in fire. Dispose product according to the instructions"
For further information about environment-friendly recycling and the procedure for the disposing of your old
equipment, please contact:
PROCENTEC
Klopperman 16
2292 JD WATERINGEN
The Netherlands
T: +31-(0)174-671800
F: +31-(0)174-671801
E: info@procentec.com
Document Updates
You can obtain constantly updated information on PROCENTEC products on the Internet at
www.procentec.com
Osiris / Atlas / Mercury | User Manual v1.1.70 | January 2019 | © PROCENTEC 3/81
Table of contents

Important information ........................................................................................... 3
1.     Product description ....................................................................................... 7
       1.1     Introduction .......................................................................................................................................7
       1.2     Your benefits .....................................................................................................................................7
       1.3     Product features ................................................................................................................................7
       1.4     System requirements ........................................................................................................................7

2.     Atlas ............................................................................................................... 8
       2.1     Quick Start .........................................................................................................................................8
       2.2     Atlas installation instructions ............................................................................................................8
       2.2.1   Location .............................................................................................................................................8
       2.2.2   Position ..............................................................................................................................................9
       2.2.3   Ethernet connections ........................................................................................................................9

3.     Mercury ....................................................................................................... 11
       3.1     Quick Start .......................................................................................................................................11

4.     Osiris User interface .................................................................................... 12
       4.1     Terminology and definitions ............................................................................................................12
       4.2     System buttons ................................................................................................................................13
       4.3     Measurement Button ......................................................................................................................13
       4.4     Current User ....................................................................................................................................14
       4.5     Notifications ....................................................................................................................................14
       4.6     Online Help ......................................................................................................................................14
       4.7     Application Menu ............................................................................................................................14

5.     Setup Wizard ............................................................................................... 16
6.     Device mode (Mercury only) ....................................................................... 17
7.     Device mode: Industrial Ethernet ................................................................ 18
       7.1     Dashboard .......................................................................................................................................18
       7.1.1   Dashboard organization ..................................................................................................................18
       7.1.2   Customize Dashboard ......................................................................................................................18
       7.1.3   User administration .........................................................................................................................19
       7.1.4   Default users....................................................................................................................................20
       7.1.5   Password best practice ....................................................................................................................21
       7.2     Starting a measurement ..................................................................................................................21
       7.3     Topology ..........................................................................................................................................21
       7.3.1   View types .......................................................................................................................................21
       7.3.2   Galaxy view ......................................................................................................................................22
       7.3.3   Tree view .........................................................................................................................................22
       7.3.4   Custom view ....................................................................................................................................23
       7.3.5   Graph search ...................................................................................................................................24
       7.3.6   Device types in the Topology view ..................................................................................................24
       7.3.7   Device status indicators in the Topology view ................................................................................26
       7.3.8   Link indicators in the Topology view ...............................................................................................26

Osiris / Atlas / Mercury | User Manual v1.1.70 | January 2019 | © PROCENTEC                                                                                    4/81
7.3.9    Protocol indicators in the Topology view ........................................................................................27
      7.3.10   Device details...................................................................................................................................27
      7.4      Q-Factor ...........................................................................................................................................30
      7.4.1    Multiple Q-Factors ...........................................................................................................................30
      7.5      Traffic Light ......................................................................................................................................31
      7.5.1    Traffic light state explained .............................................................................................................31
      7.5.2    Traffic light triggers..........................................................................................................................31
      7.6      Device list.........................................................................................................................................32
      7.6.1    Table customization ........................................................................................................................32
      7.6.2    Available columns ............................................................................................................................33
      7.7      Trending...........................................................................................................................................35
      7.8      Report ..............................................................................................................................................36
      7.9      OPC UA ............................................................................................................................................37
      7.10     E-mail Notifications .........................................................................................................................37
      7.11     IXON VPN service (Atlas only)..........................................................................................................37
      7.11.1   Configure a VPN Service on your device..........................................................................................38
      7.11.2   How to use IXON VPN ......................................................................................................................39
      7.12     Commissioning Wizard ....................................................................................................................41
      7.12.1   Starting the Commissioning Wizard ................................................................................................41
      7.12.2   Quickscan.........................................................................................................................................42
      7.12.3   Commissioning ................................................................................................................................42

8.    Device mode: PROFIBUS (Mercury only) ..................................................... 43
      8.1      Dashboard .......................................................................................................................................43
      8.1.1    Network status ................................................................................................................................43
      8.1.2    Q-Factor ...........................................................................................................................................48
      8.1.3    Scope ...............................................................................................................................................49
      8.1.4    Bargraph ..........................................................................................................................................50
      8.1.5    Messages .........................................................................................................................................51
      8.1.6    GSD Management............................................................................................................................52

9.    Settings ........................................................................................................ 54
      9.1      General tab ......................................................................................................................................54
      9.2      User tab ...........................................................................................................................................54
      9.3      Date & time .....................................................................................................................................55
      9.4      Ethernet (office) & Ethernet (factory) (Atlas only) ..........................................................................55
      9.5      Network monitoring ........................................................................................................................57
      9.6      Email ..............................................................................................................................................57
      9.7      System .............................................................................................................................................58
      9.8      Updates ...........................................................................................................................................58
      9.9      About ..............................................................................................................................................59
      9.10     License Manager ..............................................................................................................................59
      9.10.1   How to upload a new license file .....................................................................................................60

10. Updating the firmware ................................................................................ 61
      10.1     Updating Atlas version 1.0.32 ..........................................................................................................61

11. Resetting Osiris to factory defaults ............................................................. 63
      11.1     On Atlas ...........................................................................................................................................63
      11.2     On Mercury......................................................................................................................................63
      11.3     Using the Settings in the web interface...........................................................................................64

Osiris / Atlas / Mercury | User Manual v1.1.70 | January 2019 | © PROCENTEC                                                                                   5/81
12. Firewall settings ........................................................................................... 65
13. Technical specifications Atlas ...................................................................... 66
14. Technical specifications Mercury ................................................................ 68
15. Order codes ................................................................................................. 70
16. Certificates ................................................................................................... 73
17. Sales offices and distributors ....................................................................... 74
18. About PROCENTEC ....................................................................................... 79
19. Notes ........................................................................................................... 80

Osiris / Atlas / Mercury | User Manual v1.1.70 | January 2019 | © PROCENTEC                                       6/81
1. Product description

1.1 Introduction
PROCENTEC’s Osiris on Atlas and Mercury is the solution for monitoring and diagnosing Ethernet networks,
where innovative simplicity and predictive capabilities are desired. The tool is perfect for preventing
unexpected and expensive downtime within industrial Ethernet networks.

PROCENTEC’s Osiris provides unique insight in your networks health and topology. With PROCENTEC Osiris
operators and engineers can easily detect problems and find their causes within your network. This prevents
costly down times.

The ease of use and clear overview makes this an ideal solution for the complete understanding of networks,
always and anywhere. Atlas is a compact device that can be installed on a DIN rail and plugged in to the
network, and Mercury is the portable version. Osiris does not require additional and time-consuming software
installations on the PC. You can get all the information using a custom designed web application. All the
information Osiris provides can be viewed on the central, customizable dashboard page.

1.2 Your benefits
     •   Ease of use
     •   Use of Industrial Ethernet
     •   Topology
     •   Standalone device, 24/7 available
     •   Safe use
     •   Customizable dashboard
     •   Resistant to all environmental factors
     •   No software required

1.3 Product features
     •   Network Topology
     •   Customizable dashboard
     •   Network Quality Factor
     •   Alarms
     •   Not vendor or protocol specific

1.4 System requirements
Osiris runs on any browser-enabled computer; the interface is fully web based.
HTML5 and JavaScript must be supported by the browser.

The minimum version requirements for web browsers are:
    • Chrome                   version 46 or higher
    • Edge                     version 25 or higher
    • Firefox                  version 42 or higher
    • Safari                   version 5 or higher

For optimal experience it is recommended to use Chrome.
Internet Explorer is not supported.

Osiris / Atlas / Mercury | User Manual v1.1.70 | January 2019 | © PROCENTEC                              7/81
2. Atlas

2.1 Quick Start
This checklist describes all the steps to a quick usage of Atlas.

     Step:    Instructions:

     STEP 1 Install the device on a DIN rail.

     STEP 2 Connect the Office port to your laptop and the Factory port to the factory
            network. The factory side should NOT be connected to a mirror port of a
            switch.

     STEP 3 Connect the Atlas to a power supply. Wait until the green RDY LED is on.

     STEP 4 Set your laptops IP address to 192.168.1.1 and the netmask to
            255.255.255.0.

     STEP 5 Open a web browser and go to https://192.168.1.10/. You will receive a
            warning about the certificate:
            •   Chrome users should click ‘ADVANCED followed by ‘Proceed ..’
            •   Edge users should click ‘Continue to this website ..’

     STEP 6 Enter user ‘admin’ and password ‘admin’ for the first login.

     STEP 7 Now complete the Setup Wizard but do not change the settings of Office port
            yet.

     STEP 8 Now setup the Office port in the Settings, unplug your laptop and connect
            the Office port to the office network.

     The Atlas is now operational. From here you can change settings, layout and behavior
     of the Atlas. If connected to a factory network, it will start scanning and gathering information.

2.2 Atlas installation instructions

2.2.1 Location

Atlas can be installed anywhere in a non-hazardous / non-Ex area that complies with IP 20 (DIN 40 050) and the
specified temperature range of -20 o to +60 o Celsius. Do not install the Atlas in a humid or dusty environment.
To comply with UL certification regulations, in ambient temperatures higher than 55oC or 131oF it is mandatory
to install the Atlas in an industrial installation cabinet with the “HOT HOUSING” warning label visible during
operation.

Osiris / Atlas / Mercury | User Manual v1.1.70 | January 2019 | © PROCENTEC                                8/81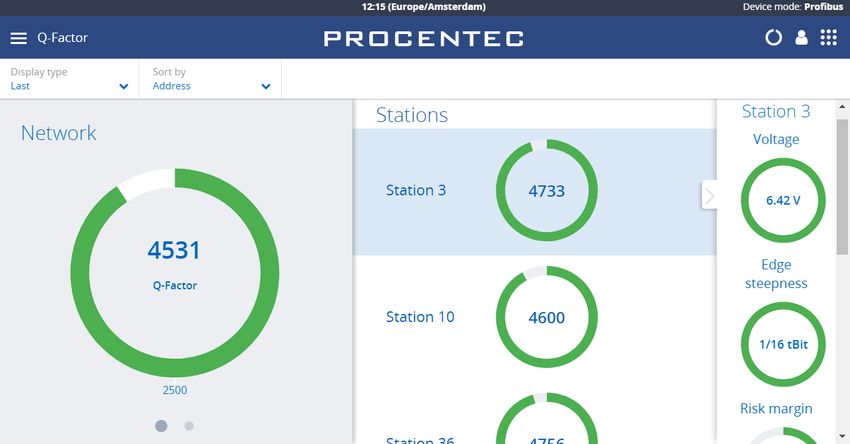
“WARNING, HOT HOUSING. When in use at an ambient temperature higher than
          55oC or 131oF, the housing of the Atlas will be hot. Do not touch the housing!”

To comply with UL certification regulations the Atlas is to be used at altitudes not exceeding 2000m and in non-
tropical climate regions only.

2.2.2 Position

Atlas can only be installed on a horizontal 35mm DIN rail
with the front plates facing forward (see Figure 2 for an
example). In this position the generated heat of the module
can escape through the grid in the top of the housing. It is
also easier to read the status LEDs. Do not install the Atlas
in any other position, this could lead to overheating of the
device.

2.2.3 Power supply

The Atlas contains a 3-pin screw type power connector on
the front.

The layout is as follows:
1 = - (upper pin)
2 = + (middle pin)
3 = SH (lower pin)

The power supply must comply with the following
specifications:
     •    Voltage: 12 .. 24 VDC
     •    Wire diameter: < 2.5 mm2
                                                                Figure 1 – Atlas mounted on a 35mm DIN rail

For more information about the power supply see chapter 13 Technical specifications.

After the power has been connected, Atlas will boot up. This process can take up to 90 seconds. When it is
booted, the green RDY LED will go on. You will see the Network Status LED blink yellow as long as the Setup
Wizard has not been completed and a measurement has not been started.

2.2.4 Ethernet connections

The Atlas has two physical network interfaces named Office and Factory. The networks are not connected with
each other one-on-one. The scanning, measuring and reporting of the network does not occur on the Office
side, only on the Factory side.

The Atlas may be connected anywhere in the Factory network. Do not use Mirror ports.

Please note: the web interface can be reached on the Office and the Factory network IP range. So it does not
matter where you are connected, as long as you have set the correct IP range and netmask settings of your

Osiris / Atlas / Mercury | User Manual v1.1.70 | January 2019 | © PROCENTEC                                   9/81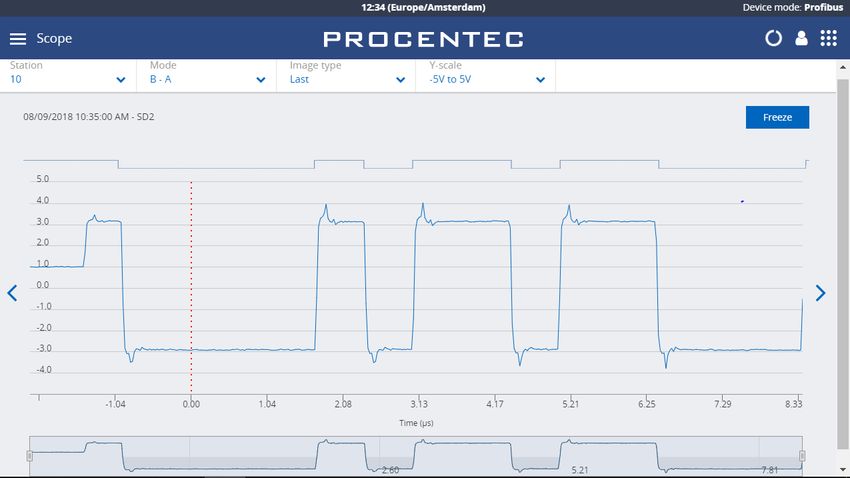
laptop/client network card. You will only be able to scan and see the devices connected to the Factory
network, not the Office network.

Pointers about the IP-address configuration:
In case your office and factory share the same (sub)network you should not connect and configure the Office
port. Just make sure that the default Office IP-address does not exist on your network and uses a non-existing
subnet. In case your company network does use the 192.168.1.0/24 subnet, please change the IP-address to be
part of a non-existing network, for example 192.168.100.10/24.

                Office network
      Example IP range: 192.168.8.x
     Subnetmask: 255.255.252.0
                                                          Factory network
                                                                    Example IP range: 10.0.16.x
                                                                    Subnetmask: 255.255.254.0

                                      Atlas

For a description on how to use Atlas, read on from chapter 5.

Osiris / Atlas / Mercury | User Manual v1.1.70 | January 2019 | © PROCENTEC                              10/81
3. Mercury
3.1 Quick Start
Step: Instructions: :
STEP 1 Switch on the Mercury by pressing the power button on the top.
STEP 2 Log in by entering your Windows username and/or password/pincode .
STEP 3 Double-click on the OsirisControl icon on the desktop. When Osiris starts, it
will show a login window.
STEP 4 Use user ‘admin’ and password ‘admin’ for the first login.
STEP 5 Complete the Setup Wizard by entering the requested details.
STEP 6 Connect the RJ45 port of Mercury to an empty port of the factory network
(do not use a mirror port).
The Mercury is now operational. From here you can change settings, layout and behavior. If connected
to a factory network, it will start scanning and gathering information.
Osiris / Atlas / Mercury | User Manual v1.1.70 | January 2019 | © PROCENTEC 11/814. Osiris User interface
Osiris displays all information by means of a web page. To access this information, simply open a web browser
and type in the IP-address of your device (for Atlas the default address is 192.168.1.10 for the Office side and
192.168.0.10 for the Factory side; for Mercury, simply double-click on the OsirisControl icon on the desktop).
4.1 Terminology and definitions
In this manual the following terms and definitions are used to refer to items in the web interface.
Batt indicator*
Quick Access Drawer System Bar Tool Bar
Device mode
Tile Application Bar Indicator System buttons
Figure 4 - Terminology used in the web interface
*Note: When using Osiris on a Mercury, a battery indicator icon will be present on the top-right corner of the
System Bar. The Atlas does not have this indicator.
Osiris / Atlas / Mercury | User Manual v1.1.70 | January 2019 | © PROCENTEC 12/81Location Icon Column options Table Options
BarApplication
Figure 5 - Terminology used in the web interface (continued)
4.2 System buttons
The right upper corner of the Application Bar shows five
Measurement Status
(context sensitive)
buttons. These are the system buttons. They are all clickable
Application Menu
and will give extra information or functionality.
Current User
Notifications
Online Help
Indicator
4.3 Measurement Button
When clicking the spinning measurement button, a dropdown
menu will show. This dropdown shows how long the
measurement is running. . Atlas is a permanent monitoring
tool, therefore measurement will always run. In case of
Mercury you can start/stop a measurement from this menu.
The Change measurement button allows you to quickly change
your settings by sending you to the setup wizard. Thirdly there
is a button to clear (measurement) data. When the Clear data
button is pressed, a popup will ask the user to confirming
clearing the measurement data. When pressing “Yes” all errors and notifications will be deleted. This will not
affect the trending data related to the current measurement, settings configuration, custom topology views, or
the notifications log file which may be exported.
Osiris / Atlas / Mercury | User Manual v1.1.70 | January 2019 | © PROCENTEC 13/814.4 Current User
Clicking the current user button shows the current user and
the logout button.
4.5 Notifications
The notification bell adjusts it’s color if notifications are
present. In properly working networks the bell is green. In
case there are warning it turns orange. Error conditions on
your network lead to a red bell. Clicking the icon will bring up
the list of notifications. There are three types of notifications:
Non-critical user information, such as: ‘Your factory
network is now connected’
Warning notification, such as: ‘Ping response time
exceeded’
Critical errors and warnings, such as: ‘Error level for
Discards exceeded’
By clicking ´Clear´ all the notifications from this list are cleared. Internally the notifications aren’t removed and
are therefore still available for CSV export.
By clicking ´Export All (CSV)´ you can download a full history of all the notifications regardless of any previous
clearings of the list. This downloadable file is in CSV format which can be directly opened in spreadsheet
software like Microsoft Excel. Errors generated by ignored devices will also be in this list.
4.6 Online Help
The online help function provides specific help on the page
you are currently viewing. This means that, for example on the
dashboard, it will show help information for the dashboard.
4.7 Application Menu
Within the Application menu there is a function to generate a
Report. See paragraph 7.8 about what the generation of the
report includes.
The Report generator can be found in the application menu.
The report feature allows you to generate a report with all
relevant collected data of the network and general
information:
• Osiris information
• Q-Factor
Osiris / Atlas / Mercury | User Manual v1.1.70 | January 2019 | © PROCENTEC 14/81• Device List
• Ignored Devices
• Traffic Light
• Firmware Differences
Before generating the Report you need to fill in some mandatory details (marked in red). These details will be
shown in the Report.
Please note that the Report window is opened in a separate browser tab. Make sure your browser doesn’t
block opening new tabs. If you use a pop-up blocker, white-list the IP address of your Osiris device.
Osiris / Atlas / Mercury | User Manual v1.1.70 | January 2019 | © PROCENTEC 15/815. 5. Setup Wizard The Setup Wizard helps you setting up the Osiris software for use in your networks and is automatically started at first use. It can also be accessed after initial setup by clicking the Setup Wizard tile on the Dashboard. Step 1 Select the language. Over time, more interface languages will be released and available for download in the ‘Download Software’ section on www.procentec.com. Setting a language will take effect after the Setup Wizard has been completed. Set the correct time zone. The time zone will be will be used to show the time in the top of the web interface (system bar) and in the reports. Automatic time (NTP) can only be used when Osiris has internet connectivity or when you manually set local time servers in the settings after the Setup Wizard has completed. See paragraph 9.3 for more information. Step 2 Next, fill in the name and the location of the industrial network. This name will be used in the web interface and reports. You can also enter optional contact details for colleagues in need of assistance. Step 3 Then choose an Office and a Factory network IP address. The Office IP address and the Factory IP address must be set to the correct IP ranges with correct Netmasks. If you do not know these, use the DHCP setting or contact your system administrator and / or the machine programmer for correct settings. Note that these two settings are independent of each other and the networks do not ‘see’ each other. There is no direct connection between the two ports. Important: it is required that the office IP range and factory IP range are different from each other, and that their subnet masks do not overlap. Also, only enter one gateway, preferably the one for the office interface Step 4 The last step asks you to enter one or more IP address scan ranges. It is important to choose scan ranges which include all the devices which you want to monitor. On the other hand, making the scan range unnecessarily large can negatively influence the Topology scan result and scan time. In case there are large gaps between devices on your network, it is advised to separate a large scan range into smaller ranges to exclude these gaps. This will speed up the scanning process. Osiris / Atlas / Mercury | User Manual v1.1.70 | January 2019 | © PROCENTEC 16/81
6. Device mode (Mercury only)

Osiris has two modes; a PROFIBUS network analyzer (Not available on Atlas), and an Industrial Ethernet
analyzer. Tap on one of the options to start the preferred mode:

You can see the currently selected device mode in the upper notification bar on the right side.

If at some point you need to change to another mode, tap the Quick Access Drawer button and click ‘Device
mode’. This will bring you back to the Device Mode selection screen.

For the Industrial Ethernet mode, continue on Chapter 7. For PROFIBUS mode continue on Chapter 8.

Osiris / Atlas / Mercury | User Manual v1.1.70 | January 2019 | © PROCENTEC                              17/81
7. Device mode: Industrial Ethernet

7.1 Dashboard
The dashboard is a one-stop-shop and overview with access to all available functions through Tiles.
Tiles can be a static picture, but some are also dynamic. These dynamic tiles show an online summary of its
information. This way you have a quick and intuitive way to access information. Some tiles also have a general
status indication in the upper left corner of the tile (green checkmark, orange exclamation or red cross). This is
a uniform way, so you can see quickly if there are problems which need attention.

7.1.1 Dashboard organization

The dashboard is a matrix of tiles and can be organized in 3 different ways:

     •   Show all: All available tiles are shown in a fixed arrangement
     •   Show recommended: Only tiles are shown which PROCENTEC deems most important
     •   Show customized (see paragraph 7.1.2)

7.1.2 Customize Dashboard

To customize the Dashboard, follow the next steps:

     •   In the Dashboard, go to the upper left corner and click on ‘Display type’. Then choose ‘Show
         customized’.
     •   On the upper right part, select ‘Edit dashboard’.
     •   An empty tile placeholder(s) will appear, marked with a ‘+’ sign.
     •   By clicking on the ‘+’ sign a popup window will appear.
     •   Select the tile you would like to place by clicking on it.
     •   The popup will close and the tile will be placed.
     •   During edit mode you can drag and drop to a desired grid location.
     •   By pressing the ‘trashcan’ icon in the lower right part of the tile you can delete the tile.
     •   When all changes have been made, select ‘Save changes’ in the upper right corner

This saved personalized dashboard will remain available after a logout or restart. These settings are stored in a
browser session, so this is a personalized setting for a specific user, computer and browser. Opening a
customized Dashboard on a different computer or browser will result in a default view.

Osiris / Atlas / Mercury | User Manual v1.1.70 | January 2019 | © PROCENTEC                                  18/81
7.1.3 User administration Osiris can be protected against unauthorized access or changing of settings. With means of user rights administration you can control the level of authentication a certain user (or group of users) has. The default password for an account is the same as the username. So the password for the admin account is admin. All letters are lowercase, also for the username. The default passwords can be changed in the Settings menu. Click on the Quick Drawer Access button and , click ‘Settings’ or double-click on the System Bar (admin only) and click on the icon. Then choose the ‘User’ tab. Osiris / Atlas / Mercury | User Manual v1.1.70 | January 2019 | © PROCENTEC 19/81
7.1.4 Default users

There are three default usernames: admin, engineer and operator. They have the following rights, restrictions
and capabilities for the Ethernet device mode:

  Action                                                    admin        engineer      operator

  View the Traffic Light                                      Yes           Yes          Yes

  View the Notifications                                      Yes           Yes          Yes

  View the Settings                                           Yes           Yes          Yes

  View/use the Commissioning Wizard                           Yes           Yes          Yes

  View/use the Email settings                                 Yes           Yes          Yes

  Clear the Traffic Light                                     Yes           Yes          No

  Clear the Notifications                                     Yes           Yes          No

  Clear the Measurement Data                                  Yes           Yes          No

  Customize the Dashboard (add/remove tiles)                  Yes           Yes          No

  View/use the Trending page                                  Yes           Yes          No

  View/use the OPC UA page                                    Yes           Yes          No

  View/use the Topology page                                  Yes           Yes          No

  View/use the Q-Factor page                                  Yes           Yes          No

  View/use the Device List page                               Yes           Yes          No

  View/use the VPN page                                       Yes           Yes          No

  View/use the Commissioning Wizard                           Yes           Yes          No

  View/use the ‘Factory Reset’ button                         Yes           No           No

  View/use the System Bar                                     Yes           No           No

  View/use the Setup Wizard                                   Yes           No           No

  Edit the users and passwords                                Yes           No           No

  Edit Osiris settings                                        Yes           No           No

All user types have access rights for all the pages inside the PROFIBUS device mode.

Osiris / Atlas / Mercury | User Manual v1.1.70 | January 2019 | © PROCENTEC                             20/81
7.1.5 Password best practice

We encourage you to change the default Administrator password after purchase.

     •   Change the password(s) immediately after installation or at the office before it is transported to the
         final destination.
     •   Never share passwords with anyone.
     •   Always use strong passwords. Avoid: test, 123456, , , Atlas,
         PROCENTEC, etc.
     •   Change passwords immediately if they may have been compromised.
     •   If passwords must be written down, store it in a secure place and destroy it when it is no longer
         needed.
     •   Be careful about where passwords are saved on computers. Some dialog boxes, such as those for
         remote access, present an option to save or remember passwords. Selecting this option poses a
         potential security threat.

7.2 Starting a measurement
When Osiris has been set up and connected, start a new
measurement by clicking on the round progress indicator in the
System Buttons area, and click ‘Start’.

To indicate the measurement is running, you will now see a
spinning progress indicator.

When the measurement has collected enough information, the
Topology, Q-factor, Traffic Light and Device List will become
available.

7.3 Topology
The topology is a graphical and hierarchical display of a complete network. This view
makes connections between devices become clear very quickly and intuitively. This view
also clearly shows dependencies to easily identify/mitigate critical paths in the network,
or to identify line-depths.

The underlying mechanism to be able to determine a topology is based on SNMP and, if possible, specific
industrial protocol functions (e.g. LLPD for PROFINET) will also be used. Unfortunately, some devices do not
(properly) supply topology information. These are connected either to a question mark icon or are placed as
stand-alone devices. The devices linked to a question mark icon and then in turn to other devices means the
connection information is only partly known. In many of those cases it can also be that non-managed switches
are used.

7.3.1 View types

There are two default views to choose from: Galaxy and Tree. Next to the default views it is possible to create
custom views.

Osiris / Atlas / Mercury | User Manual v1.1.70 | January 2019 | © PROCENTEC                                21/81
7.3.2 Galaxy view The Galaxy view shows a self-organizing network diagram where switches are shown as central devices. In the Galaxy view user devices can be dragged to other positions. When dragging a device to a new place, the topology will automatically be re-arranged. 7.3.3 Tree view The tree view shows a self-organizing layered overview using a top-down organization. In the tree view it is possible to click on a device which will show the device details panel. Within this panel there is an extra button to assign a top node. When setting a device as top node, the tree view will be re-organized with the selected device at the top. Osiris / Atlas / Mercury | User Manual v1.1.70 | January 2019 | © PROCENTEC 22/81
7.3.4 Custom view

From within the galaxy view it is possible to create custom views. Click ‘Create view’ and assign a name to the
view. A grid appears on the background; now all devices have a fixed position which can be changed by
dragging them around. The positions will be saved automatically, can be viewed and edited in multiple
browsers and are persistent over a restart. Also it is possible to rename or delete a custom view the Delete and
Rename buttons

In all views, devices are connected to each other with lines. These connections between devices show how
these are connected to each other and how they are co-dependent. In this overview it is much easier to
understand that if a device is lost, it will affect the connection to other devices behind it. Lost devices are
indicated with a red cross over the device icon. Link problems between devices are indicated with a red cross

Osiris / Atlas / Mercury | User Manual v1.1.70 | January 2019 | © PROCENTEC                                23/81
on that particular link. The two numbers shown on both ends of the link lines, specify the port number used for
this link.

7.3.5 Graph search
To easily find devices in the Topology view, click on the magnifier icon in the top left of the Topology view. This
will show an input field, where you can enter a name, IP address or MAC address of the desired device.
Autocomplete will help you to quickly find the device you’re looking for. When clicked on, the topology zooms
in on the requested device and opens the device details.

7.3.6 Device types in the Topology view

The following icons are used for devices in the Topology view.

 Icon                Meaning

                     This is your current Atlas, the one you’re currently connected to via your browser.

                     The yellow halo indicates the selected node.

                     This is another Atlas in the network.

                     This is an I/O controller. The label next to the device indicates the supported industrial
                     protocol.

                     This is an I/O device. The label next to the device indicates the supported industrial
                     protocol.

                     This is a managed switch.

                     This is a Wi-Fi access point.

Osiris / Atlas / Mercury | User Manual v1.1.70 | January 2019 | © PROCENTEC                                   24/81
This is a Wi-Fi group access point, with two or more devices connected to its copper
port(s).
This is a ComBricks Head Station.
This is a generic Ethernet node, such as a PC or laptop that does not support SNMP.
The devices in (and connected to) this group cannot be accurately placed in the
Topology. This is because the necessary data to do so cannot be obtained. There are
multiple explanations for this problem:
1 It is an unmanaged switch. This is a standard switch that does not supply data to
determine the topology of the network.
2 It is a device that does not supply correct data.
Note: PROFINET devices certified after v2.3 must have all the required data for
Topology as defined in the PROFINET standard. This is not mandatory for other
Industrial Ethernet devices.
3 It is a device outside of the scan range. The device can be found based on its MAC
address but cannot be accessed via an IP address.
Osiris / Atlas / Mercury | User Manual v1.1.70 | January 2019 | © PROCENTEC 25/817.3.7 Device status indicators in the Topology view
Icon Meaning
This indicates that the device is lost. It has been online on the network in the past, but
cannot be reached now.
The IP address of this device is 0.0.0.0. This indicates it needs to be configured.
There is another device on the network with the same IP address. This could make both
devices unusable. You are advised to resolve this issue immediately by changing the IP
address of one of the devices. This issue may also prevent the correct visualization of the
topology within Osiris.
This indicates that the device is lost. It has been online on the network in the past, but
cannot be reached now.
7.3.8 Link indicators in the Topology view
Icon Meaning
• The port load is still acceptable but nearing unacceptable levels of 50% (20% <
port load < 50%)
• The link speed is not 100 Mbps full duplex (for PROFINET devices)
• The port load is over 50% (port load > 50%)
• The devices report different link speeds
• The existence of InDiscards, OutDiscards, InErrors or OutErrors
1..28 The number on the link is the physical switch port of the device that this cable is
connected to.
Osiris / Atlas / Mercury | User Manual v1.1.70 | January 2019 | © PROCENTEC 26/817.3.9 Protocol indicators in the Topology view
Icon Meaning
This is shown for devices that support PROFINET.
This is shown for devices that support PROFIBUS.
This is shown for devices that support Modbus TCP.
This is shown for devices that support Ethernet/IP.
Note: if a device supports multiple protocols, the Protocol indicator icon is not displayed. Supported protocols
are shown in the Device details.
7.3.10 Device details
By clicking on a device this item will become emphasized and an info panel will appear on the right-hand side.
Depending on the type of device, information is shown in groups:
In the Tree view you will find the button in the top to assign a device as
‘Top Node’. With this functionality you can set the highest (top) device in
the tree. If the selected device is already marked as Top Node, the button
will state ‘Top Node’ and will be inactive. Otherwise it will state ‘Assign
Top Node’ and can be used to move the selected device to the top.
General
General information is shown for the device. For more information on the
various items please check the description of the ‘overview’ section.
ComBricks
In case the device is a ComBricks Head Station it will show a table with
Address, Syncs, Lost and Repeats of the connected devices.
Figure 7 - Ignore device errors
Customize: Ignore device errors
In some cases devices generate errors which you, for different reasons, would like to ignore. Such errors can be
suppressed by ignoring a device in the device panel. (see Figure 7). Enable this setting to ignore errors
generated by this device based on its MAC address. Ignoring a device will be done at a variety of places within
Osiris.
Osiris / Atlas / Mercury | User Manual v1.1.70 | January 2019 | © PROCENTEC 27/81Where Effects of ignoring device errors
Device details Errors are still visible in the device details except for firmware differences.
Device List • When a device is ignored they receive a check in the Ignore column
• All errors and warnings of the device are hidden
Notifications • New errors will not be shown
• Old errors will be removed from the dropdown under the bell. This
potentially means that the bell can go back to green
• Errors of ignored devices will still show up in CSV export of the
Notifications
Q-Factor • Devices will be marked as ignored
• Errors will no longer influence the Q-Factor of the device. The device
will always have Q-Factor 5000 and therefor have no influence on the
overall Q-Factor of the network
Report The device will appear in the Ignored Device list in the report.
Topology • Lost devices are still visible but the usual the red cross which indicates
that the device is lost, will be faded
• Double IP-addresses are ignored
• Firmware difference are ignored
• Link errors and warnings will not be shown if you ignore device errors
of the device causing the link errors
• A device with IP-address 0.0.0.0 will generate a warning. When ignoring
the errors of such a device, it will not generate errors anymore
• Devices which don’t supply correct SNMP data will show a blue NAMUR
icon. When ignoring the errors of such a device, this icon will disappear
Traffic Light Errors will no longer influence the traffic light (both on the Dashboard as on the
physical Atlas itself).
Device errors will still be visible in this Device Details view but will be hidden from the Device List and Topology,
and errors related to this device will not influence the Traffic Light or Q-Factor, or be displayed in the
notifications log. Ignored devices are labelled in the Q-Factor. Notifications which are generated by the device
are stored and downloadable as CSV but are not shown.
Osiris / Atlas / Mercury | User Manual v1.1.70 | January 2019 | © PROCENTEC 28/81Identification and Maintenance
Information about the device itself: the Product ID, vendor
name, software and hardware version, order code and serial
number. If two devices of the same ID have been found, using
different firmware versions, a warning is displayed (see Figure
8).
Response time
The last, min and max ping response times are shown here.
Port load
• In: for each incoming/ingress port the last, min and
max port load is shown.
• Out: for each outgoing/egress port the last, min and
max port load is shown.
• Warning: some devices report an incorrect link
speed (e.g. 10 Mbps instead of 100 Mbps). Since the
link speed is used to calculate the load, the reported
load can be incorrect. If the reported load is very Figure 8 - Firmware deviation warning
high, check the link speed.
Link details
By clicking on a link or line between devices an info panel will appear on the right-hand side. Depending on the
type of device, information is shown in groups:
Linked devices
Device name, MAC address and port number are shown for both sides of the connection.
Load
For each direction the last and max port load is shown in %.
Warning: some devices report an incorrect link speed (e.g. 10 Mbps instead of 100 Mbps). Since the link speed
is used to calculate the load, the reported load can be incorrect. If the reported load is very high, check the link
speed.
Link status
• General: the link speed is indicated (10Mbps/100Mbps/1Gbps) together with its operational state
(up/down);
• For each direction, in and out, the ‘discards’, and ‘errors’ are shown. Discards are the number of
telegrams which did not fit in the internal buffer (memory overload) and ‘errors’ are transmission or
CRC errors.
Warning: some devices can report an incorrect link speed (e.g. 10 Mbps instead of 100 Mbps). An indication
that this occurs is when two devices in a link report different link speeds. This is not possible in Ethernet
connections.
Osiris / Atlas / Mercury | User Manual v1.1.70 | January 2019 | © PROCENTEC 29/817.4 Q-Factor
The Q-Factor is a number that represents the quality of the network. You can
choose if you want to use the 0 to 5000 range, commonly used in the Automotive
industry, or a percentage.
A value of 5000 or a percentage of 100 is excellent and 0 is critical or unmeasurable.
Additionally, a color coding is used to emphasize the severity. Normally the color
should be green, meaning excellent or good. Yellow is subpar but not critical, e.g.
attention recommended. Red means a bad, critical or urgent issue.
7.4.1 Multiple Q-Factors
There are multiple Q-Factors in use in the tool:
• A Q-Factor for each network device, which indicates the quality for a single network device.
Calculation of this Q-Factor is based on a weight of:
o Network link load: the bandwidth usage on a certain port of a device, is used to determine the
value. In general, the lower the load, the higher the Q-Factor.
o In/Out errors: the number of errors per port of a device.
o Ping packet loss: the number of unanswered ping requests.
• A single overall Q-Factor, indicating the quality of a complete network. Currently the overall Q-Factor
equals to the lowest Q-Factor of an individual network device.
Figure 9 - Multiple Q-Factors: Overall Q-Factor on the left, individual Q-Factors in the middle and on the right
Osiris / Atlas / Mercury | User Manual v1.1.70 | January 2019 | © PROCENTEC 30/817.5 Traffic Light
The Traffic Light is an overall color coded status to indicate the degree of network status. As it
so purposefully describes, the state is in the form of a traffic light. The Network indicator on
the front of the Atlas unit (LEDs) corresponds with the traffic light state in the web browser.
The traffic light can also be read in the live tile in the Dashboard.
7.5.1 Traffic light state explained
• Red light: a serious problem is present in the network, user attention required.
• Yellow light: a situation is present which is important but not serious, user attention recommended.
• Green light: all seems to be working correctly, no important or critical situation.
7.5.2 Traffic light triggers
The following situations cause the traffic light to turn orange:
• A ping response time between 25 and 50 milliseconds
The following situations cause the traffic light to turn red:
• A ping response time higher than 50 milliseconds
• A device previously seen (e.g. by ping) is not responding anymore
• In or Out discards (the number of telegrams which did not fit in the internal buffer of a switch)
• In or Out Errors (transmission errors or CRC errors)
Osiris / Atlas / Mercury | User Manual v1.1.70 | January 2019 | © PROCENTEC 31/817.6 Device list
The device list shows a list of all detected network devices. Also, unavailable devices
(detected in the past) are listed here. It provides a full overview of all important
properties of devices in the network.
The entire list is downloadable as a CSV file which can be directly opened in
spreadsheet software like Microsoft Excel.
7.6.1 Table customization
Generally, the table columns can be customized with the following features:
• The left column is pinned, meaning if the scrollbar is horizontally scrolled the leftmost column does
not move.
• The list can be sorted by clicking on the column header (ascending, descending or none).
• Columns can be resized by placing the mouse between columns and then selecting/dragging the
splitter.
• Columns can be hidden by selecting the icon on the far right of the table. A list will drop down in
which you can select which columns are to be shown/hidden.
Quick-sort button to sort Show sorting options
ascending or descending for this column
Figure 10 - Sorting
• Certain columns can be filtered (mainly text fields) by clicking on the ‘sorting options’ button on the
right of the column, and then choosing ‘Show filter’. Note: these columns can also be optionally
pinned left.
• It is also possible to combine two or more filters. Simply enable a filter for each column that you want
to filter, for example an IP address filter and a MAC address filter:
Combined filter
Figure 11 - Combined IP and MAC address filter
Osiris / Atlas / Mercury | User Manual v1.1.70 | January 2019 | © PROCENTEC 32/817.6.2 Available columns
Column Description
Name This name is retrieved from the device if it supports a protocol name
identification function (e.g. DCP for PROFINET IO).
IP address The IP address of the device. It consists of 4 numbers separated by ‘.’ dots. If no
IP protocol is supported, it is left blank. Currently only IPV4 is supported.
MAC address The unique Media Access Control address for the device. It consists of 6
numbers in hexadecimal format separated by colons.
Status If a network device has been seen previously and is still being seen it remains
Online (green). If it has been seen previously but not anymore lately it changes
to ‘Lost (red).
Last response time The most recent reaction time measured by a ‘ping’ to a device and its response.
Min. response time The fastest ‘ping’ reaction time.
Max. response time The slowest ‘ping’ reaction time.
Last incoming load The most recent measured network load (in %) for the incoming/ingress port. If
a network device has more than one port the highest load is shown.
See note below
Min. incoming load The lowest measured network load (in %) for the incoming/ingress port. If a
network device has more than one port the highest load of all the lowest port
values is shown.
See note below
Max. incoming load The highest measured network load (in %) for the incoming/ingress port. If a
network device has more than one port the highest load of all the highest port
values is shown.
See note below
Last outgoing load The most recent measured network load (in %) for the outgoing/egress port. If a
network device has more than one port the highest load is shown.
See note below
Min. outgoing load The lowest measured network load (in %) for the outgoing/egress port. If a
network device has more than one port the highest load of all the lowest port
values is shown.
See note below
Max. outgoing load The highest measured network load (in %) for the outgoing/egress port. If a
network device has more than one port the highest load of all the highest port
values is shown.
See note below
Osiris / Atlas / Mercury | User Manual v1.1.70 | January 2019 | © PROCENTEC 33/81You can also read