WEATHER GONE WILD: CLIMATE CHANGE-FUELLED EXTREME WEATHER IN 2018 - CLIMATECOUNCIL.ORG.AU - Climate Council
←
→
Page content transcription
If your browser does not render page correctly, please read the page content below
WEATHER GONE WILD:
CLIMATE CHANGE-
FUELLED EXTREME
WEATHER IN 2018

CLIMATECOUNCIL.ORG.AU
Thank you for
supporting the
Climate Council.
The Climate Council is an independent, crowd-funded organisation
providing quality information on climate change to the Australian public.

    Published by the Climate Council of Australia Limited
    ISBN:    978-1-925573-84-8 (print)
             978-1-925573-85-5 (digital)
    © Climate Council of Australia Ltd 2019                                         Professor Will Steffen
                                                                                    Climate Councillor
    This work is copyright the Climate Council of Australia Ltd. All material
    contained in this work is copyright the Climate Council of Australia Ltd
    except where a third party source is indicated.
    Climate Council of Australia Ltd copyright material is licensed under the
    Creative Commons Attribution 3.0 Australia License. To view a copy of this
    license visit http://creativecommons.org.au.
    You are free to copy, communicate and adapt the Climate Council of
    Australia Ltd copyright material so long as you attribute the Climate Council   Dr Annika Dean
    of Australia Ltd and the authors in the following manner:                       Senior Researcher

    Weather Gone Wild: Climate change-fuelled extreme weather in 2018.
    Authors: Will Steffen, Annika Dean and Martin Rice.

    —
    Cover image: “Evacuation again. Tathra Bushfire 4.21 PM” by Jack Eastlake.      Dr Martin Rice
    Reproduced with permission.                                                     Head of Research
    This report is printed on 100% recycled paper.

         facebook.com/climatecouncil                 info@climatecouncil.org.au

         twitter.com/climatecouncil                  climatecouncil.org.au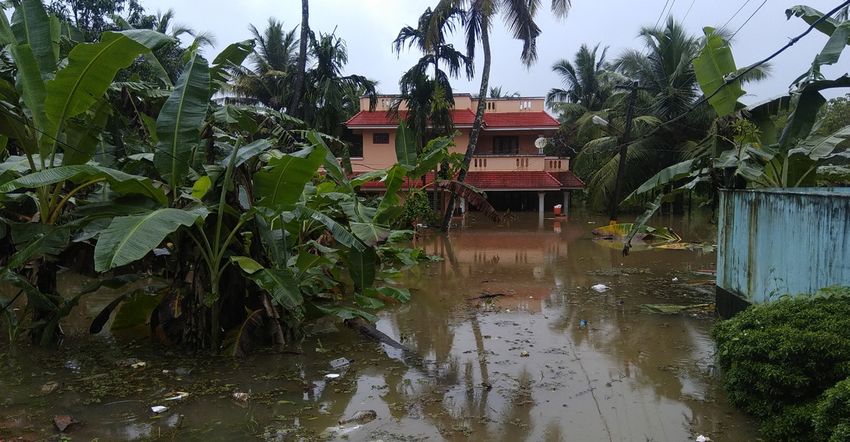
CLIMATE COUNCIL                      i

Contents
Key Findings..................................................................................................................................................................................... ii

1.     Introduction...............................................................................................................................................................................1

2.     Climate change and extreme weather ............................................................................................................................. 4

3.     Global heat records in 2018 ............................................................................................................................................... 12

4.     Australian heat and rainfall records in 2018 ................................................................................................................ 13
       Summer 2017-18                                                                                                                                                                           14
       Autumn 		                                                                                                                                                                                15
       Winter 		                                                                                                                                                                                16
       Spring 		                                                                                                                                                                                16

5.     Extreme weather in Australia during 2018 ....................................................................................................................17

6.     Major extreme weather events globally ............................................................................................................................ 26

7.     Time for action ...................................................................................................................................................................... 35

References....................................................................................................................................................................................... 37

Image Credits..................................................................................................................................................................................41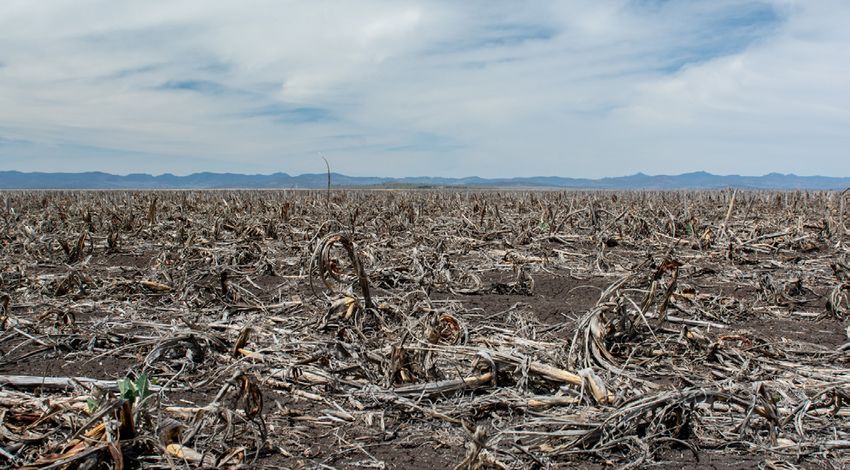
ii    WEATHER GONE WILD:
      CLIMATE CHANGE-FUELLED EXTREME WEATHER IN 2018

     Key Findings
     1            2
     The past four years have been the four hottest             Climate change is increasing the frequency
     years on record for global surface temperature,            and/or severity of extreme weather, with 2018
     continuing a long-term warming trend.                      being a year of wild weather both globally and
                                                                in Australia.
     ›› Globally, 2018 was the fourth hottest year on
        record for surface temperature, following 2017 (the     ›› All extreme weather events are being influenced
        third hottest), 2015 (the second hottest) and 2016         by climate change, as they are occurring in an
        (the hottest).                                             atmosphere that contains more energy than fifty
                                                                   years ago.
     ›› The global average surface temperature in 2018
        was between 0.9 and 1.1°C above temperatures in         ›› Extreme weather events during 2018 are part of
        the late 19th Century (1880 – 1900).                       a trend of increasing extreme weather since the
                                                                   1980s, both globally and in Australia.
     ›› In Australia, the surface air temperature for 2018
        was 1.14 °C above the 1961-1990 average, making         ›› In 2018, Australia experienced extreme heat
        2018 the third hottest year on record.                     across many parts of the country, severe
                                                                   bushfires affected parts of South Australia, New
     ›› 2018 was the warmest on record in the oceans,              South Wales, Queensland, Victoria and Western
        surpassing the previous record set in 2017.                Australia, intense rainfall triggered flooding in
                                                                   northern Queensland, Hobart and southwest
     ›› Globally, the 20 hottest years on record have been         Western Australia, and drought conditions
        in the past 22 years and in Australia, nine of the 10      persisted across southern Australia.
        hottest years on record have occurred since 2005.
                                                                ›› Globally, in 2018 the United States was plagued
                                                                   by a series of intense hurricanes in the southeast
                                                                   and record-breaking wildfires in California,
                                                                   severe drought created a crisis for Cape Town’s
                                                                   water security, the Nordic region was hit with
                                                                   extreme heat in Norway and Finland and fires
                                                                   in Sweden, and a series of extreme weather
                                                                   events brought both extreme heat and extensive
                                                                   flooding to many parts of Japan.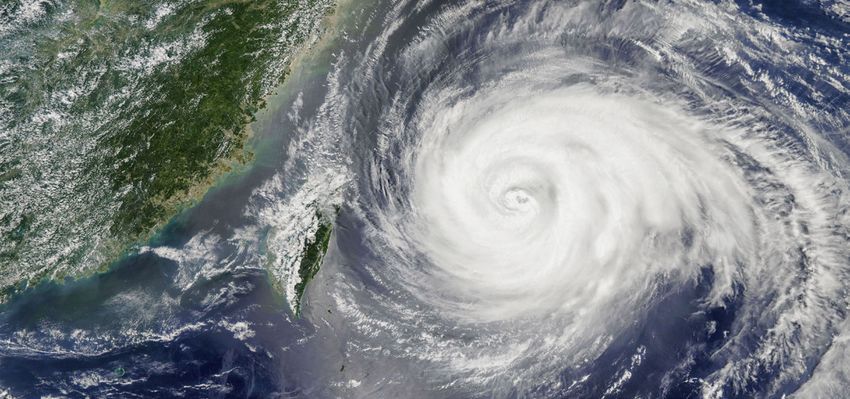
KEY FINDINGS   iii

3
The impacts of extreme weather during
                                                          4
                                                          To slow and eventually stop the increase
2018 have been damaging and costly.                       in the frequency and severity of extreme
                                                          weather, Australia needs an effective national
›› Globally, economic losses associated with              climate policy that drives down greenhouse
   weather-related disasters in 2018 are estimated        gas pollution deeply and rapidly as part of a
   to be US $215 billion.                                 global effort.

›› Insurance companies in Australia paid out              ›› The Federal Government’s current climate policy
   more than $1.2 billion in claims following major          is an abject failure, with greenhouse gas pollution
   extreme weather events during 2018. This                  increasing over the past four years.
   represents just a small proportion of the total cost
   of extreme weather to the Australian economy.          ›› Tackling climate change effectively requires a
                                                             credible national policy to drive down greenhouse
›› The current drought in eastern Australia is               gas pollution across all sectors: electricity,
   forecast to cut the country’s GDP growth in 2018-         transport, industry, agriculture and land use.
   19 by up to 0.75 percent or $12.5 billion.
                                                          ›› To do our fair share of meeting the Paris climate
                                                             target, Australia’s greenhouse gas pollution levels
                                                             must be reduced by 45-65 percent below 2005
                                                             levels by 2030, as recommended by the Climate
                                                             Change Authority in 2015.

                                                          ›› Australia is currently not on track to meet its
                                                             much weaker 2030 target of 26-28 percent
                                                             reduction in greenhouse gas pollution below
                                                             2005 levels.

                                                                                        climatecouncil.org.au
1       WEATHER GONE WILD:
        CLIMATE CHANGE-FUELLED EXTREME WEATHER IN 2018

    1.                  Introduction
                        The global average surface temperature             The hot global average temperatures in 2018,
                        in 2018 was between 0.9 and 1.1°C                  2017, 2016 and 2015 are part of a long-term
                        above the late 19th century average                upswing in global average temperature that
                        (between 1880 and 1900) (Carbon Brief              began most clearly in the mid-20th century
                        2019). The actual temperature rise for             and has persisted since then. A rapidly
                        2018 would be slightly higher if a pre-            warming world is the result of increasing
                        industrial baseline were used. Globally,           greenhouse gas pollution from the burning
                        2016 remains the hottest year on                   of fossil fuels and other human activities
                        record (1.2°C above the pre-industrial             such as land clearing. Globally, the 20 hottest
                        era). 2017 and 2015 were both 1.1°C                years on record have occurred in the past 22
                        above pre-industrial levels (with 2015             years. 2018 is the 42nd consecutive year with
                        being less than one hundredth of a                 an above-average global temperature. No one
                        degree hotter than 2017) (WMO 2018a).              aged under 40 has lived in a year with global
                        This made 2018 the fourth hottest year             average temperatures at or below the global
                        on record for surface air temperature.             20th century average.

                                                                           Similar trends are evident in Australia, where
                                                                           the average air temperature for 2018 was
                                                                           1.14°C above the 1961-1990 average, making
                                                                           2018 the third hottest year on record. The
                                                                           mean maximum temperature was the second
                                                                           hottest on record (1.55°C above average). It is
                                                                           important to note that the Australian average
                                                                           surface temperature refers to land only, while
                                                                           the global surface temperature refers to a
                                                                           combination of land surface and sea surface
                                                                           temperatures. Nine of the 10 hottest years on
                                                                           record in Australia have occurred since 2005
                                                                           (CSIRO and BoM 2018).

                                                                           Greenhouse gas pollution in the atmosphere
                                                                           has risen steadily since around 1750. The
                                                                           mean carbon dioxide (CO2) level during 2017
                                                                           was 405 parts per million in the atmosphere
                                                                           - a 46 percent increase from the levels in
                                                                           1750 (278 ppm) (CSIRO and BoM 2018). The
                                                                           increase in greenhouse gas pollution has led
                                                                           to more heat (or energy) being trapped in the
                                                                           lower atmosphere, raising the global average
                                                                           temperature by around 1°C compared to pre-
                                                                           industrial levels (CSIRO and BoM 2018).
    1
     The on-going US government shutdown has delayed the final reporting
    of December 2018 temperatures. The 2018 estimate was made using
    January – November data from the National Oceanic and Atmospheric
    Administration, with estimates for December derived from the
    Copernicus/ECMWF dataset, which was not delayed by the shutdown.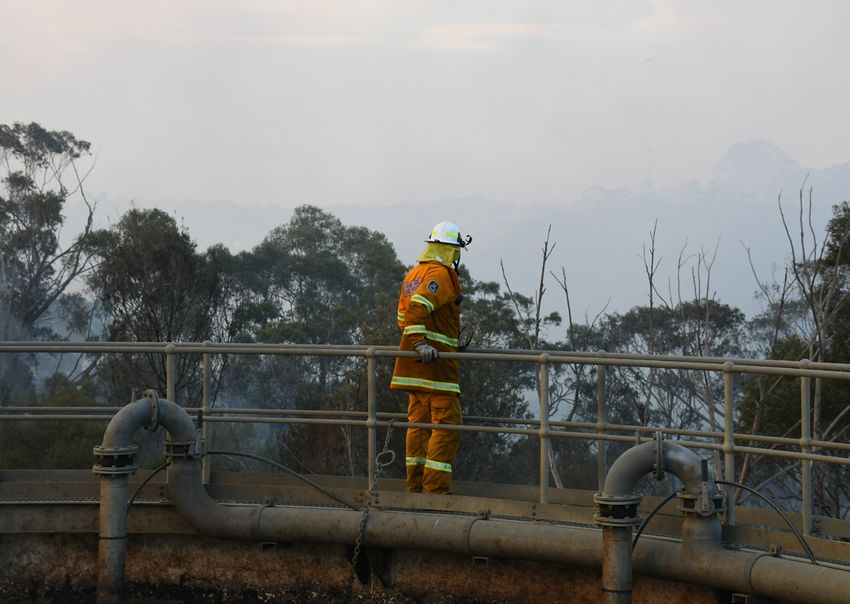
CHAPTER 01   2
                                                                                                                                           INTRODUCTION

Whilst some of the heat trapped in the lower                                                since the 1990s (Cheng et al. 2019). Ocean
atmosphere has gone towards warming                                                         heat content is a better metric for climate
the Earth’s surface, the majority of the                                                    change than global surface temperatures, as
heat – around 93 percent – has gone into                                                    it is where the vast majority of the excess heat
the oceans. Roughly two thirds of this has                                                  from greenhouse gas pollution is stored and
accumulated in the top 700 metres, but some                                                 is less variable from year-to-year than surface
heat has also reached depths of 700 – 2000                                                  air temperatures. In 2018, ocean heat content
metres. Ocean heating has been rising                                                       in the upper 2000 metres was the hottest on
steadily since the 1950s, and has accelerated                                               record (see Figure 1) (Cheng et al. 2019).

Nine of the 10 hottest years on record
in Australia have occurred since 2005.

                                                                                GLOBAL OCEAN HEAT CONTENT 1955-2018
      Zettajoules (billion trillion joules) warming since 1955

                                                                 400
                                                                              0-700m

                                                                 350          700-2000m

                                                                 300

                                                                 250

                                                                 200

                                                                 150

                                                                 100

                                                                  50

                                                                  0
                                                                       1960       1970      1980          1990           2000          2010

                                                                                                   Year

Figure 1: Annual global heat content from 1955 to 2018 in zettajoules (billion trillion joules) for 0-700 metres and 700 – 2000
metres. Source: Carbon Brief (2019).
3   WEATHER GONE WILD:
    CLIMATE CHANGE-FUELLED EXTREME WEATHER IN 2018

                The increase in ocean heat affects weather      Overall, global economic losses associated
                systems by supplying more energy and            with weather-related natural disasters in
                moisture to extreme weather events,             2018 are estimated to be at least US $215
                leading to an increase in the frequency         billion, with insured losses of US $89 billion
                and/or severity of heavy rainfall and           (Aon 2019). The costliest back-to-back
                tropical storms (Patricola and Wehner 2018;     years for weather-related disasters globally
                Trenberth et al. 2018). In 2018, the world      were 2017 and 2018, with total estimated
                experienced a number of major tropical          economic damages amounting to US $653
                storms including hurricanes Florence and        billion (Aon 2019). In Australia, extreme
                Michael in the Atlantic and typhoons Jebi,      weather events caused insured losses of at
                Trami, Mangkhut and Maria in the Pacific.       least $1.2 billion (ICA 2018). The drought
                The number of tropical cyclones was above       across eastern Australia during 2018 is
                average in all four northern hemisphere         expected to cut the growth rate of GDP in
                basins, and the accumulated cyclone             2018-19 by up to 0.75 percent.
                energy was the highest on record for the
                northeast Pacific basin (WMO 2018b).            The extreme weather events of 2018 are the
                                                                latest in a long-term trend of worsening
                                                                extreme weather, both in Australia and
                                                                globally, as a result of climate change.
    Climate change, driven                                      Over the past several decades, heatwaves
                                                                in Australia have increased in duration,
    by the burning of fossil                                    frequency and intensity in many parts of the
                                                                country; southern Australia has experienced

    fuels, is worsening                                         a rainfall decline in the cooler months,
                                                                heavy rainfall events have accounted for an

    extreme weather.                                            increased proportion of total annual rainfall,
                                                                and extreme fire weather days have increased
                                                                at 24 out of 38 sites (CSIRO and BoM 2015).

                This report provides a snapshot of major        Globally over the past half-century, the
                extreme weather events in 2018 in Australia     frequency and/or duration of warm spells
                and globally. The report discusses how          and heatwaves has increased over most
                climate change is influencing extreme           land areas, heavy precipitation events
                weather events including extreme heat           have increased over more land areas than
                events, intense rainfall events, droughts and   have decreased, the North Atlantic has
                drying, tropical cyclones and bushfires. It     experienced an increase in intense tropical
                then goes on to outline major temperature       cyclone activity since 1970, and there has
                records that were broken and significant        been an increase in flooding from high sea-
                extreme weather events that occurred, both      level events (IPCC 2013).
                in Australia and globally.
CHAPTER 02            4
                                                CLIMATE CHANGE AND EXTREME WEATHER

2. Climate change and
   extreme weather
   Climate change is influencing all          EXTREME TEMPERATURES
   extreme weather events as they are
   occurring in a more energetic climate      The increase in global average temperatures
   system (Trenberth 2012). Australia is      has increased the probability of hot extremes
   one of the most vulnerable developed       (including record-breaking hot temperatures)
   countries in the world to the impacts      and decreased the probability of cold
   of climate change. Heatwaves are           extremes (see Figure 2). In Australia, the
   becoming longer, hotter and starting       ratio of observed hot to cold temperature
   earlier in the year. In the south of the   records was 12 to 1 between 2000 and 2014
   country, where many Australians            (Lewis and King 2015). The annual number
   live and work, dangerous bushfire          of hot days (above 35°C) and very hot days
   weather is increasing and cool season      (above 40°C) has also increased strongly over
   rainfall is dropping off, stretching       most areas since 1950. Heatwaves are also
   firefighting resources, putting lives at   lasting longer, reaching higher maximum
   risk and presenting challenges for the     temperatures and occurring more frequently
   agriculture industry and other sectors,    over many regions of Australia (Perkins-
   such as tourism.                           Kirkpatrick et al. 2016).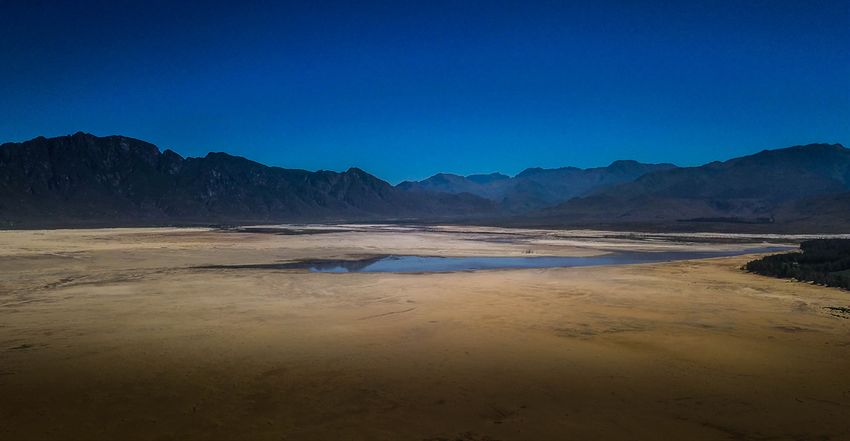
5    WEATHER GONE WILD:
     CLIMATE CHANGE-FUELLED EXTREME WEATHER IN 2018

    There were twelve times more hot
    temperature records than cold temperature
    records in Australia from 2000 to 2014.

                                       Attribution studies - where models are used     Barrier Reef during 2016 was made 175 times
                                       to examine how much more likely extreme         more likely due to climate change (King et
                                       weather events were as a result of climate      al. 2016). Extreme heat events are projected
                                       change - have clearly linked the increase in    to continue to increase if greenhouse gas
                                       extreme heat events to climate change. For      pollution continues along a business-as-
                                       example, Australia’s record hot year of 2013,   usual trajectory. By 2100, three out of four
                                       when mean temperatures were 1.2°C above         people globally could experience at least 20
                                       the 1961-1990 average, would have been          days of heat and humidity per year associated
                                       virtually impossible without climate change     with severe heatwaves if greenhouse gas
                                       (Knutson et al. 2014; Lewis and Karoly 2014).   pollution continues to rise at current rates
                                       Likewise, the marine heatwave that caused       (Mora et al. 2017).
                                       widespread coral bleaching of the Great

                                                               Increase of average temperature

                                                 PREVIOUS                                        NEW
                                                  CLIMATE                                        CLIMATE
            Probability of occurance

                                                                                                   More hot weather

                                        Less cold weather
                                                                                                           More record
                                                                                                           hot weather

                                              COLD                       AVERAGE                           HOT

                                                                                         Previous record         New record

    Figure 2: Schematic showing the increased probability of hot extremes and decreased probability of cold extremes with an
    increase in average temperatures.
CHAPTER 02 6
CLIMATE CHANGE AND EXTREME WEATHER
INTENSE RAINFALL Global studies project that climate change
will increase the frequency of severe tropical
Extremes of intense precipitation (rain, cyclones (Category 4 and 5) and decrease
snow or hail) over various time periods are the frequency of weaker tropical cyclones,
increasing across most of the world, despite resulting in a probable overall decline in
regional variability. Long-term observations tropical cyclone numbers (Bender et al. 2010;
suggest there has been a net increase in Knutson et al. 2010; Done et al. 2015; Holland
the number of heavy precipitation events and Bruyère 2014).
globally since 1951, with the most consistent
trends found in central North America and In the North Atlantic region, there has been
Europe (Hartmann et al. 2013). In Australia, a statistically significant increase in intense
there has also been an increasing trend cyclone activity over recent decades (Kossin
over recent decades in the proportion of et al. 2007; IPCC 2013). Since 1980, the
total annual rainfall stemming from heavy number of storms with winds stronger than
rainfall days (CSIRO and BoM 2018). The 200 kilometres per hour (124 mph, or a strong
physical relationship between temperature Category 3) has doubled, and those with
and the moisture holding capacity of the winds stronger than 250 kilometres per hour
atmosphere suggests that for each 1°C rise in (155 mph) have tripled (Rahmstorf et al. 2018).
global average temperature, the atmosphere Category 4 and 5 cyclones have increased by
can hold approximately 7 percent more 25-30 percent per degree of global warming
moisture (Trenberth 2011). In Australia, the since 1975, balanced by a decline in Category
magnitude of extreme daily rainfall (mm/day) 1 and 2 cyclones (Holland and Bruyère 2014).
is increasing in line with this rate, whilst the
magnitude of extreme hourly rainfall (mm/ Climate change has also increased the
hour) is increasing at double this rate, and rainfall from tropical storms. A recent
more than triple this rate in the tropical north attribution study found that rainfall from
(Guerreiro et al. 2018). Hurricane Katrina was increased by between
four and nine percent by climate change (see
Figure 4). Likewise, rainfall from Hurricane
CYCLONES, STORMS Irma was increased by six percent because of
AND HURRICANES climate change, and rainfall from Hurricane
Maria was increased by nine percent
There is substantial evidence that climate because of climate change (Patricola and
change is influencing the large-scale Wehner 2018). This is significant as flooding
environment in which tropical cyclones associated with heavy rainfall often causes
form and develop. The increasing ocean more damage than strong winds. Under a
temperature affects the intensity of cyclones high greenhouse gas pollution scenario,
(along with changes in upper atmosphere rainfall associated with these hurricanes
conditions), both in terms of maximum would increase by up to 30 percent in some
wind speeds and in the intensity of rainfall areas and peak wind speeds would be 54 km/
that occurs in association with the cyclone. hour faster (Patricola and Wehner 2018).
Storms draw energy from the surface waters
of the ocean, and as more heat is stored in
these upper waters, cyclones have a larger
source of energy on which to draw (Emanuel
2000; Wing et al. 2007).Figure 3: Tropical Cyclone Maria approaches landfall, July 10, 2018.
Recent studies have also suggested that The availability, quality and temporal (time
the translation speed of tropical cyclones related) range of historical data is limited.
globally has declined by 10 percent over the This, along with strong variability associated
period 1949 – 2016. The translation speed with the El Niño Southern Oscillation (ENSO)
is the linear pace at which tropical cyclones regime, make it difficult to discern strong
move forward (distinct from maximum wind trends for tropical cyclone activity in the
speeds, which occur near the centre of a Australian region. Observational data shows
tropical cyclone). The slower translation speed that there has been a decreasing trend in
means tropical cyclones can dump more rain the number of tropical cyclones since 1970.
when they make landfall, thereby increasing However, the definition of a tropical cyclone
the risk of flash flooding (Kossin 2018). was changed in 1978, which means some
systems that were previously classed as
In the southern hemisphere and Australian tropical cyclones would now be classed as
region, there is a general tendency for climate sub-tropical systems, potentially influencing
models to project an overall decline in the the decreasing trend (BoM 2019a). Lack of
frequency of tropical cyclones (Walsh et al. continuous satellite coverage prior to 1979
2012; Walsh 2015); however, it is likely that the also complicates analysis of long-term
intensity of tropical cyclones will increase, changes in the frequency or intensity of
leading to an increase in the percentage of tropical cyclones (BoM 2019a).
severe tropical cyclones (Category 4 and
5) (Emanuel et al. 2008; Leslie et al. 2007;
Lavender and Walsh 2011; Abbs 2012).
The number of storms with winds
stronger than 250 kilometres per
hour have tripled since 1980.Figure 4: Climate change increased the rainfall from Hurricane Katrina by between four and nine percent. Rainfall intensity is projected to increase for all weather systems including tropical cyclones. This is of significance to Australia as most tropical cyclones have historically been associated with major flooding. Mean sea levels in the Australian region have been increasing at close to the global rate around most of Australia, despite regional variability (about 20 cm since the late 19th century) (CSIRO and BoM 2018). Storm surges associated with tropical cyclones, when combined with higher sea levels, create more potential for damages through coastal erosion and inundation. Climate change is causing sea levels to rise, driving more devastating coastal flooding during storm surges.
9   WEATHER GONE WILD:
    CLIMATE CHANGE-FUELLED EXTREME WEATHER IN 2018

                DROUGHTS                                           BUSHFIRES

                In the Mediterranean, the western United           The major factors influencing bushfires
                States and parts of Africa (particularly West      are sufficient fuel, a source of ignition and
                Africa) there has been an observed reduction       conducive weather conditions. Climate
                in rainfall over land since 1950 (IPCC 2013).      change is influencing all of these variables.
                It is likely that reduced precipitation in these   In Australia, bushfire weather is measured
                regions has increased the frequency and/or         using the Forest Fire Danger Index (FFDI),
                severity of droughts. A strong drying trend        which estimates fire danger on a given
                is also emerging in northeast China, the           day based on observations of temperature,
                country’s most important agricultural region       rainfall, humidity and wind speed. The FFDI
                (IPCC 2013).                                       shows that extreme fire weather (the most
                                                                   extreme 10 percent of fire weather days)
                In Australia, it is clear that climate change      has increased over recent decades over
                has influenced rainfall in the southeast and       large areas of Australia, particularly across
                southwest corners of the continent (CSIRO          southern Australia and eastern Australia.
                and BoM 2018). Precipitation patterns have         The duration of the bushfire season has also
                changed markedly in these regions, with a          lengthened over many areas of Australia.
                pronounced drying trend during the cool            Climate change is contributing to these
                season (April – October), which is also the        changes, including through the increase in
                growing season. In the southeast of Australia,     average temperature (CSIRO and BoM 2018).
                rainfall has declined by around 11 percent         Hot weather dries out fuel and increases its
                since the late 1990s (CSIRO and BoM 2018).         flammability, increasing the rate of spread
                In the southwest of Australia, May to July         and intensity of bushfires.
                rainfall has decreased by around 20 percent
                since 1970.                                        Globally, the length of the bushfire season
                                                                   increased by 19 percent between 1979 and
                                                                   2013 (Jolly et al. 2015). In the Western United
                                                                   States, climate change has led to increased
                                                                   pest infestations, contributing to the death
                                                                   of forests, leading to more fuel for fires. Pine
                                                                   bark beetle infestations killed 7 percent of
                                                                   forests in the western United States between
                                                                   1979 and 2012, due primarily to warmer

    Rainfall has declined                                          winters. Analysis suggests the cumulative
                                                                   forest area burned between 1984 and 2015

    by around 11 percent                                           in the western United States was twice what
                                                                   it would have been without climate change

    in southeast Australia
                                                                   (Gonzalez et al. 2018). Models project more
                                                                   fires across the southwest region of the
                                                                   United States with continued greenhouse
    since the late 1990s.                                          gas emissions. Climate change is also
CHAPTER 02 10
CLIMATE CHANGE AND EXTREME WEATHER
projected to increase the area burned by fires The most damaging extreme weather
in Mediterranean Europe. One study found events are often the result of combinations
that if warming were to reach 3°C, the area of variables, such as simultaneous low
burned would increase by 100 percent, but rainfall and heat (leading to drought), or co-
limiting temperature rise to 1.5°C would see occurring heavy precipitation, strong winds
just a 40 percent increase in burned area and sea level rise leading to storm surges and
(Turco et al. 2018). coastal flooding. These are called compound
extremes. Climate change is increasing
Overall, climate change is driving a long- the frequency of some types of compound
term increase in the number of extreme extremes (see Box 1).
weather events worldwide. As a result,
the number of climate-related natural
catastrophes has been rising steeply since
the 1980s (see Figure 5).
800
700
600
Number of events
500
400
300
200
100
0
80
19 1
82
19 3
84
20 8
20 9
10
20 1
12
20 3
14
20 5
16
17
20 1
02
20 3
04
20 5
06
20 7
19 3
94
19 5
96
19 7
98
20 9
00
19 5
86
19 7
88
19 9
90
19 1
92
8
1
0
9
0
9
8
1
0
8
9
8
1
0
9
0
9
8
0
20
20
20
20
19
19
20
19
19
19
20
19
19
19
20
19
20
19
19
Geophysical events Floods and mass movement (wet)
Storms Extreme temperatures, droughts and wildfires
Figure 5: The number of natural catastrophes worldwide has been rising steeply since the 1980s. Red shows geophysical
events (earthquakes, volcanoes, and dry mass movement such as subsidence, rock fall or landslides), while the other colours
show weather/climate-related events. Green shows changes in the number of storms (tropical storms, extratropical storms,
convective storms and local windstorms); blue shows changes in floods and wet mass movement such as subsidence,
landslides or avalanches caused by intensive rain; yellow shows changes in extreme temperatures, droughts and wildfires.
Source: Munich RE 2018.11 WEATHER GONE WILD:
CLIMATE CHANGE-FUELLED EXTREME WEATHER IN 2018
BOX 1: WHAT IS A COMPOUND EXTREME?
A compound extreme is defined as the As the climate warms, compound extremes are
simultaneous or sequential occurrence of likely to occur more frequently (AghaKouchak,
multiple extremes at singular or multiple et al. 2018). Climate change can affect the
locations (Hao et al. 2017). Compound extremes probability of a compound extreme through
have the capacity to make the impact of related changing baseline conditions (e.g. increasing
extreme events worse when compared to the the average temperature or increasing the
impact of each individual event in isolation sea level), or by influencing the frequency or
(Hao et al. 2017; Kopp et al. 2017). intensity of individual events (increasing the
probability of events coinciding) (Kopp et al.
Combinations of events that form a compound 2017, Chen et al. 2011).
event can be of a similar or different nature. For
example, tropical cyclones that are generated a In the United States, week-long heatwaves that
few days apart, follow similar tracks and reach coincide with drought now occur twice as often
a similar intensity are an example of similar as they did during the 1960s and 70s (Mazdiyasni
events that occur due to persistent underlying and AghaKouchak 2015). Projections indicate
atmospheric conditions. that climate change is likely to cause an increase
in the number of summers that are both hot
Different events can also combine concurrently and dry in many regions, due to a stronger
or sequentially to form a compound extreme. negative correlation between temperature and
For example, heavy rain falling on a landscape precipitation (Zscheischler and Seneviratne
previously charred by bushfires increases the 2017). In Australia, there has been an increase
likelihood of landslides occurring (Hao et al. in the number of days when high fire danger
2017, AghaKouchak et al. 2018). This occurred in weather coincides with conditions that generate
early 2018 in Montecito, California, when heavy thunderstorms. This increases the risk of
rain fell on a landscape that had been burned additional fires being lit due to lightning strikes
by wildfires in late 2017, causing a landslide that (CSIRO and BoM 2018).
killed at least 21 people (NBC 2018).
Being able to understand and project the
Compound extremes can also be caused by likelihood of compound extremes is important,
combinations of similar or different events as compound extremes have the potential to
that are not in themselves extreme, but when inflict significant damage on human health, the
combined lead to extreme events. For example, economy and ecosystems.
high sea levels and strong winds may not
individually lead to significant impacts, but
may result in damaging storm surges when
combined. Warm temperatures and below
average rainfall may not individually be extreme,
but may result in agricultural or hydrological
drought and bushfire risk when combined.CHAPTER 03 12
GLOBAL HEAT RECORDS IN 2018
3. Global heat
records in 2018
Hot temperature records that were broken ›› Pakistan experienced its hottest April day
around the globe in 2018 include: on April 30 when the temperature soared
to 50.2°C.
›› January 2018 in New Zealand was the
warmest month for any month the country ›› Argentina experienced its hottest April
has experienced since records began in since national records began in 1961, with
1909. The national temperature was 3.1°C temperatures 2.6°C above average.
above the national average from 1981 – 2010.
›› The contiguous United States experienced
›› France experienced its highest January its hottest May since record-keeping began
temperature since national records began in 1895, with temperatures 2.89°C above the
in 1900 (3.4°C above the national average 20th century average.
from 1981 – 2010).
›› Europe experienced its hottest May since
›› New Zealand experienced its hottest record-keeping began in 1910.
February on record (2.1°C above the
1981–2010 average). ›› Oman recorded its highest minimum
temperature on June 26 when overnight
›› Bahrain experienced its hottest March by temperatures only dropped to 42.6°C in
mean temperature since record-keeping Quriyat.
began in 1902 at 24.6°C (which is 3.6°C
above average). ›› California had its hottest July on record. The
average July temperature at Death Valley in
›› Asia set a new continental maximum California was 42.3°C (108.1°F) – the highest
temperature record in March when average monthly temperature observed
temperatures in Pakistan soared to 45.5°C, anywhere on the planet.
breaking the previous record set in India
by 0.1°C. ›› Parts of Asia recorded their hottest July on
record.
›› According to Meteo France, at least seven
countries set national March temperature ›› South Korea had its hottest August on
records: Iraq, United Arab Emirates, Qatar, record for mean temperatures.
Turkmenistan, Pakistan, Uzbekistan, and
›› Europe experienced its hottest August on
Tajikistan.
record for mean temperature, followed by
›› Europe had its hottest April since its hottest September on record for mean
continental records began in 1910. temperature.
Germany had its hottest April since
›› Argentina had its highest September
national records began in 1881 (4.0°C
temperature on record at 1.8°C above average,
above average). Poland also had its hottest
surpassing the previous record set in 1971.
April on record.
Source: Unless otherwise stated, all records come from NOAA (2018a).13 WEATHER GONE WILD:
CLIMATE CHANGE-FUELLED EXTREME WEATHER IN 2018
4. Australian heat and
rainfall records in 2018
A national and regional 2018 climate climate archives: http://www.bom.gov.
summary is shown in Figure 6. In au/climate/current/statement_archives.
addition, numerous temperature and shtml. The dataset for temperatures
rainfall records were broken (both extends back to 1910 and for rainfall to
for high and low rainfall). Records 1900. Long-term averages are for the
below are sourced from BoM’s period 1961 to 1990.
Figure 6: National and regional climate snapshot, 2018. Source: BoM (2019b).
AUSTRALIA
Third-warmest year on Much of Queensland, New South
record; mean temperature Wales, Victoria, and eastern South
+1.14 °C. Australia affected by drought.
Maximum temperatures; Pacific Ocean ENSO neutral most of
second-warmest on the year; positive Indian Ocean Dipole
record (+1.55 °C). in Spring.
Annual rainfall 11% below Sea surface temperature above average
average at 412.8 mm. for the Australian region; very much
warmer than average for the eastern half.
WESTERN AUSTRALIA NORTHERN TERRITORY QUEENSLAND NEW SOUTH WALES
Annual maximum Annual maximum Fifth warmest year on Warmest year on record.
temperature fourth temperature second record. Extreme heatwaves Rainfall sixth lowest on
warmest on record. warmest on record. in late November and early record. Significant fires on
Autumn rainfall seventh Cyclone Marcus (March 17) December spark fires south coast in August and
lowest on record in south strongest to cross Darwin along the east coast. September. Thunderstorms
west Western Australia. since Cyclone Tracy in with giant hail in Sydney
Summer rainfall (2017-18) 1974. and Central Coast in
tenth wettest on record. December.
SOUTH AUSTRALIA
TASMANIA Annual maximum
VICTORIA temperature fourth
Fifth warmest on record. warmest year on record.
Third warmest on record. Thunderstorms in Autumn rainfall second
Annual ranfall twelfth southeast in mid-May led lowest on record across
lowest on record. to severe flash flooding, southern Australia.
including in Hobart. September driest on record.CHAPTER 04 14
AUSTRALIAN HEAT AND RAINFALL RECORDS IN 2018
SUMMER 2017-18
›› For Australia as a whole, the summer was ›› Many areas of central inland and western
the warmest on record for mean minimum Queensland received below average
temperatures (0.96°C above average), and rainfall during each month of summer,
the second warmest on record for mean with total summer rainfall the lowest
temperature (1°C above average). on record at 10 stations in western
Queensland and multiple other sites
›› On January 7, Penrith in Western Sydney receiving their lowest rainfall in decades.
reached 47.3°C, making it the hottest place
anywhere on Earth that day. ›› Western Australia received above average
rainfall during summer, with a number of
›› On February 12, Queensland had its highest summer total or highest summer
hottest February day, with a state-wide daily rainfall records broken at specific
mean maximum temperature of 40.46°C. sites. Records for highest summer daily
rainfall were set at 26 sites and at 19 sites
›› In March, one site in Victoria (Walpeup) for highest summer total rainfall.
saw a sequence of 14 days reaching over
35°C, breaking the previous record set in ›› Broome airport received more than 1,550
March 2008. mm of total rainfall during January and
February, exceeding the previous annual
›› A number of other sites in Victoria record for Broome (1,496.6 mm in 2000).
(Bendigo Airport, Echuca, Kyabram
and Shepparton) experienced a record- ›› In the first week of December, daily
breaking 12 consecutive days over 35°C. rainfall records for the month were broken
at specific sites in southern New South
›› Overall, at least 72 summer, site-specific Wales, northern Victoria and northern
hot temperature records were broken or Tasmania, with 15 sites in northern
equalled (with the previous record) across Victoria having their wettest day on
Australia during the summer. 2 record for any month of the year.
2 These included records for summer highest temperature, record highest summer daily maximum, record highest summer daily minimum, record
highest summer mean daily maximum and record highest summer mean daily minimum.15 WEATHER GONE WILD:
CLIMATE CHANGE-FUELLED EXTREME WEATHER IN 2018
AUTUMN
›› Throughout autumn, mean monthly ›› Southern mainland Australia had its
maximum temperatures were the warmest second driest autumn on record.
on record for much of New South Wales,
including Sydney, and parts of eastern ›› In March, rainfall records were set in
Victoria and northwest Western Australia. Queensland associated with a low-
pressure system and then tropical
›› In New South Wales the mean maximum Cyclone Nora.
temperature for autumn was the hottest on
record (2.66°C hotter than average) and the ›› In May, a complex low-pressure system
mean temperature was the second hottest brought record-breaking rainfall to
on record (1.88°C warmer than average). many sites in southeastern Tasmania
on May 11. Record highest autumn daily
›› April 9 was Australia’s hottest April day rainfall occurred at 20 sites and record
ever recorded with a national average highest daily rainfall for any time of
of 34.97 °C - 0.65 °C above the previous year occurred at 12 sites. Huonville set a
record set on 8 April 2005. record for highest autumn total rainfall
and Hobart set a record for highest
›› New South Wales had its warmest April daily May rainfall (129.2 mm on May
on record, and its warmest April night on 11), resulting in significant flooding in
record (April 12). Hobart.
›› New South Wales had a total of 32 days
where the state-wide area average
maximum temperature was 30°C or more,
exceeding the previous record of 28 days,
which occurred during the autumns of
1986 and 1940.
›› Sixty-nine site-specific autumn hot
temperature records were broken in New
South Wales, with 22 in Victoria and 16
in Western Australia, including a record
highest autumn mean temperature set at
Carnarvon (25.2°C) and Onslow (29.3°C).
In late March, exceptionally hot
temperatures were recorded in northern
Western Australia, with a maximum
temperature of 45.9°C at Mardie on March
29, the highest temperature recorded so
late in March anywhere in Australia.CHAPTER 04 16
AUSTRALIAN HEAT AND RAINFALL RECORDS IN 2018
WINTER SPRING
›› In New South Wales, 11 site-specific ›› Spring maximum, mean and minimum
winter mean daily maximum temperature temperatures were above average for
records were equalled or exceeded. Australia. November saw very hot
temperatures in some parts of the
›› In Queensland, two sites (Mackay M.O. country. At the beginning of November,
and Alva Beach) had record-breaking several sites in southern New South
hottest winter temperatures. Wales and northern Victoria set spring
temperature records. At the end of
›› New South Wales pan evaporation was November an extended heatwave in
at its highest level in winter since the northern Queensland brought record-
Millennium Drought. This is measured breaking monthly or annual daily hot
by calculating the amount of water that temperatures, and numerous records for
evaporates from a pan of water (with consecutive hot days.
monthly measurements available from
1970). ›› Early spring was very dry, with Australia
experiencing its driest September on
›› Overall, at least 20 site-specific winter record.
hot temperature records were broken or
equalled (with the previous record) across ›› A low pressure system late in November
Australia throughout the winter. brought heavy rainfall to Sydney, the
Illawarra, the Hunter and the Central
›› Winter rainfall was below average Tablelands, with some locations around
nationally, particularly in New South Sydney reporting more than 100 mm
Wales. In New South Wales four sites saw of rain in less than three hours; a few
their record lowest winter total rainfall sites with relatively short records (Mount
and a further 45 sites saw their lowest Boyce, Penrith Lakes, Poonkarie and Box
total winter rainfall for at least 20 years. Hill) had their highest spring daily rainfall
on record.17 WEATHER GONE WILD:
CLIMATE CHANGE-FUELLED EXTREME WEATHER IN 2018
5. Extreme weather in
Australia during 2018
JANUARY: HEATWAVES, BUSHFIRES FEBRUARY: TROPICAL CYCLONE
AND TROPICAL CYCLONES KELVIN HITS WESTERN AUSTRALIA
In early January, residents of New South On Sunday, February 18, Tropical Cyclone
Wales, South Australia and Victoria Kelvin made landfall at Anna Plains in the
experienced scorching heatwaves. Penrith West Kimberley region of Western Australia
in Sydney reached a maximum of 47.3°C as a Category 2 system, with wind gusts of
on January 7, making it the hottest place on up to 150km/hour (which intensified as the
Earth in that 24-hour period. cyclone moved inland, reaching 155 km/
hour). While there were reports of damaged
Hot conditions led to high bushfire danger roofs and destroyed sheds, insurance losses
across southern Australia. On Saturday were minimal given the region is sparsely
January 6, a fire, believed to be deliberately populated. Heavy rainfall as a result of
lit, started in the Sherwood district in South the cyclone caused flooding in the region
Australia. The hot, dry conditions caused the damaging roads and rail infrastructure
fire to spread quickly, leading to emergency (ICA 2018).
warnings being issued for Sherwood,
Brimbago, Lowan Vale, McCallum and MARCH: TROPICAL CYCLONES
other areas. The fires affected 41 properties AND FLOODING IN QUEENSLAND,
and destroyed five homes. In addition, 101 BUSHFIRES IN VICTORIA AND
hectares of crops, 4,000 olive trees and an NEW SOUTH WALES
estimated 2,600 livestock (mostly sheep)
were lost. The conservative estimated value From March 5 to 12 heavy rainfall across
of lost stock alone was more than $500,000 much of northern and central Queensland
(ICA 2018). led to significant flooding in Ingham,
Cordelia and Innisfail. Approximately 525
On January 12, Tropical Cyclone Joyce made insurance claims were submitted, with
landfall over Eighty Mile Beach in Western insured losses amounting to more than
Australia as a Category 1 system. The $16.8 million (ICA 2018).
cyclone then weakened to a tropical low as
it travelled south over the Pilbara, bringing On Saturday, March 17, Tropical Cyclone
heavy rainfall and some flooding. The storm Marcus made landfall over the Northern
system continued south, affecting farming Territory coast. It had maximum winds
areas around Cunderdin and causing some of 260km/hour, making it the strongest
property damage, before dumping heavy cyclone in the Australian region in more
rainfall on Perth, leading to flooding there. than a decade, and the strongest cycloneCHAPTER 05 18
EXTREME WEATHER IN AUSTRALIA DURING 2018
to hit Darwin since Cyclone Tracy in 1974 On March 18 several fires broke out near Bega
(NOAA 2018). The system struck Darwin as a on the far south coast of New South Wales.
Category 2 cyclone, with numerous reports of They were fuelled by high temperatures, very
fallen trees causing damage to buildings and low humidity, and strong winds. One of the
vehicles. The insured losses alone were more fires bore down on the coastal community
than $61 million (ICA 2018). of Tathra. At least 65 homes were destroyed
or damaged by the fires (see Figure 7). Major
Heavy rainfall continued to affect fires near Bega are very unusual in March;
Queensland through March, with the town these were among the worst ever recorded in
of Winton receiving 252.6 mm from March 4 that area. Bushfires in New South Wales and
to 7, compared to a historical average March Victoria during March resulted in the loss of
rainfall of 96.7 mm (BoM 2018a). The flooding roughly 100 structures in New South Wales
in Winton peaked at 3.7 metres, cutting off all and 27 in Victoria, and insured losses of over
but one access road to the town (ABC 2018a). $80 million (ICA 2018).
The floods also stranded truck drivers in
Longreach and cut off supplies of groceries In late March an unusual heat event saw
and diesel to Mount Isa (ABC 2018a). persistent summer-like temperatures
spreading from northwestern Australia in late
On March 25 Cyclone Nora made landfall March to southern Australia in April. Prior
in Cape York as a Category 3 system, with to 2018, there was no record of any location
winds of around 141 km/hour and heavy rain in Australia reaching a temperature of 45°C
resulting in flooding. On March 26, torrential after March 21. However, on March 28 this
rain from Nora caused flash flooding in north value was surpassed in Western Australia at
Queensland, including in Cairns and Port Mardie (45.4°C), Roebourne (45.9°C) and Port
Douglas. Cairns recorded 217.6 mm of rain Hedland (45.3°C) and again on March 29 at
on March 26, more than half of the monthly Mardie (45.9°C) (BoM 2018c).
March average (BoM 2018b). Landslides to the
north of Cairns resulted in road closures (The
Guardian 2018a).
Tropical Cyclone Marcus was
the strongest to hit Darwin since
Cyclone Tracy in 1974, and the
strongest in the Australian region
in more than a decade.Figure 7: Aftermath of the Tathra Bushfire on the south coast of New South Wales, March 2018. Properties destroyed by fire
can be seen along the ridge at the top of this photo.
APRIL: SUMMER-LIKE HEAT On April 14, Sydney experienced very
AND BUSHFIRES strong winds, low humidity and high
temperatures. A bushfire believed to have
New state temperature records were set for been deliberately lit broke out at Holsworthy
South Australia (42.2°C at the Nullarbor on in the city’s southwest. The fire spread
April 9), Victoria (39.3°C at Mildura on April quickly, threatening thousands of homes in
10) and New South Wales (45.5°C at Pooncarie Holsworthy, Wattle Grove, Sandy Point, Lucas
on the 10th). A nationwide record was also set, Heights, Menai and other suburbs (see Figure
with April 9 Australia’s hottest ever April day 8). Thousands of hectares were burnt and a
(April 8 also broke the previous record). number of homes were damaged. These April
fires in New South Wales occurred outside of
On April 10 numerous sites in Victoria, the statutory bushfire danger period, which
New South Wales and South Australia set runs from October 1 to March 31. In Sydney,
location specific records. Record-high April most major bushfires have historically
maximum temperatures were set over 23.4 occurred from November to January.
percent of New South Wales, 17.1 percent of
Victoria and 10.2 percent of South Australia
(BoM 2018c). Overall, April was the second
warmest on record for mean temperature,
and the hottest on record for mean
maximum temperature (BoM 2018d).Figure 8: Firefighter looks out over bushfires at Holsworthy, April 2018.
MAY: INTENSE RAINFALL On May 25, strong winds and heavy rain
AND FLOODING IN HOBART affected southwest Western Australia,
including Perth. The storm drove winds as
On the morning of May 11, heavy rainfall strong as 67km/hour around Perth, while
brought significant inundation and flooding 53.8 mm of rain fell within 48 hours, taking
to the Hobart region, with the suburbs of down power lines and causing widespread
Kingston, Sandy Bay, and Blackmans Bay blackouts (BoM 2018f). Busselton near Perth
being the worst affected. Hobart recorded also received 67.2 mm of rain, flooding the
129.2 mm of rainfall in 24 hours (BoM 2018e). streets (BoM 2018g).
Inundation resulted from both stormwater
run-off and the breaching of the Hobart
Rivulet in two locations, causing flooding to
low-lying properties. The flooding resulted
in insured losses of more than $99 million
(ICA 2018).21 WEATHER GONE WILD:
CLIMATE CHANGE-FUELLED EXTREME WEATHER IN 2018
JUNE, JULY, AUGUST, SEPTEMBER: most significant decline forecast for New
RAINFALL DEFICIENCIES WORSEN South Wales, where winter crop production
DROUGHT may be 65 percent below the 20-year average
(ABARES 2018). Larger than average crop
June marked the start of the southern wet production is forecast for Western Australia,
season for Australia, but the month was drier which will offset the declines at the national
than average for every state and territory. level, resulting in a national crop production
Low rainfall increased long-term rainfall that’s predicted to be 23 percent below the
deficiencies, with autumn going down as the 20-year average (ABARES 2018).
second driest on record (since 1900) across
southern Australia (BoM 2018h). July was the The effect of the drought on farmers’
second-hottest on record for Australia as a incomes (holding other variables constant)
whole, and the driest since 2002 during the has been the second-worst since 1978,
Millennium Drought. Total rainfall across comparable only to 2002-03 during the
Australia as a whole was 51 percent below Millennium Drought. The effects of the
average. New South Wales was particularly drought on farmers’ incomes is likely
dry, with more than 80 percent of the state to be partially offset by other factors
receiving very much below average rainfall (ABARES 2018). Nevertheless, in August,
(the driest on record since 2002 during the the Commonwealth Bank warned that if
Millennium Drought). Twenty-six locations the drought worsened it could potentially
in New South Wales reported their record- cut GDP growth by between 0.5 and 0.75
lowest July rainfall totals (BoM 2018i). In percent in 2018-19 – equivalent to between
August, the whole of the state was declared $8 billion and $12.5 billion (SBS News 2018).
in drought. Australia experienced its driest Citigroup also forecast that the drought could
September on record (BoM 2018j). cut GDP growth by 0.5 percent, assuming
a 20 percent fall in farm production (AFR
The drought over eastern Australia affected 2018a). The Federal Government’s 2018-19
crop production, farmers’ incomes, and the economic outlook forecast that a decline in
Australian economy more broadly (see Figure rural exports due to the drought would cut
8). Crop production in the eastern Australian GDP growth by 0.25 percent, assuming that
wheat-sheep zone in the 2018-19 financial seasonal conditions are average in 2019-20,
year is forecast to be 53 percent lower than allowing farm production to return to normal
the 20-year average (1998-2018), with the (Commonwealth of Australia 2018).
In 2018 southern Australia
experienced its second driest
Autumn on record since 1900,
worsening prior rainfall deficiencies.CHAPTER 05 22
EXTREME WEATHER IN AUSTRALIA DURING 2018
The warm, dry conditions over winter also
led to elevated bushfire risk. In July, a fire
The current drought
broke out in the Holsworthy army range in
southwest Sydney, burning around 3,000
in eastern Australia
hectares and in August more than 1,000
bushfires burned in southern Queensland. is forecast to cut
Many local government areas in New South
Wales were declared to be in the Bushfire Australia’s GDP
Danger Period in August, at least two months
before the beginning of the traditional growth by up to $12.5
bushfire season.
billion in 2018-19.
OCTOBER: SUPERCELL STORMS
HIT QUEENSLAND
On October 11, a series of powerful storm
supercells affected the South Burnett
Region in Queensland. The storms brought
significant rain, large hailstones and tornado-
strength winds, causing damage to properties
and home contents as well as agricultural
losses, including the loss of livestock.
Figure 9: Dead Sorghum Crop, Quirindi, November 2018.23 WEATHER GONE WILD:
CLIMATE CHANGE-FUELLED EXTREME WEATHER IN 2018
NOVEMBER: HEATWAVES AND FIRES Innisfail, Townsville (Mt Stuart), Proserpine
SPREAD ACROSS QUEENSLAND and Mackay (racecourse) sweltered in daily
maximum temperatures above 40°C, with
From November 23, heatwaves struck Townsville recording the highest daily
the north tropical and central coasts of maximum of 45.2°C. The following day,
Queensland. During this period, areas records were broken at Cairns and Cooktown
around Lockhart River in the far north of for two consecutive days above 42°C.
the Cape York Peninsula to the Capricornia
coast near Yeppoon experienced extreme Around 4,000 locally endemic spectacled
heatwave conditions. Adjacent inland areas flying foxes in Cairns died due to heat stress
also experienced severe heatwaves, and (BoM 2018k). Paramedics in Queensland
much of the rest of northern and eastern reportedly attended 3,567 incidents on
Queensland experienced low intensity November 26 - nine percent more incidents
heatwaves (BoM 2018k). Numerous highest than on the same day in 2017 - including
maximum and minimum temperature treating 25 heat related cases (Queensland
records for November (or at some locations Government 2018). Temperature records
for any month) were broken, some by a large broken over this period are shown in
margin. On November 26, Cooktown, Cairns, Figure 10.
Figure 10: Maps show locations where temperature records were broken during the November Queensland heatwave event:
a) sites where November minimum (orange), maximum (pink) and annual maximum (red) records were set; b) sites where
records were set for consecutive days over 35°C (orange), consecutive days over 38°C (pink) and consecutive days over 40°C
(red). Source: BoM 2018k.
A B
Nov min temperature > 35°C
Nov max temperature > 38°C
Annual max temperature > 40°C
Cooktown Cooktown
Cairns Cairns
Townsville Townsville
Mackay Mackay
Rockhampton Rockhampton
Brisbane BrisbaneCHAPTER 05 24
EXTREME WEATHER IN AUSTRALIA DURING 2018
Strong winds, low humidity and high DECEMBER: STORMS ACROSS
temperatures brought elevated fire risk THE EASTERN STATES
to the region, with extreme fire danger
weather (over 75 on the Macarthur Forest In December, Tropical Cyclone Owen, the
Fire Danger Index or FFDI) recorded over first for the 2018-19 summer, made landfall
large areas of the state. Rockhampton Aero at two separate locations on the Gulf of
reached catastrophic fire danger conditions Carpentaria coast, both times as a Category
(over 100 on the FFDI) on November 27, 3 system. Owen brought heavy rainfall to
reaching a peak FFDI reading of over 130. much of Queensland, with totals above 200
The dangerous fire conditions resulted in mm recorded along much of the Queensland
numerous bushfires over a region of one coast. At Halifax, 681 mm was recorded
million hectares, forcing the evacuation in 24 hours, the highest daily rainfall for
of thousands of residents of towns such as December recorded for any location in
Deepwater and Gracemere. Nine dwellings Australia (BoM 2018l).
were destroyed and eight were damaged,
along with dozens of other structures Moisture associated with Owen interacted
(BoM 2018k). The unprecedented bushfire with a low-pressure system that developed
conditions led to fires that were so ferocious over Victoria. Between December 13 and 16,
they penetrated rainforests. As rainforest severe storms brought heavy rainfall, hail
species are not adapted to fire, it may take and wind to the eastern states of Australia
hundreds of years for the rainforests that (all states and territories except the Northern
were decimated by fires in Queensland to Territory and Western Australia). The worst
recover (ABC 2018b). affected areas were Campbelltown and the
Hills District in Sydney. Insured losses were
There has been an upward trend in the estimated at around $60 million (ICA 2018).
annual accumulated FFDI over recent
decades, particularly across eastern On December 20 a series of severe storms
Australia, including Queensland, and once again brought torrential rainfall to the
across southern Australia. The annual Hunter Valley, the Central Coast, Sydney and
accumulated FFDI reflects an increase Wollongong, as well as Grafton, Tamworth,
in both the frequency and severity of Moree, Nowra and Batemans Bay. Hail
dangerous bushfire weather (BoM 2018k). reportedly the size of tennis balls damaged
vehicles and property in Sydney’s west, whilst
hail the size of golf balls damaged property in
Sydney’s inner suburbs (The Guardian 2018b).
The Insurance Council of Australia declared
the event a catastrophe. The estimated
insured loss value from the series of storms
is $871.3 million (as at January 17) making
it the costliest extreme weather event of the
year for the insurance industry and amongst
the top 20 most expensive events in terms of
insured losses of all extreme weather events
in Australia extending back to 1967 (ICA 2018;
AFR 2018b). Overall, insured losses from
weather-related extreme weather events cost
$1.2 billion in Australia in 2018 (see Table 1).You can also read