WHERE NEXT FOR AUSTRALIA'S TAX SYSTEM? - HOW OUR TAX SYSTEM CAN HELP REBOOT PROSPERITY FOR AUSTRALIA - PWC AUSTRALIA
←
→
Page content transcription
If your browser does not render page correctly, please read the page content below

Where next
for Australia’s
tax system?
How our tax system can help
reboot prosperity for Australia
June 2020

Key findings
Australia entered 2020 with an economy growing slower than desired, but with
public finances that were in a relatively strong position – low debt compared to
most other advanced economies and a forecast Commonwealth budget surplus.

Even then, Australia’s tax system was            As outlined in PwC’s recent Australia Rebooted
ill‑equipped to support a growing economy,       report, steps taken to address the COVID-19
due to:                                          pandemic (e.g. shutting down certain
                                                 activities, social distancing obligations, and
• an over-reliance on personal and
                                                 border restrictions) have created a deep (but
  corporate taxes
                                                 hopefully relatively short) recession and have
• inequities (particularly intergenerational)    exacerbated the ongoing challenge of raising
                                                 economic growth over coming years.
• a reliance on unsustainable tax bases
• a misalignment between revenues and
  responsibilities
                                                 Steps taken to support businesses and
• a reliance on distortionary and                individuals during this time of disruption have
  inefficient taxes                              resulted in:
• high compliance costs                          • ballooning government expenditure
• an inability to keep up with global business   • shrinking government revenue
• tax avoidance throughout the                   • increased government debt.
  cash economy.

                                                    PwC | Where next for Australia’s tax system?   i
Projected Commonwealth budget position ($ billions, year ending June)1
25
Underlying cash balance (billions)
0
-25
-50
-75
-100
-125
Jun-20
Jun-21
Jun-22
Jun-23
Jun-24
Jun-25
Jun-26
Jun-27
Jun-28
Jun-29
Jun-30
Jun-31
Jun-32
Jun-33
Jun-34
Jun-35
Jun-36
Jun-37
Jun-38
Jun-39
Jun-40
These factors mean that, without changes to An 18 year old entering the workforce this year
Australia’s tax system, PwC estimates the nation could have expected to work under consecutive
will not return the Commonwealth budget to federal budget surpluses for the foreseeable
balance for the next 19 years (see figure, above), let future, and to see the Commonwealth achieve
alone generate the surpluses needed to pay down zero net debt by the time they were 28 years
the new debt. In the 2020 Commonwealth budget of age. Now that same worker cannot expect
it was projected that Australia would reach zero net a budget surplus until they are 37 years old, and
debt in 2029-30; with the projected deficits shown net debt is not predicted to reach zero until they
in the figure, PwC now forecasts this to occur in are 55.
2056-57.
In a post-COVID-19 Australia, tax reform will become Australia should be planning comprehensive
even more important because of the need to: tax reform now, but the implementation of this
• generate revenue to support ongoing reform should wait. Tax reform in the middle of
government expenditure an economic shock will pose another level of
disruption to businesses that are already being
• improve equity, particularly intergenerational asked to change in so many ways, and may give
equity given that the costs of The Great rise to reforms that will need to be recalibrated
Lockdown will be borne disproportionately once some stability returns. That does not mean,
by the young however, that Australia shouldn’t act; now is the
• support economic growth. time to plan for reforms as the nation emerges
from the immediate crisis.
Emergency and temporary taxation and spending
measures are already in place to deal with some
of the immediate challenges of COVID-19. These
measures are not ‘tax reform’ in the traditional
sense, and will not address the inherent flaws in the
tax system.
PwC | Where next for Australia’s tax system? ii
Insert chapter title over one or
X   two lines

    Contents
    Introduction                                                                                          1
    1. The pre-COVID-19 environment                                                                       2
       1.1 The Australian economy entering 2020                                                           2
       1.2 The pre-existing need for tax reform                                                           4
          Over-reliance on personal and corporate taxes                                                   4
          Inequities                                                                                      7
          Reliance on questionable tax bases                                                             10
          Misalignment between revenues and responsibilities                                             12
          Reliance on distortionary taxes                                                                14
          High compliance costs                                                                          16
          Avoidance through the cash economy                                                             16
    2. What has changed as a result of the COVID-19 pandemic?                                            18
       2.1 The Great Lockdown                                                                            18
       2.2 The economic shock                                                                            20
       2.3 The impact on public finances                                                                 22
          Ballooning government expenditure                                                              22
          Shrinking government revenue                                                                   23
          Increased government debt                                                                      24
    3 The need for tax reform in a post-COVID-19 Australia                                               26

       3.1 Revenue                                                                                       26

       3.2 Equity                                                                                        28

       3.3 Economic growth                                                                               29

    4 Is now the time for tax reform?                                                                    30

       4.1 Haven’t we tried this before?                                                                 30

       4.2 Seize the moment?                                                                             32

    5 Where to from here?                                                                                33

    Endnotes                                                                                             34

    Abbreviations                                                                                        35

    Sources                                                                                              36

                                                          PwC | Where next for Australia’s tax system?        iii
Introduction

While businesses, government and society more generally are naturally focusing on the immediate
‘shock’ and ‘management’ phases (see figure 1) of the COVID-19 pandemic, it is important to look
beyond to consider what the economy and nation will look like in a post-COVID-19 world.

FIGURE 1
The four phases of the COVID-19 pandemic

Illustrative COVID-19 economic impact
                                                                                                Focus of this document
                                                                                                                    1

                         Pre-COVID           Shock                Management                  Post-COVID
                         Status quo          Economic             Economic                    Economic recovery
                                             downturn             stabilisation
       Economic growth

                                        COVID                                                                                Potential
                                        Crisis                                                                               Scenario 1

                                                                                                                             Potential
                                                                                                                             Scenario 2

  Infection                Virus not                                     Stabilising          Low/No infections, treatment
                                                 Peak infection
     status                identified                                  infection rates         or herd immunity reached

There is a risk that Australians will collectively move forward in the hope that, having crossed the
‘bridge to recovery’ in a relatively short time, the nation will return to something approximating the
previous understanding of ‘normal’.

Such nostalgia would be a mistake; both in the desirability of that previous state and the ability
to return to it. The pace and scale of the shock caused by COVID-19 means that Australia has
already changed, and further change is inevitable.

This report is the first in PwC’s Tax reform in the wake of COVID-19 series, exploring the important
role that tax plays in supporting Australia’s longer-term recovery and how the tax system will
need to adjust to support the future prosperity of all Australians. This report considers: the
pre‑COVID-19 environment (economically and from a tax perspective); changes arising from the
COVID-19 pandemic, including the way tax reform incentives may have changed; and when and
how Australia’s leaders should contemplate tax reform.

                                                                                PwC | Where next for Australia’s tax system?        1
1   The pre-COVID-19 environment

    To understand the post-COVID-19 options, it is important to understand both the economic
    environment and the sustainability of the tax system as at the beginning of 2020. This is the
    baseline that many people commonly aspire to when talking about a recovery – but should it be?

    1.1 The Australian economy entering 2020
    The year 2020 started with physical challenges front-of-mind for many Australians, with various
    parts of Australia being challenged by bushfires, floods and the drought. The Reserve Bank of
    Australia (RBA) has suggested that:

    • over the December and March quarters, the fires have reduced Australian gross domestic
      product (GDP) growth by around 0.2 percentage points
    • the drought would reduce GDP growth by a quarter of a percentage point in 2020.

    Despite these environmental challenges, and a general sense that the Australian economy was still
    underperforming – with below par GDP, productivity and wages growth - the Governor of the RBA
    expressed the view in February that the Australian economy had ‘reached a gentle turning point’.2

    The Governor supported this positive view of the coming years by noting:

    • the International Monetary Fund’s (IMF’s) prediction that global growth would be stronger in
      2020 than in 2019
    • the RBA’s projection that economic growth in Australia would pick up from an average rate of
      2 per cent over the past couple of years to 2.75 per cent in 2020 and 3 per cent in 2021. Drivers
      of this growth were identified as including accommodative monetary policy, a new expansion
      phase in the resources sector, stronger consumer spending, a recovery in dwelling investment
      later in 2020, high levels of spending on infrastructure and strong growth in public demand
    • promising evidence in forward-looking indicators such as job vacancies.3

                                                          PwC | Where next for Australia’s tax system?   2
Similarly optimistic, the Australian government was predicting a return to a modest budget surplus in 2019-
20 after deficits every year since the global financial crisis (GFC).4
Even with the decade of post-GFC deficits, Australia had relatively low central government debt
(i.e. Commonwealth) compared to other advanced economies (see figure 1.1). Similarly, total government
debt (i.e. central, state/territory and local governments) was relatively low in comparison to other
advanced economies.
FIGURE 1.1
General and central government debt (% of GDP, 2018)5
250
200
150
100
50
0
Estonia
Luxembourg
Chile
Turkey
Czech Republic
Lithuania
Denmark
Latvia
Sweden
Norway
Switzerland
Australia
Poland
Slovak Republic
Columbia
Netherlands
Finland
Germany
Israel
Hungary
Slovenia
Austria
United Kingdom
Canada
Spain
France
Belgium
United States
Portugal
Italy
Greece
Japan
Central General
PwC | Where next for Australia’s tax system? 3
1.2 The pre-existing need for tax reform
Despite the gently improving economic picture at the beginning of 2020, before the shock to the system
imposed by COVID-19, the Australian tax system was struggling to meet the needs of the Australian community.
The following sections consider the pre-existing challenges evident in the Australian tax system.

Over-reliance on personal and corporate taxes
Australia has a high reliance on income taxes, including company income tax. As shown in figure 1.2, more
than two-thirds of the Commonwealth’s tax receipts come through personal and corporate income taxes -
more than twice the OECD average.

FIGURE 1.2
Income tax revenue as % of total central government tax revenue (2017)6

      Lithuania                 13.1           5.1
       Slovenia                     14.2           4.9
       Hungary                      14.2             5.5
        Poland                      14.6              5.6
Slovak Republic         10.2                             10.4
        Greece                         16                5
        Turkey                      14.5                   6.8
        Estonia                             17.4             4.7
Czech Republic               11.5                            10.7
        France                                18.6                 5.1
         Latvia                                       21.1                5.1
        Austria                                          21.7                  5.9
       Portugal                               18.8                              9.4
         Spain                                           21.8                    6.8
   Netherlands                                           21.6                          8.5
         Japan                                18.8                                      11.8
           Italy                                                        25.7            5
          Israel                                     20.7                               10.1
          Chile        9.7                                                              21.1
         Korea                              17.9                                             14.2
     Germany                                                                    27.1          5.4
 OECD Average                                                    23.9                           9.3
        Finland                                                                  29.2                  6.3
United Kingdom                                                            27.2                         8.5
       Sweden                                                                        29.9               6.3
       Belgium                                                            27.2                           9.3
   Luxembourg                                                    23.6                                        13.6
       Norway                                                            26.5                                     12.5
    Switzerland                                                                      30.3                             10.7
        Mexico                                           21.4                                                                21.8
        Ireland                                                                        31.2                                  12.3
  United States                                                                                               38.7              6.5
        Iceland                                                                                              38                     8.2
       Canada                                                                                         35.7                            11.4
  New Zealand                                                                                                37.8                            14.7

  Australia                                                                                                         40.3                              18.5
      Denmark                                                                                                                                  52.9          7.2
                   0                                            20                                                         40                                      60
                                     Taxes on income, individuals (PIT)                        Taxes on income, corporates (CIT)

                                                                                                         PwC | Where next for Australia’s tax system?                   4
Most other advanced economies have placed a considerably higher reliance on the taxation of consumption
(or value added) taxes (see figure 1.3).

FIGURE 1.3
Value added tax receipts (% of total tax revenue in 2017)7

    United States        0
      Switzerland                       12

    Australia                    12.2
           Japan                             13
         Canada                               13.7
             Italy                                14.8
         Belgium                                  15.2
          France                                     15.3
     Luxembourg                                      15.9
           Korea                                     16
     Netherlands                                            17.4
          Austria                                             18.3
        Germany                                               18.4
           Spain                                                   19.1
          Ireland                                                   19.6
          Turkey                                                     20.1
   OECD Average                                                      20.2
        Denmark                                                       20.7
  United Kingdom                                                      20.7
          Greece                                                          20.9
         Sweden                                                           20.9
          Finland                                                         21
  Slovak Republic                                                         21.1
  Czech Republic                                                               22
         Norway                                                                22.1
         Slovenia                                                              22.3
          Poland                                                                 22.8
            Israel                                                               22.9
          Mexico                                                                    23.1
          Iceland                                                                     23.8
         Hungary                                                                           24.8
         Portugal                                                                          25.1
           Latvia                                                                            25.7
        Lithuania                                                                                 26.6
          Estonia                                                                                   27.8
    New Zealand                                                                                            30.2
             Chile                                                                                                            41.6
                     0           10                           20                                     30              40                   50

                                                                                           PwC | Where next for Australia’s tax system?   5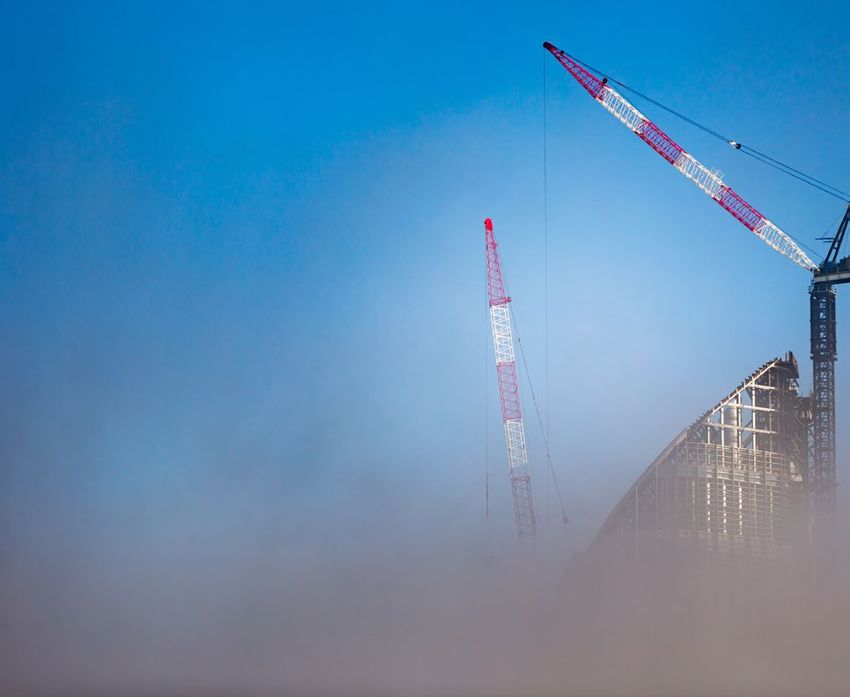
A benefit of greater reliance on taxing consumption is that movements in goods and services tax (GST)
revenues have been relatively stable compared to company tax. As shown in figure 1.4, since the GFC, GST
tax receipts have held up relatively strongly and had stable growth,8 whereas company tax receipts took
longer to recover to previous nominal levels, and have grown in a slower and more volatile manner. This
relative volatility reflects that consumption will always be ‘positive’, whereas companies can generate a tax
loss and can carry such losses forward. Furthermore, companies may have mechanisms to reduce taxable
income in a manner that cannot be replicated for personal consumption.

Lower growth and higher volatility threatens the Australian government’s ability to regrow the tax base in a
timely and reliable manner.

FIGURE 1.4
Growth in major taxes since the GFC (2007 - 08 = 100)9

180                                                                                          Personal income tax

160

140               Goods & services tax (GST)

120

100

 80

 60
                                                                                   Company income tax
 40

 20

  0
      2007-08   2008-09    2009-10     2010-11   2011-12   2012-13   2013-14   2014-15   2015-16   2016-17     2017-18

Also, the relatively high tax rate associated with company tax can hinder growth, with the effects from this
largely being borne by workers. There has been considerable discussion about the potential reduction of
the company tax rate, though it is acknowledged that Australia’s company income tax regime is partly
acting as a tax on economic rent, in lieu of alternative tax arrangements. Australia’s experience from the
GFC suggests that it will take a long time for corporate taxes to recover from the COVID-19 downturn for
the reasons set out above (e.g. carry-forward of tax losses). This puts additional pressure on personal
income taxes to carry the load.

The increase in unemployment (even with JobKeeper subsiding wages), and even further expected
weakness in wage growth, suggests that personal taxes will also not provide a stable or growing base for
the Commonwealth for many years.

Personal income tax bracket creep is also increasing the average tax rate faced by all workers (even after
recently legislated tax cuts). Bracket creep is highly regressive, as the increase in average tax rates is
greater for those on lower incomes. It can also undermine work incentives for these workers and can create
incentives for tax minimisation by high income earners.

                                                                          PwC | Where next for Australia’s tax system?   6
Inequities
Australia is recognised as:
• having a highly targeted tax and welfare system (see figure 1.5), and consequently is highly redistributive
• levying a low level of direct taxation on lower income groups. This is partly due to progressive personal
income tax arrangements (e.g. the high tax-free threshold, the low income tax offset (LITO) and the low
and middle income tax offset (LMITO)).
FIGURE 1.5
Spending on means - or income-tested cash benefits as percentage of cash public social expenditure10
Australia 77.9
Iceland 66.3
Canada 53.1
Israel 47.9
New Zealand 37.2
Ireland 36.5
Mexico 30.1
Japan 27.6
United States 27
United Kingdom 25.9
Korea 19
Spain 15.9
Netherlands 12
France 9.6
Slovenia 8.8
Norway 8.1
Switzerland 7.4
Portugal 7.1
Germany 6.8
Slovak Republic 6.4
Belgium 6
Italy 5.3
Denmark 5.2
Finland 5
Austria 4.9
Greece 3.7
Poland 3.7
Luxembourg 3.2
Hungary 3
Sweden 2.9
Czech Republic 1.8
0 10 20 30 40 50 60 70 80
PwC | Where next for Australia’s tax system? 7As a result of this targeted and redistributive tax and transfer system, about a third of Australians pay no
net tax. As shown in figure 1.6, households in the bottom three income quintiles receive, on average, more
in cash and in-kind benefits from the government than they pay in taxes. In effect, the top two quintiles of
households fund expenditure on the bottom three quintiles.
FIGURE 1.6
Net tax/welfare position (2015 - 16)11
Equivalised disposable household income quintiles
Lowest Second Third Fourth Fifth All households
Income 343 833 1493 2280 4458 1871
Social assistance benefits (cash) 369 324 211 113 58 215
Selected social transfers in kind
Education benefits 181 155 138 120 99 139
Health benefits 229 271 244 204 202 230
Social security and welfare benefits 101 93 73 44 27 68
Housing benefits 24 2 0 0 0 5
Electricity concessions 3 2 2 1 0 1
Total selected social transfers in kind 538 522 456 369 328 444
Taxes on income 35 114 238 420 1120 382
Total selected taxes on production 124 151 189 224 313 200
Net position 748 581 240 -162 -1047 77
There are also questions around the equity (vertical, horizontal and intergenerational) of existing
arrangements due to the following:
• Labour income is taxed differently to capital gains income (e.g. the capital gains tax (CGT) discount).
• Investment income may be taxed at either full tax rates (e.g. interest income, returns on certain assets
such as gold) or discounted rates (e.g. in relation to CGT assets, superannuation).
Additionally, a number of inequities result from Australia’s reliance on tax expenditures. Tax expenditures
arise when the ‘normal’ tax liability is reduced in order to encourage a particular behaviour, or to assist a
particular group. Tax exemptions, tax deductions, tax offsets, concessional tax rates and deferrals of tax
liability are examples of tax expenditures. In effect a tax expenditure is a deviation from the normal level of
tax applied.
PwC | Where next for Australia’s tax system? 8The Commonwealth Treasury publishes an annual catalogue of estimates of revenues forgone as a
result of tax expenditures.12 While not just an issue for the Australian government13, Treasury estimates
that in 2018 -19, where possible to generate estimates, the net Commonwealth revenue foregone was
$158.6 billion. As shown in figure 1.7, concessions in respect of capital gains tax and retirement savings
comprised the bulk of the value.
FIGURE 1.7
Net tax/welfare position ($ million)14
80,000
60,000
Capital Gains Tax (31)
Retirement Savings (12)
40,000
Goods and services tax (23)
Personal Income (62)
20,000
Business Income (84)
Fringe Benefits Tax (50)
Natural Resources Taxes (6)
0
Commodity & Other Indirect Taxes (21)
-20,000
2015-16 2016-17 2017-18 2018-19 2019-20* 2020-21* 2021-22* 2022-23*
* Pre-COVID forward estimates
As a percentage of GDP in 2018-19 total net tax expenditures accounted for approximately 9.5 per cent
of GDP.15 This is in contrast to direct payments made by the Australian government that are 25.4 per cent
of GDP.16
PwC | Where next for Australia’s tax system? 9While international comparisons are difficult, OECD data suggests that Australia significantly more reliant on
tax expenditures than most advanced countries (see figure 1.8).
FIGURE 1.8
Tax expenditures in selected advanced countries (% of GDP, 2010)17
9 9
8 8
7 7
6 6
5 5
4 4
3 3
2 2
1 1
0 0
uga
l
rea an
y
rlan
d
nd
s
ad
a
nce
rw
ay ark stria ee
ce om
Sp
ain tates Ita
ly
alia
Ko d
Fra
str
ort a n m
P erm i tze therl Ca No Den Au Gr ing dS
G dK
Sw Ne
Un
ite Un
ite
Au
A frequent concern in relation to tax expenditures is that they lack transparency and are seen to benefit
those that need it the least, or result in taxpayers in the same circumstances facing different tax burdens.
Reliance on questionable tax bases
In some areas, significant tax revenue is generated from activities that the government is seeking to reduce
for non-tax reasons. Therefore, government actions may hurt the budget bottom line in the short term.
Examples include:
• Health: Governments have actively sought to reduce smoking rates and tobacco consumption through
price rises, bans on smoking in certain locations, advertising bans and extensive information campaigns.
This has reduced the Commonwealth Government’s tobacco excise receipts.
• Environmental: The Commonwealth has actively sought to improve the efficiency of vehicles, and state
governments have subsidised electric and fuel-efficient alternatives. These measures have reduced
reliance on petrol, lowering fuel excise receipts.
PwC | Where next for Australia’s tax system? 10Significant tax revenue continues to be captured from activities that are expected to be unsustainable
in the medium term, or activities that government might actually have reasons for minimising. As shown
in figure 1.9, the Commonwealth earns significant revenues from fossil fuels and tobacco. These are
substantive revenues (close to $30 billion in 2018-19) that would appear to be questionable in their
sustainability given changing consumer preferences and technologies.
FIGURE 1.9
Select Australian government (cash) receipts ($ billion)18
40
35
30
25
Tobacco
20
15
Diesel
10
5
Petrol
0
2014-15 2015-16 2016-17 2017-18 2018-19 2019-20* 2020-21* 2021-22* 2022-23*
* Pre-COVID forward estimates
Similarly, states earn considerable revenues from gambling activities, many of which are declining
(e.g. racing) or reflect a significant social cost (e.g. receipts from problem gambling).
PwC | Where next for Australia’s tax system? 11Misalignment between revenues and responsibilities
The importance of sustainable government revenue is concerned not only with total government revenue,
but also with ensuring all levels of government (Commonwealth, state/territory and local) generate sufficient
revenue to fund their service delivery responsibilities.
However, Australia has a significant misalignment between revenues raised and revenues expended across
its three tiers of government:
While the states were responsible for nearly half of Australian general government operating expenditure
in 2017–18, their limited taxation capacity means they contributed only 24 per cent of revenues. By
contrast, the Commonwealth raises considerably more revenue than it needs for its own expenditure.
The provision of grants to the states seeks to redress the misalignment of spending and revenue raising
powers, known as vertical fiscal imbalance.19
A degree of vertical fiscal imbalance (VFI) may always be necessary, reflecting the appropriate
differences in the respective roles and responsibilities of different levels of government. For example, the
Commonwealth has advantages (e.g. efficiency, economies of scale and lack of interstate tax competition)
in raising and collecting income tax revenue, and hence it may be efficient for the Commonwealth to collect
more taxes than it directly expends.
The concern is that VFI is excessive in Australia, largely having arisen from the consolidation of taxing
powers with the Commonwealth during World War II.
At the core of Australia’s VFI is the centrality of its tax collections, as shown in figure 1.10.
FIGURE 1.10
Tax revenues of sub-sectors of general government in federal systems, 2017 (% of total tax revenue)20
Central State or regional Local Social security
Supranational
government governments government funds
Australia - 80.6 16 3.4 0
Austria 0.4 65.8 1.6 3 29.2
Belgium 1 51.4 10.8 4.9 32
Canada - 40.9 39.8 10.3 9.1
Germany 0.6 29.5 23.5 8.6 37.9
Mexico - 81.1 4.1 1.6 13.3
Switzerland - 36.5 24.6 15.3 23.6
United States - 44.5 18.3 14.2 23
Unweighted average 0.7 53.8 17.3 7.7 21
PwC | Where next for Australia’s tax system? 12While taxes are disproportionately collected centrally, it is the transfer of such funds to the states and
territories for spending that creates the relatively high VFI shown in figure 1.11. In an Australian context,
VFI should include GST as the Commonwealth collects the tax.
FIGURE 1.11
Vertical fiscal imbalance across selected federations (the share of national payments in total state revenue).21
United States
Germany
Canada
Austria
Australia
Belgium
Mexico
0 10 20 30 40 50 60 70 80 90 100
VFI GST
There exists a consensus that significant VFI imposes a range of costs. In particular, it can:
• weaken government accountability to the public by breaking the nexus between a government’s
decisions on the level of service provision and the revenue raised to fund it
• reduce transparency regarding who is responsible for which government services, allowing governments
to avoid responsibility by shifting blame for funding and operational shortfalls to other levels of government
• create inefficiencies, including through bureaucratic overlap, duplication and excess. and the cost of
administering grants between government
• misallocate resources, including the inadequate or inappropriate funding of services. In particular, when
a government does not have to raise the revenue it spends, this can create ‘fiscal illusion’, potentially
leading to an over-provision of services. This is because governments that receive grants might obtain a
political benefit from providing services without the political cost of raising revenue
• create a disincentive for states and territories to undertake reforms, as some of the benefits of those
reforms may be equalised away to other states and territories because of the inconsistency of VFI across
jurisdictions, coupled with the resultant horizontal fiscal equalisation process.
PwC | Where next for Australia’s tax system? 13Reliance on distortionary taxes
A challenge facing Australian state and territory governments is that they have become increasingly reliant
on a narrow range of taxes that have certain undesirable characteristics. This challenge is acknowledged by
states and territories themselves.22
Inherently inefficient: Due to limited revenue raising options, Australia’s states and territories, continue
to levy a number of highly inefficient transaction taxes, such as stamp duties and insurance levies. It
is well established that both stamp duties and insurance levies are inefficient and can deter otherwise
beneficial transactions from occurring. Australian states and territories currently rely heavily on both these
taxes for their revenue (see figure 1.12), and apply comparatively higher tax rates when compared to other
OECD countries.
FIGURE 1.12
Share of state taxes collected from tax bases with low economic costs (%).23
20.5%
Northern Territory
29.4%
Queensland
21.6%
Western Australia
23.1%
South Australia
33.7%
New South Wales
33.2%
Victoria 20.4%
Australian Capital Territory
30.7%
Australia 26.5%
Tasmania
PwC | Where next for Australia’s tax system? 14Inefficient due to exemptions provided: The efficiency of a number of state and territory taxes is
compromised by exemptions which influence decisions and create economic distortions. This can drive
poor economic outcomes. For example:
• payroll tax-free thresholds create disincentives for businesses to grow and invest
• GST applies to all goods and services, except fresh food, private health and private education
expenditure. Treasury estimates the value of these exemptions at $18.54 billion in 2018-19, with
spending on food, education and medical health services growing fast (figure 1.13). These exemptions
were created to address equity factors but have reduced the economic efficiency of the tax by increasing
complexity and the cost of administration (on average it costs the Australian Taxation Office $1.36 to
collect every $100 of GST revenue, compared with 96c for other taxes).24 Even the equity justification is
challenging given that the value of the exemptions ‘[is] larger for high income households’.25
FIGURE 1.13
Value of GST exemptions26 ($ millions )
10,000
Food
7,500
Education
Health - medical &
5,000 health services
Health - residential care,
community care &
other care services
2,500
Health - drugs &
medicinal preparations
Private health
insurance
Health - medical aids
0 & appliances
2015-16 2016-17 2017-18 2018-19 2019-20* 2020-21* 2021-22* 2022-23*
* Pre-COVID forward estimates
FIGURE 1.14
Household spending subject to GST27
Percent of total household spending
% %
62 62
Value
60 60
Volume
58 58
56 56
54 54
2000-01 2004-05 2008-09 2012-13 2016-17
Source:ABS and PBO analysis
PwC | Where next for Australia’s tax system? 15High compliance costs
While compliance costs appear to have levelled out over recent years (see figure 1.15 for figures in relation
to individual tax compliance), Australia’s tax system continues to impose high compliance costs due to
exemptions, tax-free thresholds and the complexity of the law.
FIGURE 1.15
Average cost ($) of managing tax affairs for individuals28
400
300
200
100
0
1999-00
1998-99
2000-01
2001-02
2002-03
2003-04
2004-05
2005-06
2006-07
2007-08
2008-09
2009-10
2010-11
2011-12
2012-13
2013-14
2014-15
2015-16
2016-17
2017-18
Avoidance through the cash economy
A year ago, it seemed like a big task to even adopt a cash payment limit of $10,000 per transaction, let
alone move towards a near non-cash world. It has also been the case over a long period of time that people
who have an in-substance employment relationship have adopted sham contracting arrangements, leading
to potential under-declaration of income and accompanying tax liabilities.
During the COVID-19 lockdown it has become apparent that people can adapt quickly to contactless
payment options, necessitated by health concerns. The importance of a clear employer/employee
relationship was also evident when employee support payments were introduced to provide a safety net for
the loss of earnings.
The cash economy remains:
manifestly unfair, allowing some to play by their own rules and penalising businesses, employees and
consumers who do the right thing … vulnerable workers are exploited, criminal groups flourish and social
capital and trust are undermined.29
PwC | Where next for Australia’s tax system? 16The broader black economy is estimated to be worth $50 billion per year (based on an estimated 3 per cent
of GDP, as shown in figure 1.16),30 or nearly 40 per cent of the original estimate for the 2020 JobKeeper
support program. Accordingly, there is an urgent need to address this issue through ease of compliance
and a campaign to address the cultural norms of the past.
The amounts shown in figure 1.16 are the estimated components of the costs of the black economy in
Australia. The amounts ‘above the line’ broadly equate to the $50 billion per annum estimate noted above.
The two categories ‘below the line’ are presented separately, as they are also reflected in the above-the-
line activities
FIGURE 1.16
Partial indicators of ‘black economy’ activity31
$7-10b $10-20b $8.5b
Drugs Understated business Cash wages
income
$2.2b $3.8b $4b $2b
Identity fraud Underpayment of GST Illicit tobacco Unregulated offshore
(includes GST fraud) gambling
$0.3b up to $1b $2b $3b
Motor vehicle fraud Border crime Counterfeit goods Phoenixing
$16b $3b
Money laundering Underpayment of wages and superannuation
PwC | Where next for Australia’s tax system? 17What has changed as a result
2 of the COVID-19 pandemic?
2.1 The Great Lockdown
Slowing the spread of COVID-19 has been necessary in order to manage the resources of
Australia’s healthcare system and, in so doing, save lives.
To minimise the risk of person-to-person transmission of COVID-19, Australian governments
progressively and swiftly shut down swathes of the economy by:
• prohibiting certain activities (e.g. elective surgery; ruling that everyone should stay home
unless shopping for essentials, receiving medical care, exercising, or travelling to work or
education, etc.)
• placing constraints on how certain activities are undertaken (e.g. imposing social distancing
obligations; establishing attendance limits for events such as weddings and funerals; requiring
that no more than two people should be out in public together, with the exception of family and
household groups, etc.)
• closing or limiting the use of public spaces and services (e.g. closure of beaches;
recommending or requiring that non-essential workers keep children home from school)
• requiring or encouraging private sector enterprises to shut down or reinvent their service
offering (e.g. closure of pubs and bars; requiring restaurants to provide takeaway only)
• imposing restraints on the movement of people across some domestic borders and more
stringent restraints on travel into Australia.
PwC | Where next for Australia’s tax system? 18The effect of this ‘Great Lockdown’ (as the International Monetary Fund (IMF) termed the current economic
crisis) has been to more than halve community mobility (see figure 2.1) and dramatically reduce resultant
economic activity (see section 2.2).
FIGURE 2.1
Changes in Australians’ mobility (seven day moving average compared to pre-COVID-19 baseline)32
40
Residential
20
0
Grocery & Pharmacy
-20
Parks
-40
Retail & recreation
Workplaces
-60 Transit stations
-80
21/02/2020
25/02/2020
29/02/2020
04/03/2020
08/03/2020
12/03/2020
16/03/2020
20/03/2020
24/03/2020
28/03/2020
01/04/2020
05/04/2020
09/04/2020
13/04/2020
17/04/2020
21/04/2020
25/04/2020
29/04/2020
03/05/2020
07/05/2020
11/05/2020
15/05/2020
PwC | Where next for Australia’s tax system? 192.2 The economic shock
The shutting down of economic activity to address the spread of COVID-19 has created a range of short-
term impacts that have the potential to shape Australia’s medium and long-term future:
• Negative economic growth: The Governor of the RBA suggests that “we are likely to experience the
biggest contraction in national output and income that we have witnessed since the 1930s.”33 The IMF
suggests that Australia’s GDP will decline by close to 7 per cent in 2020.34
• Higher unemployment: The ABS suggests that 7.5 per cent of workers on business payrolls were
lost from 14 March to 18 April.35 Adjusting for off-payroll workers (e.g. business owners, independent
contractors, other self-employed people, etc.) suggests that, of the 13 million Australians who were
working in mid-March, up to a million no longer are. A number of features regarding unemployment are
noteworthy:
- Things will get worse before they get better. With estimates from the RBA Governor of 10 per
cent unemployment by June, Australia can expect that unemployment could edge higher before
starting to recover.
- Higher unemployment will be a challenge for years. Previous economic shocks show that
unemployment frequently remains persistently high for many years (figure 2.2); and the present
circumstances are likely to be any different.
- Not all industries have been equally affected: As shown in figure 2.3, social distancing obligations and
the broader slowdown have affected economic sectors differently, with employment in some industries
(e.g. mining, utilities, education and financial services) largely unaffected in aggregate.
• Business failures: The movement of Virgin Australia into voluntary administration is the highest profile
failure at the time of writing.
FIGURE 2.2
Months for unemployment to recover to pre-recession levels36
Great Depression
20
15
80s Recession
10
90s Recession
5 GFC
0
0 50 100 150
Months since start
PwC | Where next for Australia’s tax system? 20FIGURE 2.3
Change in employee jobs between 14 March and 18 April 37
Agriculture, forestry and fishing -9.50%
Mining -2.90%
Manufacturing -4.10%
Electricity, gas, water and waste services -0.20%
Construction -6.40%
Wholesale trade -4.40%
Retail trade -6.80%
Accommodation and food services -33.40%
Transport, postal and warehousing -3.00%
Information media and telecommunications -6.50%
Financial and insurance services -1.00%
Rental, hiring and real estate services -11.00%
Professional, scientific and technical services -5.60%
Administrative and support services -10.00%
Public administration and safety -5.10%
Education and training -2.00%
Health care and social assistance -2.90%
Arts and recreation services -27.00%
Other services -12.00%
All industries -7.50%
-40.00% -30.00% -20.00% -10.00% 0.00%
Given these negative COVID-19-driven economic shocks, PwC’s Australia Rebooted modelling indicates
a GDP decline of $279 billion over the next two years.38
PwC | Where next for Australia’s tax system? 212.3 The impact on public finances
Restricting permissible economic activity (section 2.1) has necessarily reduced national income (section
2.2), and not surprisingly affected public finances through two channels: increased government expenditure
to assist people and businesses during the lockdown; and reduced tax receipts. These channels are
discussed in turn.
Ballooning government expenditure
In response to a slowing economy, Australian governments are spending at a rate never before seen (see
figure 2.4) through direct support of:
• businesses and employers through a range of support schemes (e.g. JobKeeper, tax holidays, deferred
taxes, direct payments, etc.). Some of these supports have taken the form of delayed obligations to pay
taxes (e.g. payroll tax)
• the unemployed (e.g. through additional JobSeeker payments) and households more generally (e.g. free
childcare, one-off payments to pensioners, etc.).
In addition to this special support, spending will also increase as ‘automatic stabilisers’ kick in to support
people on welfare (e.g. rent support).
FIGURE 2.4
Temporary fiscal measures in response to COVID-1939
25
Commonwealth -
Other stimulus
and announced
health, age care
NSW
and childcare
spending
NSW
0
Underlying cash impact of COVID-19 spend (billions)
Commonwealth -
Commonwealth -
Other stimulus
Other stimulus
and announced
and announced
health, age care
Commonwealth - health, age care
and childcare
Other stimulus and childcare
spending
and announced Commonwealth - spending
health, age care Other stimulus
and childcare and announced
spending health, age care
and childcare
spending
-25
Commonwealth -
JobKeeper
-50 NSW
VIC
QLD
WA
SA Commonwealth -
TAS JobKeeper
NT
-75
-100
Jun-20 Jun-21 Jun-22 Jun-23 Jun-24
PwC | Where next for Australia’s tax system? 22Shrinking government revenue
As at 30 March 2020, the underlying Commonwealth Government cash balance was almost $10 billion worse
than projected at 31 December 2019 (i.e. a deficit of $22.36 billion against a deficit of $12.45 billion).40 This is
before the majority of the stimulus to-date was implemented (i.e. JobKeeper and JobSeeker).
Tax revenues are expected to fall during the COVID-19 pandemic. This will be due to a reduction in
employment (lower personal tax receipts) and an anticipated decline in corporate tax receipts, reflected
in the:
• significant volatility in the Australian Stock Exchange (ASX), as measured by the VIX Index, which implies
significant uncertainty about future corporate profits (see figure 2.5)
• announced and anticipated profit downgrades by major corporates.41
FIGURE 2.5
S&P/ASX, 200 VIX Index
60
40
20
0
06/08/2009
22/10/2009
07/01/2010
25/03/2010
10/06/2010
26/08/2010
11/11/2010
30/06/2011
15/09/2011
01/12/2011
16/02/2012
03/05/2012
19/07/2012
04/10/2012
20/12/2012
07/03/2013
23/05/2013
08/08/2013
24/10/2013
09/01/2014
27/03/2014
12/06/2014
28/08/2014
13/11/2014
29/01/2015
16/04/2015
02/07/2015
17/09/2015
03/12/2015
18/02/2016
05/05/2016
21/07/2016
06/10/2016
22/12/2016
09/03/2017
25/05/2017
10/08/2017
26/10/2017
11/01/2018
29/03/2018
14/06/2018
30/08/2018
15/11/2018
31/01/2019
18/04/2019
04/07/2019
19/09/2019
05/12/2020
20/02/2020
29/04/2020
PwC | Where next for Australia’s tax system? 23Increased government deficit and debt
The consequence of reduced revenue and ballooning expenditure will necessarily underlie budget deficits
and an increase in government debt.
The Parliamentary Budget Office notes that “Australia’s net debt at the end of March 2020 was
around $430 billion, which is around $37 billion higher than the most recent forecast for the end of this
financial year.”42
PwC has undertaken long-run modelling to estimate possible impacts of COVID-19 and subsequent policy
actions on the Commonwealth’s budgetary position. This modelling approach is described in Box 2.1.
BOX 2.1
Long-run fiscal modelling
PwC developed an economic model to understand the potential fiscal impacts of COVID-19 in
the immediate, medium and long term. This modelling incorporates the best available current
information but has been conducted at a time of uncertainty and so will need to be refined as
more information becomes available on: the path of the COVID-19 pandemic; the near-term hit to
the economy; the shape of recovery; and the take-up of key stimulus measures.
Economic Expenditure Revenue
parameters projections projections
• In the short term (current • All announced COVID-19 • All revenue projections are
and next year), economic related expenditure (as at modelled in line with relevant
parameters (such as 22 May 2020) have been economic parameters (and
employment, participation, included. are not assumed to be
population and wages) are consistent with forward
• All non-social welfare
based on actual values estimates) and account for
expenditure is assumed to be
as reported by the ABS previously legislated changes
consistent with most recent
and forecasts provided by to personal income tax rates
budget forward estimates,
the IMF. and corporate income tax
and then assumed to grow
rates for small businesses.
• In the medium term (up to in line with population
eight years), PwC modelled and inflation. • Corporate income tax
recovery profiles for these revenues are forecast to
• All social welfare expenditure
parameters based on account for loss carrying
is modelled based on key
historical analogies, and after the initial economic
economic parameters
current best available shock, by size and industry
of population (including
information on when key gross operating surpluses,
migration adjustment),
restrictions (e.g. international where relevant.
unemployment, age and
migration) will lift.
participation.
• In the long term, PwC
assumed reversion to long
term trends.
PwC | Where next for Australia’s tax system? 24FIGURE 2.6
Projected Commonwealth budget position ($ billions, year ending June)43
25
Underlying cash balance (billions)
0
-25
-50
-75
-100
-125
Jun-20
Jun-21
Jun-22
Jun-23
Jun-24
Jun-25
Jun-26
Jun-27
Jun-28
Jun-29
Jun-30
Jun-31
Jun-32
Jun-33
Jun-34
Jun-35
Jun-36
Jun-37
Jun-38
Jun-39
Jun-40
PwC predicts that, without changes to Australia’s tax system, the Commonwealth budget will not return
to balance for the next 19 years (see figure 2.6), let alone generate the surpluses needed to pay down the
new debt. In the 2010 Commonwealth budget it was projected that Australia would reach zero net debt in
2029‑30; with the projected deficits shown in figure 2.6 PwC now forecasts this to not occur until 2056-57.
This means that an 18 year old entering the workforce this year could have expected to work under
consecutive federal budget surpluses for the foreseeable future, and to see the Commonwealth achieve
zero net debt by the time they were 28 years of age. Now that same worker cannot expect a budget surplus
until they are 37 years old, and net debt is not predicted to reach zero until they are 55.
PwC | Where next for Australia’s tax system? 25The need for tax reform in
3 a post‑COVID-19 Australia
While Australia entered the COVID-19 pandemic in a relatively enviable state, and it may
emerge in a position of relative strength given the apparent success in minimising the spread of
COVID-19, the short-term impact identified in the previous chapter will create ongoing challenges
for all Australian governments.
The case for tax reform existed pre-COVID-19; and the pandemic has merely exacerbated existing
problems and brought them to the fore.
3.1 Revenue
Public finances have been thrown out of balance. Australia has seen an easing of fiscal policy in
response to COVID-19 disruption that will drive a deterioration in the Commonwealth budget from
being broadly in balance in 2018-19 to a projected deficit of about 7 per cent of GDP in 2019-20
and somewhere in the vicinity of 8-12 per cent in 2020-21.44 Significant deficits are also expected
by the states and territories.45
Past experience shows that short-term public expenditure rises during recessions and has a habit
of becoming locked in (see figure 3.1), meaning that the process of budget repair tends to be
a long one. Hence, repairing the tax base early is important. Indeed, as noted in section 2.3,
maintaining Australia’s existing tax system in light of projected population, participation and
productivity growth (the ‘three Ps’) means the nation will not get back to a neutral budget position
until 2039.
PwC | Where next for Australia’s tax system? 26FIGURE 3.1
Australian government general government sector receipts and payments46
Receipts as a % of GDP Payments as a % of GDP
30
25
20
Early 1980s 1991 2008-09
Recession Recession Global Financial Crisis
0
1980 1990 2000 2010 2020
Year ending June
Should existing budget deficits extend over long timeframes – or show no signs of returning to a
sustainable balanced budget over the economic cycle – they can have broader consequences. This is
particularly the case when budget deficits are driven by structural rather than cyclical factors. Large deficits
focused on funding the requirements of today’s citizens, rather than investment for the future, may mean
future generations will face a higher tax burden. Instead of accepting this outcome, Australia should aim to
get government budgets back into a neutral position over the economic cycle. The above circumstances
create the impetus for governments to implement an appropriate policy response.
However, the purpose of tax reform should not be to generate surpluses to pay back the $140 billion
expected to be directly incurred by the Australian government as part of the COVID-19 support package.
Such an objective is not immediately necessary because:
• there is little risk of increased government spending ‘crowding out’ the private sector any time soon given
the collapse in demand, low (and even negative) inflation, and low interest rates
• the potential cost of increased government spending is limited given that the interest rate the Australian
government pays on new debt is at a historic low (i.e. just 0.8 per cent for money borrowed for 10 years).
As a result, if the Australian economy resumed its long-run average growth rate after the current crisis,
any increase in debt as a percentage of GDP will halve within 20 years
• the cost of increased government spending is unlikely to destabilise financial markets. Even with the
stimulus provided by the Australian government (see figure 1.3), the nation will continue to have low
levels of government net debt relative to comparable countries and will continue to be seen as a safe
haven by financial markets (see figure 2.1).
Tax reform is necessary to shore up Australia’s federal budget position by finding
reliable and sufficient sources of revenue to meet required spending needs.
PwC | Where next for Australia’s tax system? 273.2 Equity
The health and economic responses to COVID-19, put in place to protect older populations that are more
susceptible, have resulted in a significant intergenerational transfer of wealth. This has manifested in a
couple of ways:
• shutting down significant portions of the economy has exposed working-age people, and particularly
those in casual employment (i.e. the young), to unemployment. The persistence of unemployment after
economic crises (see figure 2.2) suggests that this will impose personal costs for years.
• almost 900,000 Australians have already applied for early withdrawal from superannuation. The
Commonwealth Government expects this number will rise to 1.6-1.7 million, equating to about $27 billion
coming out of the superannuation system. While this may be important in sustaining the living standards
of those accessing their superannuation, it potentially diminishes living standards in future years directly
(i.e. through lower savings) or indirectly (i.e. because more burden is taken up through the pension, and
so entrenches inequality in the community and makes budget repair harder).47
In effect, the economic sacrifice of The Great Lockdown represents a loss of wealth from young/working-
age people to protect the health outcomes of those over the age of 60.
It may be that the beneficiaries of that protection should repay that support (at least in part).48 This could be
achieved by addressing tax advantages that disproportionately benefit the relatively well-off over the age
of 60. For example:
[W]here the next generation has a justified grievance is the costs of the tax breaks that support the build-
up of these nest eggs. Your superannuation gets special tax treatment – a flat 15% tax on the way in, and
no tax at all on earnings once you’re retired, except on very large balances.
These tax breaks, combined with refundable franking credits and the Seniors and Pensioners Tax Offset,
have resulted in the share of households over 65 paying tax almost halving over the past two decades.
Older Australians now pay on average about half as much income tax as younger households on the
same income.
Many of these tax benefits were introduced in the past 20 years and their generosity is now starting
to bite: the cost is a growing tax burden on working-age Australians. Younger Australians have always
supported services to older Australians through their income taxes, but the size of this transfer is much
bigger now and growing quickly.49
Tax reform is necessary to address some of the equity issues associated with the
distribution of costs and benefits associated with Australia’s response to COVID-19.
PwC | Where next for Australia’s tax system? 283.3 Economic growth
PwC’s recent Australia Rebooted report, identified that economic growth should be the priority for
Australian governments. This reflected modelling outcomes that showed that, compared to a passive
‘no‑change’ approach, a high-growth model (‘Enterprise Australia’) would create $64 billion over the period
2022-2030 and get the nation’s economic growth trajectory back to (and in fact slightly exceed) the
pre-COVID-19 growth trajectory.
FIGURE 3.2
Forecast real GDP ($2019-20 billion)50
2,600
Enterprise Australia
2,500
2,400
Base case
2,300
2,200
Fortress Australia
2,100
2,000
1,900
1,800
1,700
1,600
2018 2019 2020 2021 2022 2023 2024 2025 2026 2027 2028 2029 2030
Pre-COVID-19 base case
Even if policies are adopted that establish different objectives (e.g. greater self-sufficiency), this should be
done in a broader policy environment in which no-regret steps are taken to maximise economic growth.
Key to raising economic growth is raising Australia’s productivity levels, given that labour productivity
growth has been weak and slowing compared with previous years.51 The major factor driving this poor
performance in recent years has been the fact that the capital-labour ratio (i.e. the quantity of capital inputs
used per unit of labour input – referred to as ‘the contribution from capital deepening’) has progressively
weakened. So much so, that Australia has seen the economy-wide capital-labour share fall (i.e. ‘capital
shallowing’). Tax reform has a role in addressing business’ incentive to invest in new capital.
As noted in section 1.2, Austraila’s tax system is riddled with economic inefficiencies that have been
highlighted by successive reviews (discussed in section 4.1). This is a ‘luxury’ that the nation cannot afford
if it is to grow from COVID-19.
Tax reform is necessary to reduce distortions and other inefficiencies that are a
handbrake on Australia’s economic growth.
PwC | Where next for Australia’s tax system? 294 Is now the time for tax reform?
4.1 Hasn’t this been tried before?
Fundamental tax reform has been one of those problems put in the ‘too hard basket’.
Successive independent reviews of Australia’s tax system52 have highlighted a myriad of systemic
problems, yet the politics of reform have generally proven insurmountable. Tax reviews have
included, for example:
• in 1998, the Liberal-National Commonwealth Government appointed John Ralph AO to conduct
a review of the Australian business taxation system.53 The review took place in the context of
the Howard government exploring the introduction of a GST
• in 2008, the freshly elected Rudd ALP government directed former Treasury Secretary Ken
Henry AC to conduct a ‘root and branch’ review of Australia’s business and non-business
tax systems (the Henry Review).54 The review took place in the context of the Rudd/Gillard
governments exploring the introduction of a mining tax
• in 2011, the Gillard ALP government convened a tax forum at the behest of cross-bench
members of Parliament.55 This tax forum took place in the context of the Gillard government’s
introduction of a carbon price
• in 2015, the Abbott LNP government started a review of the Australian tax system under the
auspices of the tax white paper.56
In each case, the broad purpose of the reviews was to promote economic growth, equity,
simplicity and certainty, and to support Australia’s fiscal position.57 In each case, the review
led to the identification of a range of problems or gaps in Australia’s tax law, and to a set of
recommendations that would fix or mitigate that problem or gap. In most cases (with the possible
exception of the Ralph Review), the proposed reforms were largely or partly left unenacted, and
the goals of the review went unrealised.
PwC | Where next for Australia’s tax system? 30Plainly, recent years have not been free from reform. The Howard government introduced the GST, and
the Rudd/Gillard governments introduced the carbon price and mining tax (each subsequently repealed).
In the aftermath of the Ralph Review, the Board of Taxation was formed, which has produced regular and
important reports and recommendations on a range of tax reform issues. Furthermore, in recent years
there has been a flood of both unilateral and multilateral actions to mitigate base erosion and profit shifting
(BEPS), including the introduction of the Multinational Anti-Avoidance Law (2015), the Diverted Profit Tax
(2017), and the anti-hybrid rules (2018). However, there has not been sufficient political will or public interest
to undertake holistic and structural tax reform, where such tax reform might not align with the preferred
outcomes of key domestic stakeholder groups.
While Australia has achieved these very targeted and specific reforms, in the same period there has been
significant tax reform to grow economies in other jurisdictions. These include, for example:
• the gradual lowering of the corporate tax rate in the UK from 30 per cent to 19 per cent over the
past decade
• changes introduced by the Trump administration in the US, including:
- a significant reduction in the corporate tax rate (from 35 per cent to 21 per cent)
- tax cuts for pass-through businesses
- capping interest deductibility at 30 per cent of EBITDA (after four years, EBIT)
- immediate expensing of some capital investments
- efforts to effectively tax foreign earnings, including a Base Erosion Anti-abuse Tax (BEAT) and a levy
on a company’s (creatively named) Global Intangible Low-Taxed Income (GILTI)
• the introduction of patent box regimes in many European countries, which encourage the development
and utilisation of homegrown intellectual property by providing concessional tax rates on revenue
generated by that intellectual property, thereby enabling those countries to attract science, technology,
engineering and maths (STEM) jobs and compete for transfer pricing margins.
Even with such changes overseas, there has not been a sufficient ‘burning platform’ to ignite the willingness
of stakeholders to embrace reform that may not align with each stakeholder’s preferred outcomes, and so
some form of status quo has continued.
However, the economic shock experienced in responding to COVID-19 provides such a ‘burning platform’
that might encourage policy decision-makers today to necessarily challenge the status quo.
That Australia has tried comprehensive tax reform previously and largely failed should not be a reason for
not proceeding.
Governments have been given a ‘pass’ to do what is right in these unusual circumstances, often defying
traditional stereotypes and entrenched positions. This opportunity to step outside convention should be
used to overcome the barriers to tax reform that have existed over the past two decades.
PwC | Where next for Australia’s tax system? 31You can also read