The Provision of Mapped Hazard Data - Global good practices and an inventory of online information in South East Asia - OECD
←
→
Page content transcription
If your browser does not render page correctly, please read the page content below

The Provision of Mapped
      Hazard Data
 Global good practices and an
inventory of online information
      in South East Asia
            Owen Gough
            August 2009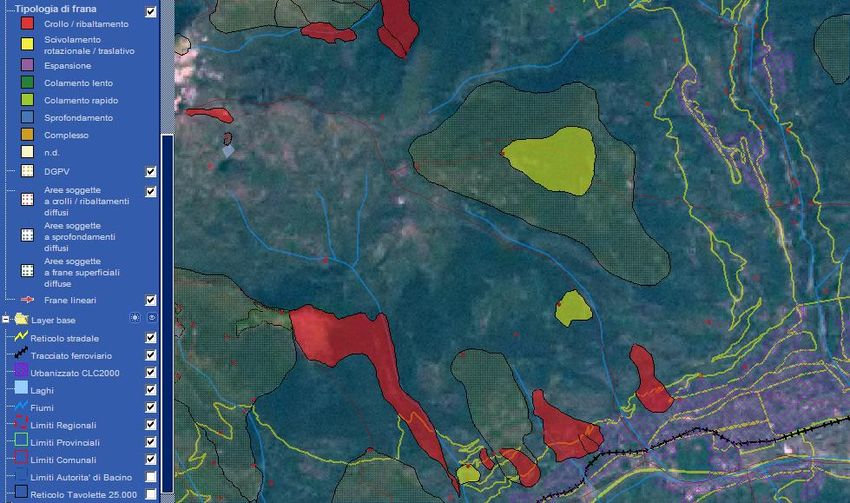
South East Asia has many areas of high population density which, when combined with the lack
of building codes and planning, are particularly vulnerable to hazards. A large disaster may set
back a country’s economic and structural growth by many tens of years in a single moment, not
to mention the loss of human life. The continued economic development of many South East
Asian countries depends on proper hazard management.

The provision of mapped hazard information is essential to proper planning and development of
evacuation plans and disaster risk management. Ideally such information should be available
freely; both to residents, communities, NGOs and to those with an external interest, such as
potential investors. This empowers the general public to make their own decisions regarding
what is an acceptable level of risk and in many ways reduces the responsibility of a government
to dictate terms.

Many people still view natural disasters as an unavoidable divine act which man cannot attempt
to manage. Through proper education this attitude can change, natural hazard events are
inevitable but disasters can be avoided. Cyclone Nargis is a tragic example of a disaster which
could have been largely prevented. Hundreds of thousands of people living in low lying areas of
Myanmar were never made aware of their vulnerability to tropical storm induced surges,
meaning that when Nargis formed in 2008 there were no attempts to evacuate or warn the
public, resulting in a large number of casualties probably exceeding 130,0001. A simple storm
surge hazard map may have been sufficient to make populations aware of the need to evacuate.

This report found that, whilst hazard maps are not always easily available or made using
probabilistic models, the majority of hazards in the majority of countries have been mapped.
Notable exceptions are tsunami and tropical storm maps, both of which do not appear to be
available online. In some countries it is not clear whether they have been produced but are only
kept locally; in others there has been confirmation that they do not exist. Generally the best
mapped hazard was flooding, although this rarely included off plain or sheet floods. Maps in
Appendix 1 summarise the levels of online hazard information available for each country
included in the report.

                                                                                     Page|1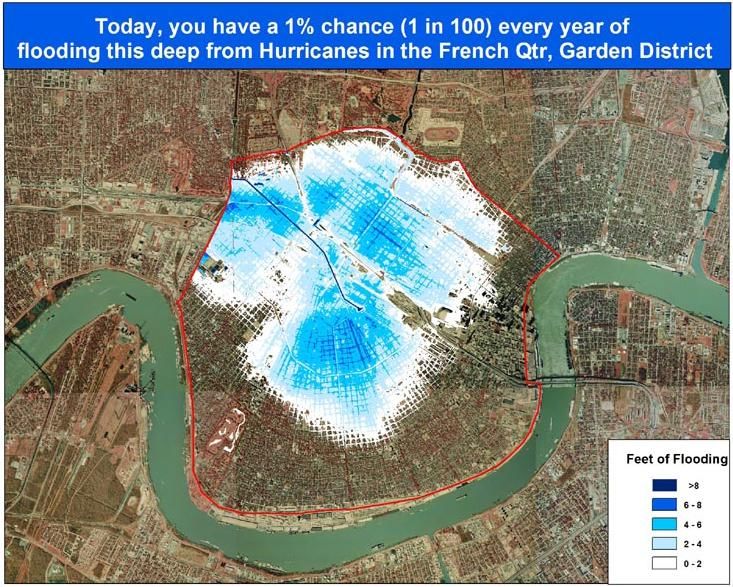
Table of Contents
1. Introduction ...................................................................................................................................4
   1.1 Parameters of Hazards ................................................................................................................... 6
     Floods .............................................................................................................................................. 7
     Landslides (Mudslides)..................................................................................................................... 7
     Earthquakes..................................................................................................................................... 7
     Tropical Storms................................................................................................................................ 8
     Volcano ........................................................................................................................................... 8
2. Examples of current global good practice in the generation and online provision of hazard maps .....9
   2.1 Earthquakes ................................................................................................................................. 10
   2.2 Floods .......................................................................................................................................... 11
   2.3 Landslides .................................................................................................................................... 12
   2.4 Storm Surge ................................................................................................................................. 14
   2.5 Tropical Storms ............................................................................................................................ 15
   2.6 Tsunamis ..................................................................................................................................... 16
   2.7 Volcanoes .................................................................................................................................... 18
   2.8 Examples of real time hazard mapping ......................................................................................... 19
   2.9 Examples of evacuation mapping ................................................................................................. 20
3. An inventory and survey of mapped hazard information in South-East Asia ................................... 21
   3.1 Bangladesh: Earthquakes, Floods, Tropical Storms ....................................................................... 22
     Earthquakes................................................................................................................................... 22
     Floods ............................................................................................................................................ 22
     Tropical Storms and Storm Surges ................................................................................................. 24
     Conclusion ..................................................................................................................................... 25
   3.2 Cambodia: Floods ........................................................................................................................ 26
     Floods ............................................................................................................................................ 26
     Conclusion ..................................................................................................................................... 27
   3.3 Indonesia: Earthquakes, Floods, Landslides, Tsunamis, Volcanoes ................................................ 28
     Earthquakes................................................................................................................................... 28
     Floods ............................................................................................................................................ 29
     Landslides ...................................................................................................................................... 30
     Tsunamis ....................................................................................................................................... 31
     Volcanoes ...................................................................................................................................... 32
     Conclusion ..................................................................................................................................... 33
   3.4 Lao PDR: Floods ........................................................................................................................... 35
     Floods ............................................................................................................................................ 35
     Conclusion ..................................................................................................................................... 36
   3.5 Malaysia: Floods .......................................................................................................................... 37
     Floods ............................................................................................................................................ 37
     Conclusion ..................................................................................................................................... 38
   3.6 Myanmar: Earthquakes, Floods, Tropical Storms, Tsunamis ......................................................... 39
     Earthquakes................................................................................................................................... 39

                                                                                                                                            Page|2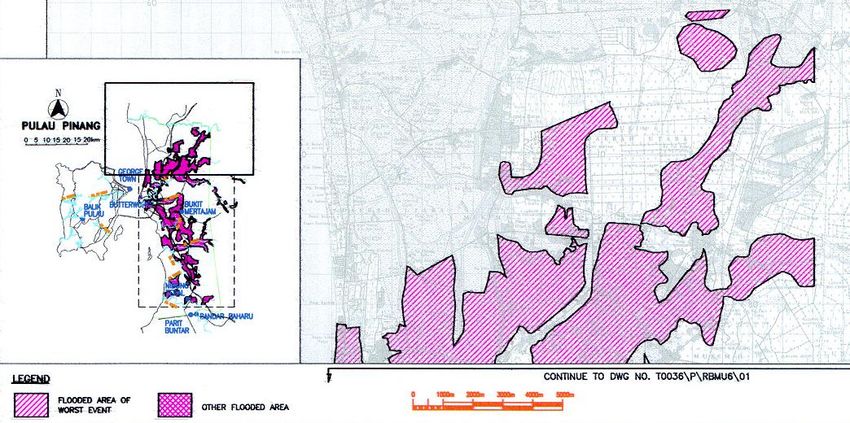
Tropical Storms and Storm Surges ................................................................................................. 40
     Tsunamis ....................................................................................................................................... 40
     Conclusion ..................................................................................................................................... 40
   3.7 Philippines: Earthquakes, Floods, Landslides, Tropical Storms, Tsunamis, Volcanoes .................... 42
     Earthquakes................................................................................................................................... 42
     Floods ............................................................................................................................................ 42
     Landslides ...................................................................................................................................... 43
     Tropical Storms and Storm Surges ................................................................................................. 43
     Tsunamis ....................................................................................................................................... 44
     Volcanoes ...................................................................................................................................... 44
     Conclusion ..................................................................................................................................... 45
   3.8 Singapore: Floods ........................................................................................................................ 46
     Floods ............................................................................................................................................ 46
     Conclusion ..................................................................................................................................... 47
   3.9 Thailand: Floods, Tsunamis .......................................................................................................... 48
     Floods ............................................................................................................................................ 48
     Tsunamis ....................................................................................................................................... 49
     Conclusion ..................................................................................................................................... 50
   3.9 Vietnam: Tropical Storms, Floods ................................................................................................. 51
     Floods ............................................................................................................................................ 51
     Tropical Storms and Storm Surges ................................................................................................. 51
     Conclusion ..................................................................................................................................... 52
   3.10 Multinational Bodies .................................................................................................................. 53
     Indian Ocean Tsunami Warning System ......................................................................................... 53
     Dartmouth Flood Observatory ....................................................................................................... 53
     Mekong River Commission............................................................................................................. 54
     Munich Re NATHAN ....................................................................................................................... 55
     GSHAP and GEM ............................................................................................................................ 56
Conclusion ....................................................................................................................................... 57
       Earthquakes................................................................................................................................... 57
       Floods ............................................................................................................................................ 57
       Landslides ...................................................................................................................................... 58
       Tropical Storms.............................................................................................................................. 58
       Tsunamis ....................................................................................................................................... 58
       Volcanoes ...................................................................................................................................... 58
Appendix 1: Maps of hazard information level .................................................................................. 59
Appendix 2: Alphabetical list of abbreviations .................................................................................. 62

                                                                                                                                             Page|3
1. Introduction
Many thousands of people are affected globally by natural disasters every year. Large scale events cause
significant problems for entire countries or regions. Damage to infrastructure can be very costly and loss
of human life may remove skilled members of the workforce. A single event can lead to many months,
or even years, of disruption as people are displaced and governments must provide aid and shelter for
those affected.

The process of producing a thorough disaster risk management (DRM) plan in a country is long and
requires significant focus and investment from government bodies. For any successful DRM scheme risk
must first be identified, usually via data collection and mapping. Mitigation, response and development
plans may then be constructed from this initial data. The disaster management cycle shows the various
stages of hazard management and response. Whilst development is only specifically mentioned in the
reconstruction phase, it can and should be incorporated in to all phases of DRM.

  Preparedness
                                              Disaster                                       Relief
                                               Event

                                                                                         Rehabilitation
     Warning
                                                                                         and Recovery

                                                                                        Reconstruction
    Mitigation                               Hazard Analysis                                 and
                                                                                         Development

Fig. 1 Disaster management cycle

There is an important role for NGOs in raising hazard awareness and disaster risk education and
preparedness, given the potentially inadequate resources dedicated to disaster risk management.

Whilst government plans for mitigation and response are essential, the mapped information should be
made available at all levels in a country to empower individuals to make their own decisions regarding
risk. Provision of risk maps to a population may remove some of the challenges of producing effective
response plans as a better informed population requires less guidance from a government in the event
of a crisis.

                                                                                               Page|4
In the developed world and increasingly in the developing world, the internet is becoming the primary
source of information transfer. It provides a free and instant way of transmitting large amounts of data
on demand to a user based on their requirements/search. Primary users of online information are likely
to include: civilians, civil societies, those in the insurance industry, members of the scientific community,
NGOs, local officials and potential investors.

In some areas internet penetration is still extremely low and therefore paper copies of local hazard
maps should be provided to be displayed in community centres, such as village halls. Hazard warnings
and other essential information should still be provided in widely available forms of media such as radio
and television, as these ensure a more immediate response than the internet. As mobile phone
coverage and ownership is so high, even in the poorest regions of countries, SMS text messages are a
highly effective way of rapidly disseminating warnings and alerts. This has been acknowledged and many
governments are exploiting the potential of SMS warnings.

Provision of risk information to a population is essential to allow for continued growth and
development, as without proper hazard mapping and identification a countries progress will continually
be set back by disasters.

The good practices section proposes examples of online hazard mapping from developed countries,
which regularly experience natural hazards. These countries have used high quality hazard information
to drive significant DRM schemes but have also taken extensive steps to inform and educate the general
public and other interested parties. These good practices do not necessarily apply to all South East Asian
countries, as requirements and available resources may be very different. Depending on the target
audience differing criteria apply. NGOs and those in the insurance industry and scientific communities
may appreciate and require much more detailed and technical information than a resident only
interested in the level of hazard to their home.

The final section of this report surveys the current state of online hazard mapping in South East Asia,
based on what is available remotely. Potential gaps in coverage and particularly good examples of
mapping are highlighted.

For the purposes of the report South East Asia is defined as those countries within the Association of
South East Asian Nations2 (ASEAN) with the addition of Bangladesh as it is in a similar developing
financial state and suffers from a hazard profile in common with many ASEAN countries. Brunei
Darussalam, whilst a member of ASEAN, has no significant risk from the hazards being considered in this
report and therefore has been excluded; it also does not have a recognisable natural disaster
management program.

                                                                                                  Page|5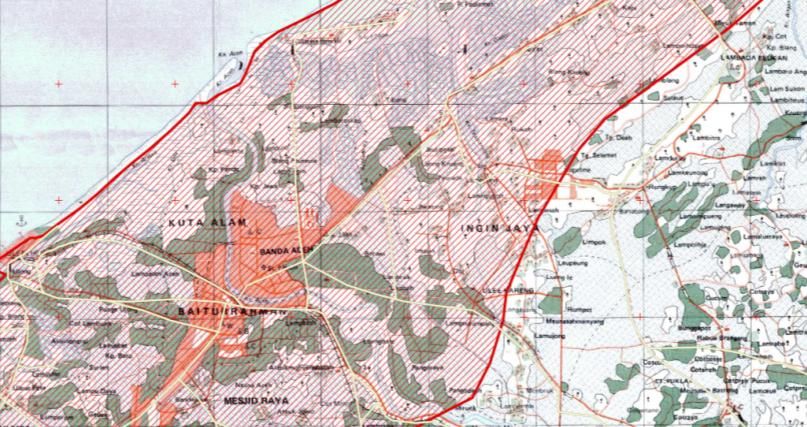
Fig. 2 Map of countries included in the report.

1.1 Parameters of Hazards

Each natural hazard may produce one or more damaging agents which combined cause a disaster. The
risk of these different agents may not be equal in all areas for a single event, and so an ideal hazard
assessment would deal with each damaging agent separately.

In many cases all forms of hazard are not considered during mapping, for example floods are usually
only mapped in terms of river over flow (slow) floods when in fact there are many types including; sheet
floods (where high volumes of rain fall on sloping areas of impermeable ground), flash floods (either
caused by extreme rainfall, sudden glacial melting or catastrophic failure of dams) and urban flooding
(frequently caused, or worsened by, sewer overflow).

The wide spread influence of humans in natural hazards is well documented, particularly relating to
climate change, global warming and associated sea level rise. On a smaller scale logging may
substantially increase the risk of landslides, both by reducing slope support and increasing the
vulnerability to heavy rain.

The principal hazards considered in this report are listed below along with the main damaging agents
that should be considered. Suitable hazard zones for maps are also suggested, based on likely areas that
damaging agents will affect.

                                                                                             Page|6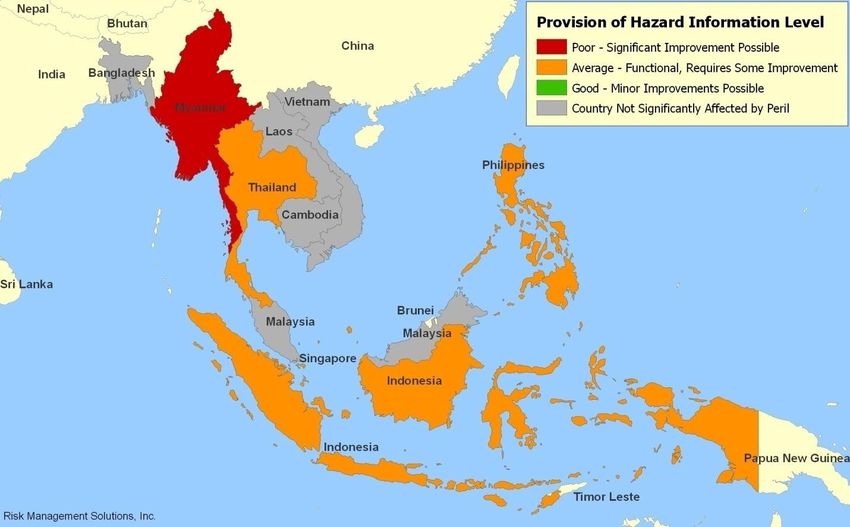
Floods
An ideal flood hazard map should include information on:
        Height of inundation
        Velocity of water
        Likelihood of wave action
        Likelihood of debris
        Risk of secondary hazards: Landslides (Mudslides)
Flood hazard zones may be divided in to those where:
        velocity is the primary damaging agent (near to the coast or in mountainous areas)
        height of inundation is the primary damaging agent (lowland flood plains)
        wave action may add to damage in coastal areas, particularly during storm surges as wind
        speeds will inevitably be high
        transported debris may cause additional damage (any populated areas where flood water is
        likely to have a high velocity)

Landslides (Mudslides)
An ideal landslide hazard map should include information on:
        Slump or subsidence of land
        Hazard zones for debris flows
        Risk of secondary hazards: Tsunami (only if catastrophic landslides in to lakes, or submarine)
Landslide hazard zones may be divided in to those at risk from:
        actual land slump (those on unstable slopes)
        run out of slides (those at the base of an unstable slope or in valleys some distance downhill)

Earthquakes
Whilst shaking obviously causes a great deal of damage and loss of life, in certain soils liquefaction can
be just as damaging. Rupture and landslides are only likely to affect small areas. An ideal earthquake
hazard map should include information on:
        Magnitude of shaking
        Likelihood of liquefaction
        Fault rupture
        Risk of secondary hazards: Tsunamis and Landslides
Earthquake hazard zones may be divided in to those at risk from:
        ground shaking (local amplification may occur in certain soil hardness profiles)
        liquefaction (depending on soil saturation)
        fault rupture and landslides (may affect small regions along faults or close to unstable slopes)
        large submarine earthquakes (have the potential to generate tsunamis)

                                                                                                Page|7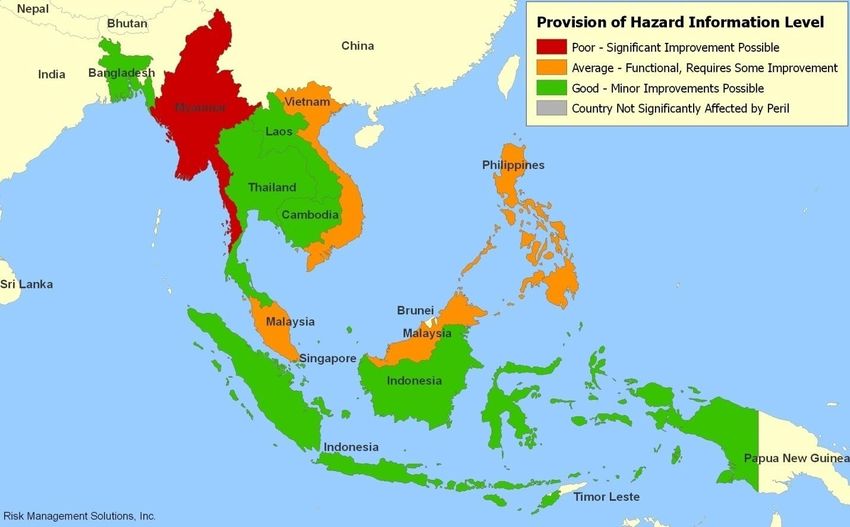
Tropical Storms
In tropical storms the secondary hazard of a storm surge frequently causes the most damage and loss of
life. An ideal tropical storm hazard map should include information on:
          Wind speed of gusts
          Damage from precipitation
          Risk of secondary hazards: Storm Surge, Floods, Landslides (Mudslides)
Tropical storm hazard zones may be divided in to:
          generally low lying coastal regions which are at risk from storm surges, although this may extend
          some distance inland via tidal inlets
          areas some distance in land which usually experience heaviest rainfall once wind speeds have
          diminished somewhat
          areas close to landfalling tropical storms which usually experience the strongest winds as these
          will rapidly lose strength once the storm is over land

Volcanoes
Volcanoes mix a suite of local hazards with the very wide reaching hazard of lahars. An ideal volcano
hazard map should include information on:
        Hazard zones for flows (pyroclastic and lava)
        Ash fall
        Ballistics and lateral blast
        Risk of secondary hazards: Earthquakes, Landslides, Lahars
Volcanic hazard zones can be split in to local, topographical and aerial:
        local hazards include lateral blasts, ballistics and toxic gas release and these only threaten a
        relatively small area in close proximity to the crater
        topographically constrained hazards include pyroclastic flows and surges (usually confined to 5-
        10km around the volcano) and lahars (volcano induced flash floods which may travel many
        hundreds of kilometres)
        aerial hazards are mainly caused by heavy falls of ash causing roof collapse and health problems,
        although in very large eruptions projectiles may be of a sufficient size to cause damage in
        themselves

                                                                                                Page|8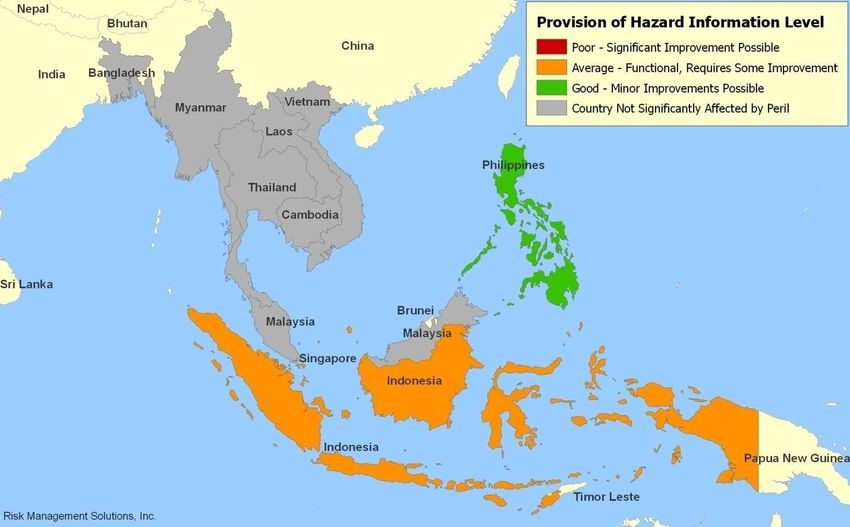
2. Examples of current global good practice in the generation and online
provision of hazard maps
In some parts of the developed world it may be acceptable to require a small payment to access
information as if there is a financial incentive the commercial sector may improve the quality available.
It is certainly not unreasonable to expect a user to provide a small fraction of the value of a property to
ensure it is not at risk from hazards. In the developing world information should be available for free, as
disposable income is very different. Good practices have been selected for being readily accessible, easy
to understand for non technical users and providing useful information. In some cases no ideal resource
existed, and in these cases the examples that came closest to these criteria were included.
At a local level the Californian Emergency Management Agency3 (CALEMA) website, which provides
tabbed information on fires, earthquakes and floods, is an excellent example of how government bodies
should present hazard information to the general public, particularly in a region where there is more
than one substantial natural risk. For each level of risk from a particular hazard tailored information is
easily available both on how to prepare and how to report and respond to an emergency, in a variety of
formats. The tables at the end of the each good practice summarise the information provided and rate
it. A key to the tables and colours used is provided below.
Hazard Map – Producing Authority
Type of map Either risk based (probabilistic/historical) or forecast
Parameters Damaging agent A, damaging agent B, damaging agent C
Risk Boundaries Boundaries for damaging agent A, boundaries for damaging agents B and C
Information Preparedness, evacuation or response information
Retrieval Method How the data is retrieved by the user (e.g. address search or coordinates)
Access How the user initially locates the map or the search form
Coverage Stars () approximately represent the coverage of the risk area
Excellent Very difficult to improve
Good Minor improvements possible
Average Functional but requires some improvement
Poor Substantial improvement possible
Page|92.1 Earthquakes
My Hazards – California Emergency Management Agency (CALEMA)
The CALEMA ‘My Hazards’ program4 provides a search function based on location (address, zip code or
city) or alternatively allows the user to set a location by clicking on a map of California. The page
returned then lists risk of shaking along with an indication of the presence of landslide, liquefaction or
fault rupture hazard. Advice on how to prepare is also provided tailored to the specific location, with
links to leaflets explaining each step. The ‘My Hazards’ map also allows the user to view their wildfire
and flood risk for the given location (with a similar level of detail and advice) giving a unified resource
for the total risk to their property. The only criticism of this website is the lack of numerical probabilities
for high and medium risk boundaries.
Fig. 3 Screenshot of the information page showing the risk level of hazards, the checklist of suggested steps to
prepare and the tabs to view flood and fire risk
My Hazards – CALEMA
Type of map Probabilistic
Parameters Shaking, liquefaction, landslide, fault rupture
Risk Boundaries High/medium, at risk areas
Information Preparedness information tailored to each risk level, multi-format
Retrieval Method Search by zip/address/coordinates
Access Prominent banner link from California state and emergency website
Coverage Covers all areas of the state of California
Fig. 4 Summary table of My Hazards – CALEMA
P a g e | 102.2 Floods
Flood Map – England and Wales Environment Agency
The Environment Agency online flood map5 provides a postcode based search and returns a map
showing flood hazard at 1%, 0.5% and 0.1% annual chance. The map additionally shows areas which are
protected by flood defences and would otherwise be at risk. Flood defences will protect against a 100
year river flood and a 200 year coastal flood. Information is available tailored to each risk zone, for how
to plan and deal with flooding. The data used is provided and information is given on how the map is
constructed. Current flood warnings may be accessed either by using the internet or, on registration,
may be sent by text to those at risk. There is no information provided on the map for water depth,
velocity or likelihood of wave action and the scheme does not make any attempt to model sewer over
flow flooding.
Fig. 5 Screenshot of map showing regions of likely flooding, extreme flooding and protected zones. Data on specific
location risk is available by clicking on the map
Flood Map – England and Wales EA
Type of map Probabilistic
Parameters No information
Risk Boundaries 1%/0.5%/0.1% annual chance of flooding (100/200/1000 year RP)
Information Tailored information for each flood risk category
Retrieval Method Search by postcode or browse map
Access Prominent link from Environment Agency website
Coverage Covers all of England and Wales
Fig. 6 Summary table of Flood Map – England and Wales EA
P a g e | 112.3 Landslides
Progetto IFFI – Istituto Superiore per la Protezione e la Ricerca Ambientale
The Italian project to map and predict landslides is available online to the general public6 in the form of a
layered GIS map. This can be searched by location or browsed. Information is given on various types of
earth movement hazard, such as subsidence, expansion and collapse. Historical landslide data is
available by selecting points on the map. Areas at risk of superficial landslides, subsidence, collapse and
mass movement are marked on. Metadata for both landslide data and base layer mapping is given.
Fig. 7 Extract from the IFFI GIS map. Dark green areas are at risk from superficial landslides, light green areas
experience creep, red areas have experienced collapse or tipping and purple hatching represents urban
development
Progetto IFFI – ISPRA
Type of map Probabilistic/Historical
Parameters Superficial landslides, subsidence, collapse, expansion
Risk Boundaries Only given as ‘at risk’ areas
Information None
Retrieval Method By address or area
Access Theoretically easily accessed but site frequently goes down
Coverage All regions of Italy covered
Fig. 8 Summary table of Progetto IFFI – ISPRA
P a g e | 12Slope Information System – Hong Kong Slope Safety
The Hong Kong government has implemented a scheme of registration for some 57,000 substantial
slopes to ensure that they meet a minimum standard of stability. Whilst this currently only covers man
made slopes, from 2010 onwards the project will expand to cover natural slopes which pose a risk to
human settlement. Registered slopes are marked on a map, along with historical landslide data, which
may be searched by location (building name, street or coordinates) or browsed by district7. Individual
slope data can be viewed by clicking on slope registration numbers in the map. This includes detailed
reports and diagrams of stability, along with a “consequence to life” rating. No indication is given of the
individual risk to a property, although this can easily be worked out by viewing data for nearby slopes.
Fig. 9 Screenshot of a slope hazard map. Manmade slopes are marked in green with historic landslide scars in red
If government slope safety screening determines that a slope is at risk they may issue a “Dangerous
Hillside Order” to the owner of the property on which the slope lies, requiring professional investigation
and remedial measures to be arranged by the owner.
Slope Information System – HKSS
Type of map Historical
Parameters None
Risk Boundaries Poorly defined “consequence to life rating”
Slope stability reports and diagrams, with preparedness etc. available in other
Information
sections of HKSS website
Retrieval Method Search by street, building name or coordinates
Access Prominent HKSS link on main Hong Kong city website
Coverage Only currently available for manmade slopes
Fig. 10 Summary table of Slope Information System – HKSS
P a g e | 132.4 Storm Surge
New Orleans Risk – US Army Corps of Engineers
An interactive map is available online8 with the urban New Orleans area split into sections. For each
section a selection of maps are shown giving likely inundation heights from hurricanes of 2%, 1% and
0.2% annual probabilities. Historical data for flooding before Katrina is also given, which shows the
effect of flood defences implemented since 2005. A PowerPoint presentation gives very detailed
information on how the maps were produced and the statistical modelling used.
Fig. 11 1% flood height map for the French Quarter, New Orleans
New Orleans Risk – US Army Corps of Engineers
Type of map Probabilistic
Parameters Height of inundation
Risk Boundaries 2%/1%/0.2% annual probabilities on separate maps (50/100/500 year RP)
Information None (available in other sections of New Orleans Risk website)
Retrieval Method Selectable by city area
Whilst this is easily available on NOR website, links should be available from more
Access
obvious sites such as Louisiana or New Orleans disaster planning sites
Coverage Covers New Orleans and Plaquemines but not entire NO metro area
Fig. 12 Summary table of New Orleans Risk – US Army Corps of Engineers
P a g e | 142.5 Tropical Storms
Hurricane Preparedness – NHC/NOAA
The National Hurricane Centre (NHC) has constructed probabilistic risk maps of the US coast using data
from the National Hurricane Centre Risk Analysis Program (HURISK). These are available on the NHC
website9 along with a detailed explanation of the concept of return periods. For each category of storm
a map may be viewed of either the entire US coast or specific sections. These show return periods in
years for the selected intensity of storm passing within 86 miles (75nm) of the point, they are also colour
coded to give an indication of risk.
Fig. 13 NHC map of the Gulf Coast showing return periods for Category 5 hurricanes
Hurricane Preparedness – NHC/NOAA
Type of map Probabilistic
Parameters Intensity (Saffir-Simpson scale)
Risk Boundaries Exact return periods for 75nm areas
Information None (available in other sections of NHC website)
Retrieval Method Selectable by three areas of coast (Gulf, Southeast, Northeast)
Access Link from NHC website
Coverage Covers all of East and Gulf coast but only at discrete points
Fig. 14 Summary table of Hurricane Preparedness – NHC/NOAA
P a g e | 152.6 Tsunamis
Tsunami Threat Map – Fire and Emergency Services Authority of Western Australia
A Probabilistic Tsunami Hazard Assessment for Western Australia Burbidge et al. (2008)10 produced
maps of maximum tsunami wave heights in Western Australia for various return periods. Whilst this
paper is published in Pure and Applied Geophysics the results (maps) are available freely on the FESAWA
website11. The entire report is linked from the publications section of the Geoscience Australia
website12.
Fig. 15 Selection of return period maps for maximum wave heights along the WA coast a) 100 years, b) 500 years,
c) 1000 years, d) 2000 years
Tsunami Threat Map – FESAWA
Type of map Probabilistic
Parameters Wave height
Risk Boundaries 100/500/1000/2000 year RP
Information None
Retrieval Method Not searchable
Access Map available on FESA website, full report linked from GA website
Coverage Covers entire area at risk from tsunamis
Fig. 16 Summary table of Tsunami Threat Map – FESAWA
P a g e | 16Tsunami Hazard Map of the Elliot Bay Area – Washington Emergency Management Division
A comprehensive poster shows the various heights of inundation for a worst case local earthquake
(magnitude 7.3) generated tsunami. A separate map gives the likely water velocity for the same event.
Both water height and velocity are divided into easily understood categories; height is referenced
anatomically and water velocity is divided at 1.5 m/s, the speed at which standing up would become
difficult. 30 second snapshots of a tsunami inundation model give an excellent visual representation of
how a wave would behave in the bay. The poster provides full transparency of the limitations of the map
and model.
Fig. 17 Selection of hazard maps available on the tsunami poster for Elliot Bay Area, Washington
Tsunami Hazard Map – WEMD/NOAA
Type of map Worst case scenario
Parameters Inundation depth, velocity of water
Risk Boundaries 0-0.5/0.5-2/2-5 m depth, 1.5 m/s velocity
Information Extensive info on production and limitations of map, but nothing else
Retrieval Method Posters divided by coastal population area
Access Map available on WEMD website
Coverage Only available at this level of detail for selected major populations
Fig. 18 Summary table of Tsunami Hazard Map – WEMD/NOAA
P a g e | 172.7 Volcanoes
Mt. Rainier Hazard Map – USGS
The USGS cascades volcano observatory site13 has several hazard maps and information for active
volcanoes in the Cascades range. The maps show areas which would be inundated by three lahar
volumes each with different probabilities. These are separated into 500-1000 year, 100-500 year and 1-
100 year return periods. Regions at risk from pyroclastic flows, surges, ballistics and lava flows are
shown for a 100-1000 year return period. Whilst these boundaries are not as precise as would be ideal
they represent the inherent uncertainties associated with volcanoes and their unpredictable activity.
Fig. 19 Extract from hazard map for Mt. Rainier, Washington
Mt. Rainier Hazard Map – USGS
Type of map Probabilistic
Parameters Lahars, all other volcanic hazards
Risk Boundaries 1-100/100-500/500-1000 year RP, 100-1000 year RP
Information None (available on other sections of USGS volcano site)
Retrieval Method Viewed by volcano
Access Easily located from main USGS hazards page
Coverage Detailed mapping only covers areas surrounding major volcanoes
Fig. 20 Summary table of Mt. Rainier Hazard Map – USGS
P a g e | 182.8 Examples of real time hazard mapping
Probabilistic Hurricane Storm Surge – NOAA/National Weather Service
This is an experimental product where the public may generate maps showing the probability of a storm
surge of a certain height or the percentage surge exceedence heights online14. These maps only become
available once a particular cyclonic event is in progress. Unfortunately they are not currently searchable
by location, and the scale is fairly large. This low resolution reflects the inherent uncertainties of storm
surge prediction.
Fig. 21 Screenshot of an example storm surge risk map generated during Hurricane Katrina (2005) for the Central
Gulf region
Probabilistic Hurricane Storm Surge – NOAA/National Weather Service
Type of map Probabilistic but only available during a tropical storm event
Parameters Height of inundation
May either be viewed as fixed probability of exceedence (2-25 feet) or fixed
Risk Boundaries
inundation height (10%-90% exceedence)
Information None (available in other sections of NWS website)
Retrieval Method Selectable by coastal region
Access Available on National Hurricane Centre website during a storm
Coverage Covers all of East and Gulf coasts
Fig. 22 Summary table of Probabilistic Hurricane Storm Surge – NOAA/National Weather Service
P a g e | 192.9 Examples of evacuation mapping
Tsunami Hazard and Evacuation Map – Oregon Department of Geology and Mineral Industries
The Oregon DOGAMI website15 provides a selection of tsunami evacuation maps for a worst case local
and distant Tsunami, with safe evacuation routes and assembly areas. Tsunami inundation maps for the
height of wave produced by a magnitude 8.8 undersea earthquake are available from the same site,
although these seem older. There is no information available on probabilities of tsunami inundation.
Fig. 23 Extract from the tsunami evacuation map for Cannon Beach and Arch Cape areas, Oregon
Tsunami Evacuation Map – Oregon DOGAMI
Type of map Evacuation zones based on worst case
Parameters Hazard to life
Risk Boundaries Distant/locally generated tsunamis
Information Evacuation, preparedness and immediate response information
Retrieval Method Posters divided by coastal population area
Access Map available on Oregon state website
Coverage Covers all population centres along Oregon coastline
Fig. 24 Summary table of Tsunami Evacuation Map – Oregon DOGAMI
P a g e | 203. An inventory and survey of mapped hazard information in South-East Asia
For each hazard in each country the report has been structured in four sections, encompassing all facets
of disaster mapping and risk management:
B: Background information on the hazard in the country
M: An inventory of the remotely available maps
P: Ease of access and quality of information available to the public and any highlights of hazard
education. This section also includes measures taken by governments and NGOs to mitigate the
hazard.
F: Availability and coverage of forecast information and provision of warnings, including the
quality of reports for recent and in progress events.
The conclusions and summary tables at the end of each country’s section concentrate on the state of
hazard mapping and also provide an overview of disaster risk management, including mitigation and
information. The maps for each hazard in Appendix 1 further summarise these tables to give each
country a colour coded rating. A key to these tables and maps is provided below.
Country – Major Hazards
Map Type Coverage Damaging Agents Boundaries
Hazard
Information/Reporting Retrieval Accessibility
Eq Earthquake hazard Excellent Very difficult to improve
Fl Flood hazard Good Minor improvements possible
Ls Landslide hazard Average Functional but some improvement possible
Tr/Ss Tropical storm and surge hazard Poor Significant improvement possible
Ts Tsunami hazard Approximate representation of area
Vo Volcanic hazard covered by hazard maps
P a g e | 213.1 Bangladesh: Earthquakes, Floods, Tropical Storms
Earthquakes
B: Bangladesh has a relatively high
earthquake risk, but despite this online
earthquake information appears to be
limited. The Bangladesh Earthquake
Society (a private organization mainly of
civil engineers) conducted a study which
suggested a major earthquake could
destroy up to 30% of buildings in the
heavily populated capital, Dhaka.
M: Global Seismic Hazard Assessment
Programme (GSHAP) provides mapping
for earthquake risk in Bangladesh;
however there is no obvious link to the
maps from any Bangladesh website. The
Amateur Seismic Centre16 has used
GSHAP data to produce a more
comprehensive earthquake risk map.
P: A roundtable discussion was held in
March 2008 to address the lack of
earthquake preparedness in the country.
Plans have been set out to significantly Fig. 25 ASC map of earthquake risk giving 475 year return period
improve the capacity of hospitals, PGAs
emergency services, blood banks and civil
defence forces, to ensure that they can cope with catastrophic seismic events. A scheme has been
scheduled to retrofit key buildings, such as schools and hospitals, to ensure they conform to the highest
earthquake safety standards.
F: As with all earthquakes no forecasting is possible; however up to date seismic event notifications are
available on the Disaster Management Bureau17 (DMB) website.
Floods
B: Monsoonal flooding in Bangladesh is essential to life; however based on a number of factors floods
may extend over larger areas for long periods of time, causing substantial damage. On a 100 year return
period inundation can be expected for over 60% of the country18.
P a g e | 22M: The Institute of Water Modelling19 (IWM) has
conducted extensive mapping of flood hazard in
Bangladesh including 20 year return period flood
heights and 100 year return period velocities for
selected regions. They also produce a flood
hazard map of Bangladesh giving each cell a
combined vulnerability index which considers
both flood depth and duration of flooding; these
two parameters are also mapped separately.
Unfortunately these maps do not appear to be
available to the general public.
P: High ground shelters have been built along
with raised roads which act as levees. A joint
effort from the Centre for Natural Resource
Studies20 (CNRS), CARE Bangladesh21 (Cooperative
for Assistance and Relief Everywhere) and the
Swiss Agency for Development and Cooperation22
(SDC) are ensuring that education and risk
reduction are gradually reaching all areas of the
country.
F: The Flood Forecasting and Warning Centre23
(FFWC), in association with the Bangladesh Water
Development Board, release daily online updates
of areas flooded along with 24 and 48 hour
forecasts. These inundation maps are at a fairly
small scale and show height of flood water and
elevation of surrounding terrain. They are easily
available from the homepage which contains a
large interactive map showing water levels at all Fig. 26 IWM flood vulnerability map for the Chao Phraya
river level stations. Flood warnings are also river basin. Vulnerability index is shown in shades of red
disseminated by fax (to local public buildings) and (see legend in top right corner).
in the national and local media. Climate Forecast
Applications in Bangladesh24 (CFAB) is a consortium of both government and non government
organizations which is lead by Georgia Tech University. They aim to provide short (1-10 days) to long
term (up to 6 months) forecasts both for rainfall and the probability of flood water exceeding a pre
determined “danger level”. This information is then disseminated to the general population in the flood
plains around the Ganges and Brahmaputra rivers, allowing for better agricultural planning and
preparedness for disasters.
P a g e | 23Tropical Storms and Storm Surges
B: The northern Indian Ocean frequently produces strong cyclonic events. When combined with a high
tide storm surges up to 12m high have been recorded in the Bay of Bengal; given the high population
density and low topography of Bangladesh these are clearly a great hazard. In the past 20 years tropical
storms and their associated storm surges have caused upwards of 150,000 casualties in Bangladesh
making them the country’s deadliest disaster.
M: The DMB provides a tropical storm risk map online. This does not include any numerical boundaries
for risk; however it does give areas of high storm surge risk, storm surge risk and cyclonic wind risk. A
EuropeAid case study25 suggests that more detailed storm surge mapping has been undertaken;
however this was not obviously available online.
P: Vulnerable populations have been provided with cyclone shelters, built to withstand strong winds on
higher ground. In some regions sea walls have been raised and strengthened to provide better
protection. There are also schemes being carried out as part of the Comprehensive Disaster
Management Program26 (CDMP) to raise awareness of storm surge hazard in low lying coastal areas.
Fig. 27 Storm surge forecast for Cyclone Sidr created by the NOAA in association with the JTWC
F: The Bangladesh Meteorological Department27 (BMD) issues storm warnings from their website which
are relayed through national media to the general population. Up until 2007 very little existed by way of
storm surge prediction and early warning. During Tropical Storm Sidr a chance series of events involving
a Bangladeshi researcher for the NOAA based at Louisiana State University and the son of the head of
the Ministry of Food and Disaster Management, a student at LSU, led to the development of
Experimental storm surge forecasting in the Bay of Bengal Mashriqui et al. (2006)28. This utilised models
already in place along the coast of Louisiana (a similar deltaic low lying coast) to successfully predict the
P a g e | 24likely storm surge from this category 5 tropical storm, allowing evacuation and significant reduction in
casualty numbers compared to similar strength storms in the past (3,500 compared to 138,000+).
Unfortunately this has yet to be developed in to a fully fledged storm surge prediction model for the Bay
of Bengal.
Conclusion
Floods are well considered and information is easily accessed; however no obvious risk maps are
available online for future planning. The Bangladesh government through the FFWC needs to make
probabilistic maps available to the general population. Tropical storm warning systems exist as do maps
of storm surge and wind risk areas. Steps have been taken to reduce storm surge hazard. Whilst
earthquake hazard reduction and disaster planning is not complete a thorough roadmap for future
development has been developed. If this is followed then Bangladesh will have a very strong and
comprehensive natural disaster management network.
Bangladesh – Eq, Fl, Tr/Ss
Probabilistic Shaking 475 year RP
Local disaster action Less detailed version
Earthquakes
plans, road map for No search function available on DBM
improvements website
Combined vulnerability
Probabilistic Duration, depth
index
Floods Warnings and
Not apparently available
preparedness No search function
online
information
Probabilistic Wind risk, storm surge At risk, high/med risk
Tropical Storms Warnings online, other
Linked from DMB
Storm Surges information available to No search function
website
public but not online
Fig. 28 Summary table of available hazard information in Bangladesh
P a g e | 253.2 Cambodia: Floods
Floods
B: A large proportion of Cambodia lies within the Mekong flood plain and is therefore vulnerable to
flooding, particularly during the monsoon (May-Oct) when 80% of annual rainfall occurs.
M: The Mekong River Commission29 (MRC) provides maps of maximum extent of floodwater from a
combination of large historical floods. These maps are available to select by river station but can be
zoomed out to cover 200km square areas (see 3.10 for example map). The National Committee for
Disaster Management (NCDM) has also produced a national map showing areas inundated by the
extensive floods of 2000 and 2001.
Fig. 29 NCDM map of maximum extent of 2000 and 2001 floods
P: The NCDM is responsible for coordinating hazard response and planning. The Cambodian Red Cross30
(CRC) in collaboration with the NCDM have implemented the Community-based Disaster Preparedness
Program which includes education of at risk communities and provision of elevated safe areas which
P a g e | 26livestock and populations can evacuate to. Some funding has been provided to raise houses and schools
on pillars to prevent them being damaged during inundation. A well thought out scheme involves the
distribution of dugout boats to families allowing transportation to continue during flooding, and
enabling communities to recover much faster. Cambodia benefits from education and preparedness
advice from the MRC.
F: Water level data for various river stations in Cambodia are provided by the MRC. Any stations with
levels close to danger are highlighted, with warnings issued. Red Cross volunteers in each major village
are trained to monitor river levels and report high water levels
Conclusion
The NCDM does not appear to have a functioning website. Online flood information is more easily
available from the MRC and is relevant to most of the flood risk in Cambodia. The lack of online hazard
information in Cambodia is somewhat less of a problem owing to the high quality of the MRC website.
The NCDM report recommends the implementation of disaster planning acts and a national policy on
disaster management. The availability of the MRC data should not be seen as removing the need for
online availability of hazard information in Cambodia.
Cambodia – Fl
Historical Maximum historic flood At risk area
Thorough warnings and
Floods Selectable by river Only available on MRC
preparedness info, along
stations website
with forecast data
Fig. 30 Summary table of available hazard information in Cambodia
P a g e | 273.3 Indonesia: Earthquakes, Floods, Landslides, Tsunamis, Volcanoes
Earthquakes
B: Indonesia consists almost entirely of island arcs, raised out of the sea either by volcanic or tectonic
activity. The entire region (with the exception of Borneo) is vulnerable to subduction related
earthquakes.
M: Earthquake risk mapping exists from the USGS/GSHAP. Whilst the GSHAP map is not on a particularly
large scale it can still be used for regional disaster planning, and covers all areas of the country. This map
is linked from the Centre for Volcanology and Geological Disaster Mitigation31 (PVMBG). The USGS have
conducted a more detailed study of Sumatra, Java and Kalimantan, producing maps for 475 and 2500
year return periods of PGA, 5-Hz spectral and 1-Hz spectral, unfortunately these do not presently
include Irian Jaya and the islands east of Timor.
Fig. 31 USGS hazard map showing earthquake hazard as 5-Hz spectral acceleration with a 10% probable
exceedence per 50 years (equivalent to a 475 year return period) as a % of gravity
P: The Agency of Meteorology, Climatology and Geophysics32 (BMG) appears to be responsible for
coordinating earthquake hazard mitigation. This website is well laid out with links to information on
earthquakes and tsunamis. Earthquake proof building measures are being encouraged by authorities.
F: A real time updated map showing recent earthquakes is available on the BMG website. This gives
details of seismic events and highlights any which have a high tsunami production risk.
P a g e | 28Floods
B: In Indonesia heavy rain tends to cause two principal hazards, floods and landslides/mudslides. These
heavy rains are often related to distant tropical storms.
M: Maps of flood prone areas are provided in an interactive product on the National Coordinating
Agency for Surveys and Mapping website33 (BAKOSURTANAL). Some of these maps also include landslide
prone areas.
Fig. 32 Extract from BAKOSURTANAL multi hazard map of East Java. Elevation data is in greens and blues. Flood
prone areas are in pink, landslide prone areas are in red
P: UNESCO34 in association with the Centre for Community Agriculture began a pilot scheme in 2003 to
provide comprehensive flood education at all levels of the community; this includes awareness days and
the production of information pamphlets, amongst other measures. Initially the scheme focussed on
several urban areas of Jakarta; however owing to its success, this has now expanded to cover a wider
area. General information is available online via various websites including the BMG and the State
Ministry of Research and Technology35 (PIRBA).
F: Flood prediction and management is a joint operation between the BMG, the Directorate General of
Water Resources and the Department of Public Works. The BMG provide flood risk maps by area for up
to 2 months in advance. These show safe areas and those with low/medium/high risk. Flood warnings
are issued by the BMG both on their website and through local media.
P a g e | 29Fig. 33 Extract from a BMG flood hazard forecast map for North Sumatra
Landslides
B: The high rainfall, combined with steep sided volcanic terrain and frequent seismic activity make
landslides a regular occurrence in Indonesia. Every year landslides cause several hundred casualties and
the destruction of large areas resulting in substantial financial losses.
M: The PVMBG website provides links to some of the better landslide risk maps available anywhere in
the world. Every island has detailed maps showing landslide risk zones. Data may be available for the
probabilities used for these boundaries; however it could not be found.
50km Scale Bar
Fig. 34 Extract from the PVMBG landslide hazard map for Bengkulu Province on the island of Sumatra
P: The PVMBG website has useful information about landslides and how to prepare for them, including
extracts from the USGS guide to landslide preparedness. They also offer downloads of reports from
recent disasters.
F: Landslides in themselves are not forecast; however the BMG does provide rainfall level forecasts
which can be used by those in landslide risk zones to determine their likely level of hazard. Various
disaster management bureaus report on landslide events.
P a g e | 30Tsunamis
B: Like much of maritime South-East Asia, Indonesia was caught by surprise and devastated by the
Boxing Day Tsunami of 2004. Indonesia, and particularly the Banda Aceh region, suffered by far the most
damage with estimates for casualties ranging between 100,000 and 150,000 with financial losses
totalling $4.5billion.
M: The BMG produce a map showing the coastlines which are at risk from tsunamis, there is no
quantification of this risk. This map also does not show how far in land tsunamis are likely to inundate.
The German Centre for Satellite Based Crisis Information36 (CSBCI) has mapped the areas damaged by
the 2004 tsunami and whilst these are historical, as the event was so large; they can be assumed to
approximately represent a worst case scenario. These maps cover the north and western coasts of
Sumatra, which were worst hit.
Fig. 35 Extract from the CSBCI map of Banda Aceh, NW Sumatra showing areas damaged in red hatching and areas
of settlement as green
P: The Tsunami Alert Community37 (KOGAMI) is a local non-profit organization dedicated to improving
education and preparedness in communities which are threatened by earthquakes and tsunamis. In
collaboration with the government they run “National Exhibitions of Disaster Preparedness” which tour
the major cities of the various islands, providing information and practical training on how to prepare
for, and survive, a disaster. The Jakarta Tsunami Information Centre38 (JTIC) has a lot of information on
tsunamis and how to prepare for them.
F: The BMG provides tsunami warnings and also shows any earthquakes which may produce tsunamis.
Internationally the IOTWS (see 3.10) has a network of warning stations and DART buoys which provide
early warning to governments and local authorities in Indian Ocean countries.
P a g e | 31You can also read