An Engineer s Critique of Global Warming "Science
←
→
Page content transcription
If your browser does not render page correctly, please read the page content below
An Engineer‟s Critique of Global
     Warming „Science‟

  Questioning the CAGW* theory
* Catastrophic Anthropogenic Global Warming
 (global climate destruction caused by human
      emissions of greenhouse gasses)

                                   By Burt Rutan
                                  Version 4.3, Jan 2011

                   This presentation can be downloaded at http://rps3.com/
                         Or, Google “burt rutan climate change”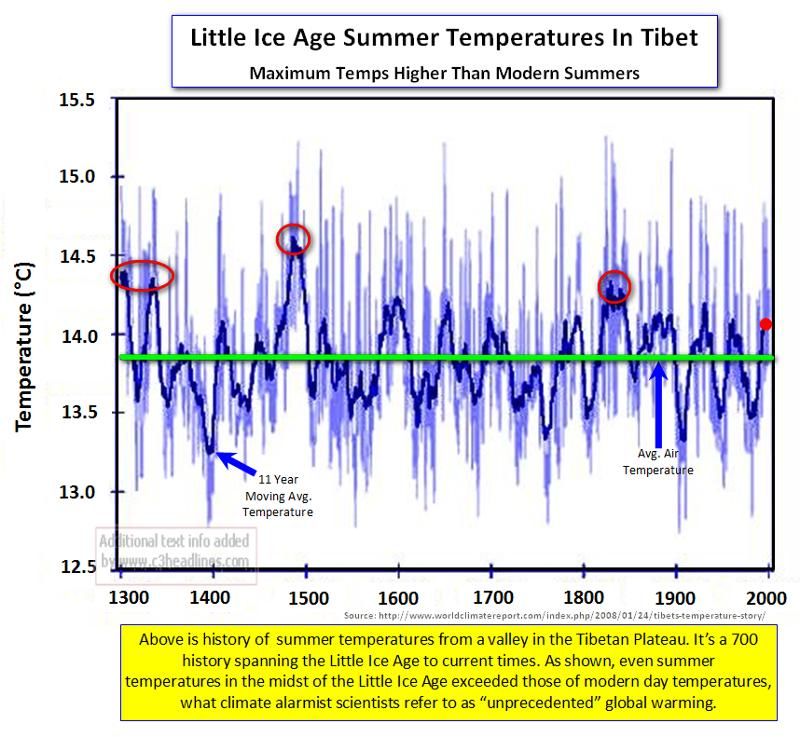
Our CO2-starved Atmosphere
Note, the green life along the Nile river and the dead desert elsewhere. When co2 is greater in the atmosphere, plants
need less water to thrive.
When dinosaurs roamed we had 3 to 5 times current co2 and planet was nearly all green, pole-to-pole
Near catastrophe when co2 declined to 180 ppm, since below 150 ppm plants, then animals die.

If you promote a green healthy planet, then you should lobby for a co2-fertilized atmosphere, not a co2-starved
atmosphere.

                                                                                                                         2
My Introduction to the Global Warming Scare
   United Nations Intergovernmental Panel on Climate Change
This chart includes a large number of next-century predictions - all of them showing
either big problems or catastrophe in the next century; all caused by a theory of CO2
greenhouse gas heating from human emissions (AGW).
  Is there something an engineer can do to solve this problem?

                                                                          Red Circle is the
                                                                       claimed CAGW scare

                                                                                              3
What Happened between 1990 and 2001?

                                                       IPCC
                                                    2001 report

                                 The „hockey
                                 stick‟ data           Red Circle is the
                                 presentation        claimed AGW scare
Players in the CAGW issue:       shown here is
                                 no longer used,
                                 even by the
Government Scientists,           UN, since it has
Universities, Politicians, Top   been shown to
                                 be fraudulent.
Leadership, Science Media,
etc.
But…. No engineers or
engineering studies/programs                         IPCC 1990 report
are being evaluated for the
IPCC Reports.                                                              Current temperature

                                                                                         4
The significance of “Statistical Significance”.
        This Chart shows five “trends”, all ending at CY 2000:
A - 16,000 years, includes recovery from ice age.
B - 10,000 years, the current “stable warm period”.
C - 2,000 years, the Christian Era.
D - 700 years, the Little Ice Age (LIA) cycle.
E - 100 years, recovery from LIA.
All 5 trends except E are Statistical Significant. However, trend E is what
the Alarmists focus on, to „prove‟ the correlation with human emissions.

                                                                     Data from GISP2 ice cores
                                                                     (after NSIDC User Services
                                                                     1997 and Davis/Bohling,
                                                                     2001.

                                                                                                  5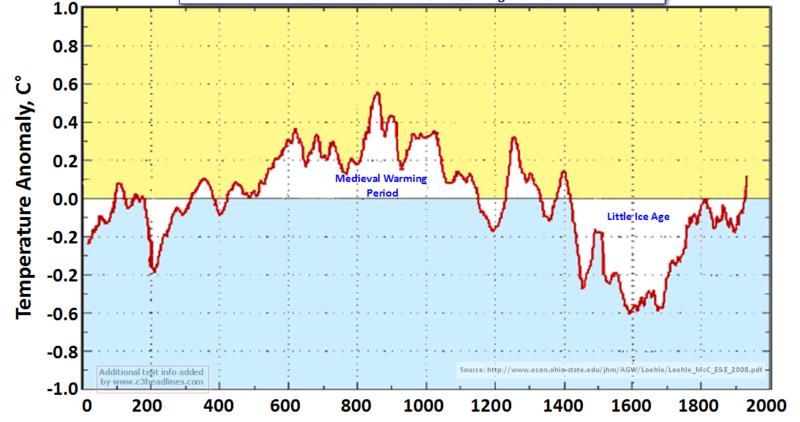
An Engineering look at Man-Caused Global Warming

  • Not a Climatologist‟s analysis - a view from a flight
    test engineer who has spent 45 years doing data
    analysis/interpretation/presentation.
  • A focus on how the scientific community has
    handled the „global warming due to fossil fuel
    burning‟ theory.
  • A review of the climate data, then a study on how the
    results are selected, presented and promoted.
  • The focus is on an Engineering Approach – where
    data are critical and there are consequences for
    being wrong; not the Scientist approach – where a
    theory is the product and it can be right or wrong
    without repercussions.
  • A presentation of climate data the way an engineer
    would show it – present all the data, then do analysis
    without bias to any proposed theory.
                                                             6
Modern Human-Extinction Scares
•   Population Bomb, starvation/crowding - 1940s to 1970s
•   Silent Spring, DDT - 1960s & 1970s (outlawing DDT killed millions)
•   Global Nuclear War - 1950s thru 1980s
•   Global cooling, Ice Age/starvation - 1956 to 1977
•   Hole in the Ozone layer, caused by CFCs, 1970s & 1980s
    (We now know that the Ozone changes were not caused by human CFCs)
•   Nuclear Winter, nuke-caused ice Age - 1980s & 1990s
•   Asteroid Impact - 1930 to present (a real, but remote risk)
•   Global Warming - 1929 to 1969 and 1987 to 2003
•   “Climate Change” - 2003 to present

                  Is ‘Climate Change’ just
                another over-blown scare?                                7
Rutan Background Includes Energy Efficiency
     Solar Hot Water in the 70s.                         My Desert Pyramid House
     Now building a 34-acre PV              “Ultimate energy-efficient house” (Pop Sci Nov 1989)
         solar energy farm.                 Primary car was zero-emissions EV-1, 1997 to 2004.

    Loss of my EV-1 Electric car in 2004.
      General Motors crushed them all
8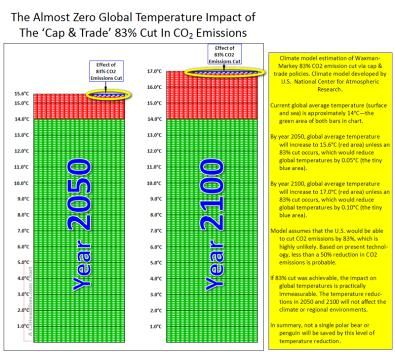
The Difference
             The Engineer vs. the Scientist
• Engineering Organization
    •   Development of a product, usually under strict certification rules.
    •   Responsible for the product‟s worth and safety.
    •   Selling the product‟s adequacy to Management
    •   Consequences if wrong (people die).
• Scientific Method
    • Origin of new Theories (hypothesis).
    • Strict process (The Scientific Method) to gain (or lose)
    confidence in the Theory.
    • Not responsible for adequacy or value of product.
    • Frequently being wrong is not a problem.

                                                                              9
The Challenge is Massive for the Alarmist
To track and to forecast miniscule global-average temperature
changes.

   The temperature trend is so slight that, were the global average
   temperature change which has taken place during the 20th and
   21st centuries were to occur in an ordinary room, most of the people
   in the room would be unaware of it. The CO2 % in this room will
   increase more during this talk than the atmospheric CO2 % did in the
   last 100 years.                                                        10
The CAGW call to action (for a Carbon-constrained world).
        Requires these 5 issues to be true.
       This report studies these five, in order.

    1. Recent human burning of fossil fuels suddenly and
       dangerously increased CO2 beyond previous levels.
    2. Human CO2 emissions causes greenhouse warming.
    3. Dangerous, sudden global warming occurred the last
       50 years.
    4. The current Temperature is too Hot & further warming
       is Bad.
    5. It is more difficult to adapt to climate changes than to
       attempt to control them.

            First, let‟s address #1. Has our use of
            fossil fuels caused sudden, dangerous,
            unprecedented CO2 increase?
                                                                  11
The Challenge is Massive for the Alarmist -
to prove his CO2 CAGW theory
He must convince us that CO2 is a Human‟s emissions of CO2 each
pollutant. But calling it a pollutant year = 1 tablespoon in 300
is an uninformed joke. CO2, along gallons. So, take a tablespoon
with oxygen and water is essential (360 drops) of warm water,
for all life. slowly drip it into a 300-gallon
Look at a leaf, a grain, a flower. drum of water (6 barrels) over
Half of what you see was made one year at 1 drop every day.
from CO2.
12The Massive Alarmist‟s Challenge
Carbon Dioxide content is very small, invisible on a bar chart.
Greenhouse gas effects of Human Emissions are also miniscule
Man‟s emissions of CO2 contribute only 0.117%
13
of the total greenhouse gas warming effect.Looking back 600 million years
Atmospheric Carbon Dioxide was likely 18 times today‟s
concentration, during the Cambrian period when life‟s
diversity was at its greatest expansion (red circle). It was 4
times the current level when the dinosaurs were killed by an
asteroid. The only other extended time CO2 was low, (like
today) was a period 300 million years ago.
In the big picture we are now in a low
CO2 period. The 20th century increase
shows as an insignificant dot at this
scale.
Do we risk runaway greenhouse
warming if our CO2 concentration gets
too high? CO2 has been scarce the last
2 million years. Also, it has never
Now
significantly driven temperature before.
Venus may have runaway greenhouse
warming, but its CO2, at 96.5% is 2,500
times the level of CO2 in the earth‟s
atmosphere.
14The Basic CO2 Alarmist‟s Chart
The claim: CO2 content is smooth and near-
constant for 200 years, and then increases, due to
human emissions.
But - accurate CO2 direct measurements
are only available for the last 50 years.
15Another Scare chart
The Alarmist‟ Presentation Tactic
Find a correlation of human emissions to something „really bad‟.
Scale the presentation to show a scare.
16A Horrific scare chart
The Jump to Ice core data, back 400,000 years
“CO2 is highest in a million years”
Note the time scale.
Ice core data does not measure recent conditions. 17They selected only the
circled data points that Measured Atmospheric CO2
supported their theory. Manipulation of measured data for 200 years
Blue curve is the modern, accurate
data, measured at Mauna Loa
Observatory, Hawaii.
Green dashed curve is a fairing
for all direct CO2 measurements,
back to 1810.
18Another CO2 Measurement Method
Chemical method: data for 1810 to 1962 period.
19The „Basic‟ CO2 Chart
Now takes on a different look
Green dashed - Fairing of early, directly-measured CO2
Red - chemical method
Blue - Mauna Loa modern measurements
20Looking Back 1800 years
A CO2 Measurement Proxy
From stomatal density in fossil pine needles
21Summary: CO2 Data for the last 1800 years
Data from early & modern measurements, Ice core, chemical and
pine needles. Not a lot to scare, with this chart.
Is the present CO2 increase not unusual, or are pine proxies not reliable? Of
course, alarmists might say the latter - until they consider the pine tree rings
that brought them their most-deceptive chart of all - The hockey stick.
Dashed green - early direct measurements
Green - stomatal density in fossil pine needles
Black - ice cores, 4 locations
Red - chemical method
Blue - modern, Mauna Loa direct measurements
This chart informs (five data
CO2 Concentration ~ ppm
sources), but does not scare. It 360
illustrates the significant scatter
seen in the various methods for
CO2 historical data.
For the proper perspective this
data is transferred to the next
slide.
260
1000 Year 2000
22Now, to put Atmospheric CO2 in Perspective
This chart is presented to Inform, not to Scare.
This shows CO2 in its proper role as a trace gas, not something that has to be immediately eliminated.
0.5%
Normal human CO2 limits for a confined space.
OSHA Industry, submarine or ISS space station
(13 times the current atmosphere).
CO2 - % of Atmosphere
0.4%
Note: Apollo 13 LEM went to 2%, 53 times
the current global atmosphere. Note: Water Vapor (a greenhouse gas)
Above 30% (780 times the current global varies up to 4.0% (100 times CO2).
atmosphere), CO2 causes death in humans.
0.3%
Average atmospheric CO2 content, during development of plant and
animal life on earth (approximately 8 times current). Also, an
„optimum‟ level for species diversity, crop yields and tree growth.
0.2%
Atmospheric Carbon Dioxide Gas, CO2
- Current CO2 0.038%.
CO2 %, indoors, in an average house Red - Chemical measurement + Mauna Loa data.
Green - from stomatal density in pine needles.
Black - ice core data.
0.1% Dashed - early measurements.
00 1000 2000
23 AD ADAgricultural productively increased an A Pollutant?
average of 34% from 1990 to 2004.
Much of that increase was due to the No, CO2 is critical for life
increase in atmospheric CO2.
Plants need less water, with more CO2. A doubling of CO2 would greatly
improve crop yields & forest
growth. Decreasing CO2 to half the
current % would be catastrophic
(plants die, humans starve.
A claim:
About 500 million people (7% of
today‟s population) are alive today,
who wouldn‟t be, if carbon dioxide
had not risen in the last century.
24 http://www.co2science.org/subject/t/summaries/earlyspringgrowth.phpThe danger is too-low atmospheric CO2
While we refer to ice ages
usually as the glacial periods that One thing to bear in mind is that
have happened routinely every the atmospheric concentration of
100k years during the last million CO2 got down to 180 ppm during
or 2 years, the whole of the last the glacial periods of the ice age
several million years has actually the Earth is currently in (the
been a relative ice age. Before Holocene is an interglacial in the
that, during diversity growth from ice age that started three million
sea life through dinosaurs, the years ago). Plant growth shuts
planet was much warmer, with down at 150 ppm, so the earth was
little ice at all, sea levels within 30 ppm of disaster (dry
hundreds of feet higher and in deserts and starving plant life).
general, GREEN from pole to
pole. It was green, not dry desert Terrestrial life came close to being
because the earth was fertilized wiped out by a lack of CO2 in the
by CO2 levels 10 to 20 times atmosphere.
present.
25#1. - Increase? Yes - Due partially to human emissions, the
atmospheric content of CO2 has increased 20% in the last 50 years.
CO2 might now be the highest in the human era.
However, CO2 is only 0.038% of the atmosphere and CO2 is only 3.6%
of all the greenhouse gasses.
Dangerous increase? No, not unless it causes a dangerous
result. Dangerous? yes, if it decreases 50%.
CO2 is a trace gas; it has been 18 times current levels during times of life‟s
greatest species diversity growth. Increases are beneficial.
1. Recent human burning of fossil fuels suddenly and
dangerously increased CO2 beyond previous levels – Yes/No
2. Human CO2 emissions causes greenhouse warming.
3. Dangerous, sudden global warming occurred the last 50 years.
4. The current Temperature is too Hot &further warming is Bad.
5. It is more difficult to adapt to climate changes than to attempt to
control them.
Next is #2. Okay, so CO2 is not a problem for plants,
animals and humans, but is it causing the planet to
get warmer via the greenhouse effect?
26Assessing the Blame for Global Warming
Atmospheric warming with human carbon
emissions shows „good‟ correlation only after 1970.
These four uncertainties in the Climate Models swamp
the warming due to doubling atmospheric CO2.
27A Comparison, for the two most-recent warmings:
“Natural” Global Warming vs. “CO2-caused” Global Warming.
Warming Prior to Large Human CO2 Emissions.
1915 to 1945 with 2.7% rise in CO2 The two 30-year warming
periods are nearly identical,
in spite of large differences
Green Slope = 1.58 deg C per century
in emissions and
atmospheric CO2 levels.
Global temperatures cooled from
1945 to 1970, even though CO2
Warming During Large Human CO2 Emissions. rose by 5%.
1970 to 2000 with 13.2% rise in CO2
Green Slope = 1.63 deg C per century
The “Correlation With
Human emissions” claim
is baseless.
28
Data graphs from C3headlines.comTemperature Increases Drive CO2 Rise,
Not Vice Versa
CO2 changes happen after temperature changes.
Data basis - ice cores.
This chart shows a 10,000-year period during the last ice
age recovery. The temperature changes, then CO2
responds 500 to 800 years later.
29The Big Greenhouse Gas Warming Effect
is only for small amounts of CO2
Doubling the concentration now would have little effect on warming.
The CO2 already in the atmosphere The natural greenhouse effect is
absorbs most of the light it can. The real, and it helps keep us warm, but
CO2 only “soaks up” its favorite it‟s already nearly reached its peak
wavelengths of light and it‟s close to performance. Add more CO2 and
its saturation point. It can‟t do much most of the extra gas is just
more, because there are not many “unemployed” molecules.
left-over photons at the right
wavelengths.
30Using Computer Models
to Predict Future Climate Changes
Engineers and Scientists know that you cannot merely extrapolate data that
are scattered due to chaotic effects. So, scientists propose a theory, model
it to predict and then turn the dials to match the model to the historic data.
They then use the model to predict the future.
A big problem with the Scientist - he falls in love with the theory. If new data
does not fit his prediction, he refuses to drop the theory, he just continues to
tweak the dials. Instead, an Engineer looks for another theory, or refuses to
predict - Hey, his decisions have consequences.
The lesson here is one that applies to risk management
“Question, Never Defend” *
Note that NONE of the dozens of computer models predicted the last
decade of cooling. Excuses and dial-tweaks were made after the fact.
The following charts show examples of poor IPCC predictions of warming,
even though they can accurately tie emissions to CO2 rise. This discredits
the theory of greenhouse-gas-warming being the primary warming cause.
* Rutan policy for aircraft flight safety reviews and always enforced for
Flight Readiness Approvals. 31Climate models fail to Predict
News Media and Nature magazines
often report that Global Warming is
“worse than predictions”. In the vast
majority of cases, they are wrong.
Atmosphere Temperature Prediction
Blue = prediction slope (low range) Red = actual data
UN IPCC Prediction
Blue = prediction range (high and low) Red = actual data
32NASA‟s James Hanson
Calling the computer models “evidence” in Congress in
1988, Hanson predicted a leveling of warming by 2006,
ONLY if drastic cuts were made in emissions.
Real data - it is cooler, WITHOUT the cuts. The planet is
now the same temperature as when he testified.
Strangest fact - He is still invited to congress to scare the
inmates. Maybe he should have been muzzled after all?
Blue = prediction Red = actual data fairing
Blue = prediction Red = actual data fairing
33More Failed Predictions from the Computer Models
Five computer models predict greenhouse warming. Troposphere Temps, a 31 year Trend
Data show no support for model‟s validity Blue = 2.5 deg/century slope Red = data trend
Blue = model prediction, 2.2 deg/century Red = actual data
Ocean heat:
Opposite of prediction.
34Effective Propaganda: A News Headline from June, 2010
“May, 2010 was the hottest May on record”
The intended result - you now think that dangerous Global Warming is
back, after the cold winter of 2009.
The truth - summer heat recovery is not exceptional in the human-
emissions era.
Graph is for the last 130 years. Summer heat recovery extent has
declined and is unchanged by human emissions.
35A Generic Problem With Greenhouse Warming Models
The character and distribution of the warming in the atmosphere (as
measured) is dramatically different than predicted by the climate
computer models. This brings the model‟s assumptions into question.
How can we rely on the warming predictions, if the models incorrectly
predict atmosphere warming?
Model predicts hot spot at 8 to
13 km for mid latitudes
Models show warming rate (deg C
per decade) at 4 to 14 km altitude,
while measurements show rate is flat
to 10km, then cool above.
But, the atmosphere does not
warm at 8 to 13 km altitude
36Are the Greenhouse-Gas-Warming
Computer Models Wrong?
Climate models generally assume positive feedback Greenhouse gas
warming, while some actual measurements indicate negative feedback.
The measured data show
negative feedback.
The eleven computer
models assume positive
feedback.
Bottom line: we really do not know for sure what the feedbacks
are. The real world climate may operate opposite from the
model assumptions. Thus, warming caused by emissions may
be only a small fraction of the IPCC model prediction. 37Greenhouse Models Cannot Predict Future Warming
But, what can be used for prediction?
If the engineer can find consistent, accurate, redundant data, he often
extrapolates it to predict the near future.
One climate data set that qualifies is the modern measurement (last
50 years) of atmospheric CO2. Data fairings on the next slide.
38A Close look at Modern CO2 Measurements
Accurate enough for prediction? Yes, at least on a short term.
Red = South Pole
Black = Mauna Loa
Blue = Tutuila, American Samoa
Green - Baring Head, New Zealand
Orange = Alert, Canada
Slope for extrapolation
1.78 ppm per year = only 0.000178% per year.
1980 2000
380 ppm
Note: This is NOT a climate
computer model, just an
extrapolation of accurate, scatter-
free, measured CO2 data.
320 ppm
39The CO2 prediction.
In perspective.
380 ppm
320 ppm
1980 2000
0.1%
Ratio data down to a useable scale for prediction
Slope = 0.000178% per year
Zero
2000 One Hundred Years 2100
40A Carbon Dioxide Prediction
An extrapolation of the accurate modern measurements.
An estimate of what might happen without Government‟s taxing energy.
This Chart is structured to Inform, not to Scare.
0.2%
Atmospheric Carbon Dioxide Gas, CO2
- Current CO2 0.038%.
Multi color – Modern measurements (last 50 years)
CO2 - % of Atmosphere
Blue dashed line - extrapolation of modern measurements
Crop yields up > 35%.
Pine trees growth doubles.
0.1%
CO2 %, indoors, in an
average house ?
?
Oil, coal, and natural gas gets more expensive
than non-CO2 emission energy, without
Government taxing (approximate guess).
00 2100
2000 21st Century 2200 2300 41Notes on continuing our use of fossil fuels
• An “optimum” CO2 level for • We cannot burn fossil fuels to prevent
plants and animals would be the next ice age – the greenhouse gas
reached in about 1000 years if effect is far too weak for that.
the current rate of emissions • Since our current fuels (coal, oil,
could be continued. natural gas) are non-renewable, as
• We do not have enough fossil they become scarce their cost will
fuels to drive the atmospheric force a change to alternatives without
level of CO2 to anywhere Government control or Tax. This
close to a dangerous level. market-driven change will occur
• Two more centuries of earlier if Governments do not
emissions like the last are not constrain use of the current fuels.
possible and not dangerous.
• Using all the reserves of fossil
fuels now, would have little
effect on global temperatures
(beyond the natural warming).
• CO2 level will drop, in
response to decreasing
temperatures about 500 to 800
years after the planet
experiences its normal 90k-
year cycle – cooling into the
next big ice age.
42Peak Oil
• Defined as being near since the 1930s
• Technology always extends the prediction Most predictions of “Peak Oil” do not consider
advances in technology; this one does.
Peak Lithium (for Batteries)
• Demand will soon increase cost
• But, technology develops alternatives.
Peak Neodymium (rare earth for motor magnets)
• China already limiting exports
• But, technology discovers alternatives.1. How Much Human Energy Is Contained in One Gallon of Gas? From Dr. David Pimentel: "That is, the 38,000 kcal in one gallon of gasoline can be transformed into 8.8 KWh, which is about 3 weeks of human work equivalent. (Human work output in agriculture = 0.1 HP, or 0.074 KW, times 120 hours.)" He, of course, is accounting for the energy lost in the process of converting the gasoline into usable energy. My calculations excluding the energy lost in the conversion process are as follows: 1 Gallon of Gas = 125,000 BTUs Source: US Department of Energy 3,400 BTUs = 1 KWH Source: US Department of Energy, Bonneville Power Mgt. 1 Gallon of Gas = 37 KWH (125,000 BTUs in a gallon of gas divided by 3,400 BTUs in 1 KWH) 1 Gallon of Gas = 500 hours of human work output (37 KWH in 1 gallon of gas divided by human work output in agriculture of .074 KW = 500) 4. How Many Wind Turbines Would It Take to Replace a Single Off-Shore Drilling Platform Producing 12,000 Barrels of Oil Per Day? "Let's say that this oil was destined to be converted into electricity at an overall efficiency of 50 % (Combined Cycle Plant, no co- generation). Assuming this was decent quality oil, and not overly burdened with a high sulfur content, this oil would go to make about 10,800 bbls/day of refined products (10 % of it is used to power the refinery/transport the oil). And lets assume the oil had an average thermal content of about 140,000 Btu/gal." "Using 42 gallons/bbl and a 50 % conversion factor, 1 bbl/day could deliver about 861.2 kw-hr of electricity per day, or about 314.5 MW- hr/yr." "Where I live (New York), a single Vestas V82 wind turbine placed near the Lake Erie coastline would produce more than 5400 MW- hr/yr. This one turbine would thus be the equivalent of 17 bbls/day of oil used to make electricity. And a lot of oil is burned to make electricity in New York State, in addition to significantly more natural gas." "Thus it would take 706 Vestas V82 wind turbines to produce the same amount of electricity that could be made with your 12,000 bbl/day oil well."
Greenhouse CO2 Effect
       is a minor player in global warming

• The important climate thermostats are too chaotic to model:
    – Precipitation and Cloud formation; A
Earth orbit cycles and sunspots
Are likely drivers of warming cycles
Combining Ecliptic and Elliptical
orbits correlates with last 60k
years‟ temperatures and predicts
future climate.
Sunspots correlate with last
1,000 years temperatures.
46Where is the evidence that human emissions
cause greenhouse global warming?
Computer models are not evidence.
There once was supporting evidence on greenhouse feedback
extent. However, there are now at least three independent
pieces of evidence that the temperature rises predicted by the
IPCC due to CO2 emissions are exaggerated by a factor of
between 2 and 10. The scientists have assumed overly-positive
water vapor feedback in the climate models.
Chapter 9 of IPCC latest Assessment Report 4 (2007),
“Understanding and Attributing Climate Change”, contains no
evidence. The claim that CO2 is the main cause of the recent
global warming is an assumption, repeated numerous times.
But repetition is not proof, and the scientists and policy makers‟
summary report presents no actual evidence.
47#2 - Emissions caused greenhouse warming?
Not likely, and not supported by data.
There is no evidence that carbon dioxide emissions are the main
cause of the recent global warming.
Our small warming/cooling cycles are mainly caused by chaotic
formation of clouds/precipitation and solar input variation, not by
CO2 greenhouse effects.
Despite spending $billions over the last 20 years looking for
evidence, the scientists have found none. In two instances they
expected to find it, but in both cases they found only evidence of
the opposite.
1. Recent human burning of fossil fuels suddenly and dangerously
increased CO2 beyond previous levels – Yes/No.
2. Human CO2 emissions causes greenhouse warming – No.
3. Dangerous, sudden global warming occurred the last 50 years.
4. The current Temperature is too Hot & further warming is Bad.
5. It is more difficult to adapt to climate changes than to attempt to
control them.
Next is #3. OK, we are done with looking at CO2. Lets now
look at global temperatures: did the planet indeed experience
48
sudden, dangerous warming in the last 50 years?Looking again at the UN temperature scare
This chart includes a large number of predictions - all of them
showing big problems or catastrophe in the next century.
None of the predictions are based on reliable, tested evidence.
Most of the data shown in this chart are now known to be wrong.
Range of IPCC
temperature predictions
for the next Century.
Red Circle is the
claimed AGW scare
49Looking Back Millions of years
Now
Now
We are in a comparative cold period and the
20th century warming is insignificant.
Runaway greenhouse destruction of our planet
would have happened in the distant past (if
catastrophic greenhouse theory were correct). 50More Recent Global Temperature Data
Looking Back 400,000 years
The current, 11,000-year non-glacial warm period is the longest running and the
COLDEST one in the last half million years. The four previous interglacial warm
periods were all warmer than the current one (data in the black ovals).
The recent 1,000 years‟ temperatures were completely normal (red line in the
red circle), among the recent 11,000-year warm period.
Remember; recent CO2 increase is unusual, but not global temperature -
further indication that emissions are not the driver of Global Warming. 51Surface Thermometer Measurements
and the „urban-heating‟ proof
The number of stations grossly changed when Soviet union fell - biasing the
calculation of Global Average Temperature. Soviets had paid outposts for fuel based
on how cold they were. Then, „warming‟ happened when the policy was ended.
California shows no
warming in counties that
did not have a big
increase in population
during the last 100 years.
Population locally biases
the sensors hotter.
52Surface Thermometer Measurement (2)
90% of US sensors do not meet site quality standards.
Local effects, added
recently, all bias the
temperature higher.
53Surface Thermometer Measurement (3)
Data manipulation
The Darwin Australia “Adjustments”
Blue = raw data Red = Adjusted Black = the arbitrary adjustment.
US surface temp,
presented by NASA
in1999
Urban-Heat Corrections of Central Park
Infers NYC depopulated 1987 to 2006!
The same data were later
„adjusted‟ by NASA GISS
54Surface Temperature Record
The last ~ 200 years
Science and Public Policy Institute
Surface Temp study, Jan 2010 report. A sample of data with no
evidence of manipulation.
Selected conclusions: Surface Measurements for all Nordic
1. Instrumental temperature data for the pre-
satellite era (1850-1980) have been so widely,
countries.
tampered with that it cannot be credibly Current temp is lower than in 1935
asserted there has been any significant global
warming in the 20th century.
2. All terrestrial surface-temperature
databases exhibit serious problems that render
them useless for determining accurate long-
term temperature trends.
5. There has been a bias towards removing
higher-latitude and rural stations, leading to a
serious overstatement of global warming.
1880 1935 2000
13. Global terrestrial data bases are seriously
flawed and can no longer be trusted to
assess climate trends or validate model
forecasts. http://scienceandpublicpolicy.org/images/stories/pape
rs/originals/surface_temp.pdf 55There is no credible surface temperature-measured
data to prove the 20th-century global warming.
Okay, how about atmospheric measurements?
The most accurate data are from satellites, since they measure
the entire globe. All the satellite data show a global warming slope
the same as the entire 19th-century average, i.e.
the recent, big human emissions are doing
nothing to the natural global warming trend.
Lower Tropical Global Temp Anomaly, UAH
The overall trend is only 50% of the „low‟
IPCC forecast.
The current temperature is identical to 1979.
56Russian Vostok ice cores, Antarctica
The Greenland ice core data show it Maximum, 8,000 years ago
has been consistently warmer for the Present temperature and
last century warming
last 11,000 years.
Today‟s climate is not even close to
being the “warmest on record”.
Note the wild variances
in temperatures during
thousands of years of
constant CO2 levels
(green data). Maximum, 8,000 years ago
Present temperature and
last century warming
From: http://www.c3headlines.com/ 57Three Alarmist‟ and UN-IPCC claims:
1.Global temperatures have been moderate, before
human fossil fuel emissions caused unprecedented
warming the last 50 years.
2.Ice cores are local data, not global.
3.The Medieval Warming Period was limited to
Northern Europe and the Atlantic (not global).
Hockey stick presentation.
They want you to believe the Present is at the right.
global past and the recent
warming looks just like the
hockey stick graph here.
The next five slides show data the IPCC
does not want you to see. They show that
all the above three claims are bogus.
58Some Temperature Proxies (non-ice core, non-thermometer)
Within the recent 11,000-year warm period
Last 2,000 years from 18 non-tree ring Last 5,000 years from other proxies
proxies (Dr Craig Loehle). Carter 2007.
Present temperature and
last century warming
Last 1200 years from historical records.
Shown in the 1990 IPCC Report.
Conclusion: The claim that emissions have caused
unprecedented warming is not supported by the data.
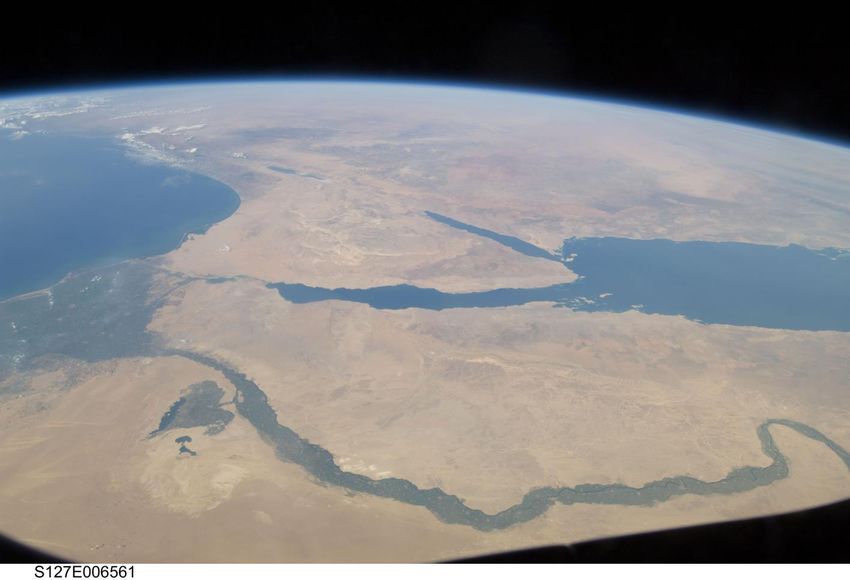
59More proxies or temperature trend indicators;
Within the recent 11,000-year warm period, many parts of the globe.
Core sediments of a
Greenland lake, 9k years.
Austrian cave
stalagmites, 2k years.
Tibet summer maximum
temperatures, 700 years.
Blue circles show Tree rings from
present conditions Pakistan mountains,
1000 years
Conclusion: The claim that emissions have caused
unprecedented warming is not supported by the data.
60Still more proxies or temperature trend indicators;
Within the recent 11,000-year warm period, many parts of the globe.
Multiple proxies
W Canada ice field,
2k years.
Blue circles show
approximate present
New Zealand caves, 2k years.
conditions.
Source: co2science.org
Graphs by c3headlines.com
New Zealand
Cave data, 2k years.
Sediment cores.
Arctic circle regions,
800 years.
Conclusion: The claim that emissions have caused
unprecedented warming is not supported by the data. 61Sea Surface Temperatures are trend indicators for global warming,
Proving that the Medieval Warm Period did exist.
Conclusion: The claim that emissions have caused
62
unprecedented warming is not supported by the data. Graphs from
c3headlines.comI’ll Bet You Have Never Seen These Charts
Global Temperature, The Last 11,000 Years (current, non-glacial warm period)
Ice core data, overlaid with other proxy temperatures.
You haven’t seen them,
Red Circle is the because they are not scary.
claimed AGW scare
They are not presented in an
attempt to blame humans.
Overlaid on Ice Core Data:
Blue = Loehle, 18 non-tree-ring proxies
Green = Carter
Purple = Historical Record (IPCC, 1999)
Black = Greenland lake core sediments
Orange = Austrian cave stalagmites
From ice cores, it was
Red Circle is the
warmest 8,000 years ago
claimed AGW scare (two brown circles).
It was significantly
warmer than today,
during the Roman
expansion and the later
Medieval Warm Period.
63However, you have probably seen this one
The World „Famous‟ “Hockey Stick” - 1000 years of stable,
decreasing temperature followed by a sudden rise after 1900
UN IPCC 2001 Report, 6 places, full color (the only chart so honored).
An Inconvenient Truth - NYT best selling book.
Oscar-winning „Documentary‟ Film – Inconvenient Truth.
Nobel Prize, IPCC and Al Gore - highlight award justification.
Error bars
Big error bars disappear
Al Gore – Error bars and
data scatter are now gone
The initial claim: this chart is genuine; it was
The Hockey Team
generated by scientists from corals, tree
rings, historical records and thermometers.
64How the Hockey Stick was Developed
No one admits to how it started, so lets take a look at what we do know…….
Note spacing difference in
A challenge, to meet tree ring photo between 3-
the IPCC mission o‟clock and 8-o‟clock bores.
Jonathon Overpeck,
Co-director of the
Institute for
Dr. Michael Mann, Penn State
Environment at U of Keith Briffa CRU
U, Meteorology, Geosciences
Arizona (a lead author A lead Author, IPCC Rpt 3. Climatologist.
of the IPCC report) Research areas: climate Tree-ring specialist.
sent an e-mail to Briffa reconstruction using climate Some suspect he is the
and Osborn saying he “proxy” data networks, and „covert whistleblower‟
wants to: model/data comparisons: who leaked the
Briffa and Mann used model incriminating emails in
bias and cherry-picked data to 2009.
“deal a mortal blow to build the hockey stick.
the Medieval Warm
Period (and Holocene Tree rings can indeed give an approximate
Optimum) myths”. indication of past temperatures, if the
science is handled properly:
Note: In fact, in order to •Other factors effecting tree growth are considered
generate the desired (precipitation, soil, slope, altitude, local cloud cover,
hockey stick shape it was position relative to ocean, rivers, tree-line, etc).
Phil Jones, IPCC lead author:
• Thousands of trees in hundreds of locations are
required to hide both the Responding to a request by an
independent researcher for his needed, in order to get just a rough idea of historic global
MWP and the LIA (little ice climate data “We have 25 temperature trends.
age). years invested in the work. • Small, selected samples can result in large data bias.
Why should I make the data Thus - very useful for those seeking a specific answer.
available to you, when your
aim is to try to find something
wrong with it." 65Building a Hockey Stick
The “Tree Ring Circus”
Steps along the way, to generate history‟s most damaging Scare Chart
Briffa‟s original selection of Processing the data, by
Yamal trees. A tiny sample Michael Mann.
used after 1900.
Hiding the decline.
Shorter time interval. Red
data was deleted without
explaining why!
Same data set, except a
larger number of trees
used after 1900.
Now, using all 20th
century trees without
„quality selection‟.
There, fixed it.
Red data: Use of a single,
A strange finding: non-Yamal bristlecone tree
The computer program written to process (yes, only 18 rings) after
the tree-ring temperature proxy data 1990!
produces a hockey stick shape even when
the inputs are random numbers……….. The desired result - a
Huh?? scary Hockey Stick!
Apparently his program gave higher
weighting to data that better resembles the
hockey stick. 66While one of the Hockey team has been „cleared‟ by his
college staff, these points were not made in the investigation:
• Briffa and Mann had a Choice to make when selecting trees and rings in
their preparation of the hockey stick chart. They studied all their tree ring
data and chose to present only a tiny selection, knowing it supported a
desired result but was not representative of the mass of data.
• They had a scientific Responsibility to reveal and justify their choices.
Instead they cherry picked, hoped no one would ever check their data,
refused to share it, agreed to destroy evidence and failed for years to
respond to FOIA lawsuits. Clearly they knew their fraudulent chart would be
used as „proof‟ of a result desired by IPCC and their funding sources.
• An obvious question - What were they thinking on Oscar night and
Nobel prize day? Also, what was James Hanson thinking after he defined
thousands of Russian September temperature readings as being for October,
in order to then claim that it was the warmest October on record; even though
weather reports were showing record cold that month. None of these
„scientists‟ admitted their errors until after independent researchers
challenged them.
67Oh, I bet you were wondering…..
Add the Hockey stick (Red data) to our 11k-year chart.
Even the fraudulent Hockey stick doesn‟t look that scary on a
chart meant to Inform, not to Scare.
68Best Prediction for the next 100 years?
A 0.6 deg C rise, similar to the last 100 years.
Note, the last 30-year warming and last decade‟s cooling (red dot
and green arrow) does not look unusual.
Red Circle is the
claimed AGW scare
100 years
69Another Prediction, based on the last century
Continuation of the recent warming/cooling cycles.
The three extrapolations are a repeat of the last three cooling periods.
Note the departure of the real data after the 2001 IPCC forecast.
70#3 - Dangerous, unusual warming the last 50 years? No.
When corrected for the local urban warming of sensors and the
Soviet/Russian site issues, there was no unusual global
surface warming. Atmospheric warming measurements in the
satellite era also show nothing to indicate a warming alarm.
Other reported data indicating warming has been shown to be
cherry-picked and manipulated.
1. Recent human burning of fossil fuels suddenly and dangerously
increased CO2 beyond previous levels – Yes/No.
2. Human CO2 emissions causes greenhouse warming – No.
3. Dangerous, sudden global warming occurred the last 50 years
– No.
4. The current Temperature is too Hot & further warming is Bad.
5. It is more difficult to adapt to climate changes than to attempt to
control them.
Next is #4. Now, let‟s consider this: Has the last 50-
years of human emissions caused anything bad? What
is the “best” temperature or “best” CO2 content? Is the
earth worse if it warms a few more degrees? 71Alarmist Claims: Human CO2 emissions Causes Disasters
Tell them - “Show me the data”
Records show that twice as many die from extreme cold events than extreme
hot events. Thus, Human survival would improve if it were warmer.
DOWN
Extreme events- caused
deaths
Number of
F3-F5 tornados
DOWN
Flood
fatalities
Lightning
deaths
72Human CO2 emissions Causes Disasters?
“Show me the data” (2)
DOWN
Hurricanes
Per decade
Scandinavia
severe storms
DOWN
Cyclone
Intensities
Cyclone
Energy
lowest in 33 yr
73Human CO2 emissions Causes Disasters?
“Show me the data” (3)
FLAT
Droughts &
Floods
Precipitation
Modulates
Temperature
changes
Washington Governor said the snow pack has declined 20%
over the past 30 years. Actual snow pack = 22% INCREASE.
No Correlation
Glacier shortening
Unaffected by
emissions
7475
Human CO2 emissions Causes Disasters? “Show me the data” (4)
  Arctic sea ice extent 1978 to July 2010.
During March and April 2010 the ice recovered to the                Arctic
1979-2000 average. It then decreased by mid July to
the 2008/2009 July extent. However, Global sea ice
extent remained flat during the 30 year period.

                                    FLAT
                                    Global Sea Ice
                                    Extent

                                                       Antarctic

                                    INCREASING
                                    Southern
                                    Hemisphere
                                    Sea ice extent

                                    DECREASING
                                    Northern                 Polar Bear Population
                                    Hemisphere                    1950 - 5,000
                                    Sea ice extent               1980 - 10,000
                                                                                     76
                                                                Current - 24,000
Human CO2 emissions Causes Disasters?
Sea Levels “Show me the data” (5)
Sea Levels are
merely continuing
their slow rise
since the end of
the Little Ice Age.
Since 1870
Steady ~ 2 mm/yr
(8 inches/century)
This chart shows
the large sea level
recovery from the
latest big ice age.
Conclusion:
The most-likely
next-century rise
= 5 to 8 inches.
77The Fallacies of Curve-Fitting Sea-Level Data
Linear fits are subject to cherry-picking of periods.
Regression fitting of longer periods are equally misleading (sea level reducing now).
A biased „scientist‟ or skeptic can show anything he wants.
There is no justification for fears of acceleration of the last 1000 years slow rise (1.4
to 2 mm/year).
Land-borne ice levels have recently been increasing and many of the previously-
receding glaciers are now growing. Future S/L rise will be mainly due to the lag in
global temperatures finally warming the sea, not due to melting of land-borne ice.
Black line = 12.6 inches per century (last 18 years) This curve fit shows the sea now falling
Orange line = 8.7 inches per century (last 10 years) Red Curve = 5th order polynomial regression
Most likely next century rise = 5 to 8 inches.
78Another Sea Level Prediction……
Just extrapolate the predictions of the UN IPCC.
Hey, in 16 years even the UN will predict no next-century
sea level rise!
79#4. - Is the current temperature perfect? Unlikely.
Will warming and increase in CO2 be good? Yes.
Recent climate changes have not caused weather or extinction
degradation. Overall, adverse weather events and the number of
extinctions will not increase if the next century or two warms like the last
one. A CO2-fertilized atmosphere will enhance plant growth, increase
drop yields and allow more people to live in, and farm our lower-populated
higher latitudes - saving tens of millions of human lives.
1. Recent human burning of fossil fuels suddenly and dangerously
increased CO2 beyond previous levels – Yes/No.
2. Human CO2 emissions causes greenhouse warming – No.
3. Dangerous, sudden global warming occurred the last 50 years – No.
4. The current Temperature is too Hot & further warming is Bad – No.
5. It is more difficult to adapt to climate changes than to attempt to control
them.
Next is #5. Few in the CAGW debate ever discuss adaptation.
However, early man and modern man has always used his
intellect to adapt to just about every environment and every
hazard he encounters throughout planet earth. 80What do we get by taxing energy to constrain use?
Even if it is possible, it is unbelievably expensive to control climate
The human control of the climate is not only in doubt, it is
Horribly expensive.
Example - even assuming the greenhouse theory is correct,
Waxman-Markey, after doubling not only energy costs, but
raising costs of everything tied to energy, would delay Global
Warming by 3.8 years, a hundred years from now!
Any engineered adaptation would be cheap by comparison.
81The California Lower Desert Has Brutal Summers
But, adaptation is rapid and affordable, using low-cost energy and innovation.
Car A/C is 71 years old (1939 Packard) and became common in the 70s.
It will be even easier next century to adapt much quicker than the climate can
change - again using energy and the human brain.
Rutan lives below sea level.
Coral below the line, rock above.
156 days/year above 100 deg F
Monthly average shown, record is 123 deg F in 1970
Rutan in his Ice-cooled Arctic Hat,
golfing in the 115-degree heat
With energy and innovation. Without, humans die.
82Humans Can Adapt in a Generation or Two
Adapt to heat Adapt to cold
Dubai
South Pole
Death Valley
Fairbanks
83In Only 100 years, Humans Adapted to Severe Conditions
By using innovation, technology and energy
Much colder than Mars, 15% of sea level pressure,
700 mph wind (twice that of Jupiter‟s Red Spot hurricane).
Higher pressure than No atmosphere
the surface of Venus at all.
84Adaptation Works, Constraining fails
• No up-front costs. Adapt only when the need is
certain and focus expenses on the real need.
• The optimum way to move quicker to
alternate/renewable energy is to use our oil and
coal faster, not slower. Drill it out and sell it to
the world. The prosperity would allow quicker
alternative energy development.
• Technology products move quickly to the poor
in a prosperous, free-market.
• The poor stay poor and are joined by the rich in
an energy-constrained, over-regulated
environment.
• The poor had no home air conditioning only 50
years ago.
• We will need economic prosperity to fund
development of new energy breakthroughs
(deep geothermal, fusion, ZPE, TBD, etc).
85The Result of A Decision;
to control rather than adapt.
The caveman option, with constrained energy use. This environment
is not good for creativity, innovation and breakthroughs.
Ration Energy = huddle/freeze in the dark
86#5 - Is it cheaper to constrain, than to adapt?
No.
It is possible to constrain energy use with taxes/fees. But,
even if imposed, it is not possible to significantly change
climate. An energy-constrained economy will not allow the
economic growth to fund technical solutions for adaptation or
solutions for control, if they are discovered in the future.
Those that forecast seem to forget that with people come
minds - Minds that innovate to adapt to changes. We are no
longer Cavemen.
1. Recent human burning of fossil fuels suddenly and dangerously
increased CO2 beyond previous levels – Yes/No
2. Human CO2 emissions causes greenhouse warming – No.
3. Dangerous, sudden global warming occurred the last 50 years – No.
4. The current Temperature is too Hot & further warming is Bad – No.
5. It is more difficult to adapt to climate changes than to attempt to
control them – No.
87Scientist Consensus?
Under pressure, the UN released the comments and recommendations
of its in-house scientist reviewers who coordinated the drafts of the
latest IPCC report. This is what it revealed.
88Scientist Consensus? (2)
Of the seven IPCC impartial scientists that coordinated
and commented on the statement that “human greenhouse
gas caused the recent warming”, two of them accepted
interviews:
1.Dr Ross McKitrick University of Guelph: "A categorical
summary statement like this is not supported by the
evidence in the IPCC WG-I report”
2. Dr Vincent Gray of New Zealand: “Typical IPCC
doubletalk...The text of the IPCC report shows that this is
decided by a guess from persons with a conflict of
interest, not from a tested model”
Quote of the month:
“I‟m sticking with the 2,500 scientists”
Carol Browner, Director of the White House Office of
Energy and Climate Change Policy
89Scientist Consensus? (3)
Petition signed by 31,000 scientists, 9,100 with PhDs
“There is no convincing scientific evidence that human release of carbon dioxide,
methane, or other greenhouse gases is causing or will, in the foreseeable future,
cause catastrophic heating of the Earth‟s atmosphere and disruption of the
Earth‟s climate. Moreover, there is substantial scientific evidence that increases
in atmospheric carbon dioxide produce many beneficial effects upon the natural
plant and animal environments of the Earth” www.petitionproject.org/index.php
The Manhattan Declaration
Endorsed by scientists in 40 countries
“Attempts by governments to legislate costly regulations on industry and
individual citizens to encourage CO2 reduction will slow development while
having no appreciable impact on the future trajectory of global climate
change. Such policies will markedly diminish future prosperity and so reduce the
ability of societies to adapt to inevitable climate change, thereby increasing, not
decreasing human suffering.” www.climatescienceinternational.org/
Meteorologists Reject U.N.‟s Global Warming Claims
Small minority of AMS members agree with AMS Position Statement.
24% agree that “Most of the warming since 1950 is likely human-induced”
19% agree that “Global Climate Models can reliably predict”
http://www.heartland.org/publications/environment%20climate/article/26794/Meteorologists_Reject_UNs_Global_Warming_Claims.html
90Observations
• The only „evidence‟ that humans cause global warming
comes from computer models. The creator of the model
can make it show whatever he wants, by adjusting
parameters.
• Man has not demonstrated an ability to change global
temperatures, nor to forecast future climate conditions.
• It would be desirable to have more atmospheric CO2 than
present, to increase crop yields and forest growth. This
would save tens of millions of lives next century.
• The warming experienced in the last century and the
warming expected in the next, did not and will not cause
a net increase in extinctions or weather calamities.
• We do not know the important stuff - what causes the
dangerous drop into the major ice ages or what causes the
cyclic return to the brief interglacial warm periods.
• Is the debate over? "It is error only, and not truth, that
shrinks from inquiry.”
91Conclusions • The CAGW agenda is supported with deceptively altered science. In spite of recent, human-caused atmospheric CO2 increases, there is nothing out of the ordinary happening with our climate. • Climate Change is real. The earth has been naturally warming since the “Little Ice Age”, with cooling cycles. • Fossil fuel use adds a small % to an important trace gas, that is not only beneficial, but is the essence of life itself. • We cannot burn fossil fuels to prevent the next ice age; the greenhouse gas effect is far too weak for that. • Current fuels will become naturally constrained by cost as they become scarce. Government taxes are not required. • If Man, in the future, achieves a capability to change global temperatures, he will likely use that technology to warm the planet, not to cool it. • Manmade global warming is over. It existed only in the minds of grant-seeking scientists and academics, ratings- obsessed media and opportunistic eco/political-activists. 92
Recommendations
• Recognize that, in terms of cost and human lives, the
  Government efforts to constrain use and increase the cost of
  energy are orders of magnitude more important than the
  certification of a new airliner.
• We cannot assure airline public safety by using a computer
  model to predict airline safety; we must do extensive testing
  under real conditions and pay attention to all the results.
• Require an engineering task as rigid as the certification of an
  airliner. Apply that task to the „theory of climate modification
  by man‟. Mandate that „engineering certification‟ be done
  before governments can impose taxes, fees or regulations to
  constrain our use of any product to fuel our energy needs.
• Engineers do listen to scientists and use their work to help
  them plan the testing/validation needed to complete their
  certification goals. However, using scientists to direct airliner
  certification, would be as disastrous as scientists proposing
  theories to direct National or World energy policy.
                                                                      93
Now, lets look at some quotes
Eric Hoffer,
"One of the surprising privileges of
intellectuals is that they are free to
be scandalously asinine without
harming their reputation."
The Difference between an Environmentalist and a Denier
You can easily tell if someone is a true environmentalist, i.e.
an advocate for a healthy planet - he is one who is happy to
hear the news that the arctic ice has returned. He is one who
celebrates when the recent climate data show the alarmist‟s
predictions of catastrophic warming might be wrong. The
denier, if he is an eco/political activist, always denies new data
that show the planet may be healthy after all. The Media
usually defines deniers as those who deny the scientist's
computer model predictions. However, denying the measured
climate data meets a better definition in the world of
science. Burt Rutan
94From “Kicking the Sacred Cow: Questioning the Unquestionable and Thinking
the Impermissible” by James P Hogan
Science really doesn't exist. Scientific beliefs are either proved wrong, or else
they quickly become engineering. Everything else is untested speculation."
95Dr. James Lovelock Excerpted from Frank Davis, „Lovelock Walks Away‟
1970s Author of GAIA http://frank-davis.livejournal.com/58819.html
One of the honest science guys. Although Dr. Lovelock in 2006:
being a Global Warming Alarmist, he has “We are responsible and will suffer the consequences of Global Warming”
criticized the IPCC, and the Government Dr. Lovelock in 2007:
plans to constrain energy. However, he has “By 2040, the Sahara will be moving into Europe, and Berlin will be as hot as
Baghdad. Phoenix will become uninhabitable. By 2100, the Earth‟s population
recently presented an opposing view on will be culled from today‟s 6.6 billion to as few as 500 million, with most of the
catastrophic warming and now talks about survivors…in Iceland, Scandinavia, the Arctic”.
the science fraud that occurred during the Dr. Lovelock in 2008:
“… global warming is now irreversible, and nothing can prevent large parts of
ozone hole scare of the 70s (“80% of the the planet becoming too hot to inhabit, or sinking underwater… famine and
measurements being made during that time epidemics”.
were either faked, or incompetently done”), Dr. James Lovelock Now - March 2010:
comparing that with the recent AGW science At London‟s Science Museum Dr Lovelock said: “If we hadn‟t appeared on the
earth, it would be due to go through another ice age… greenhouse gases that
fraud. have warmed the planet are likely to prevent a big freeze….We‟re just fiddling
The 90-year-old British scientist, who has around. It is worth thinking that what we are doing in creating all these carbon
emissions, far from being something frightful, is stopping the onset of a new ice
worked for NASA and paved the way for the age….we can look at our part as holding that up…..I hate all this business about
detection of man-made aerosol and feeling guilty about what we‟re doing…..We‟re not guilty, we never intended to
refrigerant gases in the atmosphere, now pump CO2 into the atmosphere, it‟s just something we did.”
He compared today‟s climate change controversy to the “wildly inaccurate”
calls for greater caution in climate research. early work on aerosol gases and their alleged role in depletion of the ozone
layer: ”Quite often, observations done by hand are accurate but all the
theoretical stuff in between tends to be very dodgy and I think they are seeing
this with climate change….We haven‟t learned the lessons of the ozone-hole
debate. It‟s important to know just how much you have got to be careful”
"I think you have to accept that the skeptics have kept us sane….They have
been a breath of fresh air. They have kept us from regarding the science of
climate change as a religion. It has gone too far that way. There is a role for
skeptics in science. They shouldn't be brushed aside. It is clear that the „angel
side‟ wasn't without sin”.
From Frank Davis - Perhaps this is what happens when people realize they're
wrong. They start talking as if they'd always urged caution, had always warned
of the danger of inaccurate scientific predictions and manipulated data.
96You can also read