Corporate Energy Management Plan 2019-2024 - City of Brantford
←
→
Page content transcription
If your browser does not render page correctly, please read the page content below
Corporate Energy Management Plan 2019-2024
Corporate Energy Management Plan:
            2019-2024

         The City of Brantford
Contents
Executive summary ...........................................................................................................................................v
Context ..........................................................................................................................................................v
Scope and methods ..................................................................................................................................v
Major assumptions .................................................................................................................................. vi
Status of data ............................................................................................................................................. vi
Main findings ............................................................................................................................................ vi
Conclusions & recommendations .................................................................................................... vii
Introduction ......................................................................................................................................................... 1
Context ......................................................................................................................................................... 1
Planning horizon and scope ................................................................................................................ 3
Planning process ....................................................................................................................................... 4
Framework for planning ........................................................................................................................ 6
Progress since the previous plan ........................................................................................................ 7
Trends in energy use ............................................................................................................................... 9
Trends in greenhouse gas emissions ............................................................................................... 13
Energy management initiatives that have been implemented .............................................. 14
Preferred state of energy management ................................................................................................... 15
Preferred state .......................................................................................................................................... 15
Targets ......................................................................................................................................................... 16
Getting to the preferred state of energy management ...................................................................... 17
Actions related to governance........................................................................................................... 18
Actions related to partnerships and collaborations .................................................................. 20
Actions related to communications and training ....................................................................... 22
Actions related to funding and procurement............................................................................... 24
Actions related to monitoring and tracking ................................................................................. 26
Actions related to technology and standards .............................................................................. 28
Capital costs ...................................................................................................................................................... 30
Renewables and alternative energy ......................................................................................................... 31
Landfill gas ................................................................................................................................................ 31
Biogas .......................................................................................................................................................... 31
Findings and conclusions ............................................................................................................................ 33
References .......................................................................................................................................................... 35
Appendix A. Present state ......................................................................................................................... 37
Appendix B. Municipal experience and best practices ................................................................ 40
B.1. Summary of key success factors ........................................................................................... 45
Appendix C. Financial incentives .......................................................................................................... 46
BRANTFORD CORPORATE ENERGY MANAGEMENT PLAN 2019-2024 iiiC.1. Independent Electricity system Operator (IESO) ........................................................... 46
C.2. Union Gas ..................................................................................................................................... 46
C.3. Federal incentives ...................................................................................................................... 48
C.4. The Atmospheric Fund incentives ....................................................................................... 50
Appendix D. Conversion and emission factors ................................................................................ 52
Appendix E. Conservation demand management plan checklist ............................................. 53
iv INDECO STRATEGIC CONSULTING INC.Executive summary
CONTEXT
The Corporate Energy Management Plan is an update of the 2014 plan
adopted by the City of Brantford. It is designed to meet the
requirements of Ontario Regulation 507/18 under the Electricity Act,
and to serve as a roadmap for initiatives over the period from July 1,
2019 to June 30, 2024 to reduce energy use and greenhouse gas
emissions in City operations.
The plan is developed in the context of three key considerations:
• Growing concerns about climate change and the need to
aggressively reduce greenhouse gas emissions
• Rising energy prices and possible supply constraints
• The availability of financial incentives to assist the City in
taking action.
SCOPE AND METHODS
The plan considers energy use and greenhouse gas emissions within the
corporation of the City; community initiatives are outside the scope of
the plan. The plan addresses buildings, parks, water and wastewater
pumping and treatment facilities, streetlighting, and transportation
fleets. Energy use and opportunities in social housing are not addressed
by the plan.
The plan reviews energy use and emissions for 2014 to 2018, and plans
for energy use and greenhouse gases over the period from July 1, 2019
to June 30, 2024.
Greenhouse gas emissions are based on a Scope 2 analysis, which
includes direct emissions from the burning of natural gas, diesel fuel
and gasoline, and indirect emissions resulting upstream from the
generation of purchased electricity. The assessment does not include
energy embedded in products purchased, employee commuting, or
other activities considered as ‘Scope 3’. Greenhouse gas emissions
consider only energy use; land use changes, for example, are not
considered.
The development of the plan involved a range of activities, including:
• A review of energy use patterns in the City over the last five
years (2014-2018)
• Interviews with representatives of departments with
responsibility and control over major energy using activities,
including: Environmental Services, Recreation Facilities &
Operations, Engineering Services, Fleet and Transit Services,
Facilities & Asset Management, and Social Housing.
BRANTFORD CORPORATE ENERGY MANAGEMENT PLAN 2019-2024 v• Consultation with the Environmental Policy Advisory
Committee (EPAC) at project initiation and the draft report
stages
• Workshops with departmental representatives on Brantford’s
future, and actions to get there
• A review of practices in other municipalities.
MAJOR ASSUMPTIONS
• Although the Brantford population is expected to grow by
approximately 10% between 2019 and 2024, a comparable
increase in energy for municipal services is not expected
• Resources will be available to execute the plan
• It will be possible to resolve contractual issues that are
preventing the use of biogas from the wastewater treatment
facility in the landfill cogeneration facility
• Greenhouse gas intensity of grid electricity in 2018 was the
same as in 2017.
STATUS OF DATA
• Historic data are from utility bills and are deemed to be
accurate.
• Projected emission savings and costs are based on the literature
and assumptions about savings and costs. More detailed
assessment of potential costs and savings will need to be
developed as specific projects are identified.
• Greenhouse gas estimates are based on the average GHG
intensity of purchased electricity. This overstates emissions
associated with night-time electricity using activities (like
streetlighting), and understates emissions attributable to
electricity using activities that occur during peak demand times.
MAIN FINDINGS
• Staff and EPAC would like to see the City substantially reduce
its greenhouse gas emissions, and increase its use of renewable
energy sources.
• A target set in the 2014 plan called for a reduction of energy
use per square foot of 4.9% This target was not met. The
primary reason is the impact of the Wayne Gretzky Sports
Centre was not fully understood at the time of the previous
plan. WGSC is a very large facility and is the largest user of
vi INDECO STRATEGIC CONSULTING INC.energy in the municipality. If that centre is excluded, energy
reductions in buildings exceeded the target.
• A second target was to reduce greenhouse gas emissions by
5.3%. Reductions were estimated at 10.2%, largely because of
changes in the carbon content of electricity. If electricity had the
same carbon content today as in 2014, usage would be up by
3.3%
• In the 2014 plan, targets were not set for other energy uses in
the City. However, energy intensity and use for water and
wastewater dropped, as did electricity for streetlighting. Use of
gasoline and diesel increased.
• There were numerous projects undertaken which resulted in
significant energy savings, and ultimately energy cost reductions
for the municipality.
• The major uses of energy are for fleets (21%), which is mostly
for transit vehicles; the Wayne Gretzky Centre (20%), and water
and wastewater treatment and pumping (26%).
• Most greenhouse gas emissions (47%) result from transportation
fuel use, and most of the remaining greenhouse gas emissions
arise from the use of natural gas (46%). The Wayne Gretzky
Sports Centre uses about 36% of all natural gas.
• Staff identified several barriers to realizing additional energy
savings:
o There is unclear distribution of responsibility for realizing
energy savings. Although the Facilities Department
nominally had responsibility for the plan, it is only
directly responsible for about 7% of overall energy use.
o Staff identified significant resource constraints limiting
their ability to undertake additional actions. These
restraints include both time to plan, manage, monitor
and evaluate projects, and money to pay for projects. On
the financial side, the conflict between initial capital cost
and life-cycle cost was acknowledged, and initial capital
cost was seen as dominating technology choices.
o Staff do not have good information on the patterns and
sources of energy use, and therefore where actions
should be taken.
CONCLUSIONS & RECOMMENDATIONS
To address the challenges associated with climate change, and rising
energy prices, Brantford needs to promote a change in corporate
culture towards a ‘culture of conservation’. This requires a
comprehensive approach to energy that consists of six key components:
BRANTFORD CORPORATE ENERGY MANAGEMENT PLAN 2019-2024 vii1. Governance and accountability – which requires measures
related to policies, targets and resources required to enable
energy management and other actions.
2. Partnerships and collaboration – this involves measures
related to networking, relationship-building, information
sharing, and best practices.
3. Communications and training – related to measures to
encourage behaviours and operating procedures that reduce
energy use and greenhouse gas emissions
4. Funding and procurement – which relate to the
identification, prioritization, funding and procurement of
energy and renewable technologies
5. Monitoring and tracking – to ensure that data on energy use
and emissions are collected, analyzed, and shared
6. Advanced technology and energy efficiency standards –
which will involve technology and policy measures that
impact new and existing buildings, fleets, streetlighting and
traffic lights, and other operations that use energy and
produce emissions.
These six components support new energy targets for the 2019-2024
timeframe that are set out in Table 1.
Table 1 Energy reduction targets for 2019-2014
Current
Source 2019-2020 2021-2022 2023-2024 Total
(GWh)
Buildings - electricity 17.2 1.0% 4.0% 4.0% 9.0%
Buildings - gas 19.6 1.0% 4.0% 4.0% 9.0%
Water - electricity 9.3 2.0% 6.0% 4.0% 12.0%
Water - gas 4.8 1.0% 4.0% 4.0% 9.0%
Wastewater - electricity 9.2 2.0% 10.0% 20.0% 32.0%
Wastewater - gas 2.6 1.0% 4.0% 4.0% 9.0%
Fleet transit (ML) 1.14 0.0% 0.0% 0.0% 0.0%
Fleet non-transit (ML) 0.7 1.0% 4.0% 4.0% 9.0%
Streetlights 7.59 5.0% 15.0% 15.0% 35.0%
Overall electricity 43.29 2.1% 7.6% 9.3% 19.1%
Overall natural gas 27 1.0% 4.0% 4.0% 9.0%
Overall diesel and gasoline 19.20 0.3% 1.2% 2.4% 4.0%
A set of actions related to each of the key considerations and which
support realizing the targets are identified in the plan. These are
summarized in Table 2.
viii INDECO STRATEGIC CONSULTING INC.Table 2 Summary of major actions by key plan component
Key plan component Summary of major actions
Governance & accountability • Establish and commit to long-term and short-term targets
• Hire new full-time, permanent staff positions, initially including a Climate
Change Officer, and an Energy Manager/Technician
• Establish an interdepartmental corporate energy steering committee
• Create an energy working group for the Wayne Gretzky Sports Centre
• Report annually to senior management, Council and the public on progress
of the CEMP
Partnerships & collaboration • Meet twice a year with EPAC, Brantford Power, IESO, and Union Gas
• Participate in the Corporate Energy Managers Community of Practice
• Establish connections with sustainability personnel in other Brantford
organizations
• Collaborate and exchange information with other municipalities
Communications & training • Communicate to all staff about the CEMP and progress
• Develop training modules for all staff
• Provide specific training for staff who operate and maintain buildings or
vehicles
• Encourage staff to participate in conferences, tradeshows and other events,
and to share learnings from these with colleagues
Funding & procurement • Identify opportunities to piggyback efficiency improvements on planned
capital projects
• Review the criteria for prioritizing and budgeting, including life-cycle
financial analysis and a shadow price for carbon
• Develop purchasing criteria that address life-cycle costs, energy efficiency,
and GHG emissions
• Formalize responsibility for seeking incentives
• Reinvest incentives received for efficiency projects in the energy reserve
fund, and ensure staff are aware of how to access this fund
Monitoring & tracking • Acquire an Energy Management System to facilitate tracking and reporting
on energy use
• Develop a plan for analysing and using energy data
• Develop an EMS dashboard for departmental managers and operators
• Sub-meter major energy using equipment
• Assess whether energy data needs are being met and whether there are
adequate resources to collect, manage and analyze data
Advanced technology & • Continue upgrading existing equipment with efficient equivalents
energy efficiency standards
• Review and pilot alternatives to fossil fuels, such as ground source heat
pumps, electric pick-up trucks, and heavy-duty electric vehicles
(including transit)
• Review and pilot alternative energy systems, such as solar, or anaerobic
digestion of organics
BRANTFORD CORPORATE ENERGY MANAGEMENT PLAN 2019-2024 ixBased on a very preliminary assessment of needs at 0.25 $/kWh,
funding required to meet the targets is set out in Table 3.
Table 3 Preliminary assessment of funding requirements to meet targets
Year Funding requirement
2020 $320,000
2021 $600,000
2022 $600,000
2023 $700,000
2024 $700,000
x INDECO STRATEGIC CONSULTING INC.Introduction
The City of Brantford Corporate energy management plan (CEMP)
provides a roadmap for energy management in the City of Brantford.
The CEMP describes the energy management activities that the City as a
corporation can take over the next five years to increase its energy
efficiency, reduce its energy demand, and minimize its environmental
footprint. It is also designed to help the City comply with the energy
conservation and demand management planning requirements of
Ontario Regulation 507/18 under the Electricity Act (1998). This plan
updates and builds on the previous plan adopted in 2014.
CONTEXT
The CEMP occurs in the context of some important changes within the
larger environment within which Brantford is situated, with three issues
in particular being particularly significant:
• Growing concerns about climate change and the need to
aggressively reduce greenhouse gas emissions
• Rising energy prices and possible supply constraints
• The availability of financial incentives to assist the City in taking
action.
Climate change
Climate change is largely driven by the use of energy, and in particular
fossil fuels used for space heating, electricity generation and
transportation. Within the international scientific community, there is
growing concern about severe impacts of climate change caused by
greenhouse gas emissions on human society. In the fall of 2018, the
Intergovernmental Panel on Climate Change released its assessment of
what is needed to avoid catastrophic impacts on human society and
concluded with high confidence: “Limiting warming to 1.5ºC implies
reaching net zero CO2 emissions globally around 2050 and concurrent
deep reductions in emissions of non-CO2 forcers, particularly
methane.” (Rogelj et al., 2018). An assessment of climate change
impacts in Canada concluded: “Both past and future warming in
Canada is, on average, about double the magnitude of global
warming.” (Environment and Climate Change Canada, 2019a) In
addition, the Bank of Canada has identified climate change as one of
the key vulnerabilities to the Canadian economy: “Climate change
continues to pose risks to both the economy and the financial system.
These include physical risks from disruptive weather events and
transition risks from adapting to a lower-carbon global economy.”
(Bank of Canada, 2019)
To address these challenges, numerous municipalities in Canada and
around the world have declared a ‘climate emergency’. As of May 12,
BRANTFORD CORPORATE ENERGY MANAGEMENT PLAN 2019-2024 12019, such a declaration has been made by 31 Canadian municipalities
including: Kingston, Hamilton, London, Burlington, Ottawa, St.
Catharines, and Halton Hills. (Random Acts of Green Inc., 2019)
Climate emergencies have also been declared by the United Kingdom,
Ireland, and at the time of writing is being debated in the Canadian
House of Commons.
Many municipalities, as well as the provincial and federal government,
have set aggressive targets for reducing greenhouse gas emissions that
contribute to climate change, some of which are summarized in Table
4.
Table 4 Greenhouse gas emission reduction targets of a selection of Ontario municipalities, Canada
and Ontario
Municipality Target by Relative to Set in
Toronto 30% 2020 1990 2017
Toronto 65% 2030 1990 2017
Toronto 80% 2050 1990 2017
Burlington Carbon neutral 2040 2015
Oxford County 100% renewable energy 2050 2015
Hamilton 20% 2020 2005 2014
Hamilton 50% 2030 2005 2014
Hamilton 80% 2050 2005 2012
Guelph 28% 2031 2011 2012
Markham Net zero emissions 2050 2011
York Region 6% 2021 2014 2016
York Region 17% 2031 2014 2016
York Region 44% 2041 2014 2016
York Region 72% 2051 2014 2016
St. Catharines 30% 2030 2011 2014
Durham Region 80% 2050 1990 2012
London 10% 2020 2014 2014
Oakville 20% 2030 2014 2014
Oakville 80% 2050 2014 2014
Kingston 15% 2020 2011 2014
Kingston 30% 2030 2011 2014
Kingston 50% 2041 2011 2014
Vaughan 22% 2031 2013 2016
Ottawa 80% 2050 2012 2016
Greater Sudbury 80% 2050 1990 2016
Windsor 40% 2041 2014 2017
Region Target by Relative to Set in
Canada 40% 2030 2005 2017
Canada 80% 2050 2005 2017
Ontario 17% 2020 2005 2009
Ontario 30% 2030 2005 2018
Ontario 80% 2050 2005 2017
Rising energy prices and possible supply constraints
The costs of energy are a significant burden on municipalities. In 2018,
Brantford spent approximately $10,000,000 on energy, most of which
was on electricity. The Ontario electricity system faces a number of
factors that are likely to drive up costs, including nuclear refurbishment
(a cost in and of itself), and the cost of meeting demand while that
refurbishment is occurring with other sources of electricity, the recent
2 INDECO STRATEGIC CONSULTING INC.cancellation by the provincial government of some energy efficiency
programs, which were a highly cost effective means of matching supply
and demand, and possible capacity constraints that may occur as early
as 2023. With the political pressure to limit electricity rates, the
provincial government may transfer some of these cost drivers to the
tax base, tempering increases in electricity prices. (Province of Ontario,
2019)
The Independent Electricity System Operator is responsible for long-
term planning for the electricity system, and has indicated a potential
supply constraint beginning in 2023 under its reference demand
outlook and planning reserve assessment. (Independent Electricity
System Operator (IESO), 2018) That assessment in turn depends on a
growing contribution from energy efficiency programs. As mentioned,
some of those programs have been cancelled, and the committed
framework for programs only runs through 2020.
Prices for natural gas, diesel and gasoline are driven by the
international price of oil, which has been in a slump in recent years.
Since December, gasoline prices in Ontario have risen by 21%, and
energy overall by 12%. (Statistics Canada, 2019) The federal
government has also announced that carbon prices will rise each year
through 2022 by 10 $/t of carbon dioxide equivalent. (Environment and
Climate Change Canada, 2017) This will add an additional cost to
Brantford’s energy bill in 2022 of approximately $500,000 over what it
was in 2018.
Availability of incentives
A factor affecting municipal corporate energy planning is the
availability of financial incentives from utilities and other levels of
government. Incentives are offered by Ontario gas and electric utilities
and the federal government. It is unclear whether incentives available
today will be available over the longer term. Electricity incentives were
recently reduced. The Ontario 2018 climate change plan has a
significant dependence on natural gas conservation through 2030, but
there are no details on how this will be achieved or the role of
incentives. (Ministry of the Environment, Conservation and Parks, 2018)
Incentives are available from the federal government and through the
Federation of Canadian Municipalities. Today’s federal government
expects that increasing funds for greenhouse gas reducing projects will
be available for municipalities and others to apply for as the carbon
charges increase through 2022.
PLANNING HORIZON AND SCOPE
The CEMP for the City of Brantford is a 5-year plan covering the period
from July 2019 to June 2024.
BRANTFORD CORPORATE ENERGY MANAGEMENT PLAN 2019-2024 3The CEMP provides a roadmap for energy management at all City
facilities.1 As can be seen in Figure 1, it addresses the use of electricity
and natural gas in City facilities, streetlights and traffic lights, and fuel
for fleets. Biogas from the wastewater treatment plant and landfill gas
are also considered, though they were not addressed in the 2014 plan.
Planning 5 years
horizon (2019-2024)
Electricity,
natural gas,
Scope biogas and fleet
vehicle fuel
Figure 1 Planning horizon and scope
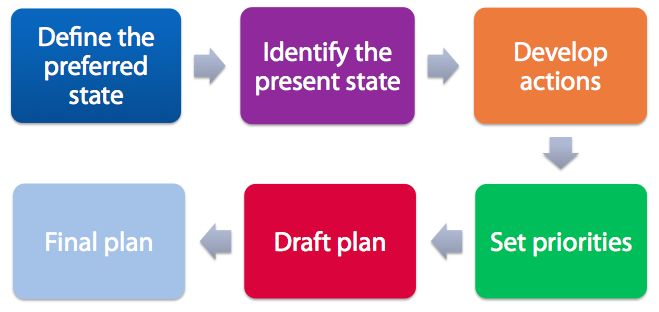
PLANNING PROCESS
Figure 2 depicts the major steps in the planning process that were used
to develop the City’s Corporate energy management plan. Inputs to the
planning process included:
• Review of 2014 through 2018 energy and GHG data for all City
facilities, excluding housing and long term care facilities,
• Review of the City’s existing policies, plans, and past energy
efficiency projects,
• Benchmarking of City facilities against comparable facilities,
• Interviews with City staff (including department directors and
managers),
• Two strategic planning sessions with key City staff, and
• Consultation with the Environmental Policy Advisory
Committee.
1
Excluding the City of Brantford’s Housing portfolio.
4 INDECO STRATEGIC CONSULTING INC.Figure 2 Overview of the planning process
Defining the preferred state involved exploring where the City of
Brantford would like to be with respect to energy management. The
elements of the preferred state were identified through interviews with
staff, a review of jurisdictional best practices, and during the strategic
planning sessions. The preferred state informed the CEMP’s objectives,
targets, and actions.
Identifying the present state involved exploring where the City is now
with respect to energy management. Energy data analysis; interviews; a
review of the City’s existing policies, plans, and past energy efficiency
projects; and benchmarking were among the inputs that were used to
identify the present state. While buildings were audited for the 2014
CEMP, there were no buildings audited for the 2019 CEMP.
Developing actions involved identifying organizational measures (i.e.
measures related to corporate processes) and technical measures. The
organizational measures enable the technical measures. Actions were
identified through interviews, the strategic planning sessions, and the
jurisdictional review of best practices. They were grouped according to
the following categories:
• Governance and accountability,
• Partnerships and collaboration,
• Communications and training,
• Funding and procurement,
• Monitoring and tracking,
• Advanced technologies and energy efficiency standards.
Setting priorities involved determining the timeframe for
implementation of each action in the CEMP. Organizational and
technical measures were prioritized based on their importance and
ease of implementation.
BRANTFORD CORPORATE ENERGY MANAGEMENT PLAN 2019-2024 5Preparing the Draft and Final Plan involved documenting the results of
the planning process. The CEMP will be reviewed annually and
updated at the end of the five years.
FRAMEWORK FOR PLANNING
The City’s CEMP addresses buildings, fleets, and technologies,
including street and traffic lights, and renewable energy – as well as
people, processes, and information. As illustrated in Figure 3, the CEMP
centers on the City’s facilities, fleets, and technologies. It aims to ensure
that existing and any new facilities are built and operated as efficiently
and sustainably as possible. The City’s supporting organizational
policies and processes, monitoring and tracking systems, training
initiatives and communication and engagement tools allow this to
happen.
Policies and
processes
Energy
Communi- efficient Monitoring
cation and facilities, and
engagement tracking
fleets and
technologies
Training
initiatives
Figure 3 Framework for planning
6 INDECO STRATEGIC CONSULTING INC.PROGRESS SINCE THE PREVIOUS PLAN
The 2014 plan set out targets for energy efficiency reductions by 2019
in energy use per square foot for buildings and greenhouse gas
reductions for facilities, including buildings and water and wastewater
facilities. These targets, and progress to the end of 2018 are as follows:
Target Realized by 2018
With WGSC without WGSC
Energy
intensity 4.9% -3.6% 10.9%
(ekWh/ft2)
GHG
emissions 5.3% 10.2% 22.6%
(kg CO2e)
The chart shows progress with and without the Wayne Gretzky Sports
Centre (WGSC) which came on-stream in 2014. The plan was based on
data from 2011 and 2012, before the expanded WGSC had opened.
As of the end of 2018, an additional breakdown of the progress towards
these targets is set out in Table 5.
Greenhouse gas emissions are what is known as Scope 2 emissions,
that is they include both direct emissions from combustion of natural
gas and liquid fuels, and indirect emissions associated with upstream
electricity production. Although electricity use went down by 2.6%
between 2014 and 2018 the upstream greenhouse gas emissions
dropped by 57% due to changes in the mix of fuels used by the Ontario
electricity system.2
2
For the purpose of this document, the average greenhouse gas intensity in each year has been used. There is a
significant difference between the average and marginal intensity. The emissions associated with electricity use
at off-peak times (e.g. for streetlights which are on at night) will be lower than estimated here, while emissions
from electricity used during other times may be considerably higher than estimated here. Consistent with
Ministry of Energy, Northern Development and Mines, generation intensity is used in the calculations.
BRANTFORD CORPORATE ENERGY MANAGEMENT PLAN 2019-2024 7Table 5 Progress against targets, components of targets and areas not covered by the targets
Actual
Target reduction *
reduction 2014 2018
for 2019
2018
Energy use in buildings (ekWh/ft2) 4.9% -3.6% 31.0 32.2
Facility greenhouse gas emissions (t CO2eq) 5.3% 10.2% 6,038 5,423
Greenhouse gas emissions (t CO2eq) buildings 3.3% 4,398 4,255
Greenhouse gas emissions (t CO2eq) W&WW 28.8% 1,640 1,168
Greenhouse gas emissions (t CO2eq) fleets -10.6% 4,511 4,990
Greenhouse gas emissions (t CO2eq) streetlighting 57.3% 308 131
Greenhouse gas emissions (t CO2eq) overall 2.9% 10,856 10,544
Details
Buildings (ekWh/ft2) -3.6% 31.0 32.2
Total ekWh -3.6% 38,095,524 39,473,540
Floor area (ft2) 1,227,190 1,227,190
Buildings excluding WGSC (ekWh/ft2) 10.9% 26.6 23.7
Total ekWh 10.9% 24,101,031 21,481,393
Floor area (ft2) 907,190 907,190
Greenhouse gas emissions (t CO2eq) 19.1% 2,933 2,372
Wayne Gretzky Sports Centre (kWh/ft2) -28.6% 43.73 56.23
Total ekWh -28.6% 13,994,493 17,992,147
Floor area (ft2) 0.0% 320,000 320,000
Greenhouse gas emissions (t CO2eq) -28.5% 1,466 1,884
Water treatment & pumping (ekWh/ML) 5.8% 1,051 990
Total ekWh 6.2% 12,677,457 11,885,779
Total flow (ML) 0.5% 12,064 12,007
Floor area (ft2) 90,100 90,100
Greenhouse gas emissions (t CO2eq) 25.0% 821 615
Wastewater treatment & pumping (ekWh/ML) 0.6% 901 896
Total ekWh 1.7% 11,573,675 11,376,185
Total flow (ML) 1.1% 12,843 12,696
Floor area (ft2) 60,900 60,900
Greenhouse gas emissions (t CO2eq) 32.5% 819 552
Fleets (L/100 km) -2.8% 45.1 46.4
Total litres -10.6% 1,684,621 1,862,548
Total distance (km) -7.5% 3,733,698 4,015,176
Streetlighting (kWh)** 1.3% 7,688,146 7,591,073
* 2015 for fleet data
** use in 2018 includes additional fixtures due to municipal boundary adjustments, without those additions use would be -2.36%
Note: negative numbers indicate that energy use or emissions increased
8 INDECO STRATEGIC CONSULTING INC.TRENDS IN ENERGY USE
Although the overall quantity of energy purchased has increased
slightly since the last plan was adopted, the change varies from year to
year and energy type to energy type.3 The trends of overall energy
purchases are shown in Figure 4, along with heating degree days, an
indicator of heating demand.
3
In addition to energy purchased, energy is generated from landfill gas and sold to the grid, and from the
wastewater treatment facility, used to generate heat. This is discussed later in the plan.
BRANTFORD CORPORATE ENERGY MANAGEMENT PLAN 2019-2024 9114 4,243 4,300
3,828 3,843
3,800
3,557
94
3,454
89.5
87.4 87.0
86.4 3,300
84.4
19.2
17.4 18.0
17.4
17.2
74 2,800
2,300
25.7 23.8 24.4 27.0
23.0
54
1,800
34 1,300
44.3 45.3 44.2 44.5 43.3 800
14
300
2014 2015 2016 2017 2018
-6 (200)
Electricity (eGWh) Natural gas (eGWh) Transportation fuels (eGWh) Heating Degree Days
Figure 4 Trends in energy use in Brantford, 2014-2018
Figure 4 demonstrates that weather is not the major determinant of the
increase in natural gas use in recent years: gas use rose in 2018 to
levels higher than were used in 2014 which was a colder year. The
differences are primarily attributable to the increased gas use at the
Wayne Gretzky Sports Centre. When total energy use for facilities other
than the Wayne Gretzky Sports Centre, overall use is considerable
lower, and natural gas use tracks heating degree days closely, as
indicated in Figure 5.
10 INDECO STRATEGIC CONSULTING INC.114 4,300
4,243
3,828 3,843
3,800
3,557
94
3,454
3,300
73.4
74 2,800
71.1 71.5
69.1
67.8
17.4
17.4 19.2 2,300
17.2 18.0
54
1,800
19.1
17.0
14.8 14.9 17.2
34 1,300
800
36.9 36.7 35.8 36.2 35.1
14
300
2014 2015 2016 2017 2018
-6 (200)
Electricity (eGWh) Natural gas (eGWh) Transportation fuels (eGWh) Heating Degree Days
Figure 5 Trends in energy use in Brantford excluding the Wayne Gretzky Sports Centre, 2014-2018
Energy is used by facilities, including buildings, water and wastewater
operations; streetlights; and by fleets. The split across types of uses is
shown in Figure 6. Facilities account for 71% of total energy use.
Administrative
offices, 7%
Streetlighting, 8% Fleets, 21%
Wastewater
treatment &
pumping, 13%
Wayne Gretzky
Sports Centre, 20%
Water treatment &
pumping, 13%
Other facilities,
17%
Figure 6 The distribution of energy use in Brantford in 2018
BRANTFORD CORPORATE ENERGY MANAGEMENT PLAN 2019-2024 11Within facilities, ten facilities account for 80% of the facility energy
use. The highest energy using facilities are shown in Figure 7.
Wayne Gretzky Centre 18.0
Waste Water Treatment Plant 10.3
Water Treatment Plant 9.1
Civic Centre 2.6
Transit Garage 2.5
Police HQ 2.3
City Hall 1.5
Public Works Yard 1.4
Water Pumping Station & Reservoir A 1.3
Lions Park 1.0
Figure 7 The ten highest energy using facilities in 2018 (GWh)
The expanded Wayne Gretzky Sports Centre, which opened in 2014,
accounts for 20% of total energy use, 30% of facility energy use and
36% of natural gas use in facilities.
Detailed trend information by facility from 2011 to 2018 is appended.
The other major use of energy is for fleets, and most energy used by
fleets is for transit. A breakdown of fleet energy use is in Table 6.
Table 6 Trends in fuel use by fleets 2015-2018 (Litres)
Service 2015 2016 2017 2018
Brantford Transit 1,006,534 1,005,440 1,072,043 1,135,693
Brantford Lift 128,764 125,440 120,865 131,152
Operational Services 303,890 281,636 285,179 315,388
Parks & Recreation 121,152 127,517 130,205 142,619
Environmental Services 97,747 78,264 91,476 93,122
Remainder of fleet 26,534 50,331 49,024 44,574
Total 1,684,621 1,668,628 1,748,792 1,862,548
12 INDECO STRATEGIC CONSULTING INC.TRENDS IN GREENHOUSE GAS EMISSIONS
The greenhouse gas emission trends are shown in Figure 8. Although
there was a slight decrease in total emissions in 2018 relative to 2014,
that drop was smaller than the drop in electricity related emissions
caused primarily by the changing composition of the energy mix used
to generate electricity; the greenhouse gas intensity measured in grams
of carbon dioxide equivalent per kilowatt-hour fell from 35.5 to 17.3
from 2016 to 2017. (Environment and Climate Change Canada, 2019b)
10,856
10,544
10,324
10,121
9,803
4,511
4,511 4,464 4,990
4,684
4,572
4,227 4,086
4,805
4,349
1,774 1,587 1,571
770 749
2014 2015 2016 2017 2018
Electricity (t CO2e) Natural gas (t CO2e) Transportation fuels (t CO2e)
Figure 8 Trends in greenhouse gas emissions, 2014-20184
Emissions associated with natural gas use rose by 233 tonnes of carbon
dioxide equivalent (t CO2eq) between 2014 and 2018.5 As noted on
Table 5, although greenhouse gases increased by 3.3% overall, they fell
by almost 5% at facilities other than the Wayne Gretzky Centre, where
emissions associated with natural gas use rose by 573 t, in part due to
the expanded facility becoming fully operational and in part due to
longer service periods.
The distribution of greenhouse gas emissions is shown in Figure 9.
Given that Ontario’s electricity is relatively clean since the phase out of
coal-fired generation in 2014, it is not surprising that greenhouse gas
emissions are primarily associated with those services that rely on fossil
fuels: fleets, and natural gas use in buildings.
4
Fuel use by fleets in 2014 is not available. The 2015 consumption is assumed for 2014.
5
There are multiple gases that contribute to climate change, and their contribution varies depending on the
timeframe being considered. Climate scientists use ‘carbon dioxide equivalents’ for greenhouse gases other
than carbon dioxide to indicate an impact over a specified time horizon of an equivalent amount of carbon
dioxide. For example, methane (CH4) has a global warming potential (GWP) over 100 years of 25, indicating
that 1 g of methane has the same impact on global warming over 100 years as 25 grams of carbon dioxide.
BRANTFORD CORPORATE ENERGY MANAGEMENT PLAN 2019-2024 13Administrative Streetlighting, 1%
Wastewater offices, 7%
treatment &
pumping, 5%
Water treatment &
pumping, 6%
Fleets, 47%
Other facilities,
16%
Wayne Gretzky
Sports Centre, 18%
Figure 9 The distribution of greenhouse gas emissions associated with energy use (2018) 6
ENERGY MANAGEMENT INITIATIVES THAT HAVE BEEN IMPLEMENTED
Although Brantford’s targets were not met, energy use and emissions
would have been even higher were it not for numerous projects
undertaken that reduced energy use. Projects to reduce electricity use
in buildings are shown in Table 7. Other projects focused on reducing
natural gas use. For example, a dehumidification project for the pool at
Wayne Gretzky Centre reduced natural gas use by an estimated
115,637 m3.
Table 7 Projects undertaken to reduce electricity use
Number of Annual energy
Project type
projects savings (kWh)
Lighting projects in 12 municipal buildings 13 959,124
Pool dehumidification 1 5,720
Street lights 2 184,674
Total 16 1,149,518
Other projects undertaken have included adding two electric vehicles
to the fleet, LED streetlights installed for all new developments and
road construction projects, and an ongoing program to convert
streetlights to LEDs, while upgrading the lighting distribution and lumen
output to modern standards.
6
The reader is reminded that these calculations are based on the average greenhouse gas intensity of electricity
over the year. Some uses will be lower than indicated (e.g. streetlights), others will be higher.
14 INDECO STRATEGIC CONSULTING INC.Preferred state of energy management
PREFERRED STATE
Brantford has a long-term vision for energy supply and demand in the
City, and how that is to be attained. Key elements of the vision are set
out in the highlighted box below.
City of Brantford preferred state for energy and greenhouse gas emissions
Governance and accountability
Brantford has long-term and short-term targets for energy savings, greenhouse gas reductions, and
renewable energy with an ultimate goal of zero greenhouse gas emissions and 100% renewable energy.
Brantford has clear delineation of responsibilities for energy management and target attainment.
Brantford promotes a culture of conservation through the City.
Partnerships and accountability
Brantford develops partnerships across City departments and with outside organizations to share
experiences and best practices, and to leverage influence with other levels of government and the
broader community.
Communications and training
Brantford ensures that information about energy use in the City is available throughout the organization
in an understandable and useful format.
Brantford ensures that staff are trained to use energy efficiently and reduce greenhouse gas emissions
while providing excellent service to the community in their job functions.
Funding and procurement
Brantford ensures that its funding and procurement decisions take into account getting the best overall
value for the City, thus taking into account capital and operating costs, and accounting for externalities,
such as carbon emissions.
Monitoring and tracking
Brantford ensures that data on energy use and greenhouse gas emissions are collected, analyzed and
made available to those needing the information, and that the impacts of initiatives are evaluated to
build on successes.
Advanced technologies and efficiency standards
Brantford evaluates and pilots advanced technologies and standards to ensure continual improvement
in its energy performance.
Brantford procures and uses buildings, vehicles and equipment that are energy efficient and cost-
effective.
The 2019-2024 plan is concerned with moving towards this preferred
state.
BRANTFORD CORPORATE ENERGY MANAGEMENT PLAN 2019-2024 15TARGETS
To move towards the preferred state, targets have been set for the plan
period, and those are outlined on Table 8.
Table 8 Energy saving targets 2019-2024 (%)
Current
Source 2019-2020 2021-2022 2023-2024 Total
(GWh)
Buildings - electricity 17.2 1.0% 4.0% 4.0% 9.0%
Buildings - gas 19.6 1.0% 4.0% 4.0% 9.0%
Water - electricity 9.3 2.0% 6.0% 4.0% 12.0%
Water - gas 4.8 1.0% 4.0% 4.0% 9.0%
Wastewater - electricity 9.2 2.0% 10.0% 20.0% 32.0%
Wastewater - gas 2.6 1.0% 4.0% 4.0% 9.0%
Fleet transit (ML) 1.14 0.0% 0.0% 0.0% 0.0%
Fleet non-transit (ML) 0.7 1.0% 4.0% 4.0% 9.0%
Streetlights 7.59 5.0% 15.0% 15.0% 35.0%
Overall electricity 43.29 2.1% 7.6% 9.3% 19.1%
Overall natural gas 27 1.0% 4.0% 4.0% 9.0%
Overall diesel and gasoline 19.20 0.3% 1.2% 2.4% 4.0%
The targets are relative to the current (2018) use. In the case of
electricity use for water, wastewater and streetlights, more aggressive
savings are proposed based on planned projects. The 2024 electricity
target assumes that contractual issues around the RESOP contract for
the landfill cogeneration facility can be resolved, and landfill gas can
be used to generate electricity for use by the wastewater treatment
plant. That would also mean that annual renewable generation would
increase by approximately 2.75 GWh.
Although the targets are expressed in percentage reductions of energy
use, for information, Table 9 provides the target reductions in energy
units, mass of greenhouse gases and energy intensity.
Table 9 Targets in energy units, and greenhouse gas and energy intensity reductions
2019-2020 2021-2022 2023-2024 Total
Energy reductions (eGWh) 1.4% 5.2% 6.2% 12.8%
Overall electricity 0.9 3.3 4.0 8.3
Overall natural gas 0.3 1.1 1.1 2.4
Overall diesel and gasoline 0.1 0.2 0.5 0.8
Total 1.3 4.6 5.6 11.5
Greenhouse gas reductions (t CO2e) 0.7% 2.9% 3.6% 7.3%
Overall electricity 15.9 57.2 69.9 143.0
Overall natural gas 48.3 193.0 193.0 434.3
Overall diesel and gasoline 14.6 58.6 117.2 190.4
Total 78.8 308.8 380.1 767.7
Building energy intensity reduction (ekWh/ft2)
Buildings - electricity (GWh) 0.172 0.688 0.688 1.548
Buildings - gas (GWh) 0.196 0.784 0.784 1.764
Buildings total (GWh) 0.368 1.472 1.472 3.312
Floor area (ft2) 1,378,190 1,378,190 1,378,190 1,378,190
Energy use intensity (ekWh/ft2) 0.3 1.1 1.1 2.4
Note: GHG emissions based on 2017 CO2e/kWh values (generation)
16 INDECO STRATEGIC CONSULTING INC.Getting to the preferred state of energy management
A suite of actions is required to move towards the preferred state in the
next five years. The actions are grouped into the same six categories
used in the Preferred State:
• Governance and Accountability – measures related to policies,
targets, and resources required to enable energy management
and other actions;
• Partnerships and Collaboration – measures related to
networking, relationship-building, information sharing, and
best practices;
• Communication and Training - measures related to
encouraging behavioural modifications to save energy;
• Funding and Procurement - measures related to identification,
prioritization, funding, and procurement of energy and
renewable technologies;
• Monitoring and Tracking – measures related to collecting,
monitoring, evaluating, and sharing energy data;
• Advanced Technologies and Energy Efficiency Standards –
measures, both technical and policy based, that impact new
and existing buildings, fleets, streetlights and traffic signals;
These actions are categorized into three time periods for
implementation:
1. Priority Actions – Year 1 (July 2019 – June 2020)
2. Medium-Term Actions – Years 2 and 3 (July 2020 – June 2022)
3. Longer-Term Actions – Years 4 and 5 (July 2022 – June 2024).
Many of the priority actions are foundational and put in place the
structures and practices that will facilitate on-going energy efficiency
within the City.
BRANTFORD CORPORATE ENERGY MANAGEMENT PLAN 2019-2024 17ACTIONS RELATED TO GOVERNANCE
Actions related to governance over the three time periods are presented
in Table 10, Table 11, and Table 12. The actions are numbered for
convenience in referencing them. Numbering is not indicative of
priority or importance.
Table 10 Governance and accountability actions (2019-2020)
1. Formally reaffirm a commitment to sustainability including energy management
and greenhouse gas (GHG) reduction targets as a strategic priority for the long-
term benefit of the City. This would include adopting a science-based target for
greenhouse gas emission reductions.
2. Designate oversight of the Energy Management Program as a Corporate Initiative
to be administered by the Climate Change Officer in the Office of the CAO.
3. Assign the Climate Change Officer responsibility for championing the CEMP,
tracking energy initiatives, and implementing the behaviour change programs to
staff with input from other stakeholders.
4. Reinstate a Corporate Steering Committee with staff representatives from each
department to formalize an energy strategy across all City departments and
identify roles and responsibilities.
5. Establish an energy working group to focus on the Wayne Gretzky Sports Centre
6. Formally adopt interim and 5-year targets for energy intensity and GHG Reduction
Targets.
7. Review and establish science-based, long-term, measurable carbon reduction
targets in addition to the specific five-year targets.7
8. Review and establish a measurable target for renewable generation in consultation
with Brantford Power.
7
Targets to reduce greenhouse gas (GHG) emissions are considered “science-based” if they are in line with
what the latest climate science says is necessary to meet the goals of the Paris Agreement – to limit global
warming to well-below 2°C above pre-industrial levels and pursue efforts to limit warming to 1.5°C. There is a
specific program for companies to commit to science-based goals but at present it is not accepting
commitments from cities and local governments. Nevertheless, the Science Based Targets organization has
developed methodologies that are relevant to municipalities. ( http://sciencebasedtargets.org )
18 INDECO STRATEGIC CONSULTING INC.Table 11 Governance and accountability actions (2020-2022)
9. Develop a framework for including energy management and sustainability in
relevant corporate plans and policies, including the Strategic Asset Management
Policy, through the Manager of Corporate Initiatives.
10. Identify roles and develop a framework for energy management accountability
within each Commission and Department that will review energy usage and
expenditures.
11. Establish full-time permanent Climate Change Officer and Energy Manager/Energy
Technician roles responsible for implementing the policy and technical actions of
the CEMP respectively on a go forward basis.
12. Track and assess progress on interim targets and years 1-2 actions. Report
annually on the progress and key milestones achieved towards meeting the
established energy targets to City Council and the Environmental Planning
Advisory Committee. Update targets, if required, to reflect progress.
13. Ensure compliance with the Electricity Act reporting requirements and report the
results of the Broader Public Sector (BPS) Annual Energy Interim Report to the
Ministry of Energy, Northern Development and Mines (MOENDM).
Table 12 Governance and accountability actions (2022-2024)
14. Incorporate energy management and sustainability in relevant corporate plans and
policies, including the Strategic Asset Management Plan, through the Manager of
Continuous Improvement.
15. Implement Energy Management Accountability within each Commission and
Department e.g. review of total energy usage/spend
16. Review staffing and resource requirements to effectively implement the CEMP.
17. Track and assess progress on interim targets and years 3-4 actions. Report
annually the progress and key milestones achieved towards meeting the
established energy targets to City Council and the Environmental Planning
Advisory Committee. Update targets, if required, to reflect progress.
18. Ensure compliance with the Electricity Act reporting requirements and report the
2024-2029 CEMP Update and results of the Broader Public Sector (BPS) Annual
Energy Report to the Ministry of Energy, Northern Development and Mines
(MOENDM).
BRANTFORD CORPORATE ENERGY MANAGEMENT PLAN 2019-2024 19ACTIONS RELATED TO PARTNERSHIPS AND COLLABORATIONS
Actions related to partnership and collaborations over the three time periods are presented
in Table 13, Table 14, and Table 15.
Table 13 Actions related to partnerships and collaborations (2019-2020)
19. Meet bi-annually with EPAC to provide an update on status and seek guidance
and alignment of strategies and initiatives.
20. Continue to meet bi-annually with Brantford Power, IESO and Union Gas to
discuss opportunities to work together on energy efficiency initiatives, including
accessing available incentives.
21. Continue to participate in the municipal Corporate Energy Managers Community
of Practice (CEM COP) facilitated by the Clean Air Partnership.
22. Research relevant industry sector working groups for departmental managers and
staff participation.
23. Develop a process for tracking and reporting Partnership and Collaboration
activities.
Table 14 Actions related to partnerships and collaborations (2020-2022)
24. Connect with relevant local sustainability personnel in other community
organizations, e.g. Wilfrid Laurier University Brantford Campus (WLU), Grand Erie
District School Board (GEDSB), Brant Haldimand Norfolk Catholic District School
Board (BHNCDSB), Brantford General Hospital (BGH).
25. Introduce departmental managers and staff to the IESO and Union Gas
representatives to discuss opportunities to work together on energy efficiency
initiatives, including accessing available incentives.
26. Seek collaboration opportunities with Energy Managers from other municipalities
to share information, best practices, and tour facilities.
27. Identify relevant industry sector working groups to departmental managers and
staff for participation.
28. Implement a process for tracking Partnership and Collaboration activities.
20 INDECO STRATEGIC CONSULTING INC.Table 15 Actions related to partnerships and collaboration (2022-2024)
29. Develop a communication and outreach plan for communicating about energy
use and reporting to the community e.g. soliciting ideas through crowdsourcing,
enhanced website
30. Coordinate regular site visits and meetings for departmental managers and staff
with other municipalities and local sustainability personnel (WLU, GEDSB,
BHNCDSB, BGH) to share information and tour facilities.
31. Follow up with departmental managers and staff on participation in relevant
working groups and encourage information sharing.
32. Collaborate with local sustainability personnel (WLU, GEDSB, BHNCDSB, BGH)
on events, activities, group trainings to generate greater exposure for City and
influence in the energy management community.
33. Assess whether partnerships and collaboration are producing tangible benefits to
energy management in the City.
BRANTFORD CORPORATE ENERGY MANAGEMENT PLAN 2019-2024 21ACTIONS RELATED TO COMMUNICATIONS AND TRAINING
Actions related to communications and training over the three time
periods are presented in Table 16, Table 17, and Table 18. Effective
communication is essential both to ensure commitments are being kept,
and efficient operations. Training contributes to ensure that operations
are efficient.
Table 16 Actions related to communications and training (2019-2020)
34. Communicate the updated CEMP and annual reporting results to all City staff with
the assistance of the Corporate Communications Department.
35. Develop a communication plan with the Corporate Communications Department
for communicating the City’s energy reduction programs and initiatives to staff.
36. Develop a general training module on energy and energy efficiency awareness
with the Human Resources Department to be included in the online orientation
training process for all new hires.
37. Develop an operator level energy contact in each division.
38. Ensure building/energy staff are well trained through access to conferences, trade
shows, and opportunities for information sharing and education on best practices,
including the requirement for staff to provide a summary of the takeaways and
how they apply to the City, along with potential recommendations for action.
Table 17 Actions related to communications and training (2020-2022)
39. Communicate the updated annual reporting results to all City staff with the
assistance of the Corporate Communications Department.
40. Formalize and implement a communication plan with the Corporate
Communications Department for communicating the City’s energy reduction
programs and initiatives to staff.
41. Formalize general training on energy and energy efficiency awareness with the
Human Resources Department to be included in the training process for all new
hires.
42. Conduct an assessment of the needs of new and existing staff who operate and
maintain specific buildings with a goal of having an operator identified in each
building who has primary responsibility for energy management (where required).
43. Develop an employee engagement process pilot for all staff who operate and
maintain facilities.
22 INDECO STRATEGIC CONSULTING INC.You can also read