Modelling Mass Crowd Using Discrete Event Simulation: A Case Study of Integrated Tawaf and Sayee Rituals During Hajj
←
→
Page content transcription
If your browser does not render page correctly, please read the page content below
Received April 21, 2021, accepted May 13, 2021, date of publication May 24, 2021, date of current version June 7, 2021.
Digital Object Identifier 10.1109/ACCESS.2021.3083265

Modelling Mass Crowd Using Discrete Event
Simulation: A Case Study of Integrated Tawaf
and Sayee Rituals During Hajj
ALMOAID A. OWAIDAH 1 , DOINA OLARU 2 ,
MOHAMMED BENNAMOUN 1 , (Senior Member, IEEE),
FERDOUS SOHEL 1,3 , (Senior Member, IEEE), AND R. NAZIM KHAN                                                       4
1 Department  of Computer Science and Software Engineering, The University of Western Australia, Perth, WA 6009, Australia
2 Business School, The University of Western Australia, Perth, WA 6009, Australia
3 Discipline of Information Technology, Murdoch University, Murdoch, WA 6150, Australia
4 Department of Mathematics and Statistics, The University of Western Australia, Perth, WA 6009, Australia

Corresponding author: Almoaid A. Owaidah (almoaid.owaidah@research.uwa.edu.au)
The work of Almoaid A. Owaidah was supported by the Saudi Arabian Cultural Mission (SACM) in Canberra, Australia (the educational
representative of the Royal Embassy of the Kingdom of Saudi Arabia).

  ABSTRACT Hajj is a mass gathering event that takes place annually in Makkah, Saudi Arabia. Typically,
  around three million people participate in the event and perform rituals that involve their movements within
  strict space and time restrictions. Despite efforts by the Hajj organisers, such massive crowd gathering and
  movement cause overcrowding related problems at the Hajj sites. Several previous simulation studies on Hajj
  focused on the rituals individually. Tawaf, followed by Sayee, are two important rituals that are performed by
  all the pilgrims at the same venue on the same day. These events have a strong potential for crowd buildup
  and related problems. As opposed the previous works in the literature, in this paper we study these two
  events jointly, rather than separately. We use ExtendSim, a Discrete Event Simulation tool, to integrate the
  Tawaf and Sayee rituals into one model. The validated model was applied to a wide range of scenarios where
  different percentages of pilgrims were allocated to the various Tawaf and Sayee areas. The effect of such
  allocations on the time to complete Tawaf and Sayee indicate strategies for managing these two key Hajj
  rituals.

  INDEX TERMS Hajj, Tawaf, Sayee, crowd management, crowd modelling, crowd simulation, evacuation
  modelling, evacuation simulation, ExtendSim.

I. INTRODUCTION                                                                                crashes, stampedes, traffic incidents, fires, leading to injuries
Mass Gathering (MG) events involve participation of more                                       and even fatalities [2].
than 1,000 people in one site at the same time [1] for a                                          Hajj, the pilgrimage to Makkah in Saudi Arabia, takes
specific purpose and for a finite duration [2]. MG events can                                  place at several holy sites every year between 8th and 12th of
be religious (e.g., Hajj); cultural (e.g., large music concerts);                              Dhulhijjah, the 12th month in the Islamic (lunar) calendar [4].
sporting (e.g., the Olympics and FIFA World Cups); or polit-                                   With a crowd of up to three million people comprised of
ical (e.g., processions and rallies or social riots) [3]. Because                              Muslims from all over the world, Hajj is the largest annual
of the large number of attendees, MGs pose many challenges                                     MG globally [5]–[9]. With an already large and ordinarily
such as crowd management, security and emergency readi-                                        increasing numbers of pilgrims each year, Hajj authorities
ness [2]. If these challenges are not well managed, MGs                                        will continue to face bigger challenges, primarily relating to
can result in adverse outcomes, including spread of diseases,                                  the safety and security of pilgrims [11]. Given the uniqueness
                                                                                               of the event, the complexity of the planning associated with
   The associate editor coordinating the review of this manuscript and                         Hajj, its impacts [12], and the anticipation that Hajj atten-
approving it for publication was Giambattista Gruosso             .                            dance will increase post-COVID19 pandemic, a rigorous and

                     This work is licensed under a Creative Commons Attribution 4.0 License. For more information, see https://creativecommons.org/licenses/by/4.0/
79424                                                                                                                                                                 VOLUME 9, 2021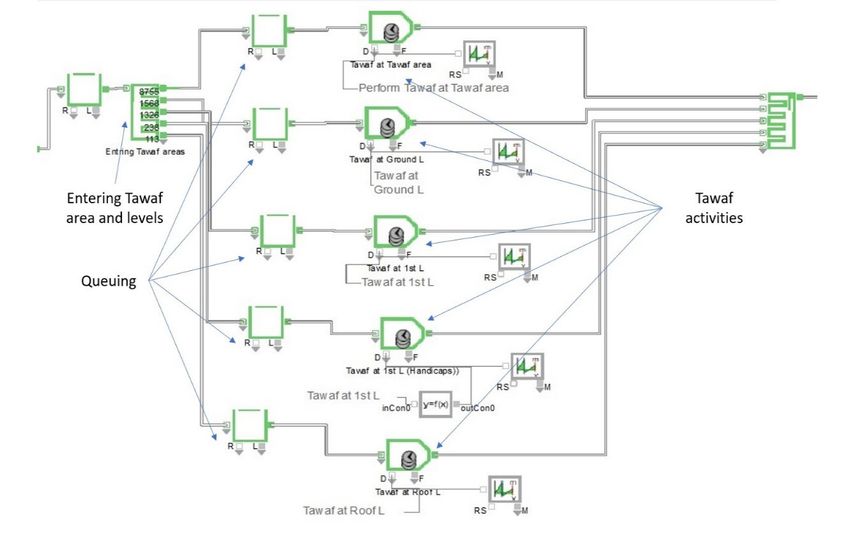
A. A. Owaidah et al.: Modelling Mass Crowd Using Discrete Event Simulation

integrated study of Hajj from a crowd management perspec-                    Sayee each accommodate only tens of thousands of persons
tive is timely and essential.                                                at any one time. This is only one of the indicators of these
   Hajj rituals are performed at several sites during the five               challenges, given that around three million pilgrims need to
days within specific time windows. It requires all pilgrims                  perform these two rituals on the same day in sequence [13].
to move from one site to another by bus, train, or on                        Osman and Shaout [6] mention additional reasons that make
foot [4], [10].                                                              Hajj crowd management a ‘tough task’: pilgrims come from
   Past studies of Hajj have focused on individual rituals.                  all over the world and have different backgrounds, languages
However, the rituals are closely linked, and involve mass                    and cultures, which is often reflected in their behaviours
movement of pilgrims from one site to another in a fixed and                 during Hajj.
short time period. Thus, congestions are not only at individual                 Pilgrim groups are managed by Hosting Agencies called
sites, but also between sites and rituals.                                   Mutawif or National Establishments. There are eight estab-
   This paper focuses on the two rituals performed in the                    lishments: Locals; Arabic Gulf; Iran; South East Asia (SEA);
Grand Mosque (GM) during Hajj, on the 3rd day of Hajj:                       Southern Asia (SA); Africa; Arabs; with the final estab-
Tawaf Al-ifadah (walking in a counter-clockwise direction                    lishment comprising Turkey, Europe, Australia and Amer-
seven times around the Ka’aba); and Sayee (pilgrims walk                     ica (TEAA) [14]. Each establishment has clearly assigned
and/or run seven times back and forth) between the two hills                 accommodation at the Hajj sites and scheduled times for
of Al-Safa and Al-Marwah, close to the Tawaf area [9].                       rituals [15]. Pilgrims are organised into groups (of usually
   The objective of our work is to simulate and validate the                 250 pilgrims) with a guide [16]. The guides are in charge
real Hajj data in various crowd conditions, assessing to what                of their groups throughout the whole Hajj, instructing them
extent capacity and behavioural aspects contribute to crowd-                 on the rules, providing the schedule of activities, leading
ing and congestion within the Grand Mosque area. Whereas                     the groups through movements (following dedicated routes
many scholars focused on a single ritual, this research com-                 and means of transport), and monitoring the progression of
bines two of the most demanding rituals during Hajj, com-                    rituals [17]. When performing the sequence of activities,
pleted within the confines of the GM and with the potential                  the whole group must slow or stop the progression of an
to affect each other.                                                        activity to accommodate the needs of the group members.
   We use a Discrete Event Simulation (DES) software as a                    Many pilgrims do perform the Hajj rituals independently of
tool to model and simulate the integrated Tawaf and Sayee                    their group, on their own and/or with their family and friends.
rituals at normal and evacuation situations. After validating                Nonetheless transport and accommodation of pilgrims are
the models, we developed scenarios to study and evaluate the                 organised by their Hajj groups.
effect of changes in pilgrim distributions at the GM. Given
the features of Hajj events (large mass size, geographical
setting, time restrictions and annual recurrence of the event),              B. CROWD MANAGEMENT
a comparison with other MG events may not be appropriate.                    Crowd management or systematic planning aimed at opti-
Yet, practical solutions we offer here could be applicable to                mally managing the movements and assembly of people [11]
other mass gathering events (e.g., music festivals, Olympics).               is an evolving field of interest for specialists in comput-
   The rest of this paper is structured as follows. Section II               ing, health and police enforcement. Alabdulkarim et al. [18]
presents a literature review on Hajj, crowd models and sim-                  described crowd management as: ‘‘. . . a practice that is used to
ulation. Section III details the data resources and methodol-                control crowd events before, during, and after events, which
ogy. Section IV describes the design and implementation of                   include dealing with all elements of an event such as people,
Tawaf and Sayee in ExtendSim. Section V describes how the                    sites, facilities, data and technology’’ (p.251).
simulation models for Tawaf and Sayee rituals were validated                    Hajj provides a unique case study of crowd manage-
and the development of various scenarios for these rituals. In               ment, as it involves the management of a very large num-
Section VI is we discuss the study results and the implica-                  ber of pilgrims gathered at the same time and place [15].
tions of the scenarios. The paper concludes with Section VII                 Inadequate crowd management can lead to high levels of
providing general insights from the modelling exercise, dis-                 crowd density and overcrowding, which in turn may have
cussing limitations and recommendations for future work.                     deleterious effects on participants’ safety [17]. As indi-
                                                                             cated, the outcomes range from minor (getting lost), to
                                                                             moderate (injuries, heat exposure) and major (crushing dis-
II. LITERATURE REVIEW                                                        asters, deaths) [4], [6], [9], [10], [18], [19]. These inci-
A. HAJJ CHARACTERISTICS                                                      dents are attributed to human bottlenecks, heavy crowds, and
Hajj consists of complex and intense activities (rituals) in                 unsuccessful crowd movement control [20], [21], [11], [18].
a prescribed sequence [4], [11]. The planning of pilgrim                     More details about previous Hajj incidents can be found in
movements and transport from one site to another during the                  Owaidah et al. [19]. In addition to overcrowding at Hajj sites,
event is an enormous task [11], [9]. Strictly marked territorial             problems with pilgrim movements and transport [22] could
boundaries of the specific Hajj sites limit the capacities of                lead to uncontainable buildup of crowds for the activities that
the sites. For instance, the areas for Tawaf (called Mataf) and              follow [4].

VOLUME 9, 2021                                                                                                                          79425
A. A. Owaidah et al.: Modelling Mass Crowd Using Discrete Event Simulation

C. CROWD MODELLING                                                  of pilgrim groups during Tawaf to reduce the average time for
Hajj requires substantial prior planning using various possible     completing this ritual.
scenarios [8], [23]. Such planning, achieved by using crowd            Abdelghany et al. [25] developed a hybrid simulation-
modelling and simulation, plays a vital role in anticipat-          assignment modelling framework, which integrates two lay-
ing and preventing crowd evacuation problems before they            ers. The first layer is a network layer, representing the study
occur [3], [24]. Modelling (including simulation) offers many       facility, enabling the pilgrims/entities to plan their routes,
benefits: developing prior arrangements; improving crowd            while performing their activities. The second layer is a cel-
and transport management; identifying crowded spots and             lular automata (CA) model, which describes each movement
traffic bottlenecks; and investigating transitions from normal      according to a sequence of cells occupied over time by an
to evacuation scenarios. In addition, using crowd modelling         entity until reaching the destination. Their study focused on
helps to investigate why, where, when, and how crowds               studying crowd dynamics in large-scale pedestrian facilities,
move and leave an event or venue. Crowd modelling assists           to identify congestion at the Mataf. The cell dimension was
modellers and practitioners to develop safe and robust prior        selected based on the LoS F (7–8 people/m2 ), which is
planning for crowd management [13].                                 usually recorded at Hajj during peak hours. They derived
   Modelling efforts in the literature have focused on four         pilgrim density and flow rates at different distances from the
types of dangers associated with crowds in extreme condi-           Ka’aba (e.g., 8 pilgrims/m2 around the Ka’aba and decreas-
tions: trampling and crushing at religious sites (e.g., Hajj        ing to 4 pilgrims/m2 to the surrounding edges/walls of the
event); trampling and crushing on ships at sea or water-            Tawaf. The model was validated and the results showed a
ways; crushing during massive concerts; and crowd trampling         low flow rate of about 50 pilgrims/m/s around Ka’aba, but
during natural disasters (earthquakes, floods, avalanches or        increased further away from it, resulting in a capacity of
landslides) [24]. However, crowd modelling and simulation           40,000 pilgrims/h for the Tawaf. Although this work offers
prior to an event can replicate scenarios of safety in risk-free,   a description of the Tawaf and Sayee areas, it only presents
low cost, time-independent and casualty-free experimental           results from the Tawaf area, and does not consider other
environments. For example, modellers can gain insights into         Tawaf levels or the Sayee.
the causes of overcrowding and compare performances of                 To understand crowd behaviour, Nasir and Sunar [26]
various design alternatives [3].                                    focused on studying the simulation of pilgrim groups in nor-
   The following section reviews previous studies on mod-           mal conditions, using a popular technique to simulate large
elling and simulating the rituals of Tawaf and Sayee.               groups, the Social Force Model (SFM), combined with a
                                                                    flocking technique. Their study also focuses on the Tawaf
                                                                    area, and their model was built on Microsoft Visual Studio
D. CROWD MODELLING AND SIMULATION                                   2013 and written using the C++ programming language.
FOR HAJJ EVENTS                                                     The model’s graphics were made using the Open Graphics
Owaidah et al. [19] presented a systematic review of                Library (OpenGL) and application programming interface
crowd modelling and simulation models, especially those             (API). The results of simulating 500 agents showed that
applied for Hajj. They concluded that simulation (DES,              group members successfully maintained their position and
Agent Based Models, ABM) combined with Support Vec-                 kept close to each other in the crowd. If one of them was
tor Machines (SVMs) or other models is the prevailing               behind, the whole group would reduce its speed and wait
approach. Crowd modelling and simulation for Hajj event             for the individual to catch-up with the rest of the group.
is one of the significant technologies that is used the             This micro-level study highlighted important details of crowd
planning processes of Hajj crowd management [9]. Here               movement in normal situation in the Tawaf area, but the num-
we briefly present some of the key literature relevant to           ber of entities modelled does not reflect the actual capacity
Tawaf and Sayee.                                                    (40,000 to 50,000 pilgrims/h). This study did not consider
   Haghighati and Hassan [13] investigated the effect of vari-      where and why the simulated pilgrims may change their
ous crowd problems during Tawaf, with the aim of improving          speed during Tawaf and how pilgrims can be managed at
the pilgrim movements around the Ka’bah and reducing the            high-density spots.
congestion inside the Grand Mosque. Their simulation was               Felemban et al. [27] built a crowd simulation model in
conducted using a DES model developed in ARENA, con-                MassMotion software to study the crowd’s movement pat-
sidering the pilgrims as discrete units entering the system,        terns around the Ka’aba, including entering and exiting from
moving through components, and then exiting the system.             the Tawaf area, stopping to kiss the Black Stone, and slow-
Pilgrims had specific attributes (e.g., gender, speed, and size)    ing down at the starting line of each circumambulation.
and were generated and ‘stored’ in queues. They then moved          Felemban et al. [27] analysed the crowd density around the
around the Ka’bah seven times in an anticlockwise route, and        Kaaba and calculated the required total time for completing
upon reaching the finishing line, left the Tawaf area for Sayee.    the Tawaf ritual in high density and less crowded situations.
The movement rule enabled each entity to walk in paths near         The micro-level simulation enabled recording individual data
to the Ka’bah whenever free space was available. The authors        on the time and location of entering the Tawaf area, the walk-
suggested using scheduling, spiral paths, and clear separation      ing distance and average speed of the Tawaf performance

79426                                                                                                                           VOLUME 9, 2021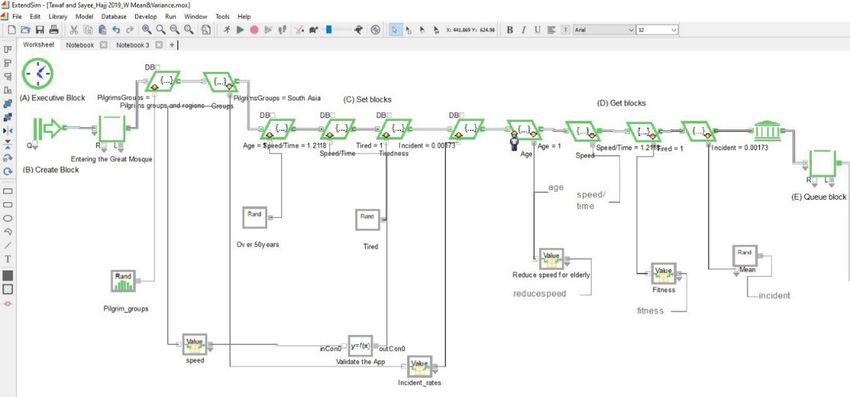
A. A. Owaidah et al.: Modelling Mass Crowd Using Discrete Event Simulation

and the number of circumambulations completed when the                       pilgrims/entities leads to frequent stops in the crowd (either
simulation is stopped. However, this study did not report any                slowly or suddenly), because of the interactions with the sur-
results of the simulations.                                                  rounding pilgrims (overcrowding). The model closely mim-
   Löhner et al. [28] presented two SFM models to under-                     icked the average walking speed during the Tawaf 0.35 m/s
stand pilgrim motions when the Tawaf area is congested.                      compared to 0.3267 m/s from collected data, for a number
The first model focused on modelling and simulating the                      of 45,000 pilgrims. However, the authors have not highlighted
pilgrims at their desired distance to the Ka’aba, while the                  the potential bottleneck areas in the Tawaf (where pilgrims
second model simulated pilgrims getting closer to the Ka’aba                 stopped).
where they reach the highest crowd density. The authors                         In conclusion, prior scholarly work considered congestion
used the ‘‘PEDFLOW’’ crowd dynamics simulation tool to                       in the Tawaf area (one of the most challenging aspects of
build these two models. The parameters included were the                     Hajj), focusing on aspects which can change the physical
geometry of the Grand Mosque, the entry/exit points to and                   design of the area. The simulations were at micro-level and
from the Tawaf area, as well as pilgrim characteristics, such                adopted techniques, such as CA or SFM, well-suited for
as their cultural background and fitness state. The model                    inter-agent interactions, although most of them presented
simulated 32,400 p/h. The simulation results from the first                  results on a relatively small scale compared to the real
model showed that the pilgrim density was low in the left                    event. Yet, if the aim is to identify planning and manage-
region of the Ka’aba, where pilgrims are far from the starting               ment/operation aspects that can be implemented in Hajj
line, yet the density of pilgrims increases close to the Ka’aba,             (e.g., scheduling the sequence of activities by groups), adopt-
as shown by the second model. The authors suggested a                        ing a macro-level approach (and using for example discrete
self-regulation process whereby ‘‘If the density increases too               event simulations) is needed.
much, the pilgrims move further away from the Ka’aba and
the simulation proceeds without problems while still being
realistic’’ (p.530). The study has not mentioned the fitness                 E. EVACUATION MODELLING AND SIMULATION
level of the pilgrims, their age or gender.                                  FOR HAJJ EVENTS
   Mohamed and Parvez [29] proposed a Finite State                           Crowd evacuation simulation is a part of evacuation man-
Machine (FSM) based model for modelling and simulating                       agement, an important field of study to develop evacuation
pilgrim movements during Tawaf. In particular, the authors                   plans [31]. These plans can be executed to avoid crowd
showed that crowding around the Black Stone ‘to touch and                    incidents at large places such as the GM and for huge events
kiss’ could result in aggressive behaviours of the pilgrims,                 (e.g., Hajj events) [31]. As pilgrim numbers increase every
with the elderly and women being excluded from this ritual.                  year, studying and modelling pilgrim movements is impor-
Their simulation investigated innovative ways to manage                      tant to improve Hajj crowd management and deliver safety
the crowd around the Black Stone by specifying times for                     during the event [32]. Although many pilgrims are informed
various groups, forming dedicated queues, and introducing                    and some are trained to perform the Hajj rituals, very few
physical barriers. The authors compared: the average time                    - if any - are trained to react to emergency or evacuation
of pilgrims to complete the Tawaf (with or without kissing                   situations [33].
the Black Stone and including queuing) and the average time                     Therefore, due to the complex structures of Hajj sites and
for pilgrims to ‘touch and kiss’ the Black Stone (including                  buildings, evacuation management deserves more attention
queuing); the average time to perform Tawaf and queuing                      by considering different evacuation scenarios at different Hajj
behind a barrier installed besides the wall of Ka’aba (the                   locations [32], [33]. In addition, although studies have sepa-
proposed system). They also highlighted the benefits of the                  rately examined evacuation from Tawaf [32] or Sayee [34],
physical barrier, which would compel the pilgrims to queue                   there is no modelling developing combined Tawaf and Sayee
without having to struggle or overcrowd around the Black                     evacuation scenarios. Our approach is to simulate the evacua-
Stone. However, although the authors specified crowd den-                    tion of groups of pilgrims from the GM at a more macroscopic
sity as Level of Service (LoS, representing the number of                    level, by considering the group, instead of individual, as a
pilgrims/m2 ), they did not mention the overall number of                    moving unit [35].
pilgrims simulated for performing the Tawaf ritual. Their                       Halabi [36] used the Space Syntax Laboratory to identify
findings led to new measures being adopted at Hajj, using                    overcrowding hotspots and to show the spatial movements
security guards and organising pilgrims to line-up; yet these                of the pilgrims during their evacuation from the Tawaf area
measures have not been completely successful in preventing                   of the Grand Mosque. They used spatial layouts and visual
overcrowding or managing aggressive crowd behaviour.                         graph analysis to visualise the spaces inside the GM building.
   Adopting the same SFM technique, Kolivand et al. [30]                     To develop the evacuation processes, Halabi [36] included
simulated pilgrim movements at the Tawaf area more ‘‘realis-                 several factors to calculate the duration of the evacuation,
tically’’ by designing a high-density crowd simulation model                 including the capacity of an area, walking speed and the
that accounts for pilgrim characteristics such as gender, walk-              distances to the exits. Their main findings of the evacuation
ing speed, and grouping and stopping in the crowd. Their                     processes are presented in Table 1. LoS E, equivalent to
simulation results showed that increasing the number of                      6p/m2 , was applied in the evacuation processes, the average

VOLUME 9, 2021                                                                                                                        79427
A. A. Owaidah et al.: Modelling Mass Crowd Using Discrete Event Simulation

TABLE 1. Halabi [36] evacuation results.                               Abdelghany et al. [34] concluded that the evacuation
                                                                    performance (duration) could be improved if pilgrims had
                                                                    knowledge of and were trained on how to choose gates and
                                                                    follow evacuation procedures (such as choose the closest
                                                                    gates or less congested gates).
                                                                       Recently, Mahmood et al. [3] developed an ABM in Any
                                                                    logic to identify, evaluate, and test emergency strategies in
                                                                    crowd evacuation. These strategies were tested in evacuating
                                                                    10,000 pilgrims from the Tawaf area using 12 gates [3], as
                                                                    follows.
                                                                       • Random gate evacuation: selecting any exit, simulating
                                                                         the crowd behaviour in panic.
                                                                       • Shortest distance: choosing the nearest exits and consid-
                                                                         ering prevention of collision.
                                                                       • Genetic Algorithm (GA1 ): generating ‘fit pilgrims’ as a
                                                                         key function in the evacuation processes.
                                                                       Mahmood et al. [3] considered the following com-
speed being 46 m per minute (0.767 m/s), and pilgrim flow
                                                                    mon factors in the evacuation simulation: population =
being 82 pilgrims/minute/m.
                                                                    10,000 pilgrims; min speed = 1.0 m/s, max speed = 2.0 m/s
   Halabi [36] concluded that pilgrims need substantially
                                                                    and most likely speed 1.4 m/s; number of simulation
more time to be evacuated from the GM than was expected.
                                                                    runs = 10. Optimisation reduced the evacuation time from
Note that these evacuation processes were tested before the
                                                                    7.4 min (random gate) to 4 min (when the nearest gate was
construction of King Abdullah expansion.
                                                                    selected), and to 3.1 min when applying GA.
   Abdelghany et al. [34] developed a CA framework of
                                                                       Mahmood et al. [3] underlined that the evacuation per-
the Sayee area at the GM, where the evacuees could make
                                                                    formance may differ from the presented results if evac-
their own decisions (such as exit choice, path choice to the
                                                                    uation scenarios simulate large numbers of pilgrims with
exit, and path updating) to prevent collisions. Two main
                                                                    more physical and behavioural interactions and collision
factors were considered when choosing an exit; the distance
                                                                    prevention.
to evacuation exits (12 gates) and the congestion around
the exits. The evacuation was developed in five experimen-
                                                                    F. CONTRIBUTION OF THE WORK
tal sets. The first set investigated the evacuation of 5,000,
                                                                    This work aims to simulate and validate the real data of
15,000 and 25,000 pilgrims, corresponding to LoS of 0.4,
                                                                    Hajj event 2019 in various crowd conditions (normal and
1.2 and 2.0 p/m2 respectively. The second set investigated
                                                                    emergency), to evaluate the potential changes of pilgrims’
the evacuation under three density values, 100%, 60% and
                                                                    organisation inside the Grand Mosque. Scenarios of different
20% and the 5th set focused on how the congestion awareness
                                                                    crowd conditions are presented, and to identify the bottleneck
(40%, 60%, 80% and 100%, as proportions of the occupied
                                                                    spots during the Tawaf and Sayee rituals.
cells) could affect the evacuation process. The main results of
                                                                       Furthermore, while a number of previous studies focused
Abdelghany et al. [34] are presented in Table 2. Our interest
                                                                    on modelling and simulating pilgrims on a single ritual at a
is on the 1st, 2nd and 5th sets (more related to our case study).
                                                                    time and at the individual level, this research combines both
                                                                    Tawaf and Sayee rituals, focusing on the relations between
TABLE 2. Abdelghany et al. [34] evacuation results.                 them. We used a DES software, ExtendSim, to focus on
                                                                    the potential implications for planning and managing the
                                                                    pilgrim activities at the Grand Mosque. This work is based
                                                                    on the validation of joint events (Tawaf and Sayee) and
                                                                    we applied well-established techniques to model crowds at
                                                                    the meso/macro level, to emphasise that infrastructure and
                                                                    behavioural aspects equally contribute to safety and efficient
                                                                    procedures and decision-making during Hajj. The results of
                                                                    sensitivity analysis are presented to identify elements that
                                                                    Hajj authorities may apply to more efficiently manage the
                                                                    crowds at the GM. Based on this analysis, we present some
                                                                    managerial solutions for crowd management at Hajj.

                                                                      1 GA is an optimisation technique using evolutionary concepts to choose
                                                                    the best evacuation solution that reduces the overall evacuation time by
                                                                    assigning pilgrims to less crowded exits.

79428                                                                                                                           VOLUME 9, 2021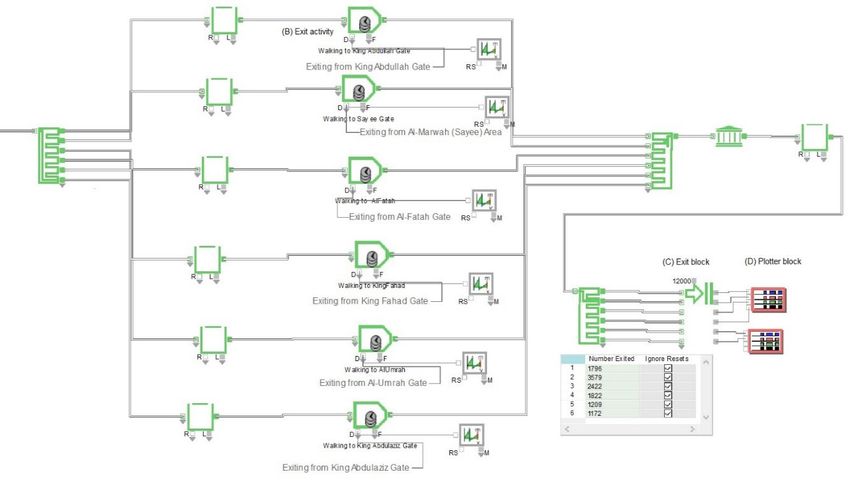
A. A. Owaidah et al.: Modelling Mass Crowd Using Discrete Event Simulation

         FIGURE 1. Diagram showing the modelling and simulation steps (with permission from Papageorgiou et al., 2009, p.44) [39].

III. DATA RESOURCES AND METHODOLOGY                                                  tested with various input ranges e.g., distribution of
This study uses DES, focusing on Tawaf and Sayee rituals                             times, number of services (number of gates, buses, etc.),
during the 10th of Dullhijjah, simulating both rituals as an                         walking speed of pilgrims, to test the robustness of the
integrated activity, in normal and evacuation situations, thus                       model.
addressing a critical gap in the literature.                                     •   Model validation – using real data to test the model
   We used secondary data collected by the local Hajj author-                        performance. This may involve developing criteria and
ities in Saudi Arabia and apply a model built in ExtendSim,                          applying statistical methods to test hypotheses. If the
a powerful platform for DES [37] developed by Imagine                                results between the simulation results and real-world
That Inc. [38]. The modelling approach was adapted from                              data are different, the developer must check and
Papageorgiou et al. [39]. FIGURE 1 illustrates the main                              update the model, then repeat this step again. The
steps, which are detailed below.                                                     t-tests and MANOVA we applied indicate validation
                                                                                     with 2015-2019 data.
   •   Problem definition – clearly identifying the problem to                   •   Scenario testing – developing and testing various scenar-
       be solved and its causes (e.g., why is there overcrowding                     ios once model validation is confirmed, evaluating the
       at Hajj ritual locations, such as at Tawaf and Sayee                          results, and formulating solutions.
       areas).
   •   Model objectives – establishing the goals of the sim-
       ulation, ensuring that the stated objectives solve the                 A. DATA COLLECTION SOURCES
       problem identified in the first step. In addition, the main            Secondary data were obtained from The Institute of Hajj and
       system components are defined and the model inputs are                 Umrah Research and Ministry of Hajj, Makkah city, Saudi
       identified. Our objective was to identify the locations                Arabia. As shown in FIGURE 2, we combined many dif-
       that are subject to overcrowding and reduce the pilgrim                ferent sources to initialise and validate the models, including
       numbers at these locations.                                            images and video recording from Hajj 2015, 2016 and 2017,
   •   Model development – model complexity required to                       tables and figures from Hajj 2019 operational planning, Hajj
       achieve the stated objectives, as well as selecting the                Transport Department and The Saudi Car Syndicate Opera-
       appropriate modelling platform. In our case, we have                   tional Planning. Also included were social media coverage
       chosen ExtendSim10 for its capabilities and availability               of Hajj daily reports in 2019, and personal experiences and
       within the institution for research and training.                      recollections of previous Hajj events by co-authors. These
   •   Model calibration – refers to specifying the main math-                data sources were compared, triangulated, and cross-checked
       ematical equations and statistical functions used for                  before the model inputs were set, and the results of the
       building the model and using data to estimate the model                simulation were compared with the published statistics of the
       parameters. We based our calibration on statistical infor-             events and media reports.
       mation from secondary sources (official statistics of
       pilgrim numbers performing Tawaf and Sayee rituals                     B. MODEL DEVELOPMENT
       and counts and durations estimated from video material)                ExtendSim can simulate a variety of systems from simple to
       as well as previous scholarly work. In addition, given                 very complex stochastic models, which makes it applicable
       the uncertainties around several inputs, the model was                 to many different fields such as healthcare, manufacturing,

VOLUME 9, 2021                                                                                                                          79429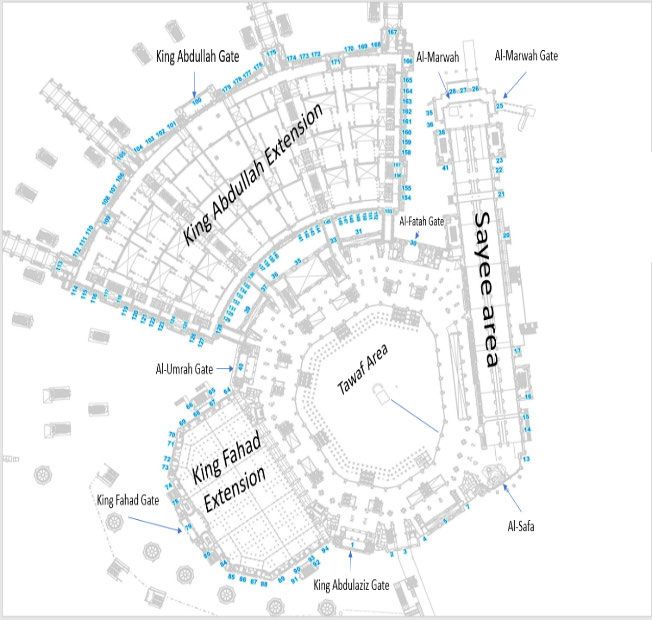
A. A. Owaidah et al.: Modelling Mass Crowd Using Discrete Event Simulation

                                                                  •   Roof Level has an area 10,318 m2 and allows for
                                                                      12,000 to 30,000 pilgrims p/h. Capacity on Level 1 and
                                                                      roof levels are different, because of the different pilgrim
                                                                      speeds on these levels.

                                                                   The Tawaf (154 m long and 105 m wide) includes a cir-
                                                                cular area [48], with the Ka’aba in the middle. The walking
                                                                distances vary between 200 m and 585 m per circle [50],
                                                                leading to circumambulation distances between 1.4 to 4.1 km
                                                                (depending on where it is performed). The overall average
                                                                level of services (LoS) is 4 pilgrims/m2 , which is considered
                                                                high density [17]. However, at certain locations such as the
                                                                Tawaf, the preferred area by pilgrims [13], the LoS can reach
                                                                to 6-8 pilgrims /m2 [17].
                                                                   To avoid congestion, pilgrims are distributed over the five
                                                                levels as follows: Tawaf area (73.2%); Ground level (GL)
                                                                (12.7%); Level 1 (L1) (11.1%); Mobility Reduced area at
                                                                Level 1 (L1 MR) (2%) and Roof (RL) (1%).
                                                                   Currently, pilgrims use five major gates to access the GM;
                                                                Al-Umrah (U), King Fahad (K.F.), King Abdulaziz (K.Az),
FIGURE 2. Data sources and data formation process.              Al-Marwah (M), and Al-Fatah (F) [51]. King Abdulaziz gate
                                                                (K.A.) (bottom of map, FIGURE 3) is the nearest to the
                                                                beginning line of the Tawaf ritual [51] and the most used gate.
communications, logistics and military operations [38], [40].   With the new expansion of the GM, a sixth gate, called King
The platform implements a graphical interface consisting        Abdullah Gate (K.A.) (north west of the map), leads directly
of many hierarchical blocks and including components that       to the Tawaf area [46]. GM has a total of 179 gates (indicated
represent the processes in the simulation [40]. Blocks are      in blue in FIGURE 3).
the main items in ExtendSim, which progresses the items            Tawaf Al-ifadah is obligatory for Hajj completion [52],
(entities or pilgrims) from one block to another to perform     being a key ritual. Pilgrims arrive at Mina on the 8th of
a specific activity [41].                                       Dhulhijjah and leave for Arafat on the 9th, spending the
                                                                whole day there. Just before sunset, they leave for Muzdalifah
IV. MODELLING AND SIMULATION IMPLEMENTATION                     where they spend the night. Usually pilgrims perform Tawaf
The model presented here refers to the Tawaf and Sayee rit-     after noon on the 10th, after stoning the big Aljamarat pillar,
uals performed in the GM assuming the pilgrims are already      sacrificing an animal and shaving their heads [42], [43], [53].
in Makkah. Activities undertaken prior by international and     Tawaf Al-ifadah needs to be completed within a 48-hour
regional pilgrims are not modelled in this simulation. Note     window on the 10th and 11th [53].
that some figures and maps are stored in the institutional         After performing Tawaf, pilgrims must go to the Sayee
repository for better resolution.                               area, about 400m away, but still within the boundaries
                                                                of the GM [55]. The Sayee ritual requires pilgrims to
A. TAWAF AND SAYEE AT THE GRAND MOSQUE                          move back and forth between the two hills of Al-Safa and
The Grand Mosque is a large complex area which covers           Al-Marwah seven times, starting from Al-Safa (FIGURE 3)
356,800 m2 [42]–[44], with expansion plans to 1.1 million m2    [50], [56]. The Sayee area is about 394 m long and 33 m
to accommodate up to 2.5 million worshippers at a               wide [56]. Sayee can be performed at any one of five
time [44]. The last expansion, initiated in 2011, was paused    levels, each with an estimated capacity of 50,000 pilgrims
in 2015 after a crane accident (which caused 111 fatalities     and a maximum crowd density during the peak of Hajj of
and 394 injuries), but resumed in 2017 [45]. The expansion      about 4 pilgrims/m2 [34]. The highest allocation is for the
has reached 80% completion and is expected to be finished       Ground-level (57.5%), which is a continuation of the Tawaf
in 2022 [46]. The Tawaf area consists of the following          area. Pilgrims are distributed to other Sayee levels as follows:
sections [47]–[49].                                             Basement level (BL) (15.5%); Level 1 (L1) (22%); Mobility
   • Tawaf area around the Ka’aba (or simply Tawaf) has an      Reduced area at Sayee first level (L1 MR) (1%); Level 2 (L2)
     extended area of 16,185 m2 and permits 50,000 pilgrims     (3%) and Level 3 (L3) (1%). There is no strict requirement as
     per hour (p/h) [5], [48].                                  to which establishments to perform Sayee at each level, but
   • Ground level with area 11,778 m2 and permits between       pilgrims’ preferences match the percentages above.
     10,000 to 25,000 pilgrims p/h.                                FIGURE 4 shows the percentage of pilgrims and the
   • Level 1 has an area 10,318 m2 and allows between           corresponding LoS for each level of the Tawaf and Sayee
     7,000 to 26,000 pilgrims p/h.                              areas. For example, when the percentage of pilgrims in the

79430                                                                                                                       VOLUME 9, 2021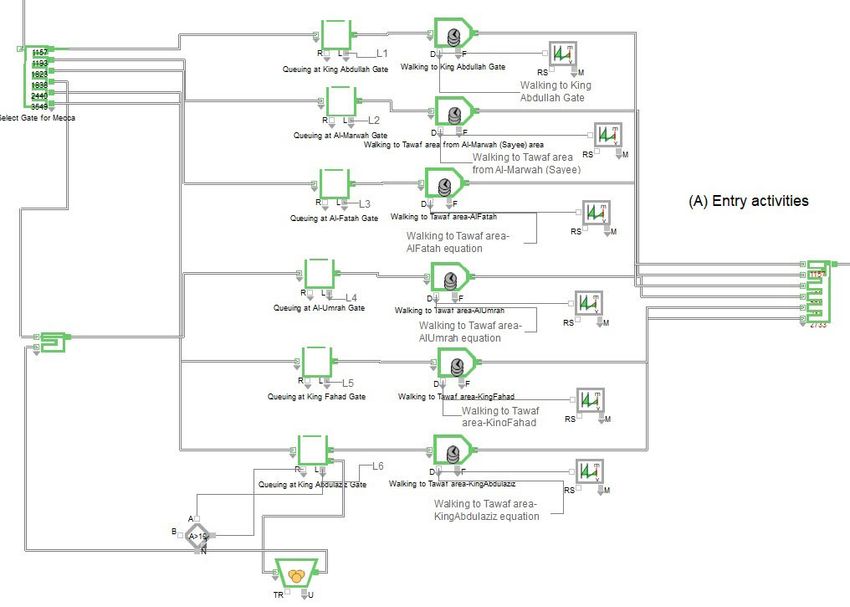
A. A. Owaidah et al.: Modelling Mass Crowd Using Discrete Event Simulation

                 FIGURE 3. The Grand Mosque map (source: The General Presidency of The Affairs of The Grand Mosque and The
                 Prophet’s Mosque, 2020) [54].

                 FIGURE 4. LoS depending on the allocation percentages.

Tawaf area is 30%, the LoS is 2 pilgrims/m2 , but this increases             Other studies have shown that by maintaining the num-
to 6 pilgrims/m2 when the allocation becomes 80%. Corre-                     ber of pilgrims in the Tawaf area at a maximum of 50%
spondingly, the allocation in other areas decreases, resulting               for all activities [17], [48] a better utilisation of infrastruc-
in an improved LoS. The most dramatic effect is seen for                     ture is achieved and a LoS under 6 pilgrims/m2 is ensured
GL, and L1 and the roof level, given their reduced allocation.               (see FIGURE 4).

VOLUME 9, 2021                                                                                                                          79431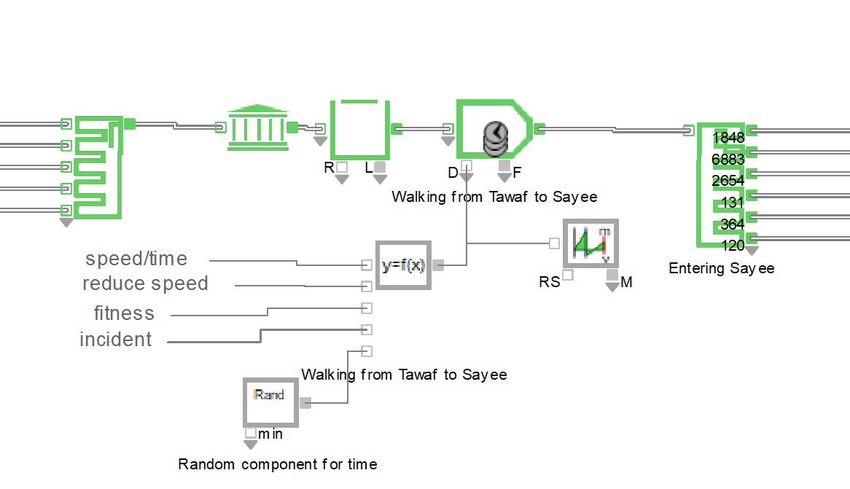
A. A. Owaidah et al.: Modelling Mass Crowd Using Discrete Event Simulation

        FIGURE 5. (A) Executive Block, (B) Create Block, (C) Set Blocks, (D) Get Blocks, (E) Queue Block.

B. TAWAF AND SAYEE SIMULATION                                                          and their speed drops by a factor of 1.11. This fur-
The simulation model in ExtendSim includes sets of hier-                               ther changes from tired to very tired and their speed
archical blocks, each performing a specific activity [57].                             decreases by a factor of 1.25 compared to rested. These
Table 13 (in the appendix) presents the main blocks used                               average levels were established based on the video mate-
in our model along with their functions. An Executive Block                            rial, but were also tested as a part of the sensitivity
(FIGURE 5-A), located at the top left corner of the model,                             analysis.
controls the simulation timing and passage of the pilgrims                         •   Incident rates: Bianchi [58] reported that eight coun-
through the system. Create blocks generate pilgrims, Set                               tries from four different continents faced major inci-
blocks assign behavioural characteristics to pilgrims and                              dents at Hajj events between 2002-2015. Percentages of
Activity blocks are used for the duration of the rituals.                              incidents were calculated by geographical groups (Iran,
   In the Tawaf and Sayee model (FIGURE 5), the Create                                 Indonesia, Pakistan, Bangladesh and India together
Block (FIGURE 5-B3 ) generates 12,000 groups of 250 pil-                               under Asia; Turkey was combined with Europe; Nigeria
grims each, giving a total of three million pilgrims. Pilgrims                         under Africa, and Egypt under Arab countries). The inci-
enter the Grand Mosque, perform Tawaf followed by Sayee,                               dent rates for these groups (Table 15 in the Appendix)
and then exit the simulation. The following attributes were                            vary from Iran = 0.06%, Europe = 0.07% to South
applied to pilgrims and were incorporated using Set and Get                            Asia = 0.53%).
Blocks (FIGURE 5-B, C and D3 ).                                                    Pilgrim arrivals are scheduled by the Hajj authorities. For
   • Groups and regions: as percentages of all pilgrims for                     example, Hajj authorities allow a time window of six hours
     Hajj 2019.                                                                 for each group to arrive at the Grand Mosque from Mina city
   • Age: The available data of pilgrims ages from Hajj 2019,                   on the 10th , perform Tawaf and Sayee then exit and return to
     used for validation, was by category (under and over                       Mina. The arrival rates largely follow a Poisson distribution.
     50). 40% aged between 10 and 50 years and 60% aged                            The distribution of the pilgrims in the model was based on
     50 years+, each with different fixed fitness levels.                       the following statistics:
   • Speed: Speeds vary between 0.8 to 1.46 (m/s) depending
                                                                                   •   Africa 7.11% (12 pm – 6 pm on the 10th )
     on pilgrims’ fitness and level of fatigue (three levels
                                                                                   •   Arabs 15.7% (3 pm – 9 pm on the 10th )
     assumed - rested, tired and very tired) and are given
                                                                                   •   South-East Asia 11.65% (7 pm – 1 am on the 10th )
     in Table 14 (Appendix). The average walking speed
                                                                                   •   South Asia 27.62% (10 pm – 4 am on the 10th )
     for the ages 10-50 (fit) is around 1 m/s and for elderly
                                                                                   •   Iran 3.4% (11 pm – 5 am in the 10th )
     pilgrims is 0.83 m/s. Triangular distributions are applied
                                                                                   •   TEAA 9.28% (1 pm – 7 pm on the 10th )
     with the average speeds being the most likely speeds.
                                                                                   •   Locals 24.03% (7 am on the 10th – 1 pm on the 11th )
     Additional speed adjustment is applied for crowding,
                                                                                   •   Arabic Gulf 1.21% (12 pm – 6 pm on the 11th )
     when the speed is halved for LoS above 4 people/m2 .
   • Fatigue: This attribute is related to the Speed attribute.                    The peaks or potentially congestion-generating periods
     After walking for a period of time, pilgrims’ level                        may occur when multiple groups are allowed to enter the GM
     of energy is assumed to change from rested to tired                        at the same time.

79432                                                                                                                                       VOLUME 9, 2021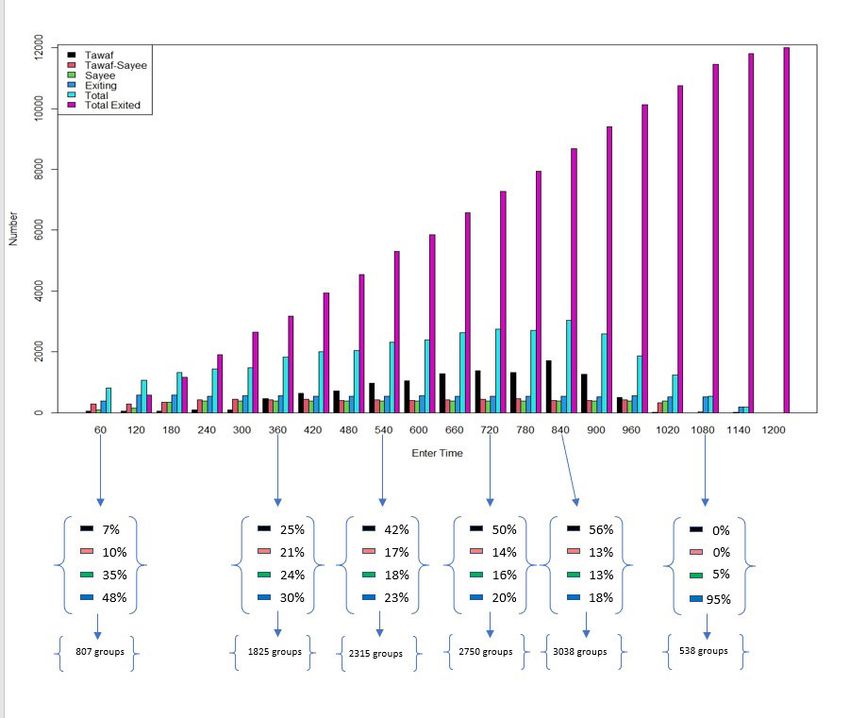
A. A. Owaidah et al.: Modelling Mass Crowd Using Discrete Event Simulation
Upon their arrival, pilgrims are allocated one of the five The initial results of the simulation indicate that it takes
main gates of the GM, with the percentage allocations in the 30 hours for the 12,000 groups (3,000,000 pilgrims) to com-
model: plete both the Tawaf and Sayee rituals.
• King Abdullah gate 10%;
V. SIMULATION RESULTS
• Al-Marwah gate 10%;
The model was run 30 times and the results were
• Al-Fatah gate 15%;
compared against statistics based on the real data
• Al-Umrah gate 15%;
(TABLES 3, 4 and 5). The inputs were stochastic and tri-
• King Fahad gate 20%;
angular distributions were assumed for activity durations;
• King Abdullaziz gate 30%.
this means that the results are also stochastic. The use
of triangular distributions is a potential limitation; further
Before performing the Tawaf, the pilgrims queue at their research could compare with other types of distributions for
allocated gate (FIGURE 5-E. Once they are admitted, they durations.
walk through the gate until reaching the Tawaf area, rep-
resented by Activity blocks (FIGURE 6-A). Tawaf is per-
A. MODEL VALIDATION
formed at one of the five levels, depending on the entrance
allocation (FIGURE 6-B). The walking duration is calcu- In 2019, a total of 2.6 million pilgrims performed Hajj, while
lated using Equation blocks (see FIGURE 6-C) and con- our model admitted 3 million pilgrims. Nonetheless, the sim-
siders the distance from the gates to the Tawaf ritual areas ulation results compare very well with the real data. The
(see TABLE 16 in the Appendix). An example calculation is similarities indicate some potential reserve capacity in the
given below in [EQUATION 1], where ReduceSpeed (Age) system.
and Tired (Fatigue) are factors that reduce the walking speed Table 3 shows the statistics for entering and exiting activ-
depending on the Age (and thus fitness) and fatigue level of ities. The simulation results for the percentage of pilgrims
the pilgrim. We have assumed that in the case of an incident, entering through each gate matches closely with real data.
the walking time will double. Similarly, the actual walking times from the gates to Tawaf
on entry, and to the exit gates on completing Sayee, show no
Entering Equation (time in min)
statistically significant differences between simulation results
from King if(Incident == 0)
and real data.
Abdulaziz Walktime
1 Table 4 and Table 5 provide the percentage of pilgrims and
Gate Distance× 60
= [Speed×ReduceSpeed(Age)×Tired(Fatigue)] durations for Tawaf and Sayee respectively. The differences
(d=190 m)
Else between the simulations and real data for the percentage of
Walktime pilgrims by gate and levels are under 1%, giving confidence
1
Distance× 60 in the veracity of the model. The LoS at Tawaf area and the
= 2[Speed×ReduceSpeed(Age)×Tired(Fatigue)] Ground level of Sayee confirm that they are the most crowded
EQUATION 1 areas, which could result in crowd incidents. From Table 4,
After arriving to the Tawaf areas, pilgrims may need at peak times the Tawaf area records an LoS of 6 p/m2 . The
to queue and face a delay as they merge with the people LoS for GL, L1 and roof level are lower, with a maximum
already performing Tawaf (FIGURE 6-B). A different equa- of 2 pilgrims/m2 at peak time. In addition, Tawaf durations
tion block is used to calculate the duration of circumambu- show an average of 45 min at the Tawaf area, 42 min at GL,
lation, depending on the distance from the Ka’aba and level 48 min at L1 (duration of going to the next level is included in
where it is performed, as well as the congestion conditions the models), 40 min at L1 MR and finally 55 min at the roof
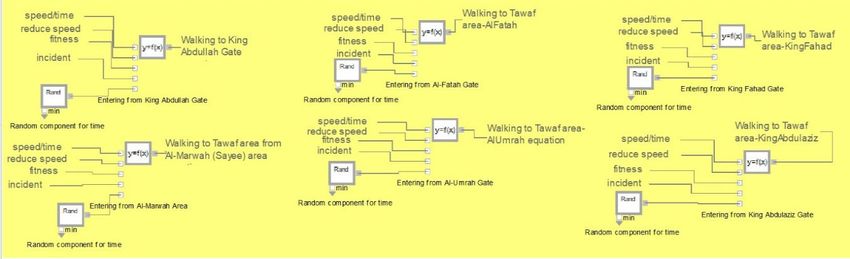
(FIGURE 6-D). After pilgrims finish Tawaf, they walk to level. The General Presidency of The Affairs of The Grand
the Sayee area (FIGURE 6-E). The walking duration is Mosque and The Prophet’s Mosque (2019) [62] provides
calculated in a similar manner to EQUATION 1. allocation by levels for Sayee (Table 5). Our results indicate
Pilgrims may again queue and be delayed while joining slightly shorter average times and better LoS, even with the
other pilgrims performing the Sayee ritual (FIGURE 7-A). larger number of pilgrims for 2019 (three million). The model
Completing the Sayee marks the end of rituals in the Grand closely mirrors the percentages of pilgrims undertaking the
Mosque and pilgrims exit the mosque through one of the Sayee ritual at various levels. The longest times for perform-
gates. This is represented in the simulation by using the ing Sayee are at levels 2 and 3 (on average 69 min). The
Exiting activities (FIGURE 7-B and C). Equation blocks most crowded area is the Ground level (6 p/m2 at peak times),
are also used to calculate the duration of Sayee, accounting as this level accommodates nearly 60% of the pilgrims. The
for the distance between the two hills and the walking time LoS is under 2 pilgrims/m2 at peak times for Basement level
to exit as a function of the gate (see EQUATION 1). The and L1 (Table 5). The lower durations for the activities and
Plotter Block (FIGURE 7-D provides the cumulative count better level of service suggest potential reserves of capac-
of pilgrims completing both rituals over time (models made ity in the system, able to accommodate over 2.6 million
available in the institution repository). pilgrims.
VOLUME 9, 2021 79433A. A. Owaidah et al.: Modelling Mass Crowd Using Discrete Event Simulation
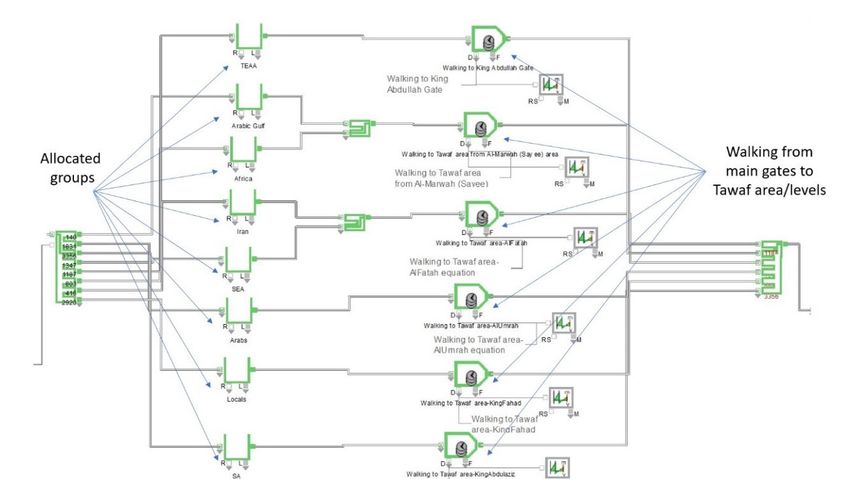
FIGURE 6. A: Entry activities. B: Tawaf activities. C: Entry equations. D: Tawaf equations. E: Walking activity from Tawaf to
Sayee.
79434 VOLUME 9, 2021A. A. Owaidah et al.: Modelling Mass Crowd Using Discrete Event Simulation
FIGURE 6. (Continued.) A: Entry activities. B: Tawaf activities. C: Entry equations. D: Tawaf equations. E: Walking activity from Tawaf to
Sayee.
B. TAWAF AND SAYEE SCENARIOS floods), dangers at construction sites (e.g., mosque expan-
Problems due to overcrowding at Hajj sites may be contained sion), fires, falling rocks and crowd hazards.
and crowd incidents could be prevented by efficient crowd In this study, we examine conditions for operation changes
management, including sufficient prior planning through without incidents [Sections (I) to (V)] and for more likely
crowd modelling and simulation, infrastructure improve- hazard situations such as extreme heat or storms, which may
ments, deployment of more security officers and better use require halting proceedings, including some rituals, or move-
of information technology [19]. ment between sites [Section (VI)].
Currently, Hajj evacuation procedures are planned and car- The scenarios in Table 6 were tested to estimate their
ried out by the Saudi Civil Defence (SCD) [63]. SCD trains effects on the LoS, as well as the average ritual activity
and prepares more than 18,000 officers to execute evacuation durations and the average queue building at Tawaf and
procedures, using more than 3,000 devices and sophisticated Sayee. These methods could be used as new strategi-
pieces of equipment. They have developed more than 13 pos- cal management options for the event. In addition, all
sible hazard scenarios for Hajj events, including extreme Tawaf and Sayee (normal and evacuation) scenarios were
weather conditions (high temperatures, rain, wind, storm and designed and developed according to the Grand Mosque’s
VOLUME 9, 2021 79435A. A. Owaidah et al.: Modelling Mass Crowd Using Discrete Event Simulation
FIGURE 7. (A) Sayee activities and equations. (B) Exit activities, (C) Exit Blocks, (D) Plotter Blocks.
infrastructure including the new building of the King Abdul- 2) INDIVIDUAL SCENARIOS FOR ONE-WAY
lah expansion (see FIGURE 3). All these scenarios were SENSITIVITY ANALYSIS
replicated 30 times. In these scenarios, the percentage allocation of pilgrims was
changed only at one stage—entry, Tawaf, Sayee, or exit of
1) DEVELOPING TAWAF AND SAYEE SCENARIOS the model at a time, while the remaining areas used the
Table 6 describes the scenarios we implemented in the Tawaf allocations of the original model. The results indicate that
and Sayee model. changes in the percentage allocations to gates for entry/exit
79436 VOLUME 9, 2021A. A. Owaidah et al.: Modelling Mass Crowd Using Discrete Event Simulation TABLE 3. Validation of arrivals and exit (statistics). TABLE 4. Tawaf Activity - Validation. or Sayee areas do not affect the overall duration of the Tawaf effect of closing areas, as well of the age distribution of the and Sayee rituals (within 30 hours). However, the model is pilgrims, but not of the level of fatigue on (R2 -adj = 0.77, sensitive to the percentage allocation for Tawaf areas and see Table 7). yields the poorest LoS when Tawaf area is closed. A multiple The regression model results confirm that lower numbers regression model for these scenarios with the number of of pilgrims can be accommodated when the Mataf area is pilgrims completing the rituals in 30h showed a significant closed and that similar numbers of pilgrims are completing VOLUME 9, 2021 79437
A. A. Owaidah et al.: Modelling Mass Crowd Using Discrete Event Simulation

TABLE 5. Sayee Activity - Validation.

TABLE 6. Tawaf and Sayee scenarios.                              TABLE 7. Regression results (sensitivity analysis).

                                                                    •   Changing the percentages allocations from 30% to 80%
                                                                        at all Tawaf and Sayee areas;
                                                                    •   Focusing on the most critical areas preferred by pilgrims
                                                                        and combining allocations (e.g., Tawaf area with Sayee
                                                                        GL, Tawaf GL with Sayee L1, Tawaf L1 with Sayee BL
                                                                        and Tawaf Roof L with Sayee L2);
                                                                    •   Changing pilgrim percentages at the King Abdulaziz
Sayee at each level. Note that speed is not significant in the          (KAz.) entry gate, which is the closest gate to Tawaf
regression model since Speed and Age (dummy variable) are               levels;
highly correlated. The main results of these scenarios are          •   Changing pilgrim percentages at Al-Marwah exit gate,
presented in TABLE 8.                                                   which is the closest gate to exit.
                                                                    The simulation scenarios were categorised into three
3) MIXED SCENARIOS                                               groups based on their results: scenarios that simulated all
A total of 110 mixed scenarios, where allocations were           pilgrim groups within the simulation time (30 hours); sce-
changed simultaneously in two or more areas, were developed      narios that simulated between 9,000 and 12,000 groups;
as follows.                                                      and scenarios that simulated less than 9,000 groups. Some

79438                                                                                                                        VOLUME 9, 2021
A. A. Owaidah et al.: Modelling Mass Crowd Using Discrete Event Simulation
important observations from the results of these scenarios are 5) ALLOCATION OF GATES TO PILGRIM GROUPS
summarised below (for more details, the results can be found Guided results of the mixed scenarios (Section IV) and by
at UWA repository 2 and all the Grand Mosque main gates previous scholarly work, we examined scenarios in which pil-
leading to Tawaf, including King Abdullah Gate were tested grim groups were assigned to a specific entry gate, depending
in the scenarios). on their bus stop locations around the Grand Mosque: SA
• Closure of Tawaf area, with the ritual performed at other to King Abdulaziz gate (K.Az.); Locals to King Fahad gate
levels, or underutilising the Tawaf area has the most (K.F.); Arabs to Al-Umrah gate (U); SEA and Iran to Al-Fatah
negative impact on the completion of the rituals (only gate (F); Africa and Arabic Gulf to Al-Marwah gate (M)
about 75% of the pilgrim groups completed the rituals and TEAA to King Abdullah gate (K.A.) (see FIGURE 8).
within 30 hours). All pilgrim groups completed the rituals in 1,550 minutes,
• When critical gates to Tawaf area and Sayee were significantly less (138 minutes) from the original model
closed, delays occurred in completing the rituals and in where pilgrim groups enter randomly (1,688 min). Together
evacuation. with scheduling, this managerial strategy could lead to big
• When Tawaf area was closed or received 20% to 40% of improvements in completion times.
pilgrim groups, 9,000 to 11,000 groups completed the
rituals within 30 hours.
• When Tawaf area was closed together with Sayee 6) EVACUATION SCENARIOS
L3, only 5,000 to 9,000 groups completed the rituals Cuesta et al. [65] mentioned three possible approaches when
within 30 hours. developing new scenarios for evacuation models: use of
• When Tawaf GL and Roof level were closed together legacy models, improving current models or developing new
with three exit gates, less than 10,000 groups completed evacuation models. Our approach was using legacy models,
the rituals within 30 hours. testing evacuation scenarios developed previously, then com-
• When two Sayee levels and two exit gates were pare the results of these previous studies to ours, considering
closed, 9,000 pilgrim groups completed the rituals the differences in the infrastructure of evacuation scenar-
within 30 hours. ios. In addition, the evacuation scenarios can be categorised
• When Tawaf area and Sayee GL received 40% to depending on how human movement is incorporated, either as
60%, but two levels from each area were closed, up to flow-based, CA, ABM and activity-based model; or by con-
10,000 groups completed the rituals within 30 hours. sidering the level of aggregation (macro-, micro-, and effect
• If the proportion of pilgrims over 50 years of age based) [65]. Our research approach fits the activity-based,
increases, this significantly increases the duration of the macro-level description, offering insights on the managerial
rituals. solutions potentially applicable to Hajj.
A few evacuation scenarios were developed to analyse how
4) SIMULTANEOUS CHANGE OF TAWAF AND long it takes for the pilgrim groups to be evacuated from
SAYEE SCENARIOS the four main areas of the GM (Tawaf, Sayee, transition
Other scenarios were developed by simultaneously changing between Tawaf-Sayee areas and the main exits), during their
the percentages of pilgrim group at selected combinations rituals. Additional blocks were added to the simulation model
of Tawaf and Sayee areas, but not at the gates. The changes to depict pilgrim movement to the nearest gates instead of
were made sequentially, allocating from 0% to 80%, in steps continuing their progression through the rituals. The new
of 10%. Table 9 shows the average time of Tawaf and Sayee evacuation (Activity blocks) in each area were associated
rituals in the selected areas, as well as the total number with Equation blocks specifying the walking times to the
of pilgrim groups completing the rituals in 30 hours. The existing gates.
poorest results, unsurprisingly, occur when multiple areas are As indicated in Section IV (A), six big entry gates are
closed or when the utilisation of the infrastructure/resources connected to the Tawaf area and used as exits after the
is unbalanced, primarily over-utilisation of the GL Tawaf and Sayee. However, in the evacuation model, all 179 gates were
L1 and L2 Sayee areas. In contrast, judicious allocation of dynamically allocated to various pilgrim groups depending
groups to the areas, proportionate to their capacities, leads to a on the numbers and locations of the pilgrims at the time of
satisfactory completion of the rituals within the planned time, evacuation.
while ensuring good LoS (less than 4 pilgrims/m2 ). Closing FIGURE 9 shows the total number of groups of pilgrims
the roof area of Tawaf and levels 2 and 3 Sayee has little within the main areas of Tawaf, Sayee, in transit between
impact on the number of pilgrims completing the rituals, but Tawaf-Sayee, their totals, and the cumulative number of
will increase crowding and LoS may exceed 4-5 pilgrims/m2 groups that had exited the GM, over time. The chart is also
in the adjacent areas. The results also highlight that Sayee rit- indicative of the time at which pilgrims perform Tawaf and
ual is generally longer than the Tawaf, reflecting the distance Sayee, and when they reach the highest numbers, based on
pilgrims require to cover between the two hills. the arrivals. As expected, the highest number of pilgrims in
Tawaf seems to be recorded around 12 hours after the official
2 https://cloudstor.aarnet.edu.au/plus/s/ZNprMWzZqNULBYY time of the start of the ritual, and after 14 hours for Sayee.
VOLUME 9, 2021 79439A. A. Owaidah et al.: Modelling Mass Crowd Using Discrete Event Simulation
FIGURE 8. Allocated groups.
FIGURE 9. Total number of groups of pilgrims at areas of Tawaf, Sayee, in transit between Tawaf-Sayee and the cumulative
number of groups that had exited the GM, over time.
This is the critical time for evacuation and likely to lead to not be entering the GM but will need to disperse, to allow the
longest evacuation times, given that more than a quarter of pilgrims inside the GM to exit.
the pilgrims are in the Tawaf-Sayee areas performing their The chart is complemented by details of the split of the
rituals. At this time, less than 2,000 groups were yet to number of groups of pilgrims in each area during the evac-
commence their rituals. In an evacuation situation, they will uation at 60, 360, 540, 720, 840 and 1,080 minutes. After
79440 VOLUME 9, 2021A. A. Owaidah et al.: Modelling Mass Crowd Using Discrete Event Simulation TABLE 8. Allocations for the Tawaf and Sayee scenarios. 60 minutes, 7% of the pilgrims are in Tawaf, while most when the Tawaf area is underutilised (
You can also read