HOTEL AREA 160 - Commercial Revalue 2016 Assessment roll - King County
←
→
Page content transcription
If your browser does not render page correctly, please read the page content below
Commercial Revalue

        2016 Assessment roll

       HOTEL
         AREA 160

King County, Department of Assessments
         Seattle, Washington

        John Wilson, Assessor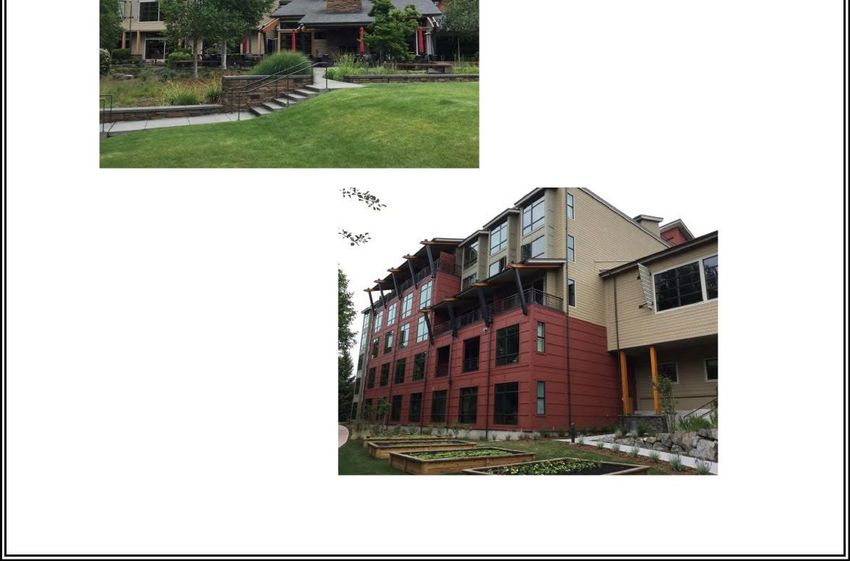
Department of Assessments
Accounting Division                                                         John Wilson
500 Fourth Avenue, ADM-AS-
0740 Seattle, WA 98104-2384                                                   Assessor
(206) 205-0444       FAX (206) 296-0106
Email: assessor.info@kingcounty.gov
http://www.kingcounty.gov/assessor/

Dear Property Owners:

Property assessments are being completed by our team throughout the year and valuation notices
are being mailed out as neighborhoods are completed. We value your property at fee simple,
reflecting property at its highest and best use and following the requirements of state law (RCW
84.40.030) to appraise property at true and fair value.

We are continuing to work hard to implement your feedback and ensure we provide accurate and
timely information to you. This has resulted in significant improvements to our website and online
tools for your convenience. The following report summarizes the results of the assessments for this
area along with a map located inside the report. It is meant to provide you with information about
the process used and basis for property assessments in your area.

Fairness, accuracy, and uniform assessments set the foundation for effective government. I am
pleased to incorporate your input as we make continuous and ongoing improvements to best
serve you. Our goal is to ensure every taxpayer is treated fairly and equitably.

Our office is here to serve you. Please don’t hesitate to contact us if you should have questions,
comments or concerns about the property assessment process and how it relates to your property.

In Service,

John Wilson
King County Assessor
The information included on this map has been compiled by King County staff from a variety of sources and is subject to change without notice. King County makes no representation or warranties, express or
implied, as to the accuracy, completeness, timeliness, or rights to the use of such information. King County shall not be liable for any general, special, indirect, incidental, or consequential damages including, but
not limited to, lost revenues or lost profits resulting from the use or misuse of the information contained on this map. Any sale of this map or information on this map is prohibited except by written
                                                                                                                                                                                                                           Assessments
permission of King County.
                                                                                                                                                                                                                              8/25/16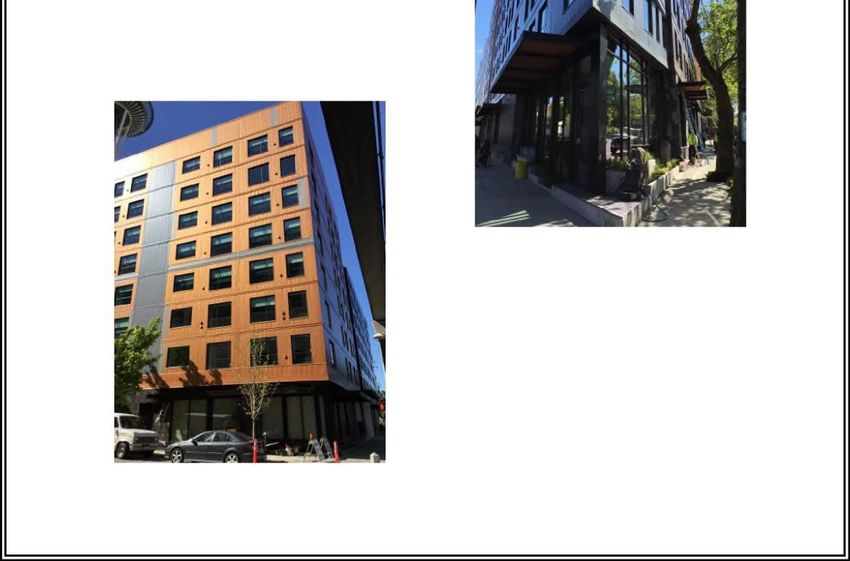
2016 Revalue Report
Specialty Area 160: Hotel & Motels
King County Department of Assessments

                            Executive Summary Report
                              2016 Assessment Roll

Appraisal Date: 1/1/16

Specialty Name: Hotels/Motels

Sales – Improved Analysis Summary: Number of Sales: 43

Range of Sales Dates: 2/3/2012 – 3/17/16

No ratio studies were included due to the limited number of improved sales for each hotel
class within each submarket for hotel/motel specialty population.

A lodging specific income approach was used in the final reconciliation of value as it
allows for greater equalization and uniformity of values for the wide range of hotel and
motel types in the population. Current market metrics show continued momentum
including increasing Average Daily Rates (ADR), strong occupancy and stable cap rates
for the lodging sector in King County. Most lodging properties have surpassed their prior
peak values from 2007 given multiple consecutive years of a strong lodging sector in King
County. The highlights were new record sales for both Seattle and the Eastside with the
Hotel 1000 in downtown Seattle at $685,520 per key and the Marriott Hotel Bellevue at
$456,894 per key.

                          Population – Parcel Summary Data
                             Land                Improvements                Total
 2015 Value              $1,418,972,834         $3,942,546,948          $5,361,519,802
 2016 Value              $1,610,330,229         $4,703,054,071          $6,313,384,700
 Percent Change             13.49%                  19.29%                  17.75%

Number of Parcels in the Population: 357. This includes all hotels motels in King County
designated under the hotel specialty. Some do not have the specialty code 160 as they are
condominiums or properties within other specialty codes. For these, a value is provided
by the hotel specialist to the pertinent specialist or geographic appraiser.

                                                                                         2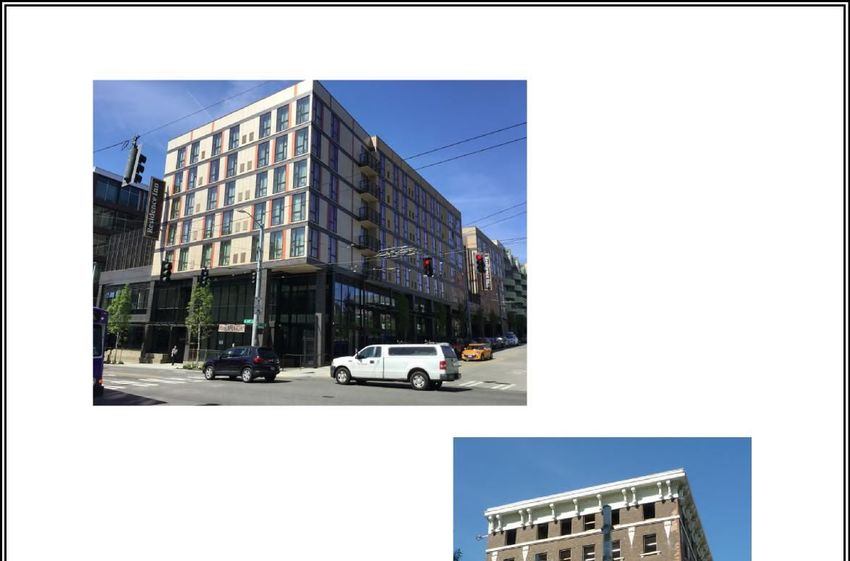
Conclusion and Recommendation:

Assessed values for the 2016 revalue have increased 17.75% for the combined population.
Keep in mind this is a comparison of the year over year totals and does not mean that each
parcel went up by this amount. The overall value change can also be impacted by
additions, remodels or new construction of properties in that the year over year change is
because of the change in the property as opposed to a market value adjustment. The
median property by property increase was 14.10%.

The values recommended in this report improve uniformity and equity; therefore, it is
recommended they should be posted for the 2016 Assessment Year.

                                                                                       3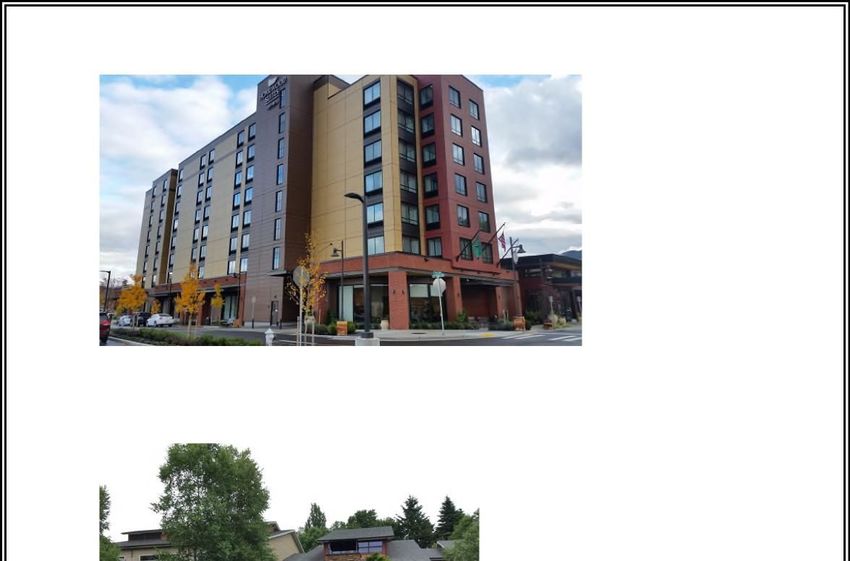
Identification of the Area
Name or Designation
Specialty Area 160 – Hotels & Motels
The specialty includes 330 total parcels and this number is growing annually as more of
the planned hotel projects are built or are breaking ground. During 2015, King County
continued its reign as one of the stronger lodging markets in the United States. There are
over 60 hotel projects that have either recently opened, broken ground or are in the
planning stages. Our region has a vast array of lodging types including:
Traditional full service hotels mostly in Downtown Seattle, Bellevue, Redmond
and Seatac.
Boutique destination retreats such as the Salish Lodge, The Willows Lodge and
the Cedarbrook Lodge.
Select service hotels such as the Courtyard by Marriott, Four Points by Sheraton,
Hampton Inn & Suites and Hyatt Place.
Extended stay hotels such as Extended Stay America, Residence Inn by Marriot,
Homewood Suites by Hilton and Home2 Suites by Hilton.
Limited service hotels including Holiday Inn Express, Red Roof Inn, Travelodge,
and Econo Lodge.
There are all a mix of branded and independent, unbranded hotels and motels in all
categories throughout King County.
Boundaries
All areas within King County.
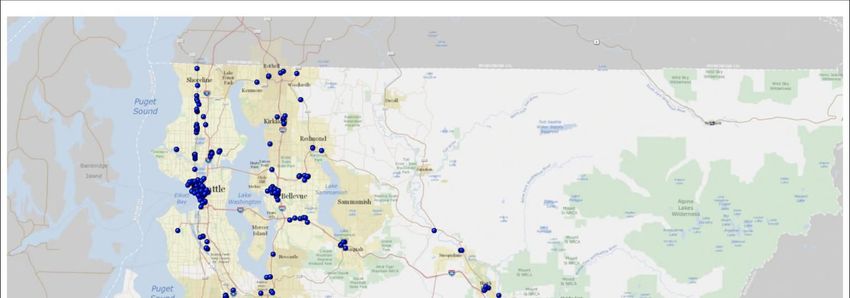
Maps
A GIS map of the area is included in this report. More detailed Assessor’s maps are
located on the 7th floor of the King County Administration Building and on the
Assessor’s website at www.kingcounty.gov/assessor.
Property Descriptions
All hotels and motels within King County.
Market Regions
The Hotel Specialty has been segmented into five market regions for King County. The
following is a brief description of each market region.
4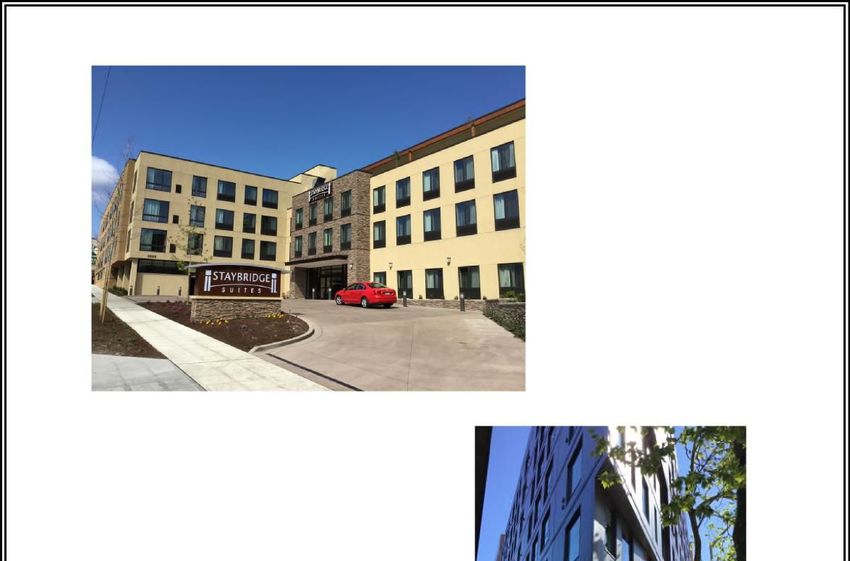
Downtown Seattle Hotels & Motels – 160-10

This is primarily the Seattle Central Business District geographic boundary. The region
extends from Lower Queen Anne on the north to Safeco Field on the south, from Puget
Sound on the west to Broadway on the East. There are presently 87 hotel and motel
parcels in this area which comprise 24% of the hotel-motel population. The overall
increase of the collective assessed values in the downtown market was 17.6%.

Greater Eastside Hotels & Motels – 160-20

This region is comprised of all properties located east of Lake Washington from the
Bellevue city limits all the way north to the county line. This includes Mercer Island,
Bellevue, Issaquah, North Bend, Snoqualmie, Kirkland, Redmond, Woodinville, and
Bothell. There are 77 hotel and motel parcels in this region which make up 22% of the
total hotel-motel population. The overall increase in the collective assessed values in the
Eastside market is 15.68%.

Northend Hotels & Motels – 160-30

All properties west of Lake Washington and from Capitol Hill north are in this region.
Most of the motels are located along the Aurora Strip. There are 40 hotel and motel
parcels in this area which account for 11% of the population. The overall increase in the
collective assessed values in the Northend market is 15.74%.

Seatac Hotels & Motels – 160-40

Properties located within West Seattle, SODO, Renton, Tukwila, Southcenter, and Seatac
generally describe this region. Many of the hotels and motels are along Pacific Highway
South, also called International Boulevard South. There are 95 hotel and motel parcels in
this area and they are 27% of the hotel-motel population. The overall increase of the
collective assessed values in the Seatac market was 16.1%.

Southend Hotels & Motels – 160-50

Properties located within Kent, Auburn, and Federal Way are in this region and south to
the Pierce County line. This area has 54 hotel and motel parcels that make up 16% of the
total hotel-motel population. The overall increase of the collective assessed values in the
southend market was 11%.

Hotel & Motel Types

Hotels and motels have been segregated into limited service and full service types. The
Assessor uses data from the Smith Travel Services (STR) Host Almanac to develop
income models. This is primarily for the expense portion of the income model. The
Average Daily Rate (ADR), Occupancy and Capitalization Rates are entered into the
model by the appraiser. These are derived from market data collected from the properties

                                                                                        5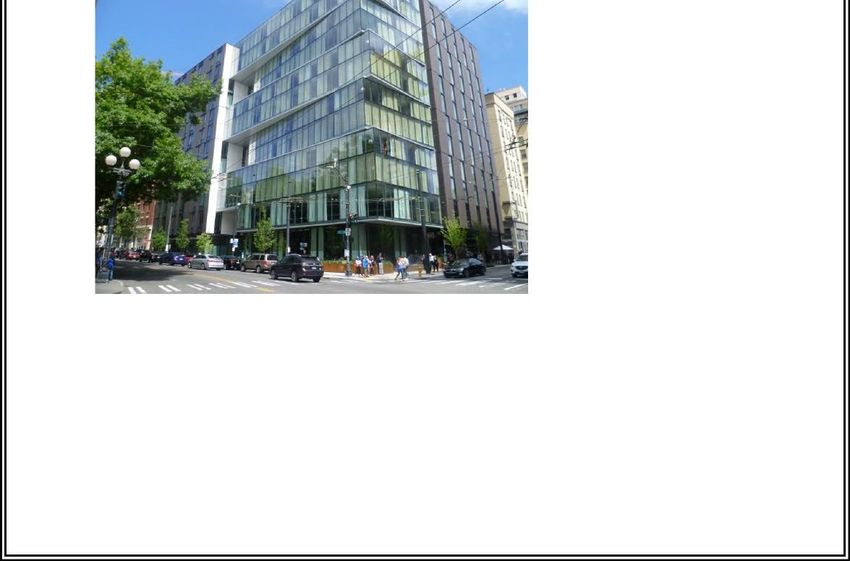
themselves, local market metrics, market reports, surveys sent by the Assessor and from
conversations with area brokers as well as property buyers and sellers. The following is a
brief description of each type of hotel or motel.

Limited or Select Service Hotels/Motels

Hotels with rooms only operation with limited or no restaurant food (other than free
breakfasts), typically no onsite bar or lounge, and no room service, are considered
limited service. Limited service properties typically do not offer full restaurant, lounge,
or banquet services. However, they may offer some of these services. Some have
meeting space but, not at the same scale of many full service hotels. Most limited and
select service hotels are very dependent on their chain affiliation for consumer
recognition, reservation contribution, and a perception of quality. There is one model for
this category based on Pacific Region data from the STR Host Almanac report as well as
locally surveyed data collected from local hotel/motel owners and managers, area
brokers, buyers and sellers.

Full Service Hotels/Motels

There are a wide range of full service hotels. Some have a basic restaurant, sometimes a
lounge, meeting space, and a minimum service and amenities level. Others have the full
suite of amenities including a quality restaurant and lounge, upper end exercise facilities,
a pool and whirlpool, valet parking, an onsite spa and more. There is one model for this
category of hotel based on Pacific Region data from the STR Host Almanac report as well
as locally survey data collected from local hotel/motel owners and managers, area brokers,
buyers and sellers.

Hotel Class Descriptions

Limited and select service generally refers to economy, budget or midscale lodging
facilities with limited or no food and beverage services however some limited and select
service hotels are upscale in caliber. Limited hotels typically do not have on-site
restaurants or other services that are provided by an employee other than the front desk
or maid services. They may typically offer continental breakfasts, vending machine
provisions, and/or small packaged items, Internet access or swimming pools are also
available in many of these establishments. Limited-service hotels are abundant in
numbers. These properties are less costly to construct and maintain. Food and beverage
services are sometimes less profitable due to high labor costs and supply associated with
food provisions. They appeal to budget conscious families and travelers who are willing
to forgo frills in exchange for lower room prices and they depend largely on leisure
travelers. A mid-market brand is one that offers a reasonable quality product at a lower
rate by cutting back on or eliminating multiple restaurants, meeting space, room service,
bell staff, concierge, business centers, fitness facilities, etc. However, the rooms
themselves can be comparable to those of more expensive full service lodgings. For the
most budget conscious traveler, a lesser market brand or independently owned limited
service motel offers a place to rest at marginal cost.

                                                                                         6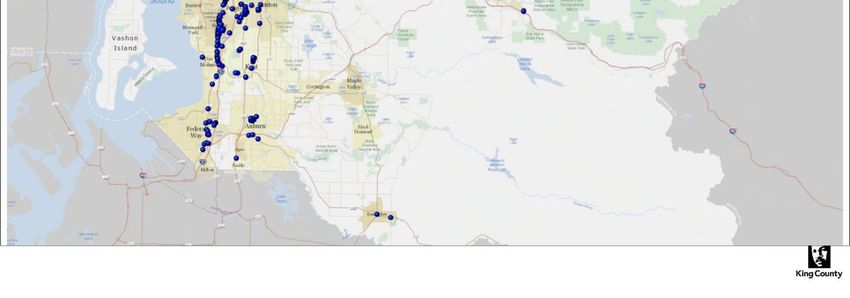
Select service properties, also referred to as focused service properties, are starting to
bridge the gap between limited and full service hotels. They may offer lunch or dinner in
addition to breakfast, a small bar, an expansive stack bar and other services beyond a
traditional limited service but not to the level of a traditional full service hotel. This
category has grown as the expenses are often much lower than that of a full service hotel
but with the added benefit of additional revenue from the aforementioned offerings.

Full service hotels offer a variety of services for their guests and nearly always include
one or more restaurants and typically a bar or lounge. This can include a basic or high
end restaurant (owned or leased out to a third party), espresso bars, lunch booths and
basic or trendy cocktail lounges. They typically provide room service. It is also
commonplace for larger full service hotels to have a range of retail stores on the premises
such as gift boutiques, newsstands and drug and beauty counters. Many full service
hotels offer guests laundry and valet services, swimming pools, beauty salons and fitness
centers or health spas. A small but growing number of hotel chains also manage
condominium units in combination with their hotel rooms, providing both hospitality
guests and condominium owner’s access to the same benefits and amenities. This can
equate to expanded benefits for both guest and owners alike.

The largest hotels have banquet quarters, exhibit halls, and ample ballrooms and
meeting rooms to accommodate conventions, business meetings, bridal parties and other
societal events. Conventions and corporate assemblies are major sources of revenue for
these hotels. Commercial hotels are also known as conference hotels and are fully self-
contained properties specifically designed for large-scale events. They provide physical
fitness and recreational facilities for attendees, in addition to state-of-the-art audiovisual
and technical equipment, a business center and banquet services. Large capacity
amphitheaters with laptop and electrical outlets have been built in some of the newer
hotels.

Full service lodgings, on the other hand, rely extensively on the business travel sector.
The most experienced and efficient general managers persistently procure corporate
contracts that improve occupancy during good times and shelter hotels during tough
economic cycles. These executives recognize that meeting quarters, business centers,
internet wireless access, convention type facilities, banquet space and general amenities
expected by the business travel sector are essential to the success of a full service hotel.
They also continuously adapt to the ever changing business world and devise innovative
techniques to stay at the forefront of the competition and realize the necessity of constant
maintenance and upgrade of furniture, fixture, and equipment known as soft goods and
hard case goods. Many brands require operators to upgrade these on a required time cycle
and meet a certain set of design specifications.

                                                                                           7
Economic Considerations
Puget Sound Economy
Employment: In 2015, Washington State’s1 year-over-year unemployment rate relatively
unchanged at 5.8%, which is .80% higher than what is reported nationally. For the Seattle
MSA (Seattle-Tacoma-Bellevue), unemployment remained unchanged at 5.10%. Within
King County, the overall year-over-year change in unemployment increased from 4.5% to
5.0%, while the City of Seattle also experienced an increase from 3.8% to 4.2%.
TOP 10 PUGET SOUND EMPLOYERS2
Rank Company Empl. Rank Company Emply.
1 Boeing 81,919 6 Amazon 24,700
2 Joint Base 56,000 7 Providence Health & 19,456
Lewis-McChord Services
3 Microsoft 43,031 8 Wal-Mart 19,350
4 Navy Region Northwest 43,000 9 Fred Meyer 15,450
5 University of 30,200 10 King County 13,400
Washington
The employment recovery is tied to the region’s diverse economy. Its strengths include
aerospace, software development including internet retail and gaming, and global trade. This
level is traditionally considered full employment.
In addition, a stable information-technology industry once anchored by Microsoft has
evolved into one of the largest high-tech clusters in the nation with Amazon.com
dramatically increasing its footprint in Seattle. Other major tech-related companies with
large real estate footprints in the Seattle area are Nintendo, Expedia Inc. and F5 Networks
1 Washington State Employee Security Dept. - Monthly Report
2 About Travel; March 2016
8Inc. Google and Facebook are also increasing their presence significantly in the area in order
to take advantage of the large pool of tech employees. The Puget Sound business climate and
lifestyle, which attracts a skilled, educated workforce, has encouraged these start-ups.3 In the
Seattle, metropolitan area the above average growth in tech employment has helped fill a glut
in vacant office space available after the “Great Recession” and has accelerated the recovery
of the office market.
International trade continues to have a strong impact on the regional economy. While foreign
exports were the first sector of the economy to recover, it has now slowed due to the sluggish
world economy. Boeing, with 75% of its airplanes going overseas, is the region’s top foreign
exporter. Besides Boeing, there are a wide list of regional businesses that provide products and
services for foreign markets. These include Microsoft, Weyerhaeuser, Paccar, Russell
Investments, Costco, Starbucks, Expeditors International, Perkins Coie, NBBJ, Alaska
Airlines, Port of Seattle, and the University of Washington.
Regional Summary
The Puget Sound Region has retained a comparatively strong economy, and remains a hotbed
for start-up businesses with a highly educated workforce. The region has generally
experienced expanding employment and increasing income levels which has materialized in
escalating property values in recent years. Within the Puget Sound region, market conditions
are favorable to the extent that substantial historic and current ongoing residential and
commercial development has resulted. Regional demographic trends favor increasing
population growth and in-migration reflect historic/continuing demand for commercial and
residential real estate in the area.
Population
Puget Sound: As of Year-End 2015, the population in the Central Puget Sound region
(King, Kitsap, Pierce, and Snohomish counties) reached +/- 3.89 million. The 2014
population level represents an increase of +5.63% from 2010 and +19.01% from 2000.
Since 2000, Snohomish County experienced the greatest population increase of 25.01%,
while King County had the largest increase since 2010 at 6.30%. As of 2015, King County
accounted for 52.65% of the total population within the four county regions. Since 2000,
King County’s population grew by 315,800 or 18.18% (1.21% per year).
% Change % Change
Current Population4 2000 2010 2015
2000-2015 2010-2015
King County 1,737,000 1,931,200 2,052,800 18.18% 6.30%
Kitsap County 232,000 251,100 258,200 11.29% 2.83%
Pierce County 700,800 795,200 830,120 18.45% 4.39%
Snohomish County 606,000 713,300 757,600 25.01% 6.21%
Region Total 3,275,800 3,690,900 3,898,720 19.01% 5.63%
Cities & Towns: About 2,757,190 people live within the incorporated area of the Central
Puget Sound region. As of 2015, incorporated cities and towns accounted for
3 CBRE Q4 2012 Puget Sound Area Office Market view
4 Puget Sound Regional Council; Puget Sound Trends, November 2015
9
70.7% of the total population. The changing shares reflect not only differences inpopulation growth among locations within the region, but also annexations and new
incorporations. At the top of the list of cities with the greatest percentage growth was
Kirkland, Kent, and Burien, with reported population growths of 71.1%, 46.5% and
33.0%, respectively.
Top 10 Cities With Greatest Percentage Population Growth (2010 to 2015)5
Population
Census Population Change % Change
Municipality County Annexed
2010 2015 2010-15 2010-2015
2010-2015
Kirkland King 48,787 83,460 34,673 71.1% 31,816
Burien King 33,313 48,810 15,497 46.5% 14,292
Kent King 92,411 122,900 30,489 33.0% 25,458
Bothell (all) King/Snohomish 33,505 42,640 9,135 27.3% 6,801
Port Orchard Kitsap 11,157 13,510 2,353 21.1% 943
Ruston Pierce 749 905 156 20.8% 0
Snoqualmie King 10,670 12,850 2,180 20.4% 0
Gig Harbor Pierce 7,126 8,555 1,429 20.1% 4
DuPont Pierce 8,199 9,250 1,051 12.8% 0
North Bend King 5,731 6,460 729 12.7% 98
The city with the greatest nominal population growth was Seattle (53,740), followed by
Kirkland (34,673), Kent (30,489), Burien (15,497), and Bellevue (12,637). Except for
Seattle and Auburn, the cities’ large growth was a result of major annexations. Like
Kirkland, Kent and Burien saw extraordinary growth as a result of major annexations that
incorporated a sizable population well over 10,000 people each in 2010 and 2011,
respectively. Seattle and Auburn’s growth was primary due from real population growth.
Top 10 Cities With Greatest Nominal Population Growth (2010 to 2015)6
Nominal Population
Census Population Change % Change Annexed
Municipality County
2010 2015 2010-15 2010-2015 2010-2015
Seattle King 608,660 662,400 53,740 8.8% 0
Kirkland King 48,787 83,460 34,673 71.1% 31,816
Kent King 92,411 122,900 30,489 33.0% 25,458
Burien King 33,313 48,810 15,497 46.5% 14,292
Bellevue King 122,363 135,000 12,637 10.3% 5,630
Bothell (all) King/Snohomish 33,505 42,640 9,135 27.3% 6,801
Renton King 90,927 98,470 7,543 8.3% 826
Auburn (all) King/Pierce 70,180 75,545 5,365 7.6% 0
Redmond King 54,144 59,180 5,036 9.3% 149
Sammamish King 45,780 49,980 4,200 9.2% 906
Lodging Market Conditions
Nationally, regionally and locally, the lodging market has continued to perform well and
many lodging properties in King County have surpassed their peak values from the 2006-
2008 era. The lodging market within King County continued to be one of the stronger in
the nation during 2015. In most neighborhoods in King County, Average Daily Rates
(ADR’s) have increased and Occupancy have maintained their performance from the
5 Puget Sound Regional Council; Puget Sound Trends, November 2015
6 Puget Sound Regional Council; Puget Sound Trends, November 2015
10
prior year or slightly increased. Cap rates are flat and even downward in some hotel
categories as further described in the cap rate table later in the report. Overall, downtownSeattle, South Lake Union, Ballard, the University District, downtown Bellevue, Eastgate,
Kirkland and Redmond are the stronger markets.
There are 54 hotel projects that have recently opened, have broken ground or are planned
in King County alone and several more in surrounding counties. A detailed list is noted
later in the report. These projects are a mix of local, national and international investors
with many of the infill projects in downtown Bellevue and downtown Seattle blending
office, apartment and retail space along with the hotel space to lower risk and improve
underwriting prospects.
Continued low interest rates, strong international investor demand, the announcement of
the convention center planning to double in size in the coming years and a very bullish
sentiment on the local lodging sector have all fueled growth in the Puget Sound lodging
sector. Certainly on the transaction side, we’ve seen evidence of this as some of the trades
on a per key basis have been staggering and the volume of sales has increased as some
investor’s cash in on multiple years of market value increases. A more detailed discussion
of area sales will be discussed later in the report.
The Seattle/Bellevue metropolitan area continues to be one of the more sought after
markets in the lodging sector according to several market reports. From an overall
market standpoint, the Seattle market has become so popular with domestic and global
investors that in interviews it is not unusual for it to be added to the list of top six
markets. Clearly, 2016 survey respondents feel the same way. Seattle has a diverse
industry base and is benefiting from growth in the TAMI industries. One interviewee
noted that Seattle is one of those markets where the growth has been strong enough, long
enough, that the only potential risk is being able to sustain its current pace.7
Hotels in Oregon and Washington, or the Pacific Northwest region, turned in an
astonishingly robust performance in 2015, especially in the largest markets in the
respective states. Seattle also has roughly 2,900 rooms under construction after the
delivery of more than 900 select-service rooms alone last year and a supply-induced dip
in occupancy in the finil two months of 2015. While supply growth will temper the pace
of future RevPAR gains, the local hotel sector has logged an increase in annual RevPAR
of more than 40 percent since 2011. Further growth in the daily rate will primarily drive
RevPAR in the near term, providing potential upsides to investors seeking to enter the
Seattle market.8
Persistent growth in leisure demand and business trips throughout the Pacific Northwest
will support additional gains in occupancy, ADR and RevPAR in the region this year.
Collectively, Oregon and Washington registered post-recession highs in principal
performance measures during the first three months of 2015. In Seattle, corporate
7
PWC Emerging Trends in Real Estate 2015
8
Marcus & Millichap Pacific Northwest Region 2016 Outlook Hospitality Report
11
demand will continue to grow through local company expansions and the opening of
facilities by several technology firms, including CenturyLink and SpaceX. Both Oregon
and Seattle will also benefit from growing Asian tourism due to favorable currencyexchange rates. The region’s robust performance drivers are also triggering more
transactions. A significant number of deals so far this year indicate owners are tapping
unfaltering investor interest and liquid debt markets to unlock the value that has
accumulated in properties. Interest is high in well-performing properties in all markets in
the region.
Occupied rooms jumped 6.5 percent in the first three months of 2015, topping the rate
of growth in the first quarter last year, to raise occupancy 280 basis points to 58
percent. The ADR in Seattle also rose 5.6 percent so far this year, while an increase in
available rooms held the gain in RevPAR to a still-respectable 8.0 percent during the
period. RevPAR increases in the market will continue to compress as new rooms come
online. At the end of the first quarter, more than 2,400 rooms were under construction
in the market and an additional 4,700 rooms were in final planning. Select-service
rooms account for half of the total in each phase.9
Per Kidder Mathews, market occupancy rates remained high in and near Seattle. In the
Seattle CBD, this was the fourth consecutive year with annual occupancy near 80%. High
rates of occupancy also were achieved in North Seattle, SeaTac, downtown Bellevue and
along the Issaquah-Eastgate corridor. Over the next three years, as new rooms open in the
central business districts of Seattle and Bellevue, occupancy rates in those markets are
expected to decline.
Hotel occupancy in and near Seattle has remained strong for several years. Room prices in
most urban markets are well above pre-recession levels. The number of significant hotel
sales in this region was the highest since the recession. Eight hotels were completed
during 2015, eight more are expected to open during the coming year, and at least 15 are
under construction.10
The highest rates of occupancy for 2015 were midscale hotels in Seattle’s South Lake
Union neighborhood, upscale hotels in downtown Seattle, and midscale hotels in both the
SeaTac and Issaquah/Eastgate submarkets. Strong occupancy and rising prices have made
Seattle a high-profile target for developers. Hotels are proposed or under construction in
the central business district, South Lake Union, Northgate, and the University District.11
According to the 2016 Smith Travel Services (STR) Host Almanac:
Seattle ranks #9 in the US for occupancy at 76% overall.
Seattle ranks #10 in the US for the highest ADR at $148 per night.
9
Marcus & Millichap Pacific Northwest Region 2015 Midyear Hospitality Research Market
Update Kidder Mathews Pacific Northwest Real Estate Market Review Q4 2015 Kidder
10 11
Mathews Pacific Northwest Real Estate Market Review Q4 2015
12 Seattle ranked #3 in the US for year over year increase in ADR at 8%.
Seattle ranked #15 in the US for year over year occupancy growth at 1%.
Pacific Region occupancy was 79.2% overall.
Pacific Region ADR was $198.53.
Pacific Region EBITA before reserves was 31.4% (as a % of gross revenue).
Pacific Region average room count per property was 244.
Pacific Region full service occupancy was 79.5%.
Pacific Region full service ADR was $218.28.
Pacific Region full service EBITA before reserves was 29.3%.
Pacific Region full service average room count was 339.
Pacific Region limited service occupancy was 78.5%.
Pacific Region limited service ADR was $133.15.
Pacific Region limited service EBITA before reserves was 46%.
Pacific Region limited service average room count was 127.12
U.S. hotel industry revenue topped an estimated US$189 billion in 2015, adding nearly
US$14 billion in revenue from 2014. Total industry-wide house profit reached US$73
billion, a year-over-year increase of +9.4% on a per-available-room basis. On an absolute
nominal basis, the house profit represents an all-time high, and the house profit margin
for 2015 exceeds the previous peak reached in 2007.
See following STR Host Almanac chart for an illustration:
12
2016 STR Host Almanac
13Last year, the HOST Almanac presented an extensive analysis of inflation-adjusted
profits for the industry. STR found that while profits on a nominal basis were at an all-
time peak, inflation-adjusted profits were strong, but still below previous peaks. In fact,
2014 profits were below the profit levels of six other years since 1990, after adjusting for
inflation. The following chart details U.S. hotel industry profitability (per-availableroom)
on a nominal basis from 1990 to 2015.13
Room revenue multipliers in 2015 ranged from 2.5 to 7.3, which was down compared to
the previous year across all classes, indicating a maturation of revenues. Upper upscale
and upscale experienced the sharpest decreases, falling 1.9 and 2.6 points, respectively.
The breakdown by asset class illustrates that room revenue multipliers increase by asset
class. Higher-end assets with food and beverage, spa, golf and other revenue sources tend
to have greater room revenue multipliers. However, this year with large decreases in
upper upscale and upscale, the luxury room revenue multiplier is roughly 1.5 to nearly 3
times higher than all other property types.14
13
2016 STR Host Almanac
14
2016 STR Host Almanac
14In 2015, REITs accounted for most of the hotel acquisitions with 34% of all transactions,
while hotel companies had the second most acquisitions with 22%. Only 2% of
acquisitions were purchased by foreign investors, though with a current influx of Chinese
capital into the U.S. hotel market, this number will continue to rise. Looking at
acquisitions by class, the greatest number of acquisitions were upscale properties with
32%, and then upper midscale with 28%. In the Upscale class, there were 194 deals and
27,741 rooms acquired, with an average price per room of $166,000. Midscale and Luxury
classes were the least acquired with only 4% and 7%, respectively.15
15
2016 STR Host Almanac
15There are several indicators that support the case for another strong King County
lodging market in 2015. The returned survey results of hotels and motels throughout
King County, the physical inspection meetings throughout South King County, and the
continued ground breaking of planned hotels in the county, show performance is
improving. This is the case for all five geographic neighborhoods, especially in the
midscale, upscale and luxury segments.
The total population of King County hotels and motels rose 17.75%. This is a sum of the
various valuations made throughout the five neighborhoods and various property types
within the hotel/motel specialty and does not include recently completed hotels or new ho
hotel sites. Adjustments to value for a given neighborhood or property type depend on
how their assessed value compared to fair market value after market analysis. Overall,
downtown Seattle and downtown Bellevue properties are performing incredibly well and
the secondary and tertiary markets continued to strengthen.
16Analysis Process
Effective Date of Appraisal: January 1, 2016
Date of Appraisal Report: June 29, 2016
Specialty and Responsible Appraiser
Specialty Area 160 – Hotels/Motels
The following appraiser did the valuation for this specialty assessment:
Name: Chris Savage
Job Title: Commercial Appraiser II
Highest and Best Use Analysis
As if vacant: Market analysis of this area, together with current zoning and current
anticipated use patterns, indicate the highest and best use of the majority of the appraised
parcels as commercial use. Any opinion not consistent with this is specifically noted in the
records and considered in the valuation of the specific parcel.
As if improved: Based on neighborhood trends, both demographic and current
development patterns, the existing buildings represent the highest and best use of most
sites. The existing use will continue until land value, in its highest and best use, exceeds
the sum of value of the entire property in its existing use and the cost to remove the
improvements. The current improvements do add value to the property, in most cases, and
are therefore the highest and best use of the property as improved. In those properties
where the property is not at its highest and best use, a token value of $1,000 is assigned to
the improvements and the property is returned to the geographical appraiser.
Standards and Measurement of Data Accuracy: Each sale was verified with the buyer,
seller, real estate agent or tenant when possible. Current data was verified and corrected
when necessary by field inspection, review of plans, marketing information, and rent rolls
when available.
Special Assumptions and Limiting Conditions
All three approaches to value were considered in this analysis.
Sales from 01/01/2013 to 12/31/2015 were considered in all analysis.
This report intends to meet the requirements of the Uniform Standards of
Professional Appraisal Practice, Standard 6.
17 No market trends (market condition adjustments, time adjustments) were applied to
sales prices. Models were developed without market trends.
Local Valuation Metrics
The ranges for key metrics for each specialty neighborhood were as follow:
Upscale/Upper
Economy & Budget Midscale Upscale Luxury
160-10 Occy 70% Occy 70-75% ADR Occy 72.5-75% Occy 75% ADR
Downtown ADR $55-90 $62.50-110 Cap ADR $115-209 $225-235 Cap
Seattle Cap Rate 8-9.25% Rate 7.5-8.25% Cap Rate 6.25-7.75% Rate 6.25%
Occy 50-70% Occy 62.5-72.5% Occy 67.5-72% Occy 75%
160-20 ADR $40-80 ADR $80-90 ADR $90-190 ADR $225
Eastside Cap Rate 7.75-8.25% Cap Rate 7.00-8.25% Cap Rate 6.25%
Cap Rate 8-
Occy 60-67% Occy 67-72.5% Occy 70-75% Occy N/A
160-30
ADR $45-72.50 ADR $72.50-85 ADR $125-161 ADR N/A
Northend
Cap Rate 9.25-9.75% Cap Rate 8.75-9.25% Cap Rate 6.75-8% Cap Rate
Occy 55-65% Occy 65-68% Occy 65-70% N/A
Occy N/A
160-40
ADR $45-67.50 ADR $70-80 ADR $85- ADR N/A
Seatac
Cap Rate 9.25-9.75% Cap Rate 8.50-9.25 125 Cap Rate
Occy 60-62.50% Occy 55-60% Occy 57-62% Occy N/A
160-50
ADR $42.50-70 ADR $60-80 ADR $90-125 ADR N/A
Southend
Cap Rate 9.5- Cap Rate 9-9.75% Cap Rate 8-9% Cap Rate
Market Sales
There were 43 hotel and motel sales given primarily consideration with three more mid-
2016 sales included in the sales used list as a point of reference. The sales are thoroughly
verified by the specialty appraiser and are then determined to be arms-length transactions
that are used for analysis or non-arm’s length transactions. Generally, non-arm’s length
transactions are not used however there are some that usable data can be gleaned. An
example would be a transaction that is influenced downward by a negative factors such as
a forced sale, bankruptcy or estate sale yet still shows a certain level of value even if at the
low range or below typical market rates. The lodging properties are not valued by the
market approach although the sales offer substantial support for appraised values and can
act as a bellwether for market trends in various neighborhoods.
Area 160-10 - Downtown Seattle
The most significant sale was the Hotel 1000, an upscale boutique hotel in downtown
Seattle. It sold for a record breaking $490,833 per key (adjusted for personal property) on
7/1/2014. The buyer was excited for the future prospects of the property and felt they
could increase the value even more through their operation of the property.
The next was the Motif, another upscale boutique hotel in the heart of downtown Seattle.
It sold for $385,818 per key on 6/19/2014 after being bought as the Red Lion on
6/14/2011 for $199,687 per key and undergoing a $20M+ renovation and conversion
18from a flagged to unflagged independent hotel. Both of these sales are a great example of
showing that a nationally known flag or brand isn’t need to command top dollar for a
hotel building.
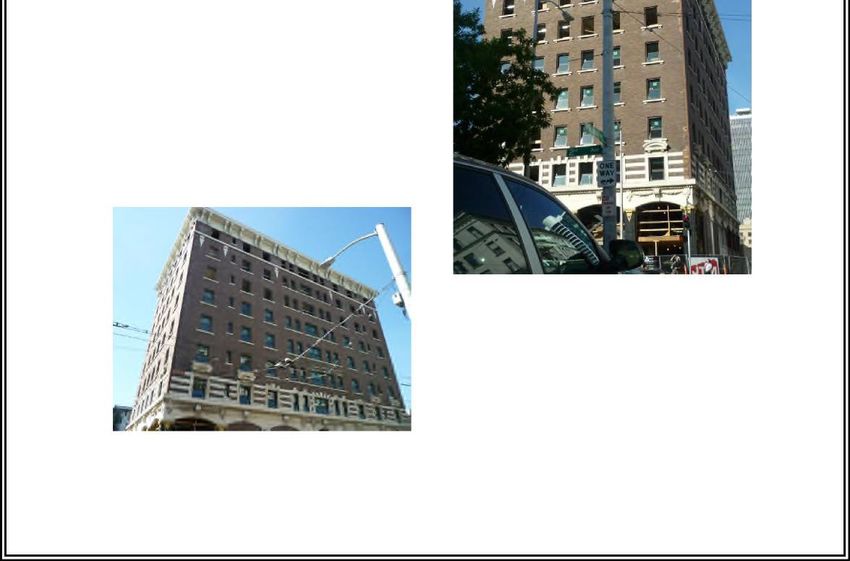
The Roosevelt Hotel sold as a value add hotel with plans for a $15-20M renovation to turn
it into a higher end boutique product. It sold for $245,033 per key.
On the limited service side, the La Quinta Inn & Suites sold to the Clise Family and they
plan to continue to operate it as a hotel. It sold for $227,083 per key. Also, the Quality Inn
& Suites commanded $119,497 per key along Aurora at the edge of South Lake Union
and Uptown. It sold on 11/5/2014 and the former indoor pool will be converted to lobby
or eating space.
There have been two notable sales in early 2016 with the Hotel 1000 selling for an area
record $685,520 per key with plans for remodeling and possible rebranding. Also, the
SpringHill Suites downtown Seattle sold for $316,667 per key.
Area 160-20 – Greater Eastside
There were several notable sales in 2015. The Heathman Kirkland Hotel sold for
$180,560 per key and is a full service, boutique hotel. The Red Lion in Bellevue sold for
$191,486 per key and is an Upscale, full service hotel that is a bit dated and due for a
major refresh. On the limited service side, the Days Inn in Eastgate sold for $101,429 per
key having sold in late 2013 for $70,476 per key.
The Residence Inn by Marriott Redmond Towncenter sold for $265,037 per key on
8/12/2014 showing continued strength in the Upscale Extended Stay segment. This
follows the 10/31/13 sale of the Residence Inn by Marriott near downtown Bellevue at
$307,117 per key.
There were also four early 2016 sales including the new Marriott Hotel Bellevue at
$456,894 per key, the Fairfield Inn & Suites near Microsoft for $225,917 per key, the
Sheraton Bellevue Hotel at $233,240 per key and the Comfort Inn Kirkland in the Totem
Lake neighborhood at $131,959 per key.
Area 160-30 – Northend
There were no new sales in 2015 and two notable lodging sales that occurred in 2014,
both on the limited service, economy class side of the market. The first was the
Shoreline Motel at $77,425 per key on 8/14/2014 (it sold for $70,000 per key on
5/31/2012). The second was the Orion Motel along the Aurora Corridor near 120th in
Seattle. It sold for $69,643 per key on 10/20/2014. Both show continuing strength for
the economy class for motels.
The Shoreline Motel then resold in early 2016 for $75,000 per key.
19Area 160-40 – Seatac
There were five new sales in this market in 2015. The first was on the limited service,
budget class Quality Inn Seatac Airport for $66,176 per key. Next was the Red Roof Inn,
a midscale building that sold for $89,382 per key. The next was Airlane Motel in Federal
Way for $52,100 per key. The third was the Super 8 Seatac at $71,218 per key. The next
was a newer midscale hotel, the Sleep Inn Seatac and it sold for $117,619 per key.
There was one notable sale in 2014. It was the Travelodge Airport North Motel just north
of the airport and north of the dense pocket of hotel and motels along International
Boulevard. There are just a handful of hotels and motels north of Highway 518 and the
Travelodge is one that hasn’t had the remodeling or updating that some others have hence
its price of $45,833 per key on 10/2/2014. This price point is the low end of the price
range for economy class motels.
In 2016 the Econolodge Airport, which is north of Highway 518 sold for $63,404 per
key. 160-50 – Southend
There were two new sales in 2015 in this area. The first was the Best Western Plus
Peppertree Inn in Auburn and it sold for $104,000 per key. The second was possibly at
the lower range of the market and was the Crossland Economy Studios (motel style
building) for $60,789 per key.
There were five sales that occurred in 2014 in the Southend area, four limited service
properties (both budget and economy) and one upscale, select service property. The
select service property that sold was the Courtyard by Marriott Federal Way at
$162,376 per key on 11/17/2014. This is the first higher end property in the Southend
to sell in recent years. The next sale was the Quality Inn & Suites in Pacific which sold
on 10/17/2014 for $54,561 per key after updates and rebranding of the building in
recent years.
The next was the Super 8 Motel in Federal Way at $49,056 per key on 10/9/2014. It has
since been rebranded into a limited service Red Lion with some remodeling done and
more planned in the near future. Next is the Econo Lodge Federal Way which sold for
$51,333 per key on 6/27/14. Given the quality of the building, it may have sold a bit low
as it was being sold to trade up to a larger hotel property by the local and experienced
hotelier owner.
Finally, the Holiday Inn & Suites in Kent sold at $64,800 per key on 5/14/2014. It has
since been rebranded as a Ramada Inn. In order to have kept the Holiday Inn agreement
intact, another level would have to have been added and the current site didn’t have had
enough parking to meet the Holiday Inn requirements. Thus it sold as a limited service,
budget class property and note that one building has interior halls and room entry and
another has exterior entry more like a motel concept.
20In 2016, the GuestHouse Inn in Enumclaw sold for $78,930 per key, The Legend Motel in
Des Moines sold for $55,167 per key and the Quality Inn & Suites in Pacific (south of
Auburn), sold for $59,649 per key.
New Projects
There are a large number of new hotel projects happening in King County. There are
currently 14,000 hotel rooms in downtown Seattle today16 and according to CBRE Hotel
Broker Chris Burdett, there are over 26 projects with about 6,000 rooms planned or under
construction in and around downtown Seattle. Of these, 4,850 rooms have financial
backing.
Regionally, there are 65 hotels planned or under construction. Burdett went on to say that
the hotel business here is “on fire” and is stronger than it was before the recession by most
measures. Tom Norwalk, president and CEO of Visit Seattle said the convention center
expansion will break ground in 2017 and be done in 2020. He added that new hotels
would make Seattle a candidate for a big event such as the Super Bowl. The NFL wants to
see about 25,000 rooms within an hour’s drive of the stadium and Seattle will likely meet
that requirement soon. 17
Throughout the county, several projects opened up in 2014 and 2015, others broke ground
and a number of others in the planning stages. As discussed earlier in the report, the
Seattle market is now one of the most sought after markets in the US for both lodging
projects and other commercial projects alike. There are global and domestic lodging
REIT’s, global lodging companies with well recognized brands, private equity funds,
partnerships and individual investors creating the development that is taking place.
The following table illustrates the list of 57 recently completed, current and future projects
in King County.
PROJECTS: PLANNED, UNDER CONSTRUCTION, RECENTLY COMPLETED
BRAND & ROOMS OR BREAKING EXPECTED
LOCATION
DEVELOPER PLANS GROUND COMPLETION
1,264 (45 stories,
Downtown Seattle on 105,000/SF of
R.C. Hendreen site of Greyhound meeting space, 505 2016 2017/2018
Station at 808 Howell underground
parking spaces)
Marriott;
White/Pepperman Downtown Bellevue at
384 2013 Opened 2015
200 110th Ave NE
Properties
16
Downtown Seattle Association
17
Daily Journal of Commerce Real Estate Buzz Article 2/2/15
21BRAND & ROOMS OR BREAKING EXPECTED
LOCATION
DEVELOPER PLANS GROUND COMPLETION
Hotel at Southport (Full Renton at Lake
350 (12 stories +
Service, 4 Star + 42,000 SF Washington
42,000/SF Fall 2014 2017
Convention Center); Seco Waterfront (next to
Development Coulon Park) convention center)
Downtown Seattle at
Residence Inn by Not
924 Howell (corner of 309
Marriott; Stonebridge Announced
Howell &Terry)
Stadium Place/Hilton
Embassy Suites; American Downtown Seattle at
297 (342 parking
Life Insurance & Daniels north parking lot of 2015 2016
stalls)
Real Estate Century Link Field
Downtown
Seattle/South Lake Not
Stanford Hotels Corp 283
Union at 300 Terry St. Announced
near Amazon.com
Holiday Inn Express & 279 (170 Rooms
Staybridge Suites; Abbey Downtown Bellevue at Holiday Inn; 109
2015/2016 2017
Road Group Land 969 118th Ave SE Rooms
Development Services Staybridge)
Downtown Seattle at
1200 Stewart at Not
Midby Companies 252
Stewart & Denny Announced
270 (two hotels,
Redmond at 152nd Ave
Overlake Village; CSM likely an extended
NE & NE 28th St near 2015 2017
Lodging stay & select
Microsoft service)
Hilton Garden Inn; Downtown Bellevue at 254 (6 stories, 187
West77 Partners & Mike Washington Square at underground 2015 2017
Nielson 965 108th Ave NE parking spaces)
245 (41 stories, 13
W Hotel Bellevue; Kemper Downtown Bellevue at hotel, 28 for 231 Summer 2015 Spring 2017
Development Company Lincoln Square apartments)
Esterra Park; Capstone Redmond near
250 Q1 2016
Partners Microsoft
Even Hotels & Staybridge Downtown 235 (9 stories, 90
Suites; Lowen Family Seattle/South Lake underground 2016 2017
Partnership Union at 527 Fairview parking spaces
234 (7 stories, 2
Marriott AC Hotel; DLR Downtown Bellevue at levels of
2015
Group 10628 NE 2nd St underground
parking)
Four Points by Sheraton Des Moines, Pacific
Hotel; Yareton Investment Hwy South & South 230 2013 Opened 2016
Fund 224th
22BRAND & ROOMS OR BREAKING EXPECTED
LOCATION
DEVELOPER PLANS GROUND COMPLETION
Downtown Seattle at
Luxury or Upper Upscale
1608 2nd Ave (2nd & 230 (16 stories) 2016/2017 2017
Hotel; Widewaters Group
Stewart)
Downtown Seattle on
Hilton Garden Inn at Boren between Stewart 222 Summer 2013 Opened 2015
Hill7; Touchstone & Howell
Seattle - University
Residence Inn by Marriott District at 4501 12th 215 2013 Opened 2016
Ave NE
208 rooms (58
Columbia West Properties Downtown Seattle at underground
N/A
& Pineapple Hospitality 1931 2nd Ave parking spaces; 10
bike spaces)
Downtown Bellevue at
Kemper Development Bellevue Square (South 204 2015 2017
Tower Expansion)
Downtown Seattle – 200 (229
Stanford Hotel Group
1903 5th Ave residential units)
Downtown Seattle/
7 story, 200 room Not
Citizen M South Lake Union at
modern hotel Announced
201 Westlake Ave
198 (Two 42 story
Extended Stay Type Hotel;
Downtown Seattle at towers w/830
HB Management (Antioch
2326 6th Ave apartments, 600
University Site) parking spaces)
Rainier Square Addition; Downtown Seattle at
150 (12 stories) 2015/2016 2017-2019
Wright Runstad Rainier Square
189 (370
Washington Place Southcenter apartments; 19 2015 2017
stories)
The Mark - SLS Hotel; Excavation
Daniels Real Estate Downtown Seattle at 184 (w/500,000+ 2013;
2017
Company & Stockbridge 5th & Columbia SF of office) Construction
Capital Group 2014-2015
Hampton Inn & Suites; Seattle – Northgate at 168; 136 Parking Early Stages
Late 2016/Early
Gramor Development 9550 1st Ave NE Spots + 15 offsite of MUP
Washington (Marie Calendars site) shared Process 2017
Downtown Seattle – 168 (14 stories,
SpringHill Suites; Hotel International District 100 apartments, 2016
Concepts at 616 8th Ave S 30 condos
Thompson Hotel &
Downtown Seatttle at
Apartments; Geolo Capital
1st & Stewart near Pike 161 2014 Opened 2016
& TC Real Estate
Place
Development
23BRAND & ROOMS OR BREAKING EXPECTED
LOCATION
DEVELOPER PLANS GROUND COMPLETION
Downtown Seattle at 151 (47 stories;
1929-33 5th Ave 394 apartments,
Douglason Development
(Former IBM 326 underground
Building) parking spaces
Hyatt Place; Ariel Seatac at 19518
150 2016/2017
Development International Blvd
Westlake Steps/Holland Downtown Seattle/
150
Partners South Lake Union
Downtown
Moxy byMarriott; Seattle/South Lake 147 (No parking Not
Stonebridge Union at 1016 spaces planned) Announced
Republican (At Boren)
145 (5 stories, 203
Downtown Issaquah at parking spaces via
Springhill Suites 2015 Mid 2016
12th and NW Maple 2 levels of above
grade parking)
Hotel Indigo/Potala Downtown Seattle at
142 2015 2017
Tower; Path America 2116 4th Ave
140 (5 stories, 143
Seattle – Northgate at underground
Swiss Hotel LLC 2015/2016 2016/2017
10733 Meridian Ave N parking spaces)
Home2 Suites by Hilton Tukwila – Southcenter 139 2014 Opened 2015
Hampton Inn & Suites Downtown Bellevue 128 2013 Opened 2014
Hyatt House; Kauri Downtown Seattle at
126 2013 Opened 2015
Investments 416 John St.
Homewood Suites by
Downtown Issaquah 123 2014 Opened 2015
Hilton; Rowley Properties
14 story boutique
hotel & apartment
Eitel Building; Ariel Downtown Seattle at /122 rooms, 44 Not
Development 2nd & Pike residential units & Announced
3,680 SF of
commercial space
Kemper Development Downtown Bellevue, Not
120
Company west of Bell Square Announced
Staybridge Suites Seattle – Seattle – Fremont at
120 2014 Opened 2015
Fremont 3926 Aurora Ave N
Downtown Seattle at Not
Principal Financial Group 120
2nd & Stewart Announced
24BRAND & ROOMS OR BREAKING EXPECTED
LOCATION
DEVELOPER PLANS GROUND COMPLETION
Downtown
Not
R.D, Olson Development Seattle/South Lake 113 room hotel
Announced
Union at 753 9th Ave N
100 (5 stories &
Dollar Development – Mercer Island at 7645
underground 2014
Hotel Mercer Sunset Highway
parking)
Downtown Seattle - 97 (conversion
Palladian Hotel; David Belltown at 2000 2nd from apartment Not
Opened 2014
Cohanim Ave building) Announced
Downtown Seattle at
RBF Property Group/SkB 78 (42 stories Not
1121 Stewart Street
Architects w/condos) Accounced
(Steward & Minor)
McMenamins Anderson November
Downtown Bothell 72 Opened 2015
School Project; $26M 2014
Seatac (63 room
Cedarbrook Lodge 63 2014 Completed 2015
expansion)
Boutique Hotel (Seven
Seas Building/Former Downtown Seattle – 43 (6 stories, no
2016 2017
Lusty Lady); Revolve 1315 1st Ave. parking planned)
Development
Downtown Seattle –
J&M Hotel; Seneca Pioneer Square at 201 24 N/A N/A
Ventures 1st Ave S.
4 stories, 15 rooms
Downtown Seattle at
Art Inn (Boutique hotel) & 1,400 SF of Not
1226 Jefferson (at 12th
Hybrid Development, LLC bakery & café Announced
& Jefferson)
space
Bel-Red Area of 520 Not
Wright Runstand 200,000/SF
Corridor Announced
Plans submitted to
Downtown Seattle at build a hotel Not
The Kress Building
3rd & Pike above current 3 Announced
story building
Port of Seattle; RFP’s Seatac Airport, Onsite
N/A N/A N/A
Requested in 2014 Hotel
Bellevue at 200 108th
Ave NE; site of Opus Purchased
Silver Cloud Inns & Hotels N/A
Bank Land
*Data compiled from local articles from the Daily Journal of Commerce, The Seattle Times, and The Puget Sound Business Journal
25The following are hotels that opened in King County in 2014, 2015 and early 2016.
Seattle
The Hilton Garden Inn at Hill7
opened up in the Denny Triangle
neighborhood. It is a full service,
contemporary property with 222
rooms.
The Thompson Hotel &
Apartments opened up. It is
a boutique hotel with 158
rooms and 95 apartments.
It’s at 1st and Stewart near
the Pike Place Market.
26The Residence Inn Seattle
University District is the
newest entry into the North
Seattle market and has 215
rooms. This market has
strong metrics and the
property expects to do well.
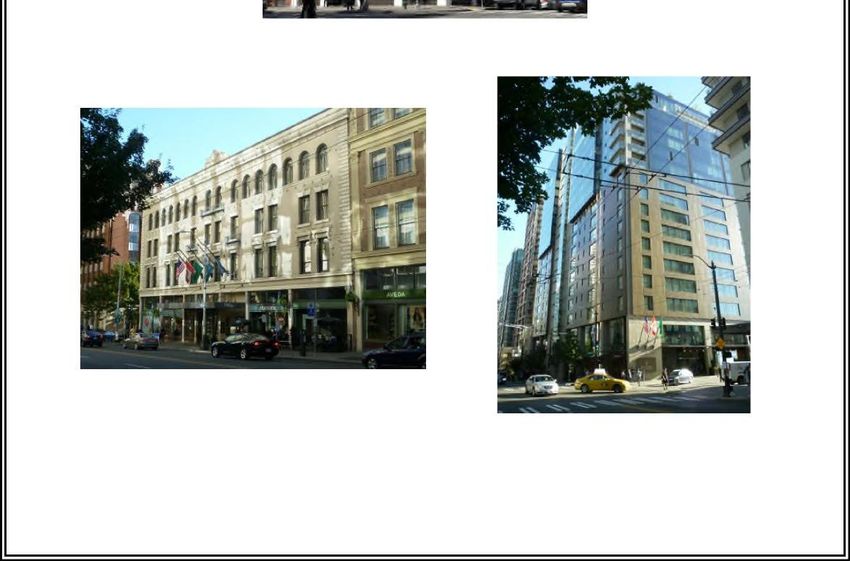
The Palladian Hotel in Belltown opened in
the fall of 2014 and was an older apartment
building that was completely gutted and
rebuilt to modern specs. It is a full service,
boutique hotel that is now one of the Kimpton
properties in the area. It has 97 rooms, a
restaurant and bar.
27Staybridge Suites Seattle –
Fremont opened in 2015. It is
an upscale, extended stay
hotel with full kitchens in the
rooms and is designed for
guests looking for longer
stays. It has 120 rooms and is
located in the Fremont
neighborhood just north of
downtown Seattle.
The Hyatt House Seattle/Downtown opened in
the summer of 2015. It is an upscale hotel with a
blend of standard rooms and extended stay
studios and one bedroom units with kitchens.
The
property
is also
focused
on
guests
that stay
longer than the average hotel guest and this is a
great fit for the Uptown location across the
street from the Space Needle given leisure
travelers and those on business dealing with the
Gates Foundation or the many technology or life
sciences organizations just blocks away in
South Lake Union.
28Eastside
The Hampton Inn & Suites
in downtown Bellevue
opened in 2014. It is an
upscale, extended stay
hotel with in suite kitchens
aimed at clientele that will
stay longer than one or two
nights. It has 128 rooms
and is in an excellent
location next to the 4th
Street Exit off 405 in
Bellevue.
The Marriott Hotel in
downtown Bellevue opened
in the summer of 2015. It is
a 384 room, full service,
upscale hotel.
29The Homewood Suites
by Hilton Seattle –
Issaquah opened in the
summer of 2015. It is
an upscale, extended
stay hotel with
kitchens in each room
and designed for
guests looking to stay
longer than average. It
has 123 rooms and
onsite parking.
Southend
The Cedarbrook Lodge in Seatac
completed a 65 room expansion in
2015. The full service, conference
retreat style hotel now has 167 total
rooms.
30The Puget Sound’s first Home2
Suites by Hilton opened in the
summer of 2015 in the Southcenter
area of Tukwila. It is a trendy, Gen
Y focused extended stay hotel with
full kitchen in each room. It has
139 rooms.
The Four Points by Sheraton
Airport Seattle South Hotel
opened in Des Moines. It is
an upscale hotel with 225
rooms and will compete
with nicer Seatac hotels to
the north.
Capitalization Rates
In 2015, capitalization rates were relatively flat on a national scale and had decreases in
the Seattle region depending on the hotel class and type. Overall, national capitalization
rates were between 0.05% and 14.20%, Western Region rates were 6.00% to 10.00% and
in the Seattle area the range was 6.00% to 9.25% per the compilation of below sources.
Keep in mind that some properties trade outside these ranges and several King County
area sales traded in the 1.00% to 3.00% cap rate range based on Value = Net Operating
Income/Capitalization rate formula. The Heathman Hotel in Kirkland and Hotel 1000
sales are examples. The operating data was gathered during recent valuation and these
low cap rates were confirmed by the hotel specialty appraiser.
312014 HOTEL/MOTEL CAPITALIZATION RATES
AVERAGE PRIOR YEAR
SOURCE DATE TYPE
RATE/RANGE RATE/RANGE
Year End Full Service Incl. Luxury – 6.40% 6.70%
HVS
2015 US (2.40% - 9.90%) (0.05% - 10.90%)
Year End Select Service & Extended 8.20% 7.80%
HVS
2015 Stay–US (5.00% - 14.0%) (3.20% - 12.60%)
Year End 9.20% 9.00%
HVS Limited Service – US
2015 (1.10% - 13.30%) (0.03% - 30.00%)
CBRE Cap Rate Second Greater Seattle Area CBD: 5.75% 6.25%
Survey Half 2015 Luxury Hotels (5.50% - 6.00%) (6.00% - 6.50%)
CBRE Cap Rate Second Greater Seattle Area 6.50% 7.00%
Survey Half 2015 Suburban: Luxury Hotels (6.00% - 7.00%) (6.50% - 7.50%)
CBRE Cap Rate Second Greater Seattle Area CBD: 6.00% 6.50%
Survey Half 2015 Full Service (5.75% - 6.25%) (6.25% - 6.75%)
CBRE Cap Rate Second Greater Seattle Area 7.25% 7.25%
Survey Half 2015 Suburban: Full Service (7.00% - 7.50%) (7.00% - 7.50%)
CBRE Cap Rate Second Greater Seattle Area CBD: 6.25% 6.75%
Survey Half 2015 Select Service (6.00% - 6.50%) (6.50% - 7.00%)
CBRE Cap Rate Second Greater Seattle Area 7.625% 7.625%
Survey Half 2015 Suburban: Select Service (7.25% - 8.00%) (7.25% - 8.00%)
CBRE Cap Rate Second Greater Seattle Area CBD: 8.00% 8.00%
Survey Half 2015 Economy (7.50% - 8.50%) (7.50% - 8.50%)
CBRE Cap Rate Second Greater Seattle Area 8.75% 8.75%
Survey Half 2015 Suburban: Economy (8.25% - 9.25%) (8.25% - 9.25%)
Year End National Lodging – Full
IRR Viewpoint 7.92% 8.14%
2015 Service
Year End National Lodging –
IRR Viewpoint 8.54% 8.78%
2015 Limited Service
Year End Seattle Lodging – Full
IRR Viewpoint 6.80% Average 7.00% Average
2015 Service
Year End Seattle Lodging – Limited
IRR Viewpoint 8.00% Average 8.25% Average
2015 Service
Situs RERC Real Hotels – Seattle First-Tier
Estate Report Q4 2015 Investment Properties 7.00% 7.00%
Going-In Rate
Hotels – West Region
Situs RERC Real 7.40% 7.80%
Estate Report Q4 2015 First-Tier Investment (6.00% - 9.00%) (6.30% - 10.00%)
Properties Going-In Rate
Hotels – West Region
Situs RERC Real 2015 Second Tier Investment 7.90% 8.50%
Estate Report Q4 (6.50% - 9.50%) (6.00% - 10.00%)
Properties Going-In Rate
Hotels – West Region
Situs RERC Real 8.80% 9.50%
Estate Report Q4 2015 Third Tier Investment (7.00% - 10.50%) (7.80% - 11.00%)
Properties Going-In Rate
32You can also read