RESPONSE TIME TO FLOOD EVENTS USING A SOCIAL VULNERABILITY INDEX (RETSVI) - NAT. HAZARDS EARTH SYST. SCI.
←
→
Page content transcription
If your browser does not render page correctly, please read the page content below
Nat. Hazards Earth Syst. Sci., 19, 251–267, 2019
https://doi.org/10.5194/nhess-19-251-2019
© Author(s) 2019. This work is distributed under
the Creative Commons Attribution 4.0 License.

Response time to flood events using a social
vulnerability index (ReTSVI)
Alvaro Hofflinger1,2 , Marcelo A. Somos-Valenzuela2 , and Arturo Vallejos-Romero1
1 Nucleo   de Ciencias Sociales, Universidad de la Frontera, Temuco, 4780000, Chile
2 Butamallin   Research Center for Global Change, Universidad de La Frontera, Temuco, 4780000, Chile

Correspondence: Marcelo A. Somos-Valenzuela (marcelo.somos@ufrontera.cl)

Received: 3 November 2017 – Discussion started: 21 November 2017
Revised: 17 December 2018 – Accepted: 8 January 2019 – Published: 28 January 2019

Abstract. Current methods to estimate evacuation time dur-         quency and severity of climate-change-related natural disas-
ing a natural disaster do not consider the socioeconomic and       ters are expected to increase faster than risk reduction can be
demographic characteristics of the population. This article        achieved (UN, 2009). For example, worldwide natural dis-
develops the Response Time by Social Vulnerability Index           asters caused around USD 3.5 trillion in damages from 1980
(ReTSVI). ReTSVI combines a series of modules that are             to 2011, with a third taking place in low- or middle-income
pieces of information that interact during an evacuation, such     countries and the number of people affected by natural dis-
as evacuation rate curves, mobilization, inundation models,        asters increasing 1.5 times, economic damage 1.8 times, and
and social vulnerability indexes, to create an integrated map      total deaths doubling (Basher, 2006; Hallegatte, 2014).
of the evacuation rate in a given location. We provide an ex-         A key strategy to reduce the loss of human life during
ample of the application of ReTSVI in a potential case of a        a disaster is to improve community preparedness. A com-
severe flood event in Huaraz, Peru. The results show that dur-     mon means to achieve this is to develop early warning sys-
ing the first 5 min of the evacuation, the population that lives   tems (EWSs) to alert the population to evacuate before dis-
in neighborhoods with a high social vulnerability evacuates        aster strikes. Ideally, EWSs should consider not only the so-
15 % and 22 % fewer people than the blocks with medium             called physical dimensions such as exposure and intensity,
and low social vulnerability. These differences gradually de-      but also the human or social dimensions that help us un-
crease over time after the evacuation warning, and social          derstand differences in response to similar stresses (Basher,
vulnerability becomes less relevant after 30 min. The results      2006; Bouwer, 2011; Nagarajan et al., 2012; Nicholls and
of the application example have no statistical significance,       Klein, 1999). Individual characteristics such as race, age,
which should be considered in a real case of application. Us-      gender, education, income, and type of job influence the sus-
ing a methodology such as ReTSVI could make it possible            ceptibility to exposure of certain groups or communities and
to combine social and physical vulnerability in a qualitative      also define their ability to respond to a natural hazard (Cut-
framework for evacuation, although more research is needed         ter et al., 2003; Gaillard and Dibben, 2008). For example,
to understand the socioeconomic variables that explain the         women and men or those people with different levels of phys-
differences in evacuation rate.                                    ical and cognitive ability experience and respond to disas-
                                                                   ters differently (Cutter and Finch, 2008; Ionescu et al., 2005;
                                                                   ISDR, 2004; Santos and Aguirre, 2004). Despite the evi-
                                                                   dence, the literature focuses mainly on the physical dimen-
1   Introduction                                                   sion of natural hazards and disregards the human aspects. A
                                                                   real improvement in our understanding of emergency evacu-
The costs associated with health, food security, and the           ations will depend on the integration of both (Basher, 2006;
physical environment produced by climate change are ex-            Couling, 2014; Santos and Aguirre, 2004).
pected to reach between USD 2 and 4 trillion by 2030 (Hal-
legatte, 2014). The United Nations has indicated that the fre-

Published by Copernicus Publications on behalf of the European Geosciences Union.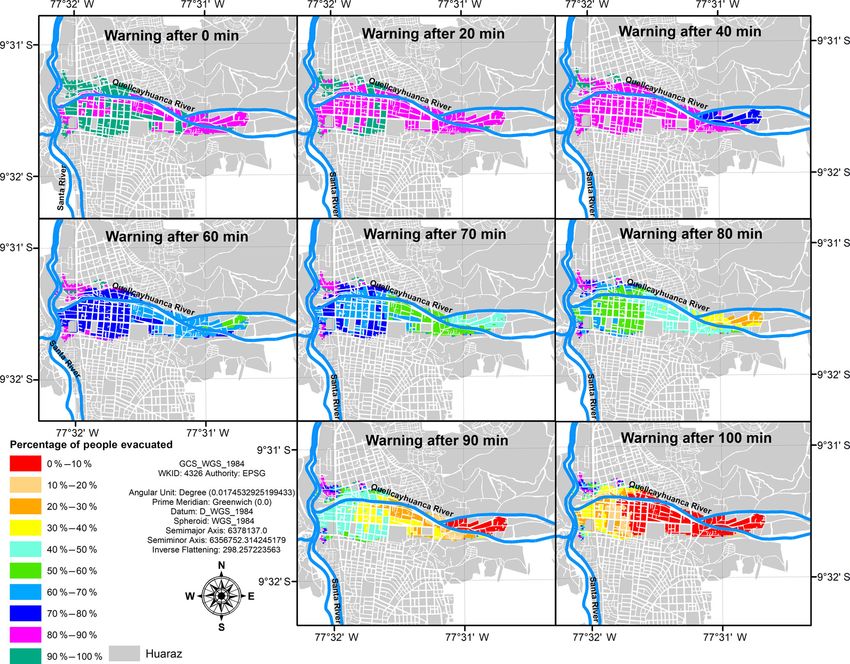
252                                                                       A. Hofflinger et al.: Response time to flood events

   The real issue is how to incorporate social and physical       and social problems became clearer at that time (Cutter and
vulnerability comprehensively to improve our understanding        Emrich, 2006). Today, the concept has broadened to include a
of an evacuation process. Both concepts have been developed       more comprehensive approach that combines different areas,
independently in the social sciences and engineering; there-      such as social, demographic, economic, and geographic vul-
fore, linking them is not a straightforward process. In fact,     nerability, but each discipline defines the concept differently
there are few data on how social vulnerability influences the     (Alwang et al., 2001; Balica, 2012; Birkmann, 2007). For ex-
evacuation process and how it is linked to the number of hu-      ample, in the economic literature, vulnerability includes food
man casualties (Bolin, 2007; Morss et al., 2011). To address      security and sustainable development (Fekete, 2012; Rygel et
this problem, some scholars have mapped physical and so-          al., 2006). In the disaster risk community, vulnerability is de-
cial vulnerability to visualize how they overlap. They have       fined as the physical, social, and environmental factors that
also combined them using arithmetic operations such as mul-       increase the likelihood of a community being impacted by
tiplication or addition of social and physical vulnerability      hazards (Zhou et al., 2014); social vulnerability models in
indexes to create a unique indicator that includes both vul-      this area have been used to explain a community’s ability to
nerabilities to study evacuation (Chakraborty et al., 2005) or    face and recover from disasters (Chakraborty et al., 2005).
the recovery process after hazards occur (Cutter and Emrich,         Scholars have tried to understand whether a population’s
2006; Hegglin and Huggel, 2008). This information is still        socioeconomic and demographic characteristics are rele-
descriptive and provides policy makers, government institu-       vant to understanding why neighborhoods or communities
tions, or local governments with qualitative information to       respond differently during an evacuation, why some peo-
understand how a population would react in an evacuation          ple evacuate and others do not during disasters. Huang et
process. Therefore, questions such as what it means to live       al. (2016) analyzed 49 studies conducted since 1991 link-
in a neighborhood with high physical and social vulnerabil-       ing evacuations to hurricane warnings and they concluded
ity and, how much time will the population need to evacuate       that demographic variables have a minor or inconsistent im-
neighborhoods with high social vulnerability and low phys-        pact on household evacuations. In the case of floods, how-
ical vulnerability cannot be answered with the methods cur-       ever, we found few studies that seek to understand the re-
rently available in either social sciences or engineering.        lationship between evacuation and socioeconomic variables.
                                                                  For example, Henry et al. (2017) analyzed the relationship
1.1   Social vulnerability and natural disasters                  between income disparity and disaster information collec-
                                                                  tion, and the resulting impacts on people’s vulnerability after
Recent major natural disasters such as Hurricane Katrina          the 2011 Chao Phraya River flood in Thailand. They found
and the 2010 earthquake in Haiti have shown the relevance         that among different demographic and socioeconomic vari-
of integrating social vulnerability into risk management and      ables, income was the strongest predictor of the population’s
decision-making (Flanagan et al., 2011). This integration         decision to evacuate during the flood (p < 0.01). They con-
refers to identifying which problems exist where before a         cluded that “among those respondents affected by the flood,
natural disaster strikes, making it possible to take steps to     it could be seen that lower-income respondents had a higher
prevent possible damage (Schmidtlein et al., 2008). In this       tendency not to evacuate their homes”. Furthermore, Med-
context, a better understanding of how problems like segre-       ina and Moraca (2016) conducted a study to identify factors
gation, socioeconomic deprivation, and inequalities affect the    that influence the decision to evacuate upon flood warning by
type of response and the degree of resiliency of communi-         authorities in the province of Bukidnon, Philippines. They
ties affected by natural disasters is crucial. With this infor-   found that household income, measured as poverty, was a
mation, federal and local governments could be more effec-        significant factor to explain whether families will evacuate
tive in mitigating losses or improving community recovery         upon advice by local authorities.
(Cutter and Emrich, 2006; Heinz Center, 2002). The degree            Research on social vulnerability linked to natural haz-
to which communities and people are vulnerable to hazards         ards can be divided into two groups. The first group, “post-
is explained not only by proximity to potential natural dis-      disaster case studies”, tries to understand how natural disas-
asters, but also social characteristics such as socioeconomic     ters impact communities differently based on their level of
and demographic features that could exacerbate or lessen the      social vulnerability (Rufat et al., 2015). Most of the research
impact of a disaster (Chakraborty et al., 2005; Cutter et al.,    in this area uses qualitative methods, such as semi-structured
2000).                                                            interviews, focus groups, key informant interviews, and par-
   The study of vulnerability can be traced back to the early     ticipant observation (Działek et al., 2016). One of the main
1950s and 1960s in the field of behavioral sciences, the main     limitations of these studies is that their findings cannot be
objective of which was to understand the features of areas        generalized to aggregated levels such as regions, or countries.
that make them suitable to inhabit. During the 1970s, the         The second group is “geospatial modeling studies”. Scholars
US federal government was interested in the relationship          in this subfield primarily use quantitative methods and fo-
between social well-being and progress indicators; conse-         cus on creating maps or developing indexes to compare the
quently, the connection between socioeconomic inequalities        different levels of social vulnerability among communities,

Nat. Hazards Earth Syst. Sci., 19, 251–267, 2019                           www.nat-hazards-earth-syst-sci.net/19/251/2019/
A. Hofflinger et al.: Response time to flood events                                                                             253

regions or countries (Rufat et al., 2015). A central aim of         social vulnerability is related to poverty and health indexes,
developing techniques to quantify vulnerability is to reduce        age, and education level. At the community level, social vul-
gaps between theoretical concepts of vulnerability and the          nerability is affected by income distribution, access to eco-
decision-making process (Birkmann, 2007).                           nomic assets and qualitative indicators of institutional ar-
   There are multiple challenges in constructing an index to        rangements (Adger, 1999). Furthermore, Fekete (2010) iden-
measure the social vulnerability of a certain population. The       tified key variables that may explain the different levels of
most evident is the degree of subjectivity in the selection of      social vulnerability such as age group, gender, income, edu-
variables as well as the application and operationalization         cation, home ownership, social capital, and household size.
of vulnerability as a concept (Fekete, 2012). Furthermore,          Cutter et al. (2003) also included race and ethnicity, commer-
an index does not indicate the structure and causes of so-          cial and industrial development, unemployment, rural–urban
cial vulnerability; therefore, using a single factor to measure     residency, residential property, infrastructure and lifelines,
vulnerability might disregard the importance of particular          occupation, family structure, population growth, medical ser-
variables that are relevant to explaining social vulnerability      vices, social dependence, and special needs populations as
in a particular area (Rygel et al., 2006). In fact, a commu-        fundamental variables to quantify social vulnerability.
nity’s ability to cope with and recover from disaster seems
to also depend on other factors such as vigor, vitality, energy,
                                                                    1.2   Response time, evacuation and flood impacts
strength, etc., which are usually excluded from studies on so-
cial vulnerability (De Marchi, 2007; De Marchi and Scolo-
big, 2012). Despite these limitations, scholars have devel-         Multiple factors seem to affect people’s decision-making
oped indexes to quantify social vulnerability based on their        process to evacuate, including but not limited to risk percep-
interests. Some researchers use the percentage of women,            tion, beliefs, demographic characteristics, previous knowl-
racial groups, or average age as indexes to estimate different      edge, social networks, gender, age, and class (Elliott and
levels of social vulnerability (Harvey et al., 2016; Jonkman        Pais, 2006; Lindell et al., 2005; Mileti and O’Brien, 1992;
et al., 2009; Sadia et al., 2016). Other scholars use variables     Whitehead et al., 2000). Understanding what factors influ-
linked to social vulnerability as independent variables in re-      ence people’s decisions in an evacuation is relevant because
gression models (Działek et al., 2016); variables are simply        this information could help improve the evacuation process,
ranked from lowest to highest values (Flanagan et al., 2011)        for example, reducing the evacuation response time and con-
or using the weighted average to estimate social vulnera-           sequently decreasing the percentage of human casualties.
bility (Adger and Vincent, 2005). However, these indexes               The most sensitive cost of disaster is the loss of life;
have some limitations; namely, they use a limited number            nonetheless, a limited number of methods estimate the loss
of variables and do not consider the interrelationship among        of life due to natural disasters and only a few include so-
variables to quantify social vulnerability. To address this is-     cial vulnerability as an explanatory variable in their models
sue, researchers have employed strategies such as including         (Jonkman et al., 2008).
a higher number of variables to construct social vulnerability         In ocean and river floods, variables such as the percentage
indexes (SVIs) or estimating the connection among variables         of buildings collapsed and the proportion of people evacuated
theoretically linked to social vulnerability. In this area, one     seem to influence the number of human fatalities (Vrouwen-
of the most recognized indexes that has been applied in both        velder and Steenhuis, 1997). Other scholars take into ac-
the US and abroad is the Social Vulnerability Index (SoVI)          count the water level, flow velocity, possibilities for evacu-
(Cutter, 1996). The SoVI has been used in California, Col-          ation, flood hazard, and area vulnerability (Boyd et al., 2005;
orado, and South Carolina in the US and in countries such           Jonkman, 2001). In the case of dam break floods, Brown and
as England, Australia, Germany, and Norway (Zhou et al.,            Graham (1988) analyzed 24 major dam failures and flash
2014). The SoVI approach has been replicated in different           floods to estimate the number of lives lost as a function of
geographical settings and on different spatial and temporal         time available for evacuation and the number of people at
scales (Schmidtlein et al., 2008). The use of the SoVI is           risk, they found that time available for evacuation and popu-
relevant because the method makes it possible to compare            lation size are critical; similar results were found by DeKay
the spatial variability in socioeconomic vulnerability using        and McClelland (1993). Graham (1999) proposed that fatal-
a single index value. The SoVI can also be linked spatially         ity rates are functions of the severity of the flood, the amount
to physical aspects to calculate the overall vulnerability of a     of warning time, and the population’s understanding of the
specific place (Boruff et al., 2005).                               hazard. In another example, to estimate human casualties due
   SVIs are useful for detecting differences in social vulner-      to flood events, the U.S. Army Corps of Engineers developed
ability to flood events (Fekete, 2009). In particular, the SoVI     the Hydrologic Engineering Center’s Flood Impact Analysis
(Cutter, 1996) is adaptable to developing countries since it        (HEC-FIA). Models generally assume that people react the
can be constructed using census data from the study area.           same way during an evacuation process and do not consider
   The literature identifies several variables that contribute to   that people can respond differently based on their social vul-
social vulnerability (post-disaster). At the individual level,      nerability.

www.nat-hazards-earth-syst-sci.net/19/251/2019/                              Nat. Hazards Earth Syst. Sci., 19, 251–267, 2019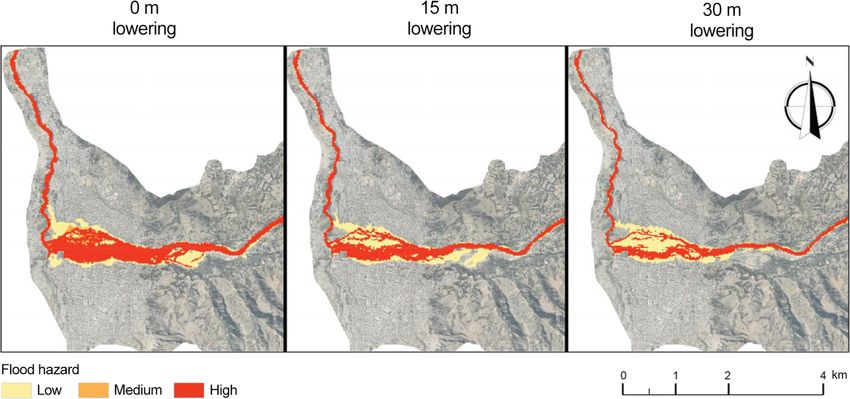
254                                                                          A. Hofflinger et al.: Response time to flood events

   Reiter (2001) incorporated some variables linked to so-
cial vulnerability such as the number of children and elderly
to estimate the loss of life during a flood event. Penning-
Rowsell et al. (2005) considered “people vulnerability” de-
fined by age, disability, or illness using census data. A gen-
eral conclusion from the literature explored is that only a few
of the methods studied have systematically included social
vulnerability as an explanatory variable of human fatalities
during natural disasters. In fact, Jonkman et al. (2008) re-
viewed 20 methods to quantify the loss of life during dif-
ferent types of flood events and found that only Ramsbot-
tom et al. (2004) included levels of population vulnerability,     Figure 1. ReTSVI chart.
and this category is based on expert judgment. Consequently,
even though there is an upward trend in research that endeav-
ors to understand how a population’s social characteristics in-    a populated area; and (3) demographic information such as
fluence human response to natural disasters, academics have        census data that allow us to categorize the population into
failed to incorporate social vulnerability into loss of life es-   different levels of social vulnerability. Then we have two in-
timations (Elliott and Pais, 2006; Rodriguez et al., 2007).        termediate models. The first corresponds to the mobilization
We argue that this is due to the lack of understanding of          model that combines the evacuation curves and the inunda-
how social vulnerability influences the evacuation process         tion model. The results of this step are three maps (one for
and human casualties (Bolin, 2007; Morss et al., 2011). In         each level of vulnerability) of the percentage of people that
fact, current methods to quantify social vulnerability allow       evacuate before the flood strikes a place. The second inter-
for the classification of neighborhoods, counties, or regions      mediate model is the calculation of the SVI using the census
from the lowest to highest levels of vulnerability. However,       data, which produces a map of the city where we can clas-
using these classifications scholars or policy makers cannot       sify each block by social vulnerability. Finally, we combined
predict how many people from neighborhoods with low vul-           the results (integration model Fig. 1) from the mobilization
nerability will evacuate versus those who live in neighbor-        model and the SVI calculations to generate a map with the
hoods with high vulnerability or how much time people who          percentage of people that can evacuate, which includes their
live in neighborhoods with medium vulnerability will take          social vulnerability level.
to evacuate versus those who live in highly vulnerable areas,
                                                                   2.2     Application of ReTSVI in a potential flood in
etc.
                                                                           Huaraz, Peru
   In order to have a methodology that enables researchers
and practitioners to include social vulnerability and test if      In 1941, the city of Huaraz was affected by a glacial lake
it has any impact on the evacuation process during a flood         outburst flood (GLOF) generated at Lake Palcacocha in the
event, we propose the Response Time by Social Vulnerabil-          Cordillera Blanca, Peru (Fig. 2). The GLOF killed approxi-
ity Index (ReTSVI), a methodology that incorporates the de-        mately 2000 people and damaged infrastructure all the way
mographic and socioeconomic characteristics of population          from the lake to the Pacific Ocean (Carey, 2010, 2005; Weg-
into current evacuation models.                                    ner, 2014). According to new observations and data, a new
                                                                   GLOF could occur at this location. In fact, Lake Palcacocha
                                                                   has been declared to be in a state of emergency several times,
2     Methods and data to estimate ReTSVI                          and there are currently initiatives to mitigate the risk by low-
                                                                   ering the water level and installing EWSs to protect the pop-
2.1    Conceptual model of ReTSVI                                  ulation in case a GLOF occurs (HiMAP, 2014). The phys-
                                                                   ical aspects of a potential GLOF have been studied exten-
The objective of this work is to propose a conceptual              sively with the support of international agencies such as US-
model – ReTSVI – a methodology that allows for the inclu-          AID, the Inter-American Development Bank (IDB), and the
sion of social vulnerability into the traditional evacuation–      government of Peru (Rivas et al., 2015; Somos-Valenzuela,
mobilization models and moves away from traditional meth-          2014, 2016). However, the social aspects of a flood hazard
ods that combine social vulnerability and hazard magnitude         have only been studied qualitatively (Hegglin and Huggel,
by ranking in a matrix system resulting in a qualitative as-       2008; Somos-Valenzuela, 2014).
sessment. Figure 1 is a chart of ReTSVI. We use three types
of input data: (1) evacuation curves, one for each level of        2.2.1    Input data
vulnerability (high, medium, and low); (2) a model that de-
scribes the physical hazard that the population may be ex-         To produce the ReTSVI we use three types of input data
posed to, for example, the time that a flood takes to reach        (Fig. 1). First, we need the evacuation curves, one for each

Nat. Hazards Earth Syst. Sci., 19, 251–267, 2019                              www.nat-hazards-earth-syst-sci.net/19/251/2019/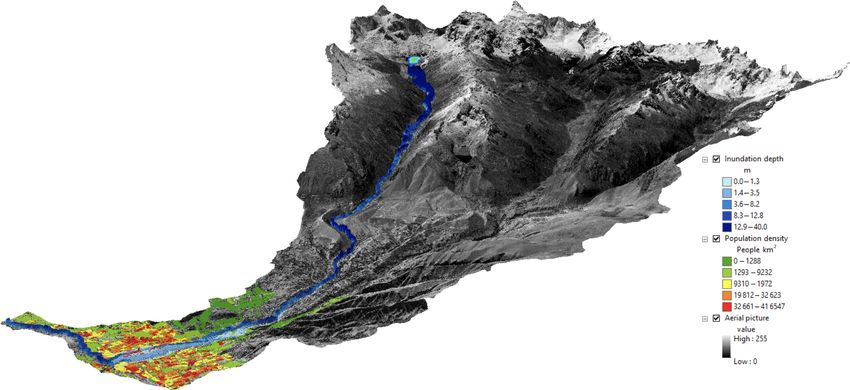
A. Hofflinger et al.: Response time to flood events                                                                                      255

Figure 2. Huaraz, Peru, at the bottom of the Cojup River. Lake Palcacocha, a potential source of a GLOF, is located at the head of the river.

level of social vulnerability. The evacuation curves that we             tsunami of 16 September, when the evacuation alarm was ac-
used are ideally generated in the study area; however, there             tivated, how long did it take the population living in areas of
are no data that describe how people in Huaraz evacuate af-              low, medium, or high social vulnerability to evacuate?” They
ter an EWS is released. Therefore, we had to generate this               needed to estimate the average evacuation time in neighbor-
information. Our closest available event was the tsunami trig-           hoods with low, medium, and high social vulnerability. Then
gered by an 8.3 magnitude earthquake on 16 September 2015                we asked “what is the percentage of the population that evac-
in Coquimbo, Chile. Second, a model describing a poten-                  uated in the first x minutes? (x = 5, 15, 30, 45, 60)”. The first
tial hazard is also needed; thus we use the model of a po-               responders wrote down the percentage of the population that
tential GLOF in Huaraz developed by Somos-Valenzuela et                  evacuated their homes from 0 to 5 min, 0 to 15 min, 0 to
al. (2016). This model provides the time that people have to             30 min, 0 to 45 min, and 0 to 60 min in neighborhoods with
react before the inundation arrives. Finally, we have the 2007           low, medium, and high social vulnerability in Coquimbo. The
census data provided by the Peruvian Ministry of the Envi-               answers were collected on two scales: percentages and aver-
ronment to create a social vulnerability map of Huaraz.                  age time (in minutes).
                                                                            We used the National Socioeconomic Characterization
Surveys in Coquimbo, Chile                                               Survey (CASEN)1 from 2015, the same year that the
                                                                         earthquake–tsunami occurred, to calculate a SVI at the mu-
We conducted 22 surveys with first responders regarding                  nicipality level following the same procedure identified in
the 8.3 magnitude earthquake and tsunami that occurred on                Sect. 2.2.3. This way we were able to identify the socioeco-
16 September 2015 in Coquimbo, Chile. Four institutions                  nomic and demographic characteristics of the neighborhoods
that work directly to help the population during the evacu-              with high, medium, and low social vulnerability in Chile.
ation process participated in this study: the navy, the police,          We incorporated this information in the survey so the first
firefighters, and the emergency office from the municipality             responders could identify which neighborhood belonged to
of Coquimbo. First, we contacted each institution by phone               which category; all responders generated separate curves for
to explain the purpose of the study and asked them if they               low-, medium-, or high-vulnerability neighborhoods.
would agree to participate in the study, and all did so. Then,
a research assistant visited each institution and asked them to
select at least five emergency experts to respond to our ques-
tionnaire. The main requirement was that the participants had               1 CASEN is a tool to describe and analyze the socioeconomic sit-
to have worked directly during the emergency to help peo-                uation of Chilean families, including housing, education, and labor
ple evacuate their houses. A research assistant conducted a              characteristics. This is a cross-sectorial survey, whose periodicity
survey with each participant. We asked the first responders              yields a time-based picture of the evolution of individual–household
“in your opinion and based on your experience during the                 welfare (Contreras, 2001).

www.nat-hazards-earth-syst-sci.net/19/251/2019/                                    Nat. Hazards Earth Syst. Sci., 19, 251–267, 2019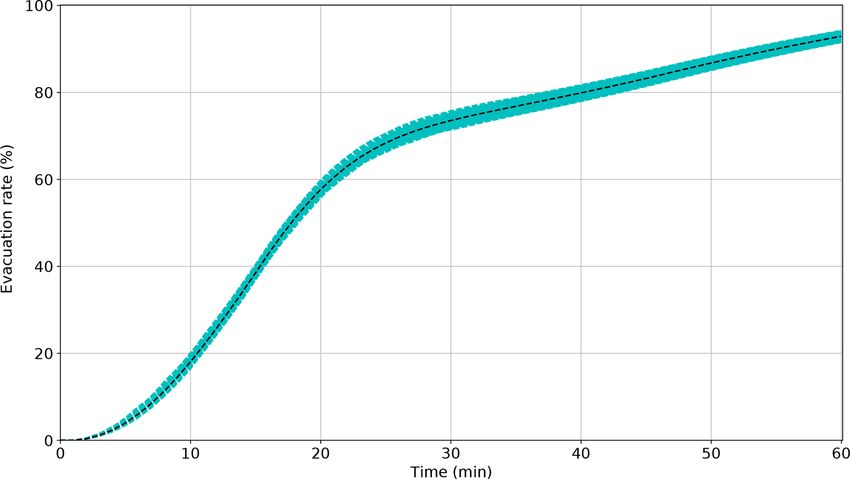
256                                                                            A. Hofflinger et al.: Response time to flood events

Census data from Peru                                               breach, the maximum TE is the time that a flood has to travel
                                                                    from the dam to the area of interest (Graham, 2009; Jonkman
We used the 2007 national population census to quantify the         et al., 2008; McClelland and Bowles, 2002). Then, we have
social vulnerability of Huaraz, Peru. The census has 53 ques-       the fraction of people who can find shelter (FS) within the
tions that describe the main sociodemographic characteris-          inundated area, and finally the number of people who can be
tics of the population of Peru (INE, 2015). The census data         rescued (Nres ).
are aggregated at block level and in the case of Huaraz pro-
vide full information on 1404 blocks. The census data are di-       Nexp = (1 − FE) · (1 − FS) · (Npar ) − Nres                   (1)
vided into three main categories: (a) location of household
                                                                    Since we are interested in the impact of social vulnerability
(blocks), (b) household characteristics (number of rooms,
                                                                    on the evacuation process, we reduce Eq. (1) to Eq. (2).
ownership, type of house, etc.), and (c) population charac-
teristics by block: age, religion, marital status, education, oc-   Nexp = (1 − FE) · (Npar )                                     (2)
cupation, etc. There are 245 variables available in these three
categories. Blocks without population are excluded from the         The model LifeSim provides a methodology for how to cal-
analysis.                                                           culate the FE (Aboelata and Bowles, 2005). We use LifeSim
                                                                    to illustrate how to apply our findings, but the accuracy of the
Flood model                                                         methodology is beyond the scope of this paper and requires
                                                                    further analysis. To calculate the proportion of people who
In this study, we used the inundation results obtained              escape we consider three processes: warning, mobilization,
by Somos-Valenzuela et al. (2016) that consider that an             and evacuation–transportation.
avalanche of rocks and ice could potentially fall into Palca-
cocha Lake and produce a chain of events that would lead            Warning
to flooding in Huaraz. From all the scenarios analyzed in
                                                                    Time is a key component of the evacuation process; there-
this study, we used the scenario in which an avalanche of
                                                                    fore, an efficient EWS is crucial to saving lives. However,
3 million cm3 falls into Palcacocha Lake producing a wave
                                                                    understanding the presence of an imminent threat is not a di-
that overtops the moraine dike and inundates Huaraz. In
                                                                    rect process. Equation (3) from Rogers and Sorensen (1991)
Fig. 3 (0 m lowering), we show the physical hazard map for
                                                                    is used to estimate the proportion of people who understand
that scenario with no mitigation.
                                                                    the alarm when they hear it or learn from others’ behavior
                                                                    that there is an imminent hazard and they need to evacuate.
2.2.2   Evacuation model
                                                                    dn
To estimate the percentage of people who evacuate we use               = k · (a1 · a1f · (N − n)) + (1 − k) · (a2 n · (N − n)),   (3)
                                                                    dt
the LifeSim model as a base framework. The Army Corps
of Engineers incorporated this model into the HEC-FIA               where
model (Lehman and Needham, 2009; USACE, 2012) to as-                  –   dn
                                                                              is the proportion of people who understand that there
                                                                          dt
sess evacuation during flood events. LifeSim has three mod-               is imminent hazard, and k is the percentage of people
ules: (1) warning and evacuation, (2) loss of shelter, includ-            alerted as a function of the broadcast system (Rogers
ing prediction of building performance, and (3) loss of life              and Sorensen, 1991);
calculation.
   To estimate the number of people that can perish during a          – (1 − k) is the proportion of people left to be warned
flood event, we need to divide the calculation into two main            (Rogers and Sorensen, 1991);
processes. First, we need to estimate the number of people
                                                                      – a1 is the effectiveness of the warning system (Table 1
at risk (Npar ) who cannot escape before a flood arrives, or
                                                                        from Rogers and Sorensen, 1991);
what it is known as the number of people exposed to risk
(Nexp ). Second, we need to calculate the percentage of Nexp          – a1f is the adjustment factor by location and activity (Ta-
who can survive once they are in the inundation zone. This              ble 2 from Rogers and Sorensen, 1991);
paper deals with the first process, the calculation of Nexp , by
including social vulnerability.                                       – a2 is the effectiveness of the contagion warning process
   Explaining why people evacuate faster, slower, or not at all         (Table 1 from Rogers and Sorensen, 1991);
is a process with many layers that is difficult to quantify. The      – N is the fraction that the system is designed to warn
literature describes marked processes that can be generalized           in the first 30 min after issuance of the warning, also
in Eq. (1). First, we need to know the fraction of people who           referred to in Table 1 from Rogers and Sorensen (1991),
can escape (FE), for which we need to know how much time                as the 30 min limit; and
people have to escape (TE) and how feasible it is that in TE
people can reach a safe area. For example, in a sudden dam            – n is the proportion of people warned.

Nat. Hazards Earth Syst. Sci., 19, 251–267, 2019                               www.nat-hazards-earth-syst-sci.net/19/251/2019/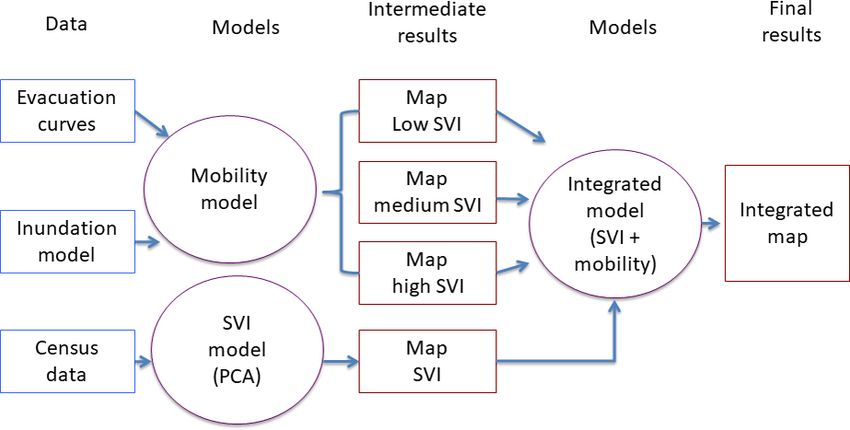
A. Hofflinger et al.: Response time to flood events                                                                                 257

Figure 3. This image corresponds to Fig. 9 from Somos-Valenzuela et al. (2016). Preliminary hazard map of Huaraz due to a potential
GLOF originating from Lake Palcacocha with the lake at its current level (0 m lowering) and for the two mitigation scenarios (15 and 30 m
lowering).

Mobilization process

After people understand that there is a threat, they start to
evacuate to a safe zone. Figure 35 from Aboelata and Bowles
(2005) defines mobilization curves, below which we show
the “improved” curves from the cited reference.
   HEC-FIA, which applies a version of LifeSim, includes
the activities in which people are involved at the moment of
a flood. To understand the impact of engaging in daily activi-
ties on the evacuation, we combined the warning penetration
(using sirens and tone alert radios) and the mobilization pro-         Figure 4. Evacuation rate during the first hour calculated using
cess, including the uncertainty bounds for both processes. In          1000 samples in a Monte Carlo simulation.
addition, a Monte Carlo simulation with 1000 samples shows
that the activity as described in LifeSim that people are en-
gaged in when the alarm is triggered does not keep the warn-           Escape
ing from penetrating.
   Although the emphasis of this work is to include social             In the example of the application of this methodology, we
vulnerability, it is pertinent to show a current methodology           assumed that people would walk at speeds ranging from 80
adapted by the U.S. Army Corps of Engineers to provide con-            to 187 m min−1 with an average of 107 m min−1 (Aboelata
text on how our data fit into state-of-the-art evacuation pro-         and Bowles, 2005). The shortest path was calculated using
cess assessments. Figure 4 illustrates that according to the           ArcGIS.
LifeSim and HEC-FIA models the activity that people are
doing when the alarm is released does not cause significant            2.2.3   Social vulnerability index
changes in the percentage of people mobilized. Therefore,
we will not include activities in our calculations when we             One of the main criticisms of the use of indexes to quan-
consider social vulnerability. Additionally, at the moment of          tify social vulnerability is the limited number of variables
the survey, we did not ask the first responder to quantify the         and the lack of connection and interrelationship among vari-
time people take to understand the alarm (warning penetra-             ables used by the indexes. To address these limitations, we
tion) nor the time it took them to get ready to evacuate (mo-          constructed a SVI by analyzing census data using a princi-
bilization). Therefore, the answers from the first responders          pal component analysis (PCA) following the methodology
correspond to the penetration and mobilization processes ag-           developed by Cutter et al. (2003). The main objective of a
gregated, which is equivalent to Fig. 4.                               PCA is to extract information from the variables and rep-

www.nat-hazards-earth-syst-sci.net/19/251/2019/                                  Nat. Hazards Earth Syst. Sci., 19, 251–267, 2019
258                                                                        A. Hofflinger et al.: Response time to flood events

Figure 5. First responder results by social vulnerability group.

resent this information as a set of new orthogonal variables       dardized to z scores z = x−u  σ . This creates variables with
called principal components (Wold et al., 1987). This tech-        a mean of 0 and standard deviation of 1. Finally, we used
nique allows for robust and consistent numbers of variables        the Bartlett’s test of sphericity to determine if the variables
that can be analyzed to estimate changes in social vulnerabil-     were suitable for structure detection. (2) The PCA was per-
ity over time (Cutter et al., 2003). To construct a SVI, we an-    formed with the standardized input variables (z scores). The
alyzed census data using a PCA. This is a multivariate tech-       number of components with eigenvalues of greater than 1
nique “that analyzes a data table in which observations are        were selected and the selection corroborated with a scree
described by several inter-correlated quantitative dependent       test. (3) The initial PCA solution was rotated. In our work we
variables” (Abdi and Williams, 2010). The main objective of        used a normal Kaiser varimax rotation for component selec-
a PCA is to extract information from the variables and rep-        tion. (4) The Kaiser–Meyer–Olkin (KMO) measure of sam-
resent this information as a set of new orthogonal variables       pling adequacy was calculated. (5) The resulting components
called principal components. For example, a PCA “provides          were interpreted as to how they may influence (increase or
an approximation of a data table, a data matrix, X, in terms       decrease) social vulnerability and signs were allocated to the
of the product of two small matrices T and P0 . These matri-       components accordingly. (6) The selected component scores
ces, T and P0 , capture the essential data pattern of X” (Wold     were combined into a univariate score using a predetermined
et al., 1987). The use of this technique allows for robust and     weighting scheme. The factors were named based on vari-
consistent numbers of variables that can be analyzed to esti-      ables with significant factor loading, usually greater than 0.3
mate changes in social vulnerability over time (Cutter et al.,     or less than −0.3. (7) Finally, we standardized the resulting
2003).                                                             scores to a mean of 0 and standard deviation of 1.
   We followed Schmidtlein et al. (2008), who listed seven            All the steps but step 7 were straightforward. In step 5,
steps to calculate the SVI. (1) First, we performed a mul-         we had to decide how we wanted to combine the different
ticollinearity test called the variance inflation factor (VIF).    components. The first criterion was to use the scores from
Variables with a VIF > 10 were excluded. Then, we normal-          the PCA, adding them but assuming that all the components
ize all variables as a percentage, per capita or density func-     had the same contribution to the SVI (Cutter et al., 2003).
tions. For the purposes of this paper, we normalized all vari-     The second criterion used the scores from the PCA but as-
ables as percentages; for example, the percentage of inde-         signed different weights to the principal components accord-
pendent houses per block or the percentage of elderly peo-         ing to the fraction of variability they explained (Schmidtlein
ple per block. Then all input (census) variables were stan-        et al., 2008). The third method also does not assume that

Nat. Hazards Earth Syst. Sci., 19, 251–267, 2019                            www.nat-hazards-earth-syst-sci.net/19/251/2019/
A. Hofflinger et al.: Response time to flood events                                                                                 259

Table 1. Parametric and nonparametric statistical difference test   Table 2. Bartlett test of sphericity.
among levels of social vulnerability.
                                                                                       Chi square                    4014.63
                Time        ANOVA      Kruskal–Wallis
                                                                                       Degrees of freedom                     190
                           (p value)        (p value)
                                                                                       p value                               0.00
                0–5 min        0.13              0.09
                0–15 min       0.44              0.39                                H0 variables are not intercorrelated.

                0–30 min       0.67              0.60
                0–45 min       0.85              0.87
                0–60 min       0.87              0.52               are not statistically significant (p value > 0.05). This could
                                                                    be due to the limited sample size. Consequently, we opted
                                                                    for the median rather than the mean as the middle point of
each component contributes equally to social vulnerability,         the distribution of the mean response time.
but in contrast to the second method, it multiplies each z
score by the factor load and then each component is multi-          3.2     Case study: hypothetical application case of
plied by its explained variance. We used the first criterion; in            ReTSVI in Huaraz, Peru
other words, we gave all the components the same weight.
The same was performed by Chakraborty et al. (2005), Chen           3.2.1    Social vulnerability index
et al. (2013), Cutter et al. (2003), Fekete (2009), and Zhang
and You (2014). Fekete (2011) provided a solid argument             Peru has a long history of mudflows generated from glacial
for using equal weighting, which avoids adding assumptions          lakes in the Cordillera Blanca. As global warming progresses
that are qualitative and mostly not empirically supported, al-      and glaciers start shrinking at a higher rate, this problem
though it may sound intuitive to use the loading factor or the      is growing. In some cases, glaciers leave behind a weak
variance explained by the factor to combine the variables se-       moraine that holds a large amount of water that can suddenly
lected. Moreover, Roder et al. (2017) argued that there is no       release and cause floods (for more details see Carey, 2010;
appropriate methodology for the calculation of the index.           Hegglin and Huggel, 2008; Somos-Valenzuela et al., 2016).
                                                                       Using the population census of Peru, Bartlett’s test of
                                                                    sphericity (Table 2), and a PCA, we identified 20 census vari-
3     Results                                                       ables grouped into six components that explained 57 % of the
                                                                    total variance of the variable in which we applied the PCA
3.1    Survey to first responders                                   to construct the SVI among all the neighborhoods in Huaraz
                                                                    (Table 3). The first component explained 20 % of the variance
Figure 5 shows the percentage of population that evacuates          and identified the wealth of each block measured by popula-
after the tsunami alarm has been activated in neighborhoods         tion with primary and college education, with health insur-
with high, medium, and low social vulnerability. Each box           ance, indigenous population, white collar jobs, and house-
presents the 75th percentile (upper hinge), the median (cen-        holds with five or more rooms. The elderly, women, and peo-
ter), the 25th percentile (lower hinge), and the outlier val-       ple with disabilities were grouped in the second component,
ues. Figure 5 indicates that neighborhoods with high social         which explains 9 % of the variance. The third component de-
vulnerability systematically evacuate fewer people than ar-         scribed variables linked to poverty such as illiteracy rates,
eas with medium or low social vulnerability; for example, the       the existence of informal settlements, and households with-
first 5 min after the alarm is activated, the median (percentage    out electricity. A total of 8 % of the variation in blocks was
of evacuation) for neighborhoods with high social vulnerabil-       captured by this component. The fourth component identi-
ity is 20 % and 40 % for medium and low social vulnerability.       fied home ownership and marital status; this factor explained
Figure 5 also shows that the differences in terms of the evacu-     7 % of the variance. The fifth component grouped neighbor-
ation percentage decrease over time and eventually disappear        hoods with high population density and workers in blue col-
after an hour after the alarm has been activated.                   lar jobs that are usually linked with a low income and inse-
   We test if the mean response time to the evacuation alarm        cure and more precarious working conditions. This compo-
among the three types of neighborhoods was statistically sig-       nent captured 7 % of the variation in blocks. Finally, the sixth
nificant using two methods: ANOVA (parametric method)               component identified children (< 1 year old) and the popu-
and Kruskal–Wallis (nonparametric method). Table 1 shows            lation working in the manufacturing sector; this component
that the p values between the response time and level of so-        explained 6 % of the variance.
cial vulnerability (low, medium, and high) are not statisti-           The resulting SVI ranges from −1.3424 to 1.365 with a
cally significant. All the p values are higher than 0.05 (alpha     mean of 0.03 and a standard deviation of 0.4367. As Fig. 6
level), and therefore we accept the null hypothesis that the re-    illustrates, most of the blocks located close to the Quellcay-
sponse times among the three groups of social vulnerability         huanca River exhibit a higher level of social vulnerability.

www.nat-hazards-earth-syst-sci.net/19/251/2019/                                Nat. Hazards Earth Syst. Sci., 19, 251–267, 2019
260 A. Hofflinger et al.: Response time to flood events
Table 3. Summary of PCA results.
Selected census variables after PCA analysis Sign Components
to estimate social vulnerability index (SVI) adjustment 1 2 3 4 5 6
Household with five or more rooms 0.31
Population with health insurance 0.40
Population with primary education −0.37
−
Population with college education 0.43
Population with “white collar” jobs 0.40
Indigenous population −0.35
Population with disabilities 0.53
Population over 65 years of age + 0.53
Women 0.44
Informal settlement 0.74
Household without electricity + 0.41
Illiterate population 0.33
Independent houses 0.56
House rented − 0.53
Adult population divorced −0.57
Jobs in the commerce sector 0.61
Jobs in the construction sector + −0.33
Number of people per square kilometer 0.52
Children under 1 year of age + 0.59
Jobs in the manufacturing sector 0.66
Percentage of variance explained by component 20 % 9% 8% 7% 7% 6%
Cumulative explained variance 20 % 29 % 37 % 44 % 51 % 57 %
Conversely, those blocks concentrated in the south of the city the evacuation process (Fig. 8). In both cases, we estimated
(away from the Quellcayhuanca River) are less vulnerable. the percentage of people who would evacuate if the alarm
Finally, the population who lives upriver, north of Huaraz, were sounded at 0, 20, 40, 60, 70, 80, 90, and 100 min after
presents a middle level of vulnerability with a combination the inundation starts traveling from Palcacocha Lake toward
of medium-low and low levels of social vulnerability. Huaraz.
The proportion of high-, medium-, and low-vulnerability An obvious but no less important finding is that as the
blocks within the inundation zone are 15 %, 35 %, and 50 %, alarm is delayed the population has less time to escape. The
respectively. results also suggest that social vulnerability has a greater im-
pact when the warning alarm is delayed. After 60 min, Fig. 8
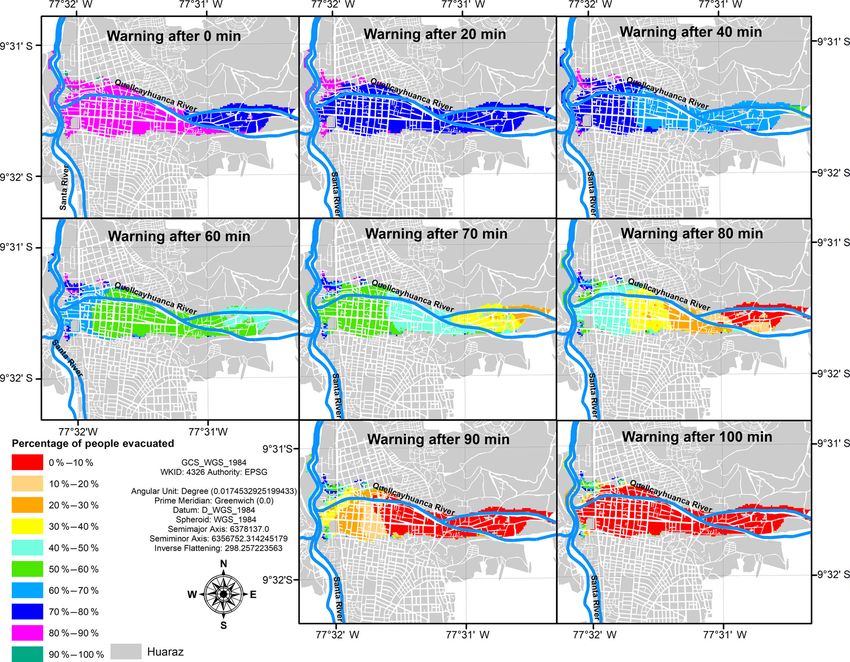
3.2.2 Evacuation process gets patchier, which indicates that the population has differ-
ent evacuation rates, even though they have a similar amount
We calculated the percentage of people that could evacuate of time to respond. Also, when we use information from the
after a GLOF from Palcacocha Lake, Peru. An ideal EWS first responders, the evacuation is faster than when we use
would trigger an alarm as soon as the hazard is detected. empirical equations from LifeSim. The finding that evacu-
However, the protocols normally require that multiple sen- ations were completed more rapidly with the earthquake–
sors be checked in order to avoid a false positive error. This tsunami response data than with the LifeSim equations is due
process delays the alarm’s release, consuming important time to the fact that, as long as the local population recognizes
that could otherwise be used for the population to begin evac- earthquake shaking as a tsunami warning cue, the shaking
uating. We used two methodologies to estimate the propor- is an instantaneous broadcast mechanism (see Lindell et al.,
tion of inhabitants who can leave their household before the 2015; Wei et al., 2017). In those situations, k tends to 1 in
hazard strikes. First, we used the empirical equations de- Eq. (3), which makes the time-consuming contagion process
scribed in the methodology, in which we assumed that differ- less important.
ent groups react and evacuate homogeneously (Fig. 7). Sec-
ond, we used the information provided by the first respon-
ders, census data, and SVI to include social vulnerability in
Nat. Hazards Earth Syst. Sci., 19, 251–267, 2019 www.nat-hazards-earth-syst-sci.net/19/251/2019/A. Hofflinger et al.: Response time to flood events 261
Figure 6. Comparative vulnerability of blocks in Huaraz using the social vulnerability index (SVI).
4 Discussion rate falls between 50 % and 70 %, in 30 min it falls from
80 % to 90 %, and after an hour it is close to 100 %. These
aggregated evacuation curves for tsunamis are faster than the
This paper proposes a methodology to integrate social vul- results from Eq. (1) (Fig. 4) and the results from Abolaeta et
nerability into the calculation of the evacuation rate after an al. (2003) that deal with rivers and dam break floods, suggest-
EWS is activated. We developed the ReTSVI methodology, ing that the process is understood earlier by the population.
which is a three-step process to determine the percentage of This could be due to awareness and training or to the shaking
people who would leave an area that could be potentially in- felt by most people immediately.
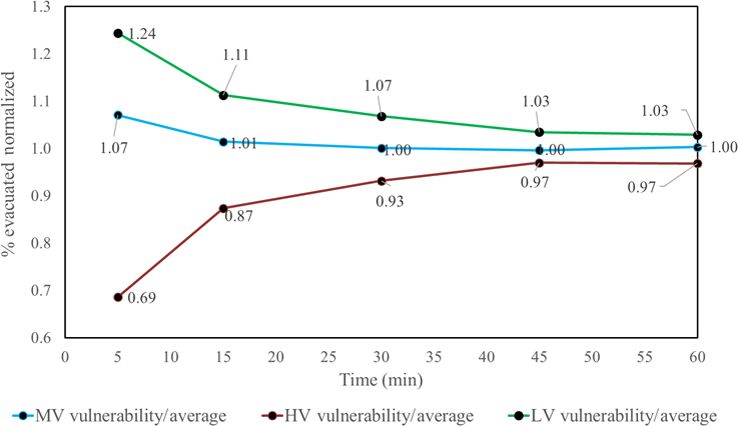
undated. When we separate the results by social vulnerability, the
We found that the aggregated evacuation rate curve for the results suggest that people with a higher level of vulnera-
2015 tsunami in Coquimbo has similarities to the evacuation bility need more time to evacuate than people with a lower
curve for the 2009 tsunami in American Samoa after the 8.1 level of vulnerability. However, in our results, the differences
earthquake described in Lindell et al. (2015). This similarity between the evacuation curves are not statistically signifi-
is notable considering the distance as well as socioeconomic cant. In Fig. 9, in which we compare the aggregate survey
and cultural differences. The evacuation results in both stud- responses with the evacuation responses categorized by so-
ies show that in the first 15 min the aggregated evacuation
www.nat-hazards-earth-syst-sci.net/19/251/2019/ Nat. Hazards Earth Syst. Sci., 19, 251–267, 2019262 A. Hofflinger et al.: Response time to flood events Figure 7. Evacuation using empirical equations. cial vulnerability level, we find that people at a medium level (post-disaster): “some occupations, especially those involv- of vulnerability respond similarly to the aggregated values. ing resource extraction, may be severely impacted by a haz- Then, people with low and high vulnerability behave almost ard event” (Cutter, 2003, p. 248). In relation to renters, they symmetrically around the average, which in a more gen- are considered to be more vulnerable to disaster: “people that eral application could be used to generate boundaries for the rent do so because they are either transient or do not have evacuation curves. the financial resources for home ownership. They often lack To overcome the limitation of the non-significance in the access to information about financial aid during recovery. In difference among the evacuation curves more data related to the most extreme cases, renters lack sufficient shelter options the evacuation process, specifically when people decided to when lodging becomes uninhabitable or too costly to afford”. evacuate, need to be collected. (Cutter, 2003, p. 247). Regarding “houses without electric- One of the primary variables that are linked to social vul- ity”, we assumed that this indicates more precarious condi- nerability is household income (Cutter et al., 2003), but in tions and the same is true for many other variables in the the case of Peru, this variable is not surveyed in the census. census such as houses without restrooms and running water, Consequently, we used proxy variables of income such as which were disregarded in the collinearity test. Finally, we job types, marital status, renters, and houses without electric- use “adult population divorced” as a proxy for household in- ity. The relationship between income distribution and the job come, for example Schoeni (1995) found that “in most cases, type has been established worldwide (Galbraith and Berner, both separated and divorced men earn more than men who 2001) as well as in literature linked to social vulnerability are never married but less than those who are currently mar- Nat. Hazards Earth Syst. Sci., 19, 251–267, 2019 www.nat-hazards-earth-syst-sci.net/19/251/2019/
A. Hofflinger et al.: Response time to flood events                                                                             263

Figure 8. Evacuation using the social vulnerability index.

                                                                    ried”. We recalculate the SVI excluding marital status (adult
                                                                    population divorced) and gender, and we found differences
                                                                    between the former and the recalculated SVI. However, af-
                                                                    ter a lengthy discussion, we do not have strong arguments to
                                                                    support such changes, especially because the variables ini-
                                                                    tially selected are easily found in the literature to influence
                                                                    the level of social vulnerability.
                                                                       A limitation that arises when we apply a methodology
                                                                    such as ReTSVI, which relies on the construction of a SVI,
                                                                    is that we could not find any studies that relate evacuation
                                                                    rates with social vulnerability for inundations that take less
                                                                    than an hour from the triggering to the flooding. In this study,
                                                                    we used a PCA-based SVI to select the variables as proxies;
                                                                    however, this index was created and validated for post-event
                                                                    assessments. Therefore, this is a limitation that needs to be
Figure 9. People evacuated per social vulnerability level normal-
                                                                    addressed before applying this framework.
ized by the average number of people evacuated.
                                                                       Traditionally, the evacuation rate is calculated using one
                                                                    evacuation rate curve; therefore, ReTSVI seeks to overcome

www.nat-hazards-earth-syst-sci.net/19/251/2019/                              Nat. Hazards Earth Syst. Sci., 19, 251–267, 2019
264 A. Hofflinger et al.: Response time to flood events
this limitation by allowing the user to include social vulner- Data availability. The Python notebook used to combine so-
ability. The user decides which SVI and which evacuation cial vulnerability and the evacuation model is available at
curves to use for the levels of vulnerability. Here we have https://github.com/msomos/ReTSVI. The 2007 census data from
provided an example using as a proxy a SVI for post-disaster Peru are described in http://censos.inei.gob.pe/cpv2007/tabulados/
and evacuation curves that have no statistical significance. (last access: 30 March 2017). The CASEN Survey from Chile
is available at http://observatorio.ministeriodesarrollosocial.gob.cl/
However, it still provides valuable information (Fig. 8) with
casen-multidimensional/casen/basedatos.php (last access: 30 Octo-
respect to the implications of including social vulnerability ber 2017).
that need to be validated. For example, more vulnerable peo-
ple, according to the PCA-based SVI and census data, live
closer to the river where the inundation strikes earlier and Author contributions. MASV and AH developed the conceptual-
harder, having less time to evacuate while at the same time ization of RESTVI and produced formal analysis and methodology.
evacuating later. Additionally, social vulnerability seems to AVR coordinated the data collection in Coquimbo (Chile). MASV
be less important as the EWS is delayed. and AH wrote the original draft and answered the reviewers’ com-
By incorporating social vulnerability in the evacuation ments and suggestions.
models, we can identify not only areas where people need
more time but also how much time to evacuate. The ap-
plication of ReTSVI allows for the identification of groups Competing interests. The authors declare that they have no conflict
that need more support at the block level. This allows policy of interest.
makers to allocate resources properly, improving evacuation
routes and providing training to meet the evacuation time ac-
cording to their social vulnerability level. Acknowledgements. We would like to acknowledge the Ministry of
the Environment of Peru for providing the 2007 Census of Peru. We
also wish to thank Cesar Portocarrero for inspiring us to develop
new methodologies to help those in need. Finally, we would like
to thank Luis Rios-Cerda for his help applying the survey to first
5 Conclusions responders and Lindsey Carte for all her feedback and English
review that helped us improve this study.
This article proposes a methodology to incorporate social
vulnerability into current methodologies to estimate the per- Edited by: Paolo Tarolli
centage of people who evacuate an inundation hazard zone. Reviewed by: two anonymous referees
Previous research recognizes the relevance of social vulner-
ability in risk assessments; however, in general, the method-
ologies available fail to connect the physical vulnerability or
the characteristics of an inundation event with social vulnera- References
bility in a quantitative framework. The results of the example
of the ReTSVI in Huaraz show how a SVI could be used in Abdi, H. and Williams, L. J.: Principal component anal-
the evacuation planning process. For example, such an anal- ysis, Wiley Interdiscip. Rev. Comput. Stat., 2, 433–459,
ysis might show that there are distinct differences in the per- https://doi.org/10.1002/wics.101, 2010.
Aboelata, M. and Bowles, D. S.: LIFESim: A Model for Estimating
centage of people evacuated in Huaraz for blocks that are
Dam Failure Life Loss, Logan, Utah, 18 pp., 2005.
close to each other, which could be explained by the SVI
Adger, N.: Social Vulnerability to Climate Change and Ex-
since their exposure to the physical hazard and the distance tremes in Coastal Vietnam, World Dev., 27, 249–269,
to escape are similar. The same is true when the alarm is de- https://doi.org/10.1016/S0305-750X(98)00136-3, 1999.
layed: the longer it takes for the authorities to warn people, Adger, N. and Vincent, K.: Uncertainty in adaptive
the greater the influence of the SVI. However, although it capacity, Comptes Rendus Geosci., 337, 399–410,
seems intuitively probable that people with different levels https://doi.org/10.1016/j.crte.2004.11.004, 2005.
of social vulnerability would differ in their evacuation rates Alwang, J., Siegel, P. B., Jørgensen, S. L., and Tech, V.: Series Vul-
and departure times, there are no empirical data to support nerability?, A View From Different Disciplines, 42 pp., 2001.
this assumption. Differences in evacuation rates associated Balica, S.: Applying the Flood Vulnerability Index as a Knowledge
with level of social vulnerability need further study because base for flood risk assessment, Delft University of Technology,
142 pp., 2012.
with the current state of the science and the data collected
Basher, R.: Global early warning systems for natural hazards: sys-
in this study, we cannot answer this question with statistical
tematic and people-centred, Philos. T. Roy. Soc. A, 364, 2167–
significance. We faced a similar situation when constructing 2182, https://doi.org/10.1098/rsta.2006.1819, 2006.
a pre-inundation SVI. It is unclear which variables explain Birkmann, J.: Risk and vulnerability indicators at different scales:
the differences in departure time, which is critical to apply- Applicability, usefulness and policy implications, Environ. Haz-
ing the ReTSVI framework; therefore, it also requires further ards, 7, 20–31, https://doi.org/10.1016/j.envhaz.2007.04.002,
study. 2007.
Nat. Hazards Earth Syst. Sci., 19, 251–267, 2019 www.nat-hazards-earth-syst-sci.net/19/251/2019/You can also read