Working Report Of Defenders and Explorers: An identity conflict over belonging and threat
←
→
Page content transcription
If your browser does not render page correctly, please read the page content below
1

                                                    Working Report

Of Defenders and Explorers: An identity conflict over
belonging and threat
DOI:                  10.17879/97049506223
DOI-URL:              https://dx.doi.org/10.17879/97049506223

Structure

  1. Introduction ............................................................................................................................. 2
  2. The empirical study ................................................................................................................. 5
  3. Two groupings in identity conflict: Defenders and Explorers .................................................... 9
  4. Identity conflict as an expression of belonging: Who considers whom as belonging? ............ 17
  5. Identity conflict as an expression of threat: Who feels threatened by whom?......................... 28
  6. Identity conflict and ideas of democracy: Who wants what form of democracy? .................... 37
  7. Implications and embedding in the research .......................................................................... 43
  Bibliography .............................................................................................................................. 48
  Appendix ................................................................................................................................... 52

Copyright belongs to the authors.

This Working Report serves to disseminate research results from ongoing work in advance of later
publications. It is intended to foster the exchange of ideas and academic debate. Making research
results available is not the same as publishing them in a final version, and explicitly does not preclude
their publication elsewhere and in another form. The Working Report reflects the views of the authors
and not those of the entire institution of the University of Münster and the Cluster of Excellence
“Religion and Politics”.

Authors
Mitja Back, Institute of Psychology
Gerald Echterhoff, Institute of Psychology
Olaf Müller, Institute of Sociology
Detlef Pollack, Institute of Sociology
Bernd Schlipphak, Institute of Political Science

Contact
Centre for Research Communication, Cluster of Excellence “Religion and Politics”, University of
Münster, religionundpolitik@uni-muenster.de
2
Chapter 1. Introduction
Mitja Back, Gerald Echterhoff, Olaf Müller, Detlef Pollack and Bernd Schlipphak
Soon after the collapse of state socialism in the countries of Eastern and Central Europe, Francis
Fukuyama articulated the thesis that the history of ideological conflicts had come to an end, and that
Western liberal democracy had prevailed as a form of society and government across the world.
Doubts have since been growing about the veracity of this thesis. Only recently, researchers such
as Pippa Norris and Ronald Inglehart (2019) have pointed out that the increasing approval of (right-
wing) populist, nationalist and authoritarian ideas among the population could be an expression of a
cultural countermovement.
In fact, we can discern growing points of conflict in the public debate, triggered by issues such as
immigration, multiculturalism, and the opening of national borders. In essence, these issues seem
to revolve around questions of identity such as social belonging and demarcation. Moreover,
discussions about identity seem to be increasingly linked to questions regarding the societal and
political participation of different groups of citizens. However, the division of society into camps
according to their notions of identity, and the coupling of these camps with perceptions of social and
political representation, have not yet been demonstrated empirically.
The aim of the present study is to provide first systematic empirical findings to accompany the
diverse discussions on cultural and identity-related conflicts. We do so by using a comprehensive
database to explore the following four questions: Can we really observe consistent camps in society
that differ with regard to their notions of identity? Do these camps also diverge with regard to the
other issues of conflict that relate to societal and political representation? What factors influence
membership to one of the two camps? What political attitudes and positions are associated with the
diverging societal camps?
Our study included 5,000 respondents in four countries (Germany, France, Poland, Sweden). First,
the results show that a substantial share of the population is indeed split into two camps that differ
in their notions of identity – measured by a narrow vs. open definition of belonging, as well as by a
high vs. low perception of threat from strangers defined in ethno-religious terms. We call these
camps Explorers and Defenders (see infobox). Second, our findings demonstrate that these camps
are also diametrically opposed in terms of their perceived societal marginalization and their
assessment of political representation. Third, our data show that Explorers and Defenders differ
substantially in relatively stable cultural, religious and psychological characteristics. Fourth, r our
findings demonstrate that being an Explorer or Defender has ramifications for the desired form of
democracy in the population. Our findings, thus, indicate that cultural conflicts over identity have
become strongly entrenched politically, and now structure the societal and political views of the
population to a significant extent.
Explorers versus Defenders
Explorers endorse an open definition of belonging and do not feel threatened by strangers
(Muslims, refugees). They also see themselves as well represented, i.e. are less likely to feel
marginalized, are more likely to be satisfied with democracy in their country, and trust political
institutions more. Defenders, on the other hand, are more likely to endorse a narrow definition of
belonging, feel more threatened by strangers and marginalized by society, are more dissatisfied
with democracy in their country, and trust political institutions less.3 These core findings can be backed up with detailed results: Explorers and Defenders each represent a substantial proportion of respondents. In Germany, for example, 14% of respondents belong to the Explorer camp, and 20% to the Defender camp. These two camps occupy opposite and widely divergent positions in identity conflict. In the group of Explorers in Germany, fewer than 15% have a somewhat narrow, ethno-religious definition of belonging, none feel threatened or marginalized, the vast majority are (or tend to be) satisfied with democracy (93%) and trust (or tend to trust) political institutions (federal government: 100%; EU: 99%). On the other hand, 61% of Defenders endorse a narrow definition of belonging, 49% and 55% feel threatened by Muslims and refugees respectively, 45% feel culturally marginalized, only 21% are satisfied with democracy, while only 11% trust the government and parliament. Although the percentages differ somewhat, similar patterns and group differences emerge in Sweden and France. An important exception is Poland, a semi-authoritarian country in which the government provides populist support to the Defender positions, for example by advocating ethno-religious homogeneity and protection of the homeland from foreigners. Here, it is not only a considerable proportion of Defenders who feel marginalized, but also of Explorers. The latter are even more affected when it comes to political marginalization than the former (49% as opposed to 29%). Most Explorers in Poland also tend to be dissatisfied with democracy in the country and distrust the government, whereas, as in the other countries, a large proportion (74%) strongly trust the EU. In contrast, a slight majority of Defenders in Poland tend to be very satisfied with democracy in the country (57%), with almost three-quarters (72%) also trusting the government and parliament quite strongly; however, the proportion of those in this group who trust the EU is significantly lower (32%). Moreover, society is much more divided in Poland, with Explorers and Defenders together accounting for over 70% of the population. The political system and political communication thus influence the extent to which a society is divided, and the degree to which each of the camps of Explorers and Defenders feel marginalized and accept democratic institutions. More in-depth analyses have revealed that the two groups also differ in terms of their cultural and religious attitudes as well as their psychological dispositions. In Germany, only 24% of Explorers have a high level of religiosity; 31%, a strong attachment to home; 4%, a strong preference for social hierarchies; and 3%, a low level of trust in people. In contrast, 33% of Defenders have a high level of religiosity; 52%, a stronger attachment to home than to the world; 34%, a preference for clear social hierarchies; and 31% tend to be sceptical of other people in general. Our results also suggest that the conflict between Explorers and Defenders has clear political effects: Defenders are much more in favour of populist parties and the notion of a “strong leader”, and they are more prone to conspiracy theories. For example, 26% (Germany), 16% (France), 57% (Poland), and 34% (Sweden) of Defenders are likely to vote for a populist party, while hardly any Explorer in any of the countries is likely to do so. In short, the study presented here provides the first empirical evidence of the emergence of a new overarching societal cleavage, one that is based on different definitions of belonging and perceptions of threat. While a considerable group in society, whom we call Explorers, welcomes the foreign and does not feel threatened by strangers, another group, whom we call Defenders, takes the opposite position in both respects. An open definition of belonging and an absence of feelings of threat correlate with a low perception of marginalization and a high assessment of representation. Those who tend to close themselves off to others and experience foreignness as a threat are more inclined to feel marginalized and politically unrepresented. Defenders are also more likely to be dissatisfied with democracy and less likely to trust political institutions, while the opposite is true of Explorers. Both groups represent widely divergent positions and each accounts for a substantial proportion of
4
the population. However, the extent to which the population splits into these opposing camps, and
the degree to which existing differences in notions of identity are associated with perceptions of
marginalization and distrust in political institutions, varies across political systems. It can thus
potentially be influenced by political communication.

Structure of the report
In Chapter 2 (The empirical study), we present in more detail the methodology of our empirical study
and the central variables. In Chapter 3 (Two groupings in identity conflict: Defenders and Explorers),
we show that, with regard to the aspects diversely discussed in conflict over identity, two groups with
widely divergent positions can indeed be consistently identified: Explorers and Defenders. Moreover,
we show that the extent to which these groups represent the total population, feel marginalized, and
accept democratic institutions depends on the political system and political communication. In the
chapters that follow, we first have a closer look at those factors that dominate identity conflict – the
question about the relevance of ethnic and religious criteria for belonging to society (Chapter 4.
Identity conflict as an expression of belonging: Who considers whom as belonging?), and the
(delimiting) perception of threat from foreign groups framed in ethno-religious terms (Chapter 5.
Identity conflict as an expression of threat: Who feels threatened by whom?). We also investigate
which individual characteristics and attitudes shape the positions of respondents with regard to these
factors. We show that Explorers and Defenders differ especially in relatively stable cultural-religious
and psychological aspects. In Chapter 6 (Identity conflict and concepts of democracy: Who wants
what form of democracy?), we return to the groups of Explorers and Defenders to find out which
political models of societal governance – and in particular the specific form of democracy – the two
groups favour. We find that Defenders, in contrast to Explorers, tend to endorse anti-pluralist ideas
of democracy (including a preference for populist parties and authoritarian leaders), and are more
prone to conspiracy theories. Finally, in Chapter 7 (Implications), we interpret our findings and derive
some relevant implications. Here, we first argue that, with their striving for security and stability
(Defenders) or for openness and change (Explorers), the two groups differ in terms of their
fundamental needs.

Although pursuing both of these needs could actually be adaptive for a society, identity conflict and
its spiral of mutual debasement have hardened both groups’ stances into seemingly incompatible
societal positions. In our view, this implies the need to refrain from taking one of the two sides,
especially at the political level. Instead, the underlying core needs of both groupings should be taken
seriously and given political representation. A dialogue can then take place between the opposing
positions; a dialogue based on factual arguments that do not devalue the needs of the other camp
from the outset.
5

Chapter 2. The empirical study
Mitja Back, Gerald Echterhoff, Olaf Müller, Detlef Pollack and Bernd Schlipphak

Methodology
The findings presented in this report are based on data from a survey conducted in four European
countries (Germany, France, Poland, Sweden) as part of the Cluster of Excellence “Religion and
Politics” project “Perceptions of threat, feelings of belonging, acceptance of democratic rule: A new
religiously shaded line of conflict in Europe?” Kantar Germany (Berlin) was responsible for organizing
and coordinating the survey.

The survey period was from 9 November to 18 December 2020. The survey was conducted using
CATI (Computer Assisted Telephone Interviewing) and was based on a dual-frame sample design
(taking into account landline and mobile phone numbers). Respondents were randomly selected
from the population of all persons living in private households in each country. Only persons eligible
to vote in the national parliamentary elections at the time of the survey were included in the sample.
A total of 5,011 respondents took part in the survey. The number of interviews actually carried out
was 1,402 in Germany (of whom 506 were in the five states of the former East Germany and Berlin),
1,208 in France, 1,200 in Poland, and 1,201 in Sweden.

In order to correct distortions of the sample due to different selection probabilities or dropout-related
factors, we weighted the data after the survey based on age, gender, education and region, among
others. Unless explicitly stated otherwise, the findings presented are based on weighted data.

Measurement concepts and variables used
The measurement concepts and variables used in this report are briefly presented below. A detailed
list and description of all variables and indices can be found in Table A 2.1 in the Appendix. We first
list the measurement concepts and variables that constitute the groups which we describe in more
detail in Chapter 3:

Ideas of national belonging
To measure ideas of national belonging, we used a questionnaire module already employed in
several large international surveys such as the International Social Survey Programme (see Balke
et al. 2014). We distinguish between criteria that relate to more ascriptive principles emphasizing
ethnic and religious affiliation (having been born in the country, having lived in the country for most
of one’s life, belonging to the dominant religion, and having ancestors who belong to the ethno-
national majority), and characteristics that are essentially acquirable and located in the civil-cultural
sphere (respect for political institutions and laws in the country, mastery of the national language,
and the feeling of belonging to the national majority). The following explanations will focus on the
approval or rejection of the ethno-religious principle of belonging. We calculated an index which is
based on the respondents’ average approval of the criteria already described above (having “been
born in [Germany, France, Sweden, Poland]”, having “lived in [Germany, France, Sweden, Poland]
for most of her life”, being “a Christian [in Poland: a Catholic]”, and having “[German, Swedish,
French, Polish] ancestors”). Low values on this index thus indicate disapproval of this principle,
while higher values indicate approval.
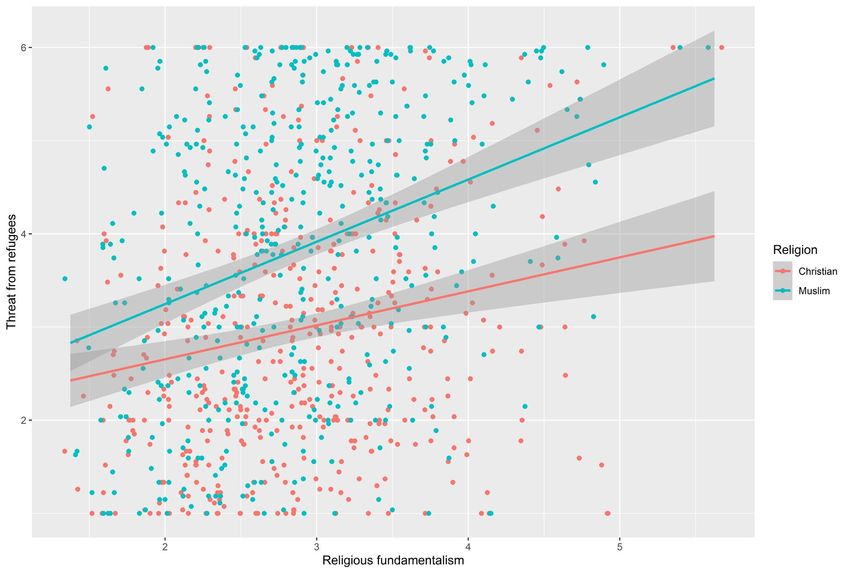
6
Threat perceptions
In addition, we asked questions about perceptions of threat elicited by ethnic and/or religious minority
groups. We focus on perceptions of threat elicited by Muslims. These threat perceptions relate to
concerns about threatened resources, security and cultural values. Following Landmann et al.
(2019), we measured these perceptions using a total of six items (for example: “Muslims threaten
our way of life and our values in Germany”, “Muslims threaten the economic situation in Germany”,
“Muslims living here threaten public safety in Germany”). For the graphs and calculations that follow,
we created a variable, “Threat from Muslims”, depicting the average approval of the six items. In
addition, we used a variable “Threat from refugees” that is based on three items and measures
perceptions of threat elicited by refugees.

Perception of social marginalization
Following Bollwerk et al. (2021), we measured the perception of social disadvantage through the
approval or rejection of six items gauging perceptions of marginalization – two items each for the
economic (for example: “The work of people like me is not recognized enough in society”), political
(for example: “Most politicians do not care what people like me think”), and cultural (for example:
“The customs, traditions, and manners of people like me are less and less appreciated”) dimension.
For the graphs and calculations, we created a variable for each dimension (“Economic
marginalization”, “Political marginalization” and “Cultural marginalization”) that contains each
respondent’s average approval of the respective statements.

Assessment of political representation
As for how citizens assess political representation, we surveyed three variables – satisfaction with
democracy in own country, average level of trust in the two main political institutions of a country
(government and parliament), and level of trust in the European Union. All three variables express
how much respondents feel represented in the national and European political system.

We will now present a number of further variables. On the one hand, these variables serve to
describe in more detail the profile of Explorers and Defenders (chapter 3), and their preferred models
of political governance (chapter 6). On the other hand, we use the variables to examine the defining
features and attitudes of those who endorse an ethno-religious definition of belonging (chapter 4),
and feel threatened by Muslims or refugees (chapter 5), as well as to carry out further multivariate
analyses.

Socio-demographic characteristics
We recorded the socio-demographic profile of respondents on the basis of age (in years), level of
education (the highest level of education attained according to the international standard
classification ISCED), as well as place of residence (rural; small or medium-sized town; large city). 1

Assessments of the socio-economic situation
Unlike with socio-demographic characteristics, our focus here is not on objective features, but rather
on subjective assessments. We measured the (subjective) social status of respondents by
respondents’ self-positioning of their family on an imaginary social ladder between “at the bottom”
and “at the top”. In addition, we asked respondents whether they believe that they receive their fair
share in life compared to others. Besides their personal situation, we also asked them to assess the

1
  Gender differences are often also reported with regard to socio-demographic characteristics, without any
theoretically plausible justification for this. Since, in contrast to all other variables, we also have no theoretical
expectation with regard to the role of gender in identity conflict and, moreover, the empirical distribution of
gender across the groups of defenders and explorers in the different countries does not follow a uniform
pattern, this does not add any value to our study.
7
economic situation of the country. And, finally, we used an index to measure the degree of perceived
social support (based on the items “There are people who really like me” and “I have people that I
can always rely on”).

Socio-cultural factors and attitudes
Here, we first recorded how often respondents (again according to their own assessment) have
personal contact with Muslims. Second, we asked where respondents feel most at home – whether
they perceive themselves rather as cosmopolitans (“like to travel the world and feel at home
everywhere”) or as attached to home (“prefer their familiar surroundings, and therefore feel at home
in a specific place”). Third, we measured the level of national pride by asking whether they were very
proud, quite proud, not very proud, or not proud at all to be German, French, Polish or Swedish.

Personality traits and social attitudes
Here, we measured generalized beliefs and worldviews, all of which are established as central
predictors of politically and socially relevant attitudes. General trust expresses the extent to which
someone believes in the benevolence of other people, or tends to be sceptical of others. We
measured this by asking respondents how much they believe that most people can be trusted.
Internal locus of control –represents the extent to which people expect desired results to occur as a
consequence of their own behaviour. It was assessed by respondents’ (dis)agreement with the
statement that effort also leads to success. We also measured right-wing authoritarianism
(Altemeyer 1981), which elaborates the construct of the authoritarian personality (Adorno et al.
1950). This was done by forming an index aggregating respondents’ approval of three items covering
the sub-aspects of authoritarian aggression, authoritarian submissiveness and conventionalism
(“Troublemakers should be made to feel that they are not welcome in society”, “People should leave
important decisions in society to their leaders”, “Well-established behavior should not be
questioned”). People with a high (as opposed to a low) level on this scale tend to be more obedient
to authority, to be morally rigid in their judgments, to endorse conventional positions, and to behave
aggressively in the name of authority towards those who express a dissenting opinion. We also used
a two-item index (“An ideal society requires some groups to be on top and others to be on the
bottom”, “We should do what we can to equalize conditions for different groups” [reverse coded]) to
measure people’s social dominance orientation.

Religion and religiosity
Here, we first used three indicators from the standard repertoire for quantitatively measuring
religiosity. We measured religious affiliation (in our case, affiliation to Christianity) via the question
of which denomination or religious community the respondent belongs to. The dimension of religious
practice was measured via the question on the frequency of church attendance. The intensity of
religiosity was measured by respondents assessing themselves on a scale from “not religious at all”
to “deeply religious”. Beyond these standard indicators, we surveyed two specific manifestations of
religiosity that not only differ greatly from each other in how they are conceived, but that can also be
assumed to differ in their effects on and associations with the questions that we are interested in.
Thus, we measured on the one hand whether and to what extent respondents consider themselves
spiritual (analogous to the scale of religiosity from “not at all” to “deeply spiritual”). On the other hand,
we surveyed fundamentalist positions based on respondents’ approval regarding three items that
represent the essential elements of such an attitude (items: “There is only one true religion”,
“Observing the commandments of my religion is more important to me than the laws of the country
in which I live”, “Only Christianity can solve the problems of our time”).
8
(Preferred) models of political governance
We distinguish three dimensions of political governance – the rejection/approval of democracy as
an idea, the rejection/approval of liberal and direct expressions of democracy, and the
rejection/approval of populist positions.

With regard to the first dimension, we measured respondents’ approval of democracy as an idea by
whether they agree with the statement that democracy is a good form of government. In addition,
we measured their preference for authoritarian forms of government, i.e. forms of government
opposed to democracy, by whether they agree with the statement that there is a need for a strong
leader who does not have to worry about parliament and elections. For the second dimension,
approval of the idea of liberal and direct democracy, we used two instruments. For the concept of
liberal democracy, respondents were asked to rate how important it was for democracy that a) the
media have a right to criticize the government, b) minority rights are protected, and c) courts can
stop the government from exceeding its powers. The measurement of direct democracy only
includes a question about how important it is for democracy that citizens have the final say on
important issues through referendums. For the third dimension, approval of populist positions, we
used three instruments. First, we used an instrument recommended by Castanho Silva et al. (2020)
to measure populism across countries. The level of populism is the average approval of respondents
regarding two items (for example: “The country is ruled by a few large interest groups looking out for
themselves”). Second, we asked respondents which party they would vote for in a hypothetical
national election. We then created a variable separating those with a preference for populist parties
from all other respondents. Third, we asked respondents to agree with an item that measures a
general conspiracy mentality (“There are many important things happening in the world that are
controlled by influential groups without the public’s knowledge”).
9

Chapter 3. Two groupings in identity conflict: Defenders and
Explorers
Mitja Back, Gerald Echterhoff, Olaf Müller, Detlef Pollack and Bernd Schlipphak

Given the indicators presented in Chapter 2 (definitions of belonging, feelings of threat, perception
of social marginalization, and perception of political representation), are there consistent social
groups that oppose each other in identity conflict? To answer this question, we use the statistical
tool of cluster analysis. 2 A cluster analysis first checks with regard to all the variables entered into
the analysis whether different groups can be identified that are characterized by very similar positions
in relation to these variables. The cluster analysis then tests how far these groups differ from each
other regarding their respective positions. In our case, the cluster analysis thus serves as a
descriptive tool that looks for groups that differ in terms of their ideas of belonging, their feelings of
threat, and their perception of marginalization and representation.

Figs. 1 to 4 present the results of a cluster analysis that includes those variables described above
that are central to identity conflict. In all countries, there are two social groups with opposing and
widely divergent positions (shown here in red and blue), and two groups with intermediate positions. 3
We focus in this report on the two groups that reflect the two poles of identity conflict: the Explorers
(blue) and the Defenders (red). These groups together account for between 25% (France) and 72%
(Poland) of respondents in our samples. Thus, both groups represent a substantial proportion of
respondents in all countries, one that, as Poland shows, can under certain conditions grow into a
majority. This shows that the national context and differences in political communication also seem
to play an important role in the differentiation of these two groups.

The group of Defenders (represented by a red line) has the highest rates of approval in all countries
when it comes to the role of ethnic and religious factors in national belonging, and to the feeling of
threat from foreign groups (in our study, from Muslims and refugees). In three out of four countries
(Germany, France and Sweden), this group also has a high level with regard to the perception of
marginalization (economic, political and cultural), and to dissatisfaction with how they are
represented in the political system (measured by satisfaction with democracy and political trust). In
contrast, the blue line representing the group of Explorers is almost the exact opposite, this group
having high rates of rejection regarding ethno-religious definitions of belonging and low rates when
it comes to feelings of threat. In Germany, France and Sweden, the perception of marginalization is
also low in the Explorer group, while the perception that their own preferences are represented in
the political system is high.

2
  Correctly speaking, we use a latent profile analysis here, which is very similar to traditional cluster analysis
(Scrucca et al. 2016; Vermunt and Magidson 2002). These analyses are based on unweighted data. The
authors can provide more detailed information on the statistical procedure on request.
3
  The values or characteristics of the groups in the following diagrams represent the difference between the
groups and the mean value in the country as a whole. For modelling reasons, we had to standardize the mean
values (“standardized score”). As a result of such standardization, the original mean value becomes 0, and
the value 1 represents a standard deviation.
10
Fig. 3.1   Identity conflict and societal groups in Germany

Fig. 3.2   Identity conflict and societal groups in France
11
Fig. 3.3       Identity conflict and societal groups in Sweden

For Poland, however, there are different relationships. Here, we can also distinguish the two groups
of Defenders and Explorers who have diametrically opposite positions in regard to the identity
conflict. Quite different observations can be made for the two groups in Poland and their counterparts
in Germany, Sweden and France when it comes to perceptions of marginalization and political
representation, however. In Poland, the group of Defenders (marked in red) clearly feel less
marginalized than the group of Defenders in the other countries, and is thus more satisfied with
political representation – but only at the national level. In contrast, the group of Explorers (marked in
blue) have a higher level when it comes to perceptions of (especially political) marginalization, and
a low level in terms of perceived political representation at the national, but not the international (i.e.
European), level.

Fig. 3.4       Identity conflict and societal groups in Poland
12
Fig. 3.5 uses percentages to illustrate how much the two camps differ with regard to the variables
included in the cluster analysis (i.e., definitions of belonging, feelings of threat, and perceptions of
social marginalization and political representation). Results in all countries show that Explorers have
much lower proportions of respondents with narrower definitions of belonging and with higher levels
of feelings of threat. In Germany, France and Sweden, hardly any Explorers demonstrate a high
level of perceived threat, while between 30% and 64% of Defenders feel threatened. Both groups
have higher values in Poland, but the difference between the groups remains: while 48% of
respondents in the group of Explorers in Poland have a narrower definition of belonging, this
proportion is almost twice as high in the group of Defenders (94%).

An interesting and complicated picture emerges when we consider perceptions of societal
marginalization and political representation. In the group of Explorers, nobody feels culturally,
economically or politically marginalized in Germany, France and Sweden. However, this is different
in Poland, where more than 30% of Explorers feel marginalized, almost half (49%), politically
marginalized. In comparison, we observe that (far) fewer Defenders in Poland feel politically and
culturally marginalized, while more do feel marginalized in the economic dimension.

In our view, these differences are due to the political context. With regard to how perceptions of
marginalization are distributed, we can hypothesize that other contextual factors – such as overall
prosperity in a society and how far the welfare state is developed – also play a role. There are much
lower perceptions of marginalization in Germany and Sweden overall, for example, than in France,
and perceptions of economic marginalization are lower even among the group of Defenders in
Sweden and Germany than are perceptions of political and/or cultural marginalization.
is true for the group of Defenders in these countries: a maximum of one third of respondents in this
group is satisfied with democracy and trusts political institutions (in Sweden, political trust at the
democracy, while only about 10% trust national or European institutions. In Poland, we again find a
Finally, a clear picture also emerges when it comes to the perception of political representation. An
satisfied with democracy and trust political institutions at national and European level. The opposite
13
with democracy or trusts political institutions at the national level. In Germany, 21% are satisfied with
pattern that corresponds to the assumed role of political communication and government stance. No
Explorer is satisfied with democracy in the country, and only 1% trusts national institutions. In
contrast, 57% of Defenders are satisfied with democracy, and 72% trust political institutions at the
overwhelming majority of respondents in the group of Explorers in Germany, France and Sweden is
national level). In France, it is even the case that no respondent in the group of Defenders is satisfied
Germany France Poland Sweden
Trust in EU (high) Trust in EU (high) Trust in EU (high)
24
Trust in EU (high)
32
2
8
Trust in government/parliament (high)
Trust in government/parliament (high) Trust in government/parliament (high)
35
11
Trust in government/parliament (high)
72
0
Satisfaction with democracy (high)Satisfaction with democracy (high)Satisfaction with democracy (high) Satisfaction with democracy (high)
30
21
57
0
The core profiles of Explorers and Defenders in proportions
Economic marginalization (high) Economic marginalization (high) Economic marginalization (high) Economic marginalization (high)
78
20
34
35
Defenders
Defenders
Defenders
Defenders
Cultural marginalization (high) Cultural marginalization (high) Cultural marginalization (high)
71
31
45
Cultural marginalization (high)
30
Political marginalization (high) Political marginalization (high) Political marginalization (high)
81
23
58
Political marginalization (high)
29
Threat from refugees (high) Threat from refugees (high) Threat from refugees (high)
30
64
55
Threat from refugees (high)
55
Threat from Muslims (high) Threat from Muslims (high) Threat from Muslims (high) Threat from Muslims (high)
36
63
49
45
Ethno-relig. belonging (medium/high)
Ethno-relig. belonging (medium/high)
Ethno-relig. belonging (medium/high) Ethno-relig. belonging (medium/high)
61
52
47
94
100%
75%
50%
25%
0%
100%
75%
50%
25%
0%
100%
75%
50%
25%
0%
100%
75%
50%
25%
0%
Trust in EU (high) Trust in EU (high) Trust in EU (high) Trust in EU (high)
99
69
74
81
100
100
Trust in government/parliament (high)
Trust in government/parliament (high)
Trust in government/parliament (high) Trust in government/parliament (high)
85
1
Satisfaction with democracy (high)Satisfaction with democracy (high)Satisfaction with democracy (high) Satisfaction with democracy (high)
93
64
93
0
Economic marginalization (high) Economic marginalization (high) Economic marginalization (high) Economic marginalization (high)
31
0
0
0
Explorers
Explorers
Explorers
Explorers
Cultural marginalization (high) Cultural marginalization (high) Cultural marginalization (high) Cultural marginalization (high)
39
0
0
0
Political marginalization (high) Political marginalization (high) Political marginalization (high) Political marginalization (high)
49
0
0
0
Threat from refugees (high) Threat from refugees (high) Threat from refugees (high) Threat from refugees (high)
0
0
7
0
Threat from Muslims (high) Threat from Muslims (high) Threat from Muslims (high) Threat from Muslims (high)
0
1
4
0
Ethno-relig. belonging (medium/high)
Ethno-relig. belonging (medium/high)
Ethno-relig. belonging (medium/high) Ethno-relig. belonging (medium/high)
14
13
48
10
100%
75%
50%
25%
0%
100%
75%
50%
25%
0%
100%
75%
50%
25%
0%
100%
75%
50%
25%
0%
Fig. 3.514 national level. The picture changes when the EU, as an oppositional force to what is happening at the domestic level in Poland, is added: 74% of Explorers trust the EU, but only 32% of Defenders. For us, these results indicate that the Polish government has absorbed the preferences of the group of Defenders in its communication, and perhaps consciously reinforces these preferences to maintain its own power by presenting itself as capable of saving the country from the (culturally different) “enemy” (migrants, the EU, secular individuals, Russia). This also explains the difference between political trust at the domestic and the European level, a difference that we only find for respondents in Poland. By constantly rejecting the EU and its criticism of how democratic and constitutional institutions are being dismantled in Poland, the Polish government can paint itself as the sole body representing the defender cause (see, for example, Schlipphak and Treib 2017). But who, then, are the Explorers and Defenders? Chapters 4 and 5 will delve deeper into this question and analyze the individual profiles of those who ascribe to narrow vs. broad definitions of belonging, and who have high vs. low levels of perceived threat. Still, in the remainder we shortly introduce the two camps in society by using brief profiles at this point. Fig. 3.6 presents the socio-demographic and socio-economic differences between the two camps, showing that an Explorer is relatively young (except in Germany), highly educated, more likely to come from an urban area, and less likely to be affected by socio-economic hardship. In comparison, Defenders tend to be older, comprise a larger proportion of people with a low level of education (except in Poland), are more likely to live in a rural area, and more often have a low subjective socio- economic status – again with the exception of Poland.
15
Fig. 3.6 Socio-demographic and socio-economic profiles of Explorers and Defenders
Explorers Defenders
60% 60%
Germany
40% 40%
20% 24 14 7 38 20 3 20% 26 25 22 16 35 25
0% 0%
64 years
Education (low)
Education (high)
Residential area (rural)
Subjective social staus (low) Subjective social staus (low) Subjective social staus (low)
64 years
Education (low)
Education (high)
Residential area (rural)
Subjective social staus (low) Subjective social staus (low) Subjective social staus (low)
Explorers Defenders
60% 60%
France
40% 40%
20% 47 52 20% 48 43 51
13 21 28 14 16 15 16
0% 0%
64 years
Education (low)
Education (high)
Residential area (rural)
64 years
Education (low)
Education (high)
Residential area (rural)
Explorers Defenders
60% 60%
Poland
40% 40%
20% 20% 47
32 16 3 34 22 14 13 26 3 18 11
0% 0%
64 years
Education (low)
Education (high)
Residential area (rural)
64 years
Education (low)
Education (high)
Residential area (rural)
Explorers Defenders
60% 60%
Sweden
40% 40%
20% 41 46 20% 38
9 5 17 3 29 22 20 16 8
0% 0%
64 years
Education (low)
Education (high)
Residential area (rural)
Subjective social staus
64 years
Education (low)
Education (high)
Residential area (rural)
Subjective social staus
(low)
(low)
The differences are even more pronounced regarding socio-cultural, religious and psychological
characteristics shown in Fig. 3.7. In Germany, France and Sweden, for example, between 0%
(Sweden) and 19% (France) of Explorers tend not to trust their fellow citizens, a figure that rises
among Defenders to between 27% (Sweden) and 49% (France). In Poland, on the other hand, there
is virtually no difference in this characteristic between Explorers and Defenders. In all countries,
Defenders are clearly more attached to home and more religious than Explorers, although the
difference varies between the countries. In Sweden, for example, 13% of Explorers and 18% of
Defenders are deeply religious, while in Poland 32% of Explorers and 80% of Defenders classify
themselves as religious or very religious. It is also worth highlighting the differences between the two
camps when it comes to the question of whether a society should be hierarchically structured, i.e.
distinguish more strongly between the stronger and the weaker: while between 2% (Sweden) and
13% (Poland) of Explorers share this view, this applies to between 15% (France) and 34%
(Germany) of Defenders.16
Fig. 3.7 Socio-cultural, religious and psychological profiles of Explorers and
Defenders
Explorers Defenders
80% 80%
Germany
60% 60%
40% 40%
20% 3 4 31 24 20% 31 34 52 33
0% 0%
General trust (low)
orientation (high)
Attachment to home
Religiosity (high)
General trust (low)
orientation (high)
Attachment to home
Religiosity (high)
Social dominance
Social dominance
Explorers Defenders
80% 80%
60% 60%
France
40% 40%
20% 19 8 19 12 20% 49 15 29 24
0% 0%
General trust (low)
orientation (high)
Attachment to home
Religiosity (high)
General trust (low)
orientation (high)
Attachment to home
Religiosity (high)
Social dominance
Social dominance
Explorers Defenders
80% 80%
Poland
60% 60%
40% 40% 80
20% 35 13 29 32 20% 37 27 58
0% 0%
General trust (low)
orientation (high)
Attachment to home
Religiosity (high)
General trust (low)
orientation (high)
Attachment to home
Religiosity (high)
Social dominance
Social dominance
Explorers Defenders
Sweden
80% 80%
60% 60%
40% 40%
20% 0 2 27 13 20% 27 23 43 18
0% 0% General trust (low)
orientation (high)
Attachment to home
Religiosity (high)
General trust (low)
orientation (high)
Attachment to home
Religiosity (high)
Social dominance
Social dominance
Chapters 4 and 5 will now look more closely at those cultural, religious and psychological factors
that induce a narrow vs. open idea of belonging (Chapter 4), and a high vs. low degree of perceived
threat towards strangers defined in ethno-religious terms (Chapter 5). After Chapter 6 examines
possible differences between Explorers and Defenders in their preferences regarding democracy,
we then embed our findings in the scientific literature in Chapter 7, and use this to derive implications
for both the academic domain and (political) practice.17 Chapter 4. Identity conflict as an expression of belonging: Who considers whom as belonging? Olaf Müller and Detlef Pollack Two types of definition of belonging: ethno-religious and civil-cultural We now wish to look more closely at one of the central lines of division between the two groups of explorers and defenders: namely, the idea of national belonging. As already mentioned at the beginning of this report, different positions can be identified with regard to the question of what it takes in the opinion of the population to “belong” to the respective national community, these positions differing above all with regard to the width or narrowness of the definition, and also its inclusive or exclusive character. We focused in our analyses of explorers and defenders on the positions within a continuum ranging from the firm rejection to the unqualified approval of using ethno-religious criteria of belonging. Before looking at the question of who deems these criteria to be particularly important or who tends to oppose such an idea of national belonging, we will first take a brief look at how the rates of approval of the ethno-religious principle relate to a concept that can be distinguished from it, which we will call the civil-cultural definition of national belonging. 4 The latter is not simply characterized by the rejection of ethno-religious criteria of belonging; it can also be measured by other items. Again: while the ethno-religious principle is represented by the requirement that a person be born in the country, have lived in the country for most of her life, belong to the dominant religion, and have ancestors who belong to the ethno-national majority, the civil-cultural principle is represented by the approval given to the idea that it is important above all to respect the political institutions and laws in the country, to speak the national language, and to feel a sense of belonging to the national majority. 5 If we now look at the overall average values for both dimensions based on the average approval of the individual items (the minimum value of 0 would stand for a position in which all criteria are not considered important at all, while the maximum achievable value represents the attitude that all criteria are deemed equally important), we first see that in all countries people approve more strongly on average of the civil-cultural principles than of the ethno-religious criteria (Fig. 4.1). There are hardly any differences between the countries when it comes to rates of approval of the civil-cultural principle, which can be attributed to the fact that the overwhelming majority of respondents in all the countries surveyed can agree that, in order to belong to the national community, a person should respect institutions and laws, speak the national language, and feel German, French, etc. (the rates of approval of the individual items are often well over 80%, and sometimes over 90%). On the other hand, the requirement that a person be born in the country and have spent most of her life there, have ethno-national ancestors and the “right” religion, is something that attracts quite different levels of support overall in the individual countries, which is also reflected in the greater differences with regard to the overall average value for approval of the ethno-religious principle of belonging. This 4 We are drawing on a distinction here that is widespread in the literature and that is widely discussed both theoretically and empirically under the labels “civic vs. ethnic”, “open-inclusive vs. closed-exclusionary”, or “ascriptive-objectivist vs. civic-voluntarist” (see Ariely 2020; Brubaker 1992; Helbling et al. 2016; Jones and Smith 2001a). 5 The specific questions and answers from the German questionnaire are listed in Table A 2.1 in the Appendix. In Poland, because of its overriding importance for national identity, we did not ask about affiliation to Christianity as in the other countries, but to Catholicism. The item “have [German] citizenship” in the ISSP toolkit (see Balke et al. 2014) that we used was in our questionnaire, but in the end we did not take it into account in our analyses, since it could not be assigned to one of the two dimensions either in terms of content or in further statistical analyses (factor and cluster analysis).
18
principle has the least approval in Sweden (average value 0.96), closely followed by Germany (1.02).
In France, the average approval is much higher, although rejection of the principle still predominates
(the average value of 1.34 is still below the scale mean of 1.5, which would indicate a neutral or
undecided attitude on average), while the ethno-religious principle of national identity is by far the
most popular in Poland (1.72).

Fig. 4.1        Ethno-religious and civil-cultural principles (mean values)

                         2.5

                          2

                         1.5
                 means

                                                              2.42                2.38                   2.44
                                        2.30
                          1
                                                                           1.72
                                                       1.34
                         0.5     1.02                                                             0.96

                          0
                                  Germany                France              Poland                 Sweden

                               Ethno-religious concept of belonging   Civil-cultural concept of belonging

Fig. 4.2 shows the intensity and degree of approval of the principle of ethno-religious belonging. For
this purpose, we have divided the respondents into three groups: those who disapprove or only
weakly approve of this principle overall, those who show medium levels of approval, and those who
strongly approve. 6 In terms of differences between the countries, the same pattern emerges as in
Fig. 4.1. In Sweden and Germany, the proportion of those who tend to reject the ethno-religious
criteria as a basis for national belonging (over 60%) outweighs the proportion of those who consider
these criteria important by a factor of more than six. The group of those who show medium rates of
approval in this regard ranges from 25% to just under 30% in both countries. In France, too, those
who have little sympathy for the ethno-religious principle are the largest group, with 45%; however,
at least one fifth of the respondents here show high rates of approval, and about one in three show
medium rates. Poland is the only country where the proportions of rejection and approval are
reversed, and where there is a clear tendency towards “closed” positions: here, those who strongly
approve of the principle of ethno-religious belonging, together with those who moderately approve,
represent the largest group (36 and 35%), while fewer than 30% express disapproval in this regard.

6
 The respective values of the variable “ethno-religious belonging” ranges within the groups from 0 and 1 (low
approval), to greater than 1 to 2 (medium approval), and greater than 2 and 3 (high approval; see also Table
A 2.1 in the Appendix).
19
Fig. 4.2 Approval of the ethno-religious principle as a percentage
70
60
50
40
62 65
30
45
20
34 35 36
29 29
25
10 21
9 10
0
Germany France Poland Sweden
low medium high
The principle of ethno-religious belonging – who approves of it, and who
rejects it?
The fact that proponents of a national community that is ethno-religiously homogeneous feel more
threatened by “foreign groups” (in our case, by refugees and Muslims) and more economically,
politically and socially marginalized, have little trust in the European Union and the government of
their own country (with the exception of Poland), and (again with the exception of Poland) tend to be
dissatisfied with how democracy functions in their country – this was already evident from the profiles
of the groups of explorers and defenders at the beginning. We will now describe in somewhat more
detail the two groups with regard to certain socio-demographic and personality traits, as well as
socio-economic and socio-cultural assessments and factors, one group giving above-average
approval of the ethno-religious principle of belonging, and the other tending to reject it. 7
If we first take a look at the socio-demographic profile of the two groups (Fig. 4.3), we can see some
characteristic patterns across the countries: what is immediately apparent is that the proportion of
younger respondents (64) is several
times higher in the group that ascribes to the ethno-religious principle than in the group that tends to
reject this principle. What is also striking are the differences in the level of education as well as where
a respondent lives. While between 30% and 40% of those who consider ethno-religious homogeneity
to be unimportant as a criterion of national belonging have a higher level of education, the proportion
of highly educated people in the other group is only between 7% and 15%; in contrast, the proportion
of people with a low level of education is above average in the group of those ascribing to the
principle. Those endorsing this principle are more often found in the rural population, while those
living in large cities tend to approve less of this principle. To a certain extent, the results reflect the
pattern known from other studies: namely, that older people, the less educated, and the rural
population have traditional and security-oriented values, tend to stick to the tried and tested, and are
sceptical or even afraid of the new (see Inglehart 1989).
7
For reasons of clarity, we do not present the group of those with medium rates of approval. A detailed
description of the underlying variables and the formation of the respective comparison groups can be found in
Table A 2.1 in the Appendix.20
Fig. 4.3 Ethno-religious belonging and socio-demography
low high
80% 80%
Germany
60% 60%
40% 40%
63
20% 31 17 11 27 31 26 20% 5 37 15 36 19
0% 0%
64 y. Educ. (low) Educ. Rural resid. Large city 64 y. Educ. (low) Educ. Rural resid. Large city
low (high) area high (high) area
80% 80%
France
60% 60%
40% 40% 74
20% 37 13 28 31 38 26 20% 10 50 9 47 13
0% 0%
64 y. Educ. (low) Educ. Rural resid. Large city 64 y. Educ. (low) Educ. (high) Rural resid. Large city
low (high) area high area
80% 80%
Poland
60% 60%
40% 40%
20% 42 12 3 37 21 45 20% 12 29 4 13 43 18
0% 0%
64 y. Educ. (low) Educ. Rural resid. Large city 64 y. Educ. (low) Educ. Rural resid. Large city
low (high) area high (high) area
80% 80%
Sweden
60% 60%
40% 40%
20% 33 16 9 29 28 31 20% 10 55 48 7 38 26
0% 0%
64 y. Educ. Educ. Rural Large 64 y. Educ. Educ. Rural Large
(low) (high) resid. city (low) (high) resid. city
area area
As for the question of whether someone reacts more openly or defensively to the inclusion of “foreign
groups”, the literature repeatedly alludes to the role of socio-economic status. People with a lower
socio-economic status are said to favour a narrow definition of belonging, one based on ethnic
homogeneity, since they are more likely than those who are better off to fear potential competitors
in ethnic minorities when it comes to scarce goods, for example on the segmented labour market
and (increasingly) on the housing market (Bonacich 1972; Kunovich 2009). However, some of the
differences between the two groups with regard to how respondents assess their personal socio-
economic situation are not as clear within the individual countries as one might initially assume (Fig.
4.4), with the proportion of those who place themselves at the bottom of an imaginary social ladder
hardly differing between the groups.
The differences are somewhat clearer with regard to how people assess the economic situation of
their country. In Germany, France and Sweden, the proportion of those who tend to assess their
country’s economic situation as being bad is larger in the group endorsing the ethno-religious
principle than in the group rejecting this principle. In Poland, however, the opposite is the case: it is
mostly those who are dissatisfied with the economic situation of their country who have low values
on the belonging index (62%), while the proportion of those who are dissatisfied among the
supporters of the ethno-religious principle is only 32%.
The clearest difference between the two groups can be seen when it comes to the question of
whether someone believes that they receive their fair share or not: in Germany, 41% of those who
endorse the ethno-religious principle say that they believe that they receive less than their fair share
compared to others, while only 24% of those who reject the principle have the same opinion. In
Poland, the ratio is 61% to 45%; in Sweden, 26% to 11%; only in France are there no significant
differences in this respect (25% as opposed to 20%). All in all, the results indicate that, where socio-
economic factors play a role, it is not the individual socio-economic status (or, more precisely,21
people’s assessment of it) per se that plays a formative role here. Rather, defensive attitudes come
into play above all when people have a general feeling of disadvantage, or when the perception
prevails that the overall social situation does not open up much scope for redistribution.
Fig. 4.4 Ethno-religious belonging and assessments of the socio-economic situation
low high
Germany
60% 60%
40%
40%
20% 9 24 12
0% 20% 9 41 16
Subjective social status Fair share (less) Economic situation of 0%
(low) low the country (bad)
France
60% 60% high
40% 40%
20% 25 20 43 20% 24 25 54
0% 0%
Subjective social status Fair share (less) Economic situation of
(low) low the country (bad) high
Poland
60% 60%
40% 40%
62 61
45 20% 16 32
20% 15 0%
0% Subjective social status Fair share (less) Economic situation of
Subjective social status Fair share (less)
low Economic situation of (low) high the country (bad)
(low) the country (bad)
Sweden
60% 60%
40% 40%
20% 6 19 11 20% 3 42 26
0% 0%
Subjective social Fair share (less) Economic Subjective social Fair share (less) Economic
status (low) situation of the status (low) situation of the
country (bad) country (bad)
The results are again quite clear regarding the correlation between the degree to which people
endorse the ethno-national principle and certain socio-cultural factors or attitudes (Fig. 4.5). The
finding from research on prejudice – that contacts with “foreign groups” are more likely to reduce
scepticism and fear in most social constellations than to increase them (see Allport 1954; Pettigrew
and Tropp 2006) – also seems to be true with regard to the subject matter studied here: in all
countries, a much larger number (between 70% and 90% in Sweden, Germany and Poland, and
slightly more than 50% in France) of respondents in the group endorsing the ethno-religious principle
state that they tend to have little contact with Muslims than is the case in the other group (23% to
38% in France, Germany and Sweden, and 67% in Poland). In addition, there are significantly higher
proportions in the group of supporters of the ethno-religious principle who have a strong sense of
national pride (54% to 75%, as opposed to 10% to 39%), one that is also clearly exclusionary here.
The fact that there is a higher proportion of people with attachment to home among those who affirm
the ethno-religious principle than among those who reject this principle (41% to 75%, as opposed to
26% to 43%) also points once again to the fact that the contrast between local attachment and a
more global, cosmopolitan view does indeed seem to be developing into a line of conflict that extends
beyond mere self-location in terms of identity.You can also read