Assessment of Social Vulnerability in Malaga Province, Spain: A Comparison of Indicator Standardization Techniques
←
→
Page content transcription
If your browser does not render page correctly, please read the page content below
Revista de Estudios Andaluces (REA) | Núm. 41, febrero (2021) | e-ISSN: 2340-2776.
                                                                           https://dx.doi.org/10.12795/rea.2021.i41 | © Editorial Universidad de Sevilla 2021
                                                                                    https://editorial.us.es/es/revistas/revista-de-estudios-andaluces
                                                                                           https://revistascientificas.us.es/index.php/REA
                                                                                                                 CC BY-NC-ND 4.0

     87
     https://dx.doi.org/10.12795/rea.2021.i41.05

                                                           Assessment of Social Vulnerability in Malaga Province, Spain:
                                                              A Comparison of Indicator Standardization Techniques
                                                       Evaluación de la Vulnerabilidad Social en la Provincial de Málaga, España:
                                                             Comparación de Técnicas de Estandarización de Indicadores
                                                                                                             Sumita Gayen
                                                                                              sumgay@alum.us.es                              0000-0002-5587-9206
                                                                                                        Ismael Vallejo-Villalta
                                                                                                  ivallejo@.us.es   0000-0001-7077-259X
                                                                      Departamento de Geografía Física y Análisis Geográfico Regional, Universidad de Sevilla.
                                                                                      C/ Doña María De Padilla, S/N. 41004 Sevilla. Spain.
                                                                                                          Sk. Mafizul Haque
                                                                                       mafi_haque@yahoo.co.in 0000-0002-2604-5704
                                                                     Department of Geography, University of Calcutta 35, B. C. Road. Kolkata. India, Pin-700 019.

                                                                                                                       Sumita Gayen et al.

                                                   I N FO ART ÍC U L O                             A B ST RACT

                                                   Received: 30-06-2020                            Hazards are any sort of extreme events that occurred by natural causes, human acti-
                                                   Revised: 27-12-2020                             vities or sometimes both reasons are responsible. Social vulnerability exposes peo-
                                                   Accepted: 08-01-2021                            ple’s condition in hazards. To prevent the loss and damages by hazards, it is necessary
                                                                                                   to identify vulnerable population of a region by constructing social vulnerability
                                                                                                   maps of that region. Here in this work, study region is Malaga province, located in
                                                   K EYWO R D S                                    southern part of Spain, under the autonomous community of Andalusia. 23 key indi-
                                                                                                   cators have been adopted to understand the vulnerability of people in Malaga pro-
                                                   Social vulnerability                            vince at a municipality scale. Three different standardization methodologies              87
                                                   Indicators                                      (maximum value transformation, z score transformation and min–max rescaling
                                                   Standardization                                 transformation) have been used to build five vulnerable zones. There exists strong to
                                                   Natural disasters                               very strong relationship between the results obtained by using three methodologies.
                                                                                                   The final result shows that most socio-economically vulnerable municipalities are lo-
                                                                                                   cated mainly in western part of the Malaga province.

                                                   PA L AB R AS C L AV E                           RE SU MEN

                                                   Vulnerabilidad social                           La peligrosidad viene motivada por una serie de fenómenos extremos que pueden
                                                   Indicadores                                     ser debidos a causas naturales, a actividades humanas o a una combinación de am-
                                                   Estandarización                                 bos aspectos. La vulnerabilidad social expresa las condiciones de las personas que
                                                                                                   pueden ser afectadas por determinados peligros. De cara a la prevención de los
                                                   Desastres naturales
                                                                                                   daños y pérdidas vinculadas a estos peligros, se hace necesario identificar a la po-
                                                                                                   blación vulnerable en un territorio determinado a través de la generación de car-
                                                                                                   tografía sobre vulnerabilidad social. En este trabajo, la zona estudiada se corresponde
                                                                                                   con la provincia de Málaga, que se localiza en la zona sur de España dentro de la
                                                                                                   Comunidad Autónoma de Andalucía. Un conjunto de 23 indicadores han sido aplica-
                                                                                                   dos para analizar la vulnerabilidad de la población de Málaga a nivel municipal. Para
                                                                                                   ello se han empleado tres técnicas de estandarización (transformación del valor
                                                                                                   máximo, transformación de las puntuaciones Z y transformación de valores mínimo
                                                                                                   y máximo) que han permitido la clasificación de los municipios en 5 categorías de

DOI: https://dx.doi.org/10.12795/rea.2021.i41.05
Formato de cita / Citation: Gayen, S. et al. (2021). Assessment of social vulnerability in Malaga province, Spain: A comparison of indicator
standardization techniques. Revista de Estudios Andaluces, 41, 87-108. https://dx.doi.org/10.12795/rea.2021.i41.05
Correspondencia autor: sumgay@alum.us.es (Sumita Gayen)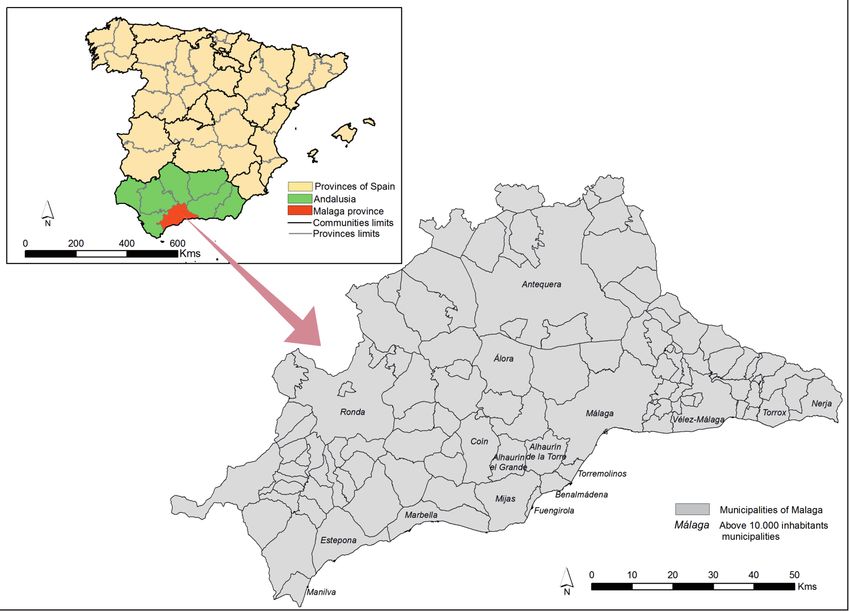
Sumita Gayen et al. / REA N. 41 (2021) 87 - 108

                                                    vulnerabilidad. Los resultados muestran que existe una importante similitud entre
                                                    las diferentes técnicas de estandarización elegidas. En todos ellas se detecta que los
                                                    municipios más vulnerables desde un punto de vista socio-económico se sitúan en la
                                                    zona occidental de la provincia de Málaga.

1. INTRODUCTION

Natural process or phenomena occurring in earth that may constitute a damaging event is known as nat-
ural hazard. Almost all countries of the world are affected by natural hazards in each and every year and
most of them bring about some sort of natural disaster. Data on natural disasters show an increase both
in the number of disasters and in their economic repercussions (Gu, 2019), that it is argued to be mainly
linked to an increase in frequency and severity of climate-related hazards associated to climate change
(Thomas & López, 2015; Djalante, 2019). However, natural disasters are dependant not only on natural
hazards, as they result from the interaction between these natural hazards and socio-economic conditions
of a society; thus, the risk from natural disaster is defined as the probability of this interaction to occur in
a particular place (Birkman et al., 2013). In a broad sense, these socio-economic conditions are known as
vulnerability.
    According to the exposed scheme, natural risk management comprises two basic set of actions. On the
one hand, societies have tried to manage and control natural environment, in such a way that extreme
events or hazards could be suppressed or reduced both in term of frequency or intensity. Some examples of
these measures to manage and control nature include flood control dams and barriers, landslides retaining
walls, or breakwater against coastal storms and tsunamis. On the other hand, once societies have assumed
that natural hazards cannot be completely prevented, vulnerability reduction measurements are the alter-
native way to diminish damages and losses from occurring extreme events.
    Regardless of the adopted measures (hazard or vulnerability reduction), a common necessary precon-
dition is required that it is related to a depth knowledge of the situation that is to be treated. In the case of
                                                                                                                                                    88
hazard reduction measurements this knowledge is about the natural extreme phenomena that usually take
place in a particular zone, including some basic parameters related to their magnitude (intensity), tempo-
ral patterns (frequency, duration, temporal spacing, speed of onset) and spatial patterns (areal extent and
spatial dispersion) (Burton et al., 1978). In the case of vulnerability reduction measurements, the focus of a
previous research is the affected society, in order to understand the existence of differences in damages and
losses among social groups and along the territory they occupy.
    Thus, vulnerability assessment and mapping is an essential stage of natural risk management and it con-
stitutes the research context of this particular study. This paper takes part of wider study for social vulnera-
bility assessment and mapping at different scales, with the aim of gaining knowledge on social vulnerability
assessment by the use of several set of data sources, and the application of different statistical and mapping
methods. As a first approach, the present study tries to assess social vulnerability for the province of Malaga,
from a generic point of view, so it is not focused on a particular hazard. The study makes use of three simple
standardization techniques for statistical data simplification in order to compare obtained results, and em-
ploys the 103 municipalities of this province as mapping units.

2. THEORETICAL BACKGROUND

In the context of risk analysis, United Nations defines vulnerability as “the conditions determined by phys-
ical, social, economic and environmental factors or processes that increase the susceptibility of an individ-
ual, a community, assets or systems to the impact of hazards” (UN, 2016). Despite this general and clear
definition, vulnerability has undergone a long and depth theoretical debate (Birkman et al., 2013). The
outcome of this debate is a much more complex concept in which different factors (exposure, fragility, cop-
ing capacity, or resilience) and multiple dimensions (physical, social, economic or environmental) could be

© Editorial Universidad de Sevilla 2021 | Sevilla, España| CC BY-NC-ND 4.0 | e-ISSN: 2340-2776 | doi: https://dx.doi.org/10.12795/rea.2021.i41.05
Sumita Gayen et al. / REA N. 41 (2021) 87 - 108
distinguished (Cardona, 2003; Cutter et al., 2003; Wisner et al., 2004; Birkman et al., 2013). As a consequence
of this long debate and of the theoretical complexity of the resulted concept, a lack of vulnerability assess-
ment studies was reported, especially in the case of vulnerability mapping (Perles-Roselló, 2010), although
in the last decade a great number of this sort of studies has taken place. Apart from the physical vulnera-
bility assessment in which real physical elements (buildings, infrastructures, land-cover patches) are used
to evaluate and mapping susceptibility or fragility to hazards (Duzgun et al., 2011; Papathoma-Köhle et al.,
2019), most of these aforementioned studies are especially focused on social vulnerability (Beccari, 2016;
Ran et al., 2020).
Social vulnerability has been defined as the susceptibility of social groups to potential losses from hazard
or resistance and resilience power of a society from hazard (Blaikie et al., 1994), or as a measure of the ca-
pability of some elements to withstand events of a certain physical character (Weichselgartner, 2001). Cutter
et al. (2003) indicate that it is a pre-existing condition of the population that influences its ability to prepare
for, respond to, and recover from hazard events, and Cannon et al. (2003) defined it as the complex set of
some characteristics that include a person’s initial well-being, livelihood and resilience, self-protection, so-
cial-protection, social and political networks and institutions.
Social vulnerability assessment is a process of identifying, quantifying, and analyzing the vulnerability
factors in a particular area. Most of these assessment studies are based on statistical data and indicators
gathered for different spatial units (mainly, administrative units) at different scales (from national level to
census tracts) and these same units are used for mapping purposes (Ran et al., 2020; Contreras et al., 2020).
In general terms, the assessment process consists of some basic phases (Beccari, 2016). As a first stage, (i)
statistical data are gathered for these spatial units. Indicator selection could be driven according to the type
of approach, namely hazard-specific, for those studies focused on a particular hazard (flood, earthquake
etc.), or generic, for those others in which social variables are used to measure vulnerability to any hazard
(Ran et al., 2020). Other authors (Barrionuevo & Perles Roselló, 2017; Perles Roselló et al., 2017) indicate the
relevance to define the type of vulnerability, namely susceptibility/fragility (vulnerability to the hazard), or
resilience (vulnerability to damage). In a second stage, (ii), some data treatments are carried out, including
some sort of normalization, reduction, weighting or aggregation techniques. Finally, (iii) vulnerability map- 89
ping is accomplished through the classification of the same spatial units. As stated above, a wide range of
scales have been used, ranging from global to local/urban studies (Bukvic et al., 2020) and, according to
these scales a great variety of spatial units have been employed ranging from countries, usually employed
in global studies, to different kind of census units for local and urban analysis. Following are some examples
of these varied studies.
As stated above, in the case of global analysis, countries are usually employed as spatial units, and it is
quite common that development data are used as vulnerability indicators (André, 2012). At regional scales,
different spatial units can be found in vulnerability assessment; some examples are countries, as in the case
of Latin America or Asia (CAF, 2014; Hoffmann & Blecha, 2020), NUTs, used in Europe (EEA, 2018), or river-ba-
sins, used in different world regions (Balica et al., 2009). Studies at national level show a great variety of
spatial units according to the different administrative units that can be found in each country. In the classical
study by Cutter et. al., (2003), Social Vulnerability Index (SoVI) was calculated for all the counties in the United
States. In China, the province is frequently used in most of the national scope studies (Yang et al., 2014; Yan &
Li, 2016). National scale assessments in European countries usually employ municipalities or equivalent ad-
ministrative sub national divisions, as in the case of Norway (Holand et al., 2011), Italy (Frigerio et al., 2018),
or Germany (Fekete, 2018). Below the national level, vulnerability assessments are usually carried out within
these last mentioned spatial units (municipalities) or in urban environments (Diaz-Sarachaga & Jato-Espino,
2020). In the case of Spain, census district is a widely employed spatial unit for this type of studies (Morales
et al., 2016; Navarro et al., 2020); however, some other more detailed studies have been accomplished, in
which cadastral parcels have been used for social vulnerability assessment and mapping (Tascón-González
et al., 2020).
© Editorial Universidad de Sevilla 2021 | Sevilla, España| CC BY-NC-ND 4.0 | e-ISSN: 2340-2776 | doi: https://dx.doi.org/10.12795/rea.2021.i41.05Sumita Gayen et al. / REA N. 41 (2021) 87 - 108
3. MATERIAL AND METHODS
3.1. Study area
Malaga province is located (Figure 1) in the southern part of the Spain and on the northern coast of the Med-
iterranean Sea, and is under autonomous community of Andalusia which is the most populous and the sec-
ond largest in area of the autonomous communities in the country. The area of the province is 7,308 square
kilometers. The population of Malaga is 1,641,121 (2018) and population density is 224.53/ sq. km. Malaga
has highest population density in Andalusia, and this population density is high mainly in the coastal zone.
The province contains 103 municipalities and the capital of the province is Malaga.
From a geological point of view, Malaga province belongs to the Betic System, that forms the most west-
ern segment of the Mediterranean alpine orogeny. The relief gains in elevation from the coast to the inner
lands, although one of its main characteristics is some sort of segmentation by which mountain ridges and
depressions take place (Insua-Arévalo et al., 2012; Gallegos Reina & Perles Roselló, 2019). Guadalhorce River
is the main river of the province and it divided the province into east and west. Guadalmedina, Guadiaro,
Genal, Rio Grande, Chillar, Rio Velez, Hozgarganta are other important rivers. Malaga has a Mediterranean
climate, with some climate subtypes, as subtropical in the east coastal sector, oceanic mediterranean in the
west part of the coast, and continental mediterranean in the inner areas of the province. The maximum tem-
perature in summer often surpass 40°C, and in winter it is quite soft in the coastal area, although it drops to
the freezing point in some places of the higher and inner areas. Annual rainfall is about 500 mm in average,
but heavy rain episodes are frequent and cause severe soil erosion and flood events (Gallegos Reina, 2013).
90
Figure 1. Location map of Malaga Province. Source: Own elaboration.
© Editorial Universidad de Sevilla 2021 | Sevilla, España| CC BY-NC-ND 4.0 | e-ISSN: 2340-2776 | doi: https://dx.doi.org/10.12795/rea.2021.i41.05Sumita Gayen et al. / REA N. 41 (2021) 87 - 108
River floods are the main hazard in the province of Malaga, especially as flash floods. Apart from the
aforementioned heavy rain episodes, some others natural contributing factors are the short and stepped
profiles of the typical mediterranean rivers, the proximity to the coast of high mountain ridges and the re-
duction of the vegetation cover in these mountain areas where main rainfalls take place (Madeca, 2017). As
the typical mediterranean paradox, another of the main hazards in Malaga province are droughts, that are
naturally caused by long period of rainfall scarcity (Ayuso et al., 2015), although human induced factors are
of great relevance (Sánchez & Del Moral, 2014). Another types of climate related hazards are forest fires,
especially during the summer period (Gutiérrez-Hernández et al., 2015), and coastal storms and erosion that
frequently take place during autumn and winter months (Prieto et. al., 2017). In the case of geophysical haz-
ards, the province of Malaga is located at the boundary region between Eurasian plate and African plate. So,
earthquake is more frequent than the other parts of Spain. The province has suffered earthquakes greater
than or equal to maximum intensity VIII (epicenter within Malaga province) in 1494 and 1680, or has been af-
fected by another relevant earthquake with epicenter in the province of Granada (Gayen et al., 2019). Except
the mega earthquakes happened in past, every year many minor earthquakes are also happened.
3.2. Selection of indicators
An indicator is a measurable variable which represents an associated factor. Pencheon (2007) explained,
indicator helps to understand, compare and improve a system. The indicators are not fixed and different
authors used different indicators. Selection of indicator depends on the purpose of the study (Weichsel-
gartner, 2001; Tapsell et al., 2005). The assessment of social vulnerability is a key issue of indicator based
measurement.
Indicators are not static. It changes with time and space. In same place and time, and working with iden-
tical hazard, selection of indicators may be different based on views, analysis criteria etc. of researchers.
For identical hazard, indicators can vary from one region to another region though researcher and time are
unchanged. It also depends upon country and event-specific characteristics (Kuhlicke et al., 2011). 91
Data under the different aspects have been collected from secondary source for the detail understand-
ing of social vulnerability. All the data have been collected from Instituto de Estadística y Cartografía de
Andalucía (IECA,) Junta de Andalucía. There are various physical, demographic, economic, social, and health
indicators which determine people’s level of exposure to vulnerable. Regarding to this, two types of relation-
ship found between indicator and social vulnerability (Table 1). For positive relationship, vulnerability of local
people increases with the presence of indicator whereas for negative relationship, vulnerability decreases
with increasing value of indicator. Negative value reduces the vulnerability and positive value increases the
vulnerability of local people of a region.
3.3. Description of indicators
3.3.1. Distance from capital
Province’s capital is the main functional nuclei of the area which provides all types of essential services,
medical supports and emergency recovery treatments. On the other hand, capital city plays an important
role for different administrative services which are very crucial during the hazard related policies. Citizen
having good economic condition as well as better job opportunities in and around this node and economic
growth rate is higher in capital compared to other region. Capital region is well connected by other regions
and it provides better relief facilities during the hazards. These all are responsible for declining the unsafe
condition of local people and decrease the social vulnerability.
© Editorial Universidad de Sevilla 2021 | Sevilla, España| CC BY-NC-ND 4.0 | e-ISSN: 2340-2776 | doi: https://dx.doi.org/10.12795/rea.2021.i41.05Sumita Gayen et al. / REA N. 41 (2021) 87 - 108
Table 1. Classifications of indicators.
Relationship with Year of data
Aspect Indicators Name Reference
vulnerability source
Locational Distance from capital DCA Positive 2014 Proposed in this research work
Gender GEN Positive 2018 Müller et al., 2011
Child population (below 5 years) CPO Positive 2018 Török, 2018
Aged population (65 years and above) APO Positive 2018 Reid et al., 2009
Dependency ratio DRA Positive 2018 Kalaycıoğlu et al., 2006
Demographic
Single parent nuclei SPN Positive 2011 Flanagan et al., 2011
Median age MAG Negative 2018 Burton et al., 2010
Foreigners FOR Positive 2011 Aksha et al., 2019
Birth rate BRA Positive 2017 Mavhura et al., 2017
Population density PDE Positive 2017 Caliskan et al., 2006
Large household (5 or more) LHO Positive 2011 Ge et al., 2017
Social Single and isolated living SLI Positive 2011 Girasole et al., 2017
Literacy rate LRA Negative 2001 Ahmad et al., 2016
Sport equipments/ 1000 population SEQ Negative 2005 de Oliveria Mendes, 2009
Renters REN Positive 2001 Armenakis et al., 2017
92
Employment rate ERA Negative 2018 Dwyer et al., 2004
Economic Population related to agriculture PRA Positive 2009 Chen et al., 2013
Average net income (annual in euro) ANI Negative 2016 Kirby, 2015
Per capita income (annual in euro) PCI Negative 2016 Emrich & Cutter, 2011
Mortality rate MRA Positive 2017 Lowe et al., 2013
Infant mortality rate IMR Positive 2017 Gayen et al., 2020
Health
Primary health care/1000 population PHC Negative 2016 Fekete, 2009
Number of pharmacy/1000 population NPH Negative 2016 Guillard-Gonçalves et al., 2014
Source: Own elaboration.
3.3.2. Gender
Gender is one of the most common determinants of hazard’s susceptibility and it has been considered by
several researchers for people exposure examination like Dwyer et al. (2004), Tapsell et al. (2005) and Kuh-
liche et al. (2011). Biologically women section of society is more vulnerable than men specially to overcome
the negativity of hazards condition (Dwyer et al., 2004; Morrow, 1999). When any natural hazards strikes
then they are busy to protect their children and other family members and take care the injured and sick
persons of the family. So, the morbidity and co-morbidity rates of women have been found higher in many
hazard events. Women are less educated, so they have few job opportunities and it becomes more during
© Editorial Universidad de Sevilla 2021 | Sevilla, España| CC BY-NC-ND 4.0 | e-ISSN: 2340-2776 | doi: https://dx.doi.org/10.12795/rea.2021.i41.05Sumita Gayen et al. / REA N. 41 (2021) 87 - 108 post-disaster period. Sometimes they obtained a low status job (Morrow, 1999). Disaster forced women to do work outside the home in an unsafe condition. Economically, women are weaker than men, so they are more vulnerable. Women's vulnerability is also increased due to the loss of family members. It increases more when the head of the family has died and all the responsibilities come on their shoulder. After the haz- ard women's responsibilities are also expanded at a large extend. Thus, more numbers of women depended family creates high vulnerability in the society. 3.3.3. Child population Children below five years age are the most vulnerable groups in the society during disaster events (Cutter et al., 2003). Children have less physical strength to survive from disasters and they are frequently depend- ent on others for survival. Children under the five years old are more impacted age group in society due to the presence of abnormal surroundings. They are innocent and they are not able to take their decisions i.e. they are dependent on others for any types of activities support. Children are vulnerable due to lack of their education, previous experience and knowledge. They don't understand what to do during hazardous moments. As children are more closed to women group, their openness towards negativity due to hazards is also wider. 3.3.4. Aged population The older persons have knowledge, but sometimes they are physically disabled and challenged to work for activity. They could also have some hearing and visibility problems. They don't move quickly from one place to another place. They have lack of advance knowledge like communicating others people by internet. Generally elder population has less resistance power of disease. So they are easily affected by waterborne infectious diseases, which are common consequences of many disasters. Which age is more vulnerable? Nobody mentioned any fixed age for it. People above 65, are more vulnerable (Dwyer et al., 2004). Generally, the vulnerability of elders depends on their physical strength. Some old persons are physically stronger than 93 their below aged persons but due to the co-morbidity condition and long term hazardous exposure they are more vulnerable during in society. 3.3.5. Dependency ratio Here dependency ratio is calculated by % of population under the age of 16 and over 65 years of age along with the people of physically challenged in respect to the population between the ages of 16 and 65 years. Actually it is a ratio between non-working and working population. It shows the pressure of economically productive and working population in a society (Chen et al., 2013). Depended peoples need extra services for their safety and security. Area of high depended population claims extra improvement in the infrastruc- ture sector to minimize the dynamic pressure of hazards event. Higher dependency ratio indicates lower collection of government tax, because working population has a greater responsibility to pay tax. Higher dependency ratio could create labor shortages that can reduce agriculture and industrial production. Lower dependency ratio might be better for pension providers and health care providers but it promotes economic growth of a society. Families with large number of dependents have limited financial opportunities. So dur- ing the recovery phase of hazard, they have to face many problems. 3.3.6. Single parent nuclei Child nurturing is very difficult for single parent under any circumstances and parent has sole liability for all activities to support their livelihood. In this case the parent’s responsibility is greater as the child is depend- ent on only one person. All the activities are financially difficult and this family nucleus is socially isolated. During the extreme event condition the single parent try to provide all supports and company to their child. © Editorial Universidad de Sevilla 2021 | Sevilla, España| CC BY-NC-ND 4.0 | e-ISSN: 2340-2776 | doi: https://dx.doi.org/10.12795/rea.2021.i41.05
Sumita Gayen et al. / REA N. 41 (2021) 87 - 108

Beside the all physical hindrances and community resources it is harder for parent to leave the child at home
(Copeland & Synder, 2011). These all result extra pressure, stress and fatigue on the parent which increase
high risk of depression. So, this type of family structure is considered as a root cause of social stress and
backwardness for hazards management.

3.3.7. Median age

Median age is the midpoint or middle age that divides a population into two equal groups - that is, half the
people are younger than this age and half are older. It indicates the average age of a population. Low medi-
an age means major part of the population is fertile. Whereas, higher median age signifies declining fertility
rates and rising life expectancy with poor equipped to hazards management. Four main aspects are more
closely linked with heightened vulnerability of higher median age society and these are i) physical decline in-
cluding poor health, mobility, sight and hearing, ii) paucity of service provision, support and information, iii)
age discrimination which serve to exclude and isolate them, iv) high poverty level which increase low social
protection and better opportunities. Thus the high median age reduces the capability towards the prepar-
edness to disasters i.e it is negatively linked with social vulnerability of a region.

3.3.8. Foreigners

Generally, foreigners are not well integrated into the society of destination country normally they have lim-
ited social and family networks here. New foreigners have lack of connections to the larger community and
they feel hesitate to communicate outside their ethnic group for a variety of reasons (Morrow, 1999). They
are not well familiar about the local area and also have language barrier, lack of awareness of health services
and lack of proper knowledge about their rights and rules. Similarly, they have very little scope to cope up
the extreme event results.

3.3.9. Birth rate                                                                                                                                   94

The birth rate is the expression of total number of live births per 1,000 populations in a year. Along with the
increasing numbers of dependent population, high birth rate puts heavy burdens on social infrastructure
like health care, essential services, education, land, environment, per capita income, mental supports and
public utility services (water, electricity, transport). Infant population requires larger demand on nutritional
food without any interruption. High birth rate also indicates large number of infant and child population.
Due to the larger exposure to hazards they are most likely to be seriously affected by natural hazards, but
they do not able to recover them self without any support. During the recovery phase of hazard, they could
also be affected by disease.

3.3.10. Population density

Population density is calculated by dividing the population by the geographical land area. Thus the spatial
concentration of population in any region is subjected to significant risk of death or damage caused by
prominent hazards. Day and night time concentration of population is also controlled the impact of hazards.
Like central business district of a city has high probability of life loss during the day time and night time it has
very low impacts on society. Positive relationship is found between population density and vulnerability that
means high population density incumbents high vulnerability of the society and vice versa. For example, if
a large earthquake happens in a large open field, it has little danger. On the other hand, a relatively weak
earthquake can pose great risks to human life and economy in densely populated areas.

© Editorial Universidad de Sevilla 2021 | Sevilla, España| CC BY-NC-ND 4.0 | e-ISSN: 2340-2776 | doi: https://dx.doi.org/10.12795/rea.2021.i41.05
Sumita Gayen et al. / REA N. 41 (2021) 87 - 108

3.3.11. Large household

Large household increases high chances of vulnerability to hazards. During the critical time this types of
household put extra pressure to accumulate huge numbers of recovery resources for members. Similarly,
it takes more recovery options to come out from the unusual condition. Large household has numerous
residents with low availability of community resources. On the other hand, large household has lower per
capita income. If they have few working persons, they cannot able to increase the income to cover the losses
by hazards.

3.3.12. Single and isolated living

Sometime single and isolated households are economically poor. After hazard they could be suffered with
economic problems. The single living persons have also problems during the time of hazard. They may have
lack of sufficient human resources to rescue. After the hazard event they could also have the migration prob-
lem. If they are injured, no other person is there to take care of them. During or after the hazard they are
mentally disturbed also. On that moment they need family support and want some family members to re-
lease anxiety and pressure. They can feel loneliness which increases more chances towards long vulnerability.

3.3.13. Literacy rate

Education can play an important role to reduce the vulnerability level. A strong negative relationship has
been found between education and vulnerability. With proper education one person can learn how to save
himself during hazard. Education is related with access to weather forecasts and warnings as well as the
types of technologies used to access weather information (Rodríguez et al., 2007). Higher standard of educa-
tion presents greater chance of employment. Education level can enhance ability to cope with environmen-
tal disasters and stress (Wamsler et al., 2012). Educated people can better use the social network which is
important tool for emergency planning and preparedness.                                                                                             95

3.3.14. Sport equipments/ 1000 population

Sport along with the physical exercise helps to develop mental and physical toughness and makes people
strong and active. Sport is important for everybody as it reduces stress and enhances mood, it helps to grow
the immunity power of human body. It is an excellent way of preventing several chronic diseases such as
cardiovascular diseases. Beside these all this facility can encourage youth to involve in the disaster rescue
and recovery process. Thus, it has a negative relationship with vulnerability.

3.3.15. Renters

Rented peoples don’t have their own house. They live in a rent house because they are either transient or
they do not have sufficient money to buy their own home (Cutter et al., 2003). Sometimes they have to pay
higher rents. They are not able to repair their homes without permission of landlords. Even the rented house
became dilapidated condition due to the lack of proper maintenance. Both the indoor and outdoor condi-
tions are found unhygienic. Similarly, after the hazard, rented house becomes too costly and so renters are
lack of sufficient shelter options. So, rented people are more vulnerable, compared to people who have their
own house.

3.3.16. Employment rate

Employed peoples have good standard of living and opportunities of health care. The employee has liable to
pay tax which is further invested for the different type infrastructural development. As they have secure job

© Editorial Universidad de Sevilla 2021 | Sevilla, España| CC BY-NC-ND 4.0 | e-ISSN: 2340-2776 | doi: https://dx.doi.org/10.12795/rea.2021.i41.05
Sumita Gayen et al. / REA N. 41 (2021) 87 - 108

opportunity they are able to recover their economic hindrance. The jobless people are more vulnerable to
malnutrition and hunger. They have less opportunity of health care. According to Pharr et al. (2012) low op-
portunity in employment scenario of society tends to show high level of weak mental health which increases
social vulnerability.

3.3.17. Population related to agriculture

Agriculture is nature dependent economic activity and it requires the superimposition of natural as well as
cultural components at the same geographical location. Now-a-days, human control in cultivation process
has played a significant role for the productions of agriculture, yet people are helpless to some natural haz-
ards. Many natural acts (like, flood, drought, storms) damage the yield of agriculture within a short span of
time. Peoples, who are engaged in agriculture, are more vulnerable as agriculture depends on weather and
other hydro-morphological and geological situations (Chen et al., 2013). Crop failure due to extreme environ-
ment phenomenon raises the worst situation in the society and people have to wait for long time to escape
them from the negative situation.

3.3.18. Average net income

It shows the average and overall economic condition of all residences in a specific area. Higher income con-
dition of people improves the education level, health care facilities and quality of life. The comprehensive net
income of a society makes all people financially strong for every aspect of economic progress. It improves
the base level of quality of life of a region and capability of self-resilience. Thus, the people having better
average net income can able to move out quickly from the exposure of negative situation of hazards.

3.3.19. Per capita income

Per capita income measures the earning per person in a particular region. Greater per capita income indi-                                           96
cates higher standard of living, more occupation opportunities, and instant investment for recovery process.
It also indicates the individual capacity of financial strength. So, it has negative relation with the social vul-
nerability of a particular region.

3.3.20. Mortality rate

Mortality rate is usually expressed in number of deaths per 1,000 persons per year in a particular region.
Nobel laureate Sen (1998) said that mortality rate is an indicator of economic success and failure. There is
a significant relationship between mortality rate and poverty. Poor people are not able to get sufficient and
protein rich food. It creates malnutrition, prone to disease and an increased likelihood of dying from the
disease. High mortality rate indicates high vulnerability of people.

3.3.21. Infant mortality rate (IMR)

IMR is the number of deaths per 1000 live births of children under one year of age. The rate is often used as
an indicator to measure the health and well being of a region or a nation. It shows large disparities between
developed and developing countries. It also varies across different socio-economic groups. Premature birth
is the most important contributor to the IMR. Low birth weight, malnutrition, infectious diseases, poverty
are other causes of IMR. High infant mortality rate indicates infants and children are unsafe from different
diseases.

© Editorial Universidad de Sevilla 2021 | Sevilla, España| CC BY-NC-ND 4.0 | e-ISSN: 2340-2776 | doi: https://dx.doi.org/10.12795/rea.2021.i41.05
Sumita Gayen et al. / REA N. 41 (2021) 87 - 108

3.3.22. Primary health care/ 1000 population

Primary health care plays an important role to recovery the health system. The main role of primary health
care is to provide continuous and comprehensive care to the patients. It normally located in the close prox-
imity with a limited distance from home. Thus, the presence of primary health centers indicates better con-
dition of society and it provides the basic treatments during the time of emergency condition. Surgery or
critical care of patients is not provided by primary health care but it offers basic treatment to people. In many
countries it is a holistic health care system where every people can access medical facilities in low cost or
totally free. Primary health care is an essential component of human health and its presence minimizes the
social vulnerability.

3.3.23. Number of pharmacy/ 1000 population

Pharmacy sells medicine, life saving goods and health care products within a particular belt of society. If
there is a drugstore near home, medicine is available within a short period of time and life can save imme-
diate. Thus, the people can arrange medical needs with an emergency requirement which safe the lives
and escape a large numbers of people from the vulnerable situation. So, its availability and instant function
shows the lowering condition of social vulnerability.

3.4. Standardization methods

To calculate the indicators, data have been standardized by using three different methodologies explained
hereafter. Standardization is the process of putting different variables from different scale to same scale. It
allows comparing scores between different types of variables.

3.4.1. Maximum value transformation                                                                                                                 97

In maximum value transformation (Eq. 1 and 2), data are transformed, such that the features lie within a
specific range (0-1). It is the ratio between actual value and maximum value of the variable. Higher value
means vulnerability is high. Wu et al. (2002), Chakraborty et al. (2005) and Koks et al. (2015) used maximum
value transformation standardization method in their study.
   For positive relationship,

                                                                xi
                                                           x = max       (Eq. 1)

   Where, xi= Actual value, max= Maximum value
   For negative relationship,

                                                                  xi
                                                        x = 1–           (Eq. 2)
                                                                 max

   Where, xi= Actual value, max= Maximum value

3.4.2. Z score transformation

Z-score is numerical measurements (Eq. 3) that describe the position of a raw score in terms of its distance
from the mean when measured in standard deviation. Z-scores may be positive or negative. A positive value
indicates the score is above the mean and a negative value signifies it is below the mean. Zero z-score value

© Editorial Universidad de Sevilla 2021 | Sevilla, España| CC BY-NC-ND 4.0 | e-ISSN: 2340-2776 | doi: https://dx.doi.org/10.12795/rea.2021.i41.05
Sumita Gayen et al. / REA N. 41 (2021) 87 - 108
represents that the data point’s score is identical to the mean score. Zhang & Huang (2013), Evans et al. (2014)
and Lee (2014) used this standardization method for analysis social vulnerability index.
The formula for calculating a z score is
x = (q - µ) / σ (Eq. 3)
Where, q= Actual value, µ= Mean, σ= Standard deviation
For positive relationship, final value adds with total value and for negative relationship final value is de-
ducted from total value.
3.4.3. Min-max rescaling transformation
Min-max rescaling is a standardization method (Eq. 4 and 5) that rescales a set of data. In this method, data
are transformed to a specific range (0-1). The formula is as follows:
For positive relationship,
xi-min
x= (Eq. 4)
max-min
Where, xi= Actual value, min= Minimum value, max= Maximum value
For negative relationship,
max-xi
x = max-min (Eq. 5)
Where, max= Maximum value, xi= Actual value, min= Minimum value
Cutter et al. (2010), Khan & Salman (2012), Sajjad & Jain (2014), de Mello Rezende (2016), Tali et al. (2016), 98
Kablan et al. (2017) and Žurovec et al. (2017) used min-max rescaling as a standardization method.
Social vulnerability index (SVI) or final value has been calculated by average of all indicators for each mu-
nicipality for each standardization method.
4. RESULTS
The analysis of SVI has highlighted socio-economic picture of Malaga province. The result for the Malaga
province has been analyzed by using all the indicators separately as shown below in Table 2.
Based on standard deviation score of each methodology adopted, SVI score are grouped into five differ-
ent categories, hereafter called as vulnerable zones.
‒ Very low vulnerable zone (< -1.5 std. dev.).
‒ Low vulnerable zone (-1.5 – -0.50 std. dev.).
‒ Medium vulnerable zone (-0.50 – 0.50 std. dev.).
‒ High vulnerable zone (0.50 – 1.5 std. dev.).
‒ Very high vulnerable zone (> 1.5 std. dev.).
Figure 2 represents the five different vulnerable zones of Malaga province. It shows that very high vulner-
able municipalities are located mainly in western part of Malaga province and least vulnerable municipalities
are located in southern part of the province. In some cases, very low and very high municipalities are situ-
ated alongside. A large number of municipalities fall under medium vulnerable category. The capital of the
province, Malaga is also categorized in medium vulnerable zone.
© Editorial Universidad de Sevilla 2021 | Sevilla, España| CC BY-NC-ND 4.0 | e-ISSN: 2340-2776 | doi: https://dx.doi.org/10.12795/rea.2021.i41.05Sumita Gayen et al. / REA N. 41 (2021) 87 - 108
Table 2. Indicators and their minimum value, maximum value, mean and standard deviation.
Minimum
Sl. No. Indicators Maximum Value Mean Standard Deviation
Value
1 Distance from capital 0 153 66 35.06
2 Gender 42.22 51.95 49.02 1.57
3 Child population (below 5 years) 0.76 6.72 3.80 1.19
4 Aged population (65 years and above) 11.26 35.89 22.25 5.62
5 Dependency ratio 44.15 85.19 56.59 7.91
6 Single parent nuclei 0 33.98 13.60 6.93
7 Median age 37.03 53.8 45.12 3.69
8 Foreigners 1.01 55.41 11.38 11.91
9 Birth rate 0 10.65 3.66 2.01
10 Population density 4.7 7,204.71 260.47 839.15
11 Large household (5 or more) 0 12.85 3.75 4.18
12 Single and isolated living 3.94 22.93 10.42 3.93
13 Literacy rate 85.4 99 94.31 2.60
14 Sport equipments/ 1000 population 0.95 18.39 3.94 3.13
15 Renters 0 9.61 3.25 2.20
16 Employment rate 67.58 91.54 77.83 4.13
99
17 Population related to agriculture .01 31.38 9.03 7.04
18 Average net income (annual in Euro) 6060.71 21061.51 10671.11 3190.53
19 Per capita income (annual in Euro) 2042.84 9113.01 4058.50 1326.07
20 Mortality rate 0 25.25 6.06 3.50
21 Infant mortality rate 0 166.67 3.23 18.53
22 Primary health care/ 1000 population 0.03 5.85 1.03 1.29
23 Number of pharmacy/ 1000 population 0 5.52 0.96 1.11
Source: Own elaboration.
Table 3. Very low vulnerable municipalities.
Standardization Methods Name of the Municipalities
Atajate, Benalauria, Juzcar, Macharaviaya, Moclinejo, Pujerra, Rincon de la
Maximum value transformation
Victoria, Salares
Alhaurin de la Torre, Atajate, Benahavis, Juzcar, Macharaviaya, Moclinejo,
Z score transformation
Rincon de la Victoria
Min–max rescaling transformation Atajate, Benahavis, Juzcar, Macharaviaya, Moclinejo, Rincon de la Victoria
Source: Own elaboration.
© Editorial Universidad de Sevilla 2021 | Sevilla, España| CC BY-NC-ND 4.0 | e-ISSN: 2340-2776 | doi: https://dx.doi.org/10.12795/rea.2021.i41.05Sumita Gayen et al. / REA N. 41 (2021) 87 - 108
100
Figure 2. Social vulnerability map of Malaga Province based on three different methodologies. Source: Own elaboration.
© Editorial Universidad de Sevilla 2021 | Sevilla, España| CC BY-NC-ND 4.0 | e-ISSN: 2340-2776 | doi: https://dx.doi.org/10.12795/rea.2021.i41.05Sumita Gayen et al. / REA N. 41 (2021) 87 - 108
Table 3 shows the very low vulnerable municipalities that obtained from by adopting three different
methodologies separately. Atajate (A), Juzcar (B), Macharaviaya (C), Moclinejo (D), Rincon de la Victoria (E)
municipalities are common to each methodologies adopted and so categorized in very low vulnerable zone
because of low population density, dependency ratio, foreign population, renter, birth rate, mortality rate
and infant mortality rate (letters stand to identified municipalities on maps). Also small household and high
literate population are reasons of low vulnerability. But all these four municipalities have low employment
rate and still falls under very low vulnerable zones. Benahavis municipality is also falls under very low vulner-
able zone but common for two types of standardization methods not three. Whereas, Benalauria, Pujerra,
Salares, Alhaurin de la Torre municipalities are marked in very low vulnerable category by adopting only one
type of standardization method.
Table 4. Very high vulnerable municipalities.
Standardization Methods Name of the Municipalities
Maximum value transformation Alcaucin, Benadalid, Casares, Cuevas del Becerro, Gaucin, Guaro, Istan, Riogordo
Z score transformation Alcaucin, Benadalid, Cuevas del Becerro, Fuengirola, Gaucin, Guaro, Istan
Min–max rescaling transformation Alcaucin, Benadalid, Cuevas del Becerro, Gaucin, Guaro, Istan
Source: Own elaboration.
The top six municipalities with the highest vulnerability (Table 4) that has been identified in this study are
Alcaucin (1), Benadalid (2), Cuevas del Becerro (3), Gaucin (4), Guaro (5), Istan (6) (numbers stand to identified
municipalities on maps). Except Alcaucin, other five municipalities located in western part of the province.
The main causes of vulnerability in these municipalities are high female population, less sports facilities,
moderately high unemployment rate, high dependency ratio, low net income and low income/population.
But these municipalities have also low population density, less foreign population and low infant mortality
101
rate (except Istan). Casares, Riogordo, Fuengirola municipalities are also identified as a very high vulnerable
category, but are resultant of only employing of one type of standardization method.
Results obtained from the correlation shows (Table 5) both positive and negative relationship between
different indicators. Relationship between aged population and median age; between aged population and
dependency ratio; between primary health care and pharmacy are positively high. If aged population is
more, median age of the population and dependency ratio will be also high. On the other side, high rate
of child population reduces the average age of the population. So, high negative relationship has been
found between child population and median age of population. % of agricultural population and average
net income has moderately strong negative relationship in between and the same relationship also exists
between % of agricultural population and per capita income.
The correlations between the three methodologies are shown in Table 6. All of the correlations presented
are statistically significant.
Pearson’s correlation coefficient is the test statistics that measures the strength and statistical relation-
ship between two variables. The result indicates that the strength between maximum value transformation
and z score transformation (0.89) is strong. The values of the correlation coefficient are 0.93 (between max-
imum value transformation and min–max rescaling transformation) and 0.98 (between z score transforma-
tion and min–max rescaling transformation) which signify extremely strong relation.
© Editorial Universidad de Sevilla 2021 | Sevilla, España| CC BY-NC-ND 4.0 | e-ISSN: 2340-2776 | doi: https://dx.doi.org/10.12795/rea.2021.i41.05Sumita Gayen et al. / REA N. 41 (2021) 87 - 108
Table 5. Pearson’s Correlation Coefficient between different indicators.
DCA GEN CPO APO DRA SPN MAG FOR BRA PDE LHO SLI LRA SEQ REN ERA PRA ANI PCI MRA IMR PHC NPH
DCA 1
GEN -0.12 1
CPO -0.36 0.39 1
APO 0.36 -0.35 -0.74 1
DRA 0.15 -0.09 -0.37 0.82 1
SPN 0.25 0.22 0.18 -0.11 -0.11 1
MAG 0.41 -0.40 -0.80 0.97 0.69 -0.08 1
FOR -0.21 -0.03 0.06 0.11 0.35 -0.18 0.04 1
BRA -0.29 0.14 0.48 -0.47 -0.36 -0.04 -0.45 -0.01 1
PDE -0.27 0.30 0.18 -0.21 -0.15 0.09 -0.22 0.22 0.09 1
LHO -0.36 0.34 0.45 -0.57 -0.39 0.07 -0.60 -0.07 0.30 0.18 1
SLI 0.31 -0.26 -0.39 0.61 0.43 0.05 0.65 0.09 -0.35 -0.05 -0.52 1
LRA -0.27 0.18 0.14 -0.33 -0.29 -0.03 -0.34 0.26 0.13 0.29 0.21 -0.23 1
SEQ 0.44 -0.24 -0.30 0.41 0.21 0.18 0.47 0.11 -0.33 -0.05 -0.43 0.55 -0.06 1
REN 0.09 0.21 -0.02 -0.19 -0.19 0.15 -0.15 -0.03 0.14 0.11 0.19 -0.15 0.21 -0.14 1
ERA -0.06 0.14 0.34 -0.26 -0.09 0.16 -0.30 0.15 0.01 0.12 0.08 -0.19 0.10 -0.04 -0.04 1
PRA 0.13 -0.48 -0.48 0.59 0.33 -0.05 0.63 -0.16 -0.40 -0.32 -0.43 0.51 -0.27 0.35 -0.45 -0.14 1 102
ANI -0.27 0.49 0.55 -0.67 -0.41 0.22 -0.67 0.27 0.28 0.46 0.42 -0.42 0.43 -0.20 0.38 0.41 -0.68 1
PCI -0.24 0.53 0.35 -0.56 -0.37 0.24 -0.57 0.00 0.25 0.38 0.45 -0.45 0.44 -0.35 0.48 0.28 -0.61 0.81 1
MRA 0.27 -0.13 -0.29 0.41 0.27 0.10 0.44 -0.12 -0.18 -0.17 -0.31 0.44 -0.18 0.37 -0.17 0.28 0.34 -0.39 -0.35 1
IMR 0.00 0.04 0.04 -0.08 -0.08 0.05 -0.08 -0.01 -0.40 -0.01 0.28 -0.07 -0.02 0.01 0.00 0.15 -0.07 0.10 0.08 -0.02 1
PHC 0.46 -0.40 -0.36 0.54 0.32 0.15 0.58 -0.15 -0.40 -0.21 -0.48 0.61 -0.18 0.66 -0.20 -0.07 0.56 -0.50 -0.49 0.34 -0.08 1
NPH 0.45 -0.27 -0.28 0.51 0.38 0.27 0.53 -0.11 -0.34 -0.15 -0.43 0.62 -0.28 0.61 -0.17 0.02 0.48 -0.40 -0.44 0.37 -0.07 0.85 1
Source: Own elaboration.
Table 6. Pearson’s correlation coefficient between three methodologies.
Maximum value transformation Z score transformation Min–max rescaling transformation
Maximum value transformation 1
Z score transformation 0.89 1
Min–max rescaling transformation 0.93 0.98 1
Source: Own elaboration.
© Editorial Universidad de Sevilla 2021 | Sevilla, España| CC BY-NC-ND 4.0 | e-ISSN: 2340-2776 | doi: https://dx.doi.org/10.12795/rea.2021.i41.05Sumita Gayen et al. / REA N. 41 (2021) 87 - 108
5. DISCUSSION
As a first approach, this analysis of social vulnerability in Malaga province has highlighted the present loca-
tional, demographic, social, economic, and health condition of the province. This municipality-wise analysis
has explained all the indicators adopted and identified different groups of vulnerable municipalities. These
groups are very similar regardless of the applied standardization method, as has been shown by correlation
coefficients. Equivalent results have been obtained in other studies where the outcomes of different deduc-
tive methodologies are very highly correlated with each other (Yoon, 2012).
Main causes of very high vulnerability are mainly low net income and low income/population, high fe-
male population, moderately high unemployment rate and high dependency ratio. In a broad sense, similar
results are usually obtained by other studies in different contexts (Cutter et al., 2003; Morales et al., 2016;
Navarro et al., 2020).
In spite of these acceptable results, among the main aims of this initial research are to detect and outline
weaknesses and limitations to be overcome in future works. The following are the most relevant ones.
As general weaknesses of social vulnerability assessments are to examine the validation of obtained
vulnerability indicators (Beccari, 2016). In few cases this validation is accomplished by comparison among
vulnerability indicators and disaster damages and losses information (Yoon, 2012). In order to develop a
similar approach in our context, different data sources should be explored in future research, namely di-
rect information from municipalities, data compiled by civil protection authorities, or by private or public
insurance companies (Consorcio de Compensación de Seguros). Also related to data and indicators, future
vulnerability studies could be focused on a specific hazard or group of hazards, in such a way as enable some
improvement on indicators selection criteria.
Similarly, data reduction and aggregation techniques need to be largely improved. Although in the pres-
ent study a comparison of normalization methods was accomplished, a very simple aggregation technique
was employed and no data weighting or reduction was applied. In the next research steps, principal com-
ponent analysis (PCA) would be adopted, as one of the most extended and successful methodologies (Con-
treras et al., 2020). 103
Municipalities show some advantages mainly related to data gathering, both on socio-economic and dis-
aster damages data. Nevertheless, municipality extent should be very unsuitable if social vulnerability assess-
ments and the resulted maps are to be used for subsequent risk studies by mean of integration of vulnera-
bility and hazard maps. While an increasing spatial detail has been reached in hazard mapping (Muhadi et al.,
2020), only some aspects of vulnerability related to characteristics of buildings, infrastructures or land-use
patches (Papathoma-Köhle et al., 2019), or related to spatial indicators like accessibility (Barrionuevo & Perles
Roselló, 2017), show comparable levels of spatial resolution. To overcome this gap among social vulnerability
and hazard maps, indicators based social vulnerability assessment should look for other types of spatial units
as census district or cadastral parcels and buildings (Navarro et al., 2020; Tascón-González et al., 2020).
6. CONCLUSION
Natural hazards cause great damages all over the world. Hazard maps can identify hazard prone areas
but cannot able to measure the vulnerability of population in any region. Social vulnerability measures the
susceptibility of social groups to the impacts of hazards and it is an important tool of hazard risk reduction
system. The analysis of social vulnerability in Malaga province has highlighted the present locational, de-
mographic, social, economic and health condition of the province. Key causes of very high vulnerability are
mainly economic factors like, high dependency ratio, unemployment rate and low income. To overcome
from this vulnerability, vulnerable municipalities need to have more economic activities. This study also
investigated spatial patterns of social vulnerability in Malaga province using three different standardization
methods. The results obtained from these methodologies are almost same. So any of the methodologies
used in this paper, could potentially be employed to identify vulnerable municipalities for another province.
© Editorial Universidad de Sevilla 2021 | Sevilla, España| CC BY-NC-ND 4.0 | e-ISSN: 2340-2776 | doi: https://dx.doi.org/10.12795/rea.2021.i41.05Sumita Gayen et al. / REA N. 41 (2021) 87 - 108
Municipality-wise survey is a small scale survey and there is scope for detail studies which could be very
useful for planning to development. This study will help to build the distribution of vulnerable municipalities
in Malaga province which is important for hazard management and thus to identify the socio-economically
vulnerable community.
Acknowledgements
This work take part of the project PID2019-106834RB-I00 “Prototipo Cloud de Evaluación de Riesgos a Través
de la Integración Espacial de Geodatos (Grid Multiescalares) y Clientes Web (Dashboard) para su Gestión y
Medidas de Adapta”.
Conflicts of interest and authorship statement
The authors declare no conflict of interest.
Author Contributions:
‒ Introduction, data gathering, methodology, calculation, result analysis, conclusion: Sumita Gayen.
‒ Conceptualization, introduction, mapping, discussion and supervision: Ismael Vallejo Villalta.
‒ Conceptualization, introduction, methodology, result analysis: Sk. Mafizul Haque.
REFERENCES
Ahmad, H. F., Bhat, M. S., Alam, A. & Ahmad, S. (2016). Flood hazard zonation and vulnerability assessment of Greater
Srinagar, J&K, India. Int. J. Adv. Res., 4(12), 1679-1690. http://dx.doi.org/10.21474/IJAR01/2570
Aksha, S. K., Juran, L., Resler, L. M. & Zhang, Y. (2019). An analysis of social vulnerability to natural hazards in Nepal using 104
a modified social vulnerability index. Int J Disaster Risk Sci., 10, 103–116. https://doi.org/10.1007/s13753-018-0192-7
André, G. (2012). Natural hazard mapping across the world. A comparative study between a social approach and an eco-
nomic approach to vulnerability. Cybergeo: European Journal of Geography. https://doi.org/10.4000/cybergeo.25297
Armenakis, C., Du, E. X., Natesan, S., Persad, R. A. & Zhang Y. (2017). Flood risk assessment in urban areas based on spa-
tial analytics and social factors. Geosciences, 7(4), 123. https://doi.org/10.3390/geosciences7040123
Ayuso, J. L., Ayuso-Ruiz, P, García-Marín, A. P., Estévez, J. & Taguas, E. V. (2015). Local analysis of the characteristics and fre-
quency of extreme droughts in Málaga using the SPI (Standardized Precipitation Index). 17th International Congress
on Project Management and Engineering Logroño, 17-19th July 2013 (pp. 881-894). http://dx.doi.org/10.1007/978-3-
319-12754-5_13
Balica, S.F., Douben, N. & Wright, N.G. (2009). Flood vulnerability indices at varying spatial scales. Water Science & Techno-
logy, 60(10). https://doi.org/10.2166/wst.2009.183
Barrionuevo, J. F. S. & Perles Roselló, M. J. (2017). Methodology for vulnerability mapping of the territory against the risk
of flood related to assistance systems. Application to bajo Guadalhorse flood area. Geography Papers, 63. http://
dx.doi.org/10.6018/geografia/2017/307051
Beccari, B. (2016). A comparative analysis of disaster risk, vulnerability and resilience composite indicators. PLOS Currents
Disasters, 14(1). https://doi.org/10.1371/currents.dis.453df025e34b682e9737f95070f9b970
Birkmann, J., Cardona, O.D., Carreño, M.L., Barbat, A.H., Pelling, M., Schneiderbauer, S., Kienberger, S., Keiler, M., Alexan-
der, D., Zeil, P. & Welle, T. (2013). Framing vulnerability, risk and societal responses: the MOVE framework. Nat Ha-
zards, 67, 193–211. https://doi.org/10.1007/s11069-013-0558-5
Blaikie, P., Cannon, T., Davis, I. & Wisner, B. (1994). At risk: natural hazards, people vulnerability and disasters. 1st edition.
Routledge.
Bukvic, A., Rohat, G., Apotsos, A. & de Sherbinin, A. (2020). A systematic review of coastal vulnerability mapping. Sustai-
nability, 12, 2822. https://doi.org/10.3390/su12072822
© Editorial Universidad de Sevilla 2021 | Sevilla, España| CC BY-NC-ND 4.0 | e-ISSN: 2340-2776 | doi: https://dx.doi.org/10.12795/rea.2021.i41.05You can also read