Navy Force Structure and Shipbuilding Plans: Background and Issues for Congress - Ronald O'Rourke Specialist in Naval Affairs
←
→
Page content transcription
If your browser does not render page correctly, please read the page content below
Navy Force Structure and Shipbuilding Plans:
Background and Issues for Congress

Ronald O'Rourke
Specialist in Naval Affairs

March 3, 2015

                              Congressional Research Service
                                                    7-5700
                                               www.crs.gov
                                                    RL32665
Navy Force Structure and Shipbuilding Plans: Background and Issues for Congress
Summary
The Navy’s proposed FY2016 budget requests funding for the procurement of nine new battle
force ships (i.e., ships that count against the Navy’s goal for achieving and maintaining a fleet of
306 ships). The nine ships include two Virginia-class attack submarines, two DDG-51 class Aegis
destroyers, three Littoral Combat Ships (LCSs), one LPD-17 class amphibious ship, and one
TAO(X) class oiler. The Navy’s proposed FY2016-FY2020 five-year shipbuilding plan includes a
total of 48 ships, compared to a total of 44 ships in the FY2015-FY2019 five-year shipbuilding
plan.
The planned size of the Navy, the rate of Navy ship procurement, and the prospective
affordability of the Navy’s shipbuilding plans have been matters of concern for the congressional
defense committees for the past several years. The Navy’s FY2015 30-year (FY2015-FY2044)
shipbuilding plan, like many previous Navy 30-year shipbuilding plans, does not include enough
ships to fully support all elements of the Navy’s 306-ship goal over the entire 30-year period. In
particular, the Navy projects that the fleet would experience a shortfall in amphibious ships from
FY2015 through FY2017, a shortfall in small surface combatants from FY2015 through FY2027,
and a shortfall in attack submarines from FY2025 through FY2034.
The Navy delivered its narrative report on the FY2015 30-year shipbuilding plan to CRS on July
3, 2014. The Navy estimates in the report that the plan would cost an average of about $16.7
billion per year in constant FY2014 dollars to implement, including an average of about $15.7
billion per year during the first 10 years of the plan, an average of about $19.7 billion per year
during the middle 10 years of the plan, and an average of about $14.6 billion per year during the
final 10 years of the plan.
A December 2014 Congressional Budget Office (CBO) report on the Navy’s FY2015 30-year
shipbuilding plan estimates that the plan will require about 13% more funding to implement than
the Navy estimates, including about 6% more than the Navy estimates during the first 10 years of
the plan, about 14% more than the Navy estimates during the middle 10 years of the plan, and
about 20% more than the Navy estimates during the final 10 years of the plan. Over the years,
CBO’s estimates of the cost to implement the Navy’s 30-year shipbuilding plan have generally
been higher than the Navy’s estimates. Some of the difference between CBO’s estimates and the
Navy’s estimates, particularly in the latter years of the plan, is due to a difference between CBO
and the Navy in how to treat inflation in Navy shipbuilding. The program that contributes the
most to the difference between the CBO and Navy estimates of the cost of the 30-year plan is a
future destroyer that appears in the latter years of the 30-year plan.
Potential issues for Congress in reviewing the Navy’s proposed FY2015 shipbuilding budget, its
proposed FY2015-FY2019 five-year shipbuilding plan, and its FY2015 30-year (FY2015-
FY2044) shipbuilding plan include the following:
• the potential impact on the size and capability of the Navy of limiting DOD
spending through FY2021 to the levels set forth in the Budget Control Act of
2011, as amended;
• the appropriate future size and structure of the Navy in light of budgetary and
strategic considerations; and
• the affordability of the 30-year shipbuilding plan.
Congressional Research ServiceNavy Force Structure and Shipbuilding Plans: Background and Issues for Congress Funding levels and legislative activity on individual Navy shipbuilding programs are tracked in detail in other CRS reports. Congressional Research Service
Navy Force Structure and Shipbuilding Plans: Background and Issues for Congress

Contents
Introduction...................................................................................................................................... 1
Background ...................................................................................................................................... 1
   Navy’s Ship Force Structure Goal ............................................................................................. 1
        January 2013 Goal for Fleet of 306 Ships ........................................................................... 1
        306-Ship Goal Reflects 2012 Strategic Guidance and Projected DOD Spending
          Shown in FY2013 and FY2014 Budget Submissions ...................................................... 1
        Goal for Fleet of 306 Ships Compared to Earlier Goals ..................................................... 1
        February 2015 Navy Testimony Referring to Goal for Fleet of 308 Ships ......................... 3
   Navy’s Five-Year and 30-Year Shipbuilding Plans ................................................................... 4
        Five-Year (FY2015-FY2019) Shipbuilding Plan ................................................................ 4
        30-Year (FY2015-FY2044) Shipbuilding Plan ................................................................... 6
   Navy’s Projected Force Levels Under 30-Year Shipbuilding Plan ............................................ 8
   Comparison of First 10 Years of 30-Year Plans....................................................................... 11
Oversight Issues for Congress for FY2016.................................................................................... 15
   Potential Impact on Size and Capability of Navy of Limiting DOD Spending to BCA
     Caps Through FY2021 ......................................................................................................... 15
   Appropriate Future Size and Structure of Navy in Light of Strategic and Budgetary
     Changes ................................................................................................................................ 19
   Affordability of 30-Year Shipbuilding Plan ............................................................................ 27
        Estimated Ship Procurement Costs ................................................................................... 27
        Future Shipbuilding Funding Levels ................................................................................. 29
Legislative Activity for FY2016 .................................................................................................... 31
   FY2016 Funding Request ........................................................................................................ 31
   CRS Reports Tracking Legislation on Specific Navy Shipbuilding Programs ....................... 31

Figures
Figure 1. Navy Table on Mission Impacts of Limiting Navy’s Budget to BC Levels ................... 19

Tables
Table 1. Current 306 Ship Force Structure Goal Compared to Earlier Goals .................................. 2
Table 2. Navy FY2016 Five-Year (FY2016-FY2020) Shipbuilding Plan ....................................... 4
Table 3. Navy FY2015 30-Year (FY2015-FY2044) Shipbuilding Plan .......................................... 7
Table 4. Projected Force Levels Resulting from FY2015 30-Year (FY2015-FY2044)
  Shipbuilding Plan ......................................................................................................................... 9
Table 5. Ship Procurement Quantities in First 10 Years of 30-Year Shipbuilding Plans ............... 12
Table 6. Projected Navy Force Sizes in First 10 years of 30-Year Shipbuilding Plans ................. 13
Table 7. Recent Study Group Proposals for Navy Ship Force Structure ....................................... 22
Table 8. Navy and CBO Estimates of Cost of FY2014 and FY2015 30-Year Shipbuilding
  Plans ........................................................................................................................................... 28

Congressional Research Service
Navy Force Structure and Shipbuilding Plans: Background and Issues for Congress Table B-1. Comparison of Navy’s 306-ship goal, Navy Plan from 1993 BUR, and Navy Plan from 2010 QDR Review Panel ........................................................................................... 37 Table D-1. Total Number of Ships in the Navy Since FY1948 ..................................................... 42 Table D-2. Battle Force Ships Procured or Requested/Programmed, FY1982-FY2020 ............... 43 Appendixes Appendix A. Comparing Past Ship Force Levels to Current or Potential Future Ship Force Levels.......................................................................................................................................... 33 Appendix B. Independent Panel Assessment of 2010 QDR .......................................................... 35 Appendix C. U.S. Strategy and the Size and Structure of U.S. Naval Forces ............................... 39 Appendix D. Size of the Navy and Navy Shipbuilding Rate ......................................................... 41 Contacts Author Contact Information........................................................................................................... 43 Congressional Research Service
Navy Force Structure and Shipbuilding Plans: Background and Issues for Congress

Introduction
This report provides background information and presents potential issues for Congress
concerning the Navy’s ship force-structure goals and shipbuilding plans. The planned size of the
Navy, the rate of Navy ship procurement, and the prospective affordability of the Navy’s
shipbuilding plans have been matters of concern for the congressional defense committees for the
past several years. Decisions that Congress makes on Navy shipbuilding programs can
substantially affect Navy capabilities and funding requirements, and the U.S. shipbuilding
industrial base.

Background

Navy’s Ship Force Structure Goal

January 2013 Goal for Fleet of 306 Ships
On January 31, 2013, in response to Section 1015 of the FY2013 National Defense Authorization
Act (H.R. 4310/P.L. 112-239 of January 2, 2013), the Navy submitted to Congress a report
presenting a goal for achieving and maintaining a fleet of 306 ships, consisting of certain types
and quantities of ships.1 The goal for a 306-ship fleet is the result of a force structure assessment
(FSA) that the Navy completed in 2012.

306-Ship Goal Reflects 2012 Strategic Guidance and Projected DOD Spending
Shown in FY2013 and FY2014 Budget Submissions
The 2012 FSA and the resulting 306-ship plan reflect the defense strategic guidance document
that the Administration presented in January 20122 and the associated projected levels of
Department of Defense (DOD) spending shown in the FY2013 and FY2014 budget submissions.
DOD officials have stated that if planned levels of DOD spending are reduced below what is
shown in these budget submissions, the defense strategy set forth in the January 2012 strategic
guidance document might need to be changed. Such a change, Navy officials have indicated,
could lead to the replacement of the 306-ship plan of January 2013 with a new plan.

Goal for Fleet of 306 Ships Compared to Earlier Goals
Table 1 compares the 306-ship goal to earlier Navy ship force structure plans.

1
  Department of the Navy, Report to Congress [on] Navy Combatant Vessel Force Structure Requirement, January
2013, 3 pp. The cover letters for the report were dated January 31, 2013.
2
  For more on this document, see CRS Report R42146, Assessing the January 2012 Defense Strategic Guidance
(DSG): In Brief, by Catherine Dale and Pat Towell.

Congressional Research Service                                                                                  1
Navy Force Structure and Shipbuilding Plans: Background and Issues for Congress

                     Table 1. Current 306 Ship Force Structure Goal Compared to Earlier Goals
                                                                                Changes                       Early-2005      2002-
                                                                                    to                        Navy plan       2004           2001
                                                                  Revised       February       February       for fleet of    Navy           QDR
                                           306-        ~310-      313-ship      2006 313-        2006           260-325        plan          plan
                                           ship       316 ship     plan of      ship plan        Navy            ships          for           for
                                          plan of      plan of    Septem-      announced        plan for                       375-          310-
                                         January       March         ber         through       313-ship      260-     325-     ship          ship
             Ship type                     2013         2012        2011        mid-2011          fleet      ships    ships   Navya          Navy
Ballistic missile submarines                12b         12-14b        12b           12b            14         14       14           14        14
(SSBNs)
Cruise missile submarines                    0c          0-4c         4c             0c             4          4        4           4        2 or
(SSGNs)                                                                                                                                       4d
Attack submarines (SSNs)                    48           ~48          48             48            48         37       41           55        55
Aircraft carriers                           11e          11e          11e           11e            11f        10       11           12        12
Cruisers and destroyers                     88           ~90          94            94g            88         67       92       104          116
Frigates                                     0            0            0             0              0          0        0           0
Littoral Combat Ships (LCSs)                52           ~55          55             55            55         63       82           56        0
Amphibious ships                            33           ~32          33            33h            31         17       24           37        36
MPF(F) shipsi                                0j           0j          0j             0j            12i        14i      20i          0i        0i
Combat logistics (resupply) ships           29           ~29          30             30            30         24       26           42        34
Dedicated mine warfare ships                 0            0            0             0              0          0        0       26k           16
Joint High Speed Vessels (JHSVs)            10l          10l          10l           21l             3          0        0           0         0
Otherm                                      23           ~23          16            24n            17         10       11           25        25
Total battle force ships                   306          ~310-        313           328            313        260      325       375          310
                                                         316                                                                                  or
                                                                                                                                             312

                Sources: Table prepared by CRS based on U.S. Navy data.
                Note: QDR is Quadrennial Defense Review. The “~” symbol means approximately and signals that the number
                in question may be refined as a result of the Naval Force Structure Assessment currently in progress.
                a.     Initial composition. Composition was subsequently modified.
                b.     The Navy plans to replace the 14 current Ohio-class SSBNs with a new class of 12 next-generation SSBNs.
                       For further discussion, see CRS Report R41129, Navy Ohio Replacement (SSBN[X]) Ballistic Missile Submarine
                       Program: Background and Issues for Congress, by Ronald O'Rourke.
                c.     Although the Navy plans to continue operating its four SSGNs until they reach retirement age in the late
                       2020s, the Navy does not plan to replace these ships when they retire. This situation can be expressed in a
                       table like this one with either a 4 or a zero.
                d.     The report on the 2001 QDR did not mention a specific figure for SSGNs. The Administration’s proposed
                       FY2001 DOD budget requested funding to support the conversion of two available Trident SSBNs into
                       SSGNs, and the retirement of two other Trident SSBNs. Congress, in marking up this request, supported a
                       plan to convert all four available SSBNs into SSGNs.
                e.     With congressional approval, the goal has been temporarily be reduced to 10 carriers for the period
                       between the retirement of the carrier Enterprise (CVN-65) in December 2012 and entry into service of the
                       carrier Gerald R. Ford (CVN-78), currently scheduled for September 2015.
                f.     For a time, the Navy characterized the goal as 11 carriers in the nearer term, and eventually 12 carriers.
                g.     The 94-ship goal was announced by the Navy in an April 2011 report to Congress on naval force structure
                       and missile defense.

           Congressional Research Service                                                                                                2
Navy Force Structure and Shipbuilding Plans: Background and Issues for Congress
h. The Navy acknowledged that meeting a requirement for being able to lift the assault echelons of 2.0 Marine
Expeditionary Brigades (MEBs) would require a minimum of 33 amphibious ships rather than the 31 ships
shown in the February 2006 plan. For further discussion, see CRS Report RL34476, Navy LPD-17 Amphibious
Ship Procurement: Background, Issues, and Options for Congress, by Ronald O'Rourke.
i. Today’s Maritime Prepositioning Force (MPF) ships are intended primarily to support Marine Corps
operations ashore, rather than Navy combat operations, and thus are not counted as Navy battle force
ships. The planned MPF (Future) ships, however, would have contributed to Navy combat capabilities (for
example, by supporting Navy aircraft operations). For this reason, the ships in the planned MPF(F) squadron
were counted by the Navy as battle force ships. The planned MPF(F) squadron was subsequently
restructured into a different set of initiatives for enhancing the existing MPF squadrons; the Navy no longer
plans to acquire an MPF(F) squadron.
j. The Navy no longer plans to acquire an MPF(F) squadron. The Navy, however, has procured or plans to
procure some of the ships that were previously planned for the squadron—specifically, TAKE-1 class cargo
ships, and Mobile Landing Platform (MLP)/Afloat Forward Staging Base (AFSB) ships. These ships are
included in the total shown for “Other” ships.
k. The figure of 26 dedicated mine warfare ships included 10 ships maintained in a reduced mobilization status
called Mobilization Category B. Ships in this status are not readily deployable and thus do not count as
battle force ships. The 375-ship proposal thus implied transferring these 10 ships to a higher readiness
status.
l. Totals shown include 5 ships transferred from the Army to the Navy and operated by the Navy primarily
for the performance of Army missions.
m. This category includes, among other things, command ships and support ships.
n. The increase in this category from 17 ships under the February 2006 313-ship plan to 24 ships under the
apparent 328-ship goal included the addition of one TAGOS ocean surveillance ship and the transfer into
this category of six ships—three modified TAKE-1 class cargo ships, and three Mobile Landing Platform
(MLP) ships—that were previously intended for the planned (but now canceled) MPF(F) squadron.
February 2015 Navy Testimony Referring to Goal for Fleet of 308 Ships
At a February 25, 2015, hearing on Department of the Navy acquisition programs before the
Seapower and Projection Forces subcommittee of the House Armed Services Committee,
Department of the Navy officials testified that “the FY 2014 update to the 2012 Force Structure
Assessment (FSA) to meet the Department of the Navy’s required missions in support of the DSG
[Defense Strategic Guidance document of January 2012], has increased the objective to 308-ships
to account for evolving force structure decisions and real-world changes to assumptions made in
2012.”3 The testimony did not detail the composition of this new 308-ship force-level goal, but
one of the officials at the hearing, discussing the anticipated procurement of a 12th LPD-17 class
amphibious ship, referred to the amphibious ship force level goal as having been increased from
33 ships to 34 ships.4
At a February 26, 2015, hearing on the Department of the Navy’s proposed FY2016 budget
before the Defense subcommittee of the House Appropriations Committee, Admiral Jonathan
Greenert, the Chief of Naval Operations, testified that
3
Statement of the Honorable Sean J. Stackley, Assistant Secretary of the Navy (Research, Development and
Acquisition) and Vice Admiral Joseph P. Mulloy, Deputy Chief of Naval Operations for Integration of Capabilities and
Resources and Lieutenant General Kenneth J. Glueck, Jr., Deputy Commandant, Combat Development and Integration
& Commanding General, Marine Corps Combat Development Command, Before the Subcommittee on Seapower and
Projection Forces of the House Armed Services Committee on Department of the Navy Seapower and Projection
Forces Capabilities, February 25, 2015, p. 3.
4
Source: Spoken testimony of Vice Admiral Mulloy, as reflected in hearing transcript.
Congressional Research Service 3Navy Force Structure and Shipbuilding Plans: Background and Issues for Congress
The 2014 update to the “2012 Force Structure Assessment” (FSA) and other Navy analysis
describe the baseline of ships needed to support meeting each mission....
According to the FSA, the Navy has a requirement for a force of 11 CVN, 88 large surface
combatants (DDG and CG), 48 attack submarines (SSN), 12 SSBN, 11 large amphibious
assault ships (LHA/D), 11 amphibious transport docks (LPD), 11 dock landing ships (LSD),
52 small surface combatants, 10 JHSV, 29 combat logistics force (CLF) ships, and 24
command and support ships.5
The list of ships in the above passage totals 307, and is the same in composition as the 306-ship
goal except that it includes one more ship in the “other” category (i.e., 24 ships rather than 23).
(The “other” category includes, among other things, command and support ships.)
Together, the Navy’s February 25 and 26 testimony suggests that the Navy has a new 308-ship
force-level goal that, compared to the 306-ship goal, includes one additional amphibious ship and
one additional ship in the “other” category.
Navy’s Five-Year and 30-Year Shipbuilding Plans
Five-Year (FY2015-FY2019) Shipbuilding Plan
Table 2 shows the Navy’s FY2015 five-year (FY2015-FY2019) shipbuilding plan.
Table 2. Navy FY2016 Five-Year (FY2016-FY2020) Shipbuilding Plan
(Battle force ships—i.e., ships that count against 306-ship goal)
Ship type FY16 FY17 FY18 FY19 FY20 Total
Ford (CVN-78) class aircraft carrier 1 1
Virginia (SSN-774) class attack submarine 2 2 2 2 2 10
Arleigh Burke (DDG-51) class destroyer 2 2 2 2 2 10
Littoral Combat Ship (LCS) 3 3 3 2 3 14
LHA(R) amphibious assault ship 1 1
LPD-17 class amphibious ship 1 1
LX(R) amphibious ship 1 1
Fleet tug/salvage ship (TATS) 1 1 2 1 5
Mobile Landing Platform (MLP)/Afloat Forward 1 1
Staging Base (AFSB)
TAO(X) oiler 1 1 1 1 4
TOTAL 9 10 10 9 10 48
Source: FY2016 Navy budget submission.
Notes: The MLP/AFSB is a variant of the MLP with additional features permitting it to serve in the role of an
AFSB. The Navy proposes to fund the TATFs and TAO(X)s through the National Defense Sealift Fund (NDSF)
5
Statement of Admiral Jonathan Greenert, U.S. Navy, Chief of Naval Operations, Before the House Subcommittee on
Defense, Committee on Appropriations, on FY 2016 Department of the Navy Posture, February 26, 2015, pp. 9 and 11.
Congressional Research Service 4Navy Force Structure and Shipbuilding Plans: Background and Issues for Congress
and the other ships through the Navy’s shipbuilding account, known formally as the Shipbuilding and Conversion,
Navy (SCN) appropriation account.
Observations that can be made about the Navy’s proposed FY2015 five-year (FY2015-FY2019)
shipbuilding plan include the following:
• Total of 48 ships. The plan includes a total of 48 ships, compared to a total of 44
ships in the FY2015-FY2019 five-year shipbuilding plan.
• Average of 8.8 ships per year. The plan includes an average of 9.6 battle force
ships per year. The steady-state replacement rate for a fleet of 306 ships with an
average service life of 35 years is about 8.7 ships per year. In light of how the
average shipbuilding rate since FY1993 has been substantially below 8.7 ships
per year (see Appendix D), shipbuilding supporters for some time have wanted
to increase the shipbuilding rate to a steady rate of 10 or more battle force ships
per year.
• DDG-51 destroyers and Virginia-class submarines being procured under
MYP arrangements. The 10 DDG-51 destroyers to be procured in FY2013-
FY2017 and the 10 Virginia-class attack submarines to be procured in FY2014-
FY2018 are being procured under multiyear procurement (MYP) contracts.6
• Flight III DDG-51 to begin with second ship in FY2016. The second of the
two DDG-51s requested for FY2016 is to be the first Flight III variant of the
DDG-51. The Flight III variant is to carry a new and more capable radar called
the Air and Missile Defense Radar (AMDR).
• Modified LCS/Frigate to start in FY2019. The LCS program was restructured
in 2014 at the direction of the Secretary of Defense. As a result of the
restructuring, LCSs to be procured in FY2019 and beyond are to be built to a
more heavily armed design. The Navy has stated that it will refer to these
modified LCSs as frigates.
• 12th LPD-17 class ship added to FY2016. The LPD-17 class ship requested for
FY2016 is to be the 12th ship in the class. The Navy had planned on procuring no
more than 11 LPD-17s, but Congress has supported the procurement of a 12th
LPD-17 by providing unrequested funding for a 12th ship in FY2013 and
FY2015. Responding to these two funding actions, the Navy, as a part of its
FY2016 budget submission, has inserted a 12th LPD-17 into its shipbuilding plan,
and is requesting in FY2016 the remainder of the funding needed to fully fund
the ship.
• TAO(X) procurement to begin FY2016. The TAO(X) oiler requested for
procurement in FY2016 is to be the first in a new class of 17 ships.
6
For more on MYP contracting, see CRS Report R41909, Multiyear Procurement (MYP) and Block Buy Contracting
in Defense Acquisition: Background and Issues for Congress, by Ronald O'Rourke and Moshe Schwartz.
Congressional Research Service 5Navy Force Structure and Shipbuilding Plans: Background and Issues for Congress 30-Year (FY2015-FY2044) Shipbuilding Plan FY2016 30-Year Plan Not Submitted as Of February 24, 2015 The Navy as of February 24, 2015, had not yet submitted its FY2016 (FY2016-FY2045) 30-year shipbuilding plan. Discussion below and elsewhere in this report of the Navy’s 30-year shipbuilding consequently is keyed to the Navy’s FY2015 (FY2015-FY2044) 30-year shipbuilding plan. FY2015 30-Year Plan Reflected Proposed Changes in Ship Counting Rules The Navy’s FY2015 30-year shipbuilding plan incorporated a proposed change in the rules for how to count battle force ships. Congress, as part of its markup of the Navy’s FY2015 budget, provided direction to the Navy on how the counting rules were to be changed. The discussion below of the Navy’s FY2015 30-year shipbuilding plan makes multiple references to the old counting rules and the Navy’s proposed counting rules. When the Navy’s FY2016 30-year shipbuilding plan is submitted, it will presumably reflect the direction on counting rules that congress provided in marking up the Navy’s proposed FY2015 budget. The effect of the congressional direction is to modify the counting rules somewhat, but not as much as the Navy had proposed. Table 3 shows the Navy’s FY2015 30-year (FY2015-FY2044) shipbuilding plan. Congressional Research Service 6
Navy Force Structure and Shipbuilding Plans: Background and Issues for Congress

            Table 3. Navy FY2015 30-Year (FY2015-FY2044) Shipbuilding Plan
         FY      CVN       LSC      SSC       SSN      SSBN        AWS        CLF      Supt      Total
         15                 2        3         2                                                   7
         16                 2        3         2                               1                   8
         17                 2        3         2                     1                   3        11
         18        1        2        3         2                               1         1        10
         19                 2        2         2                               1         1         8
         20                 2        3         2                     1         1         2        11
         21                 2        3         1          1                    1                   8
         22                 2        3         2                     1         1         2        11
         23        1        2        3         1                               1         3        11
         24                 2        3         2          1          2         1         2        13
         25                 2        3         1                               1         1         8
         26                 2                  2          1          1         1                   7
         27                 2                  1          1                    1                   5
         28        1        2                  2          1          2         1         1        10
         29                 2                  1          1          1         1         1         7
         30                 2         1        2          1          1         1         2        10
         31                 2                  1          1          1         1         2         8
         32                 2         1        2          1          2         1         3        12
         33        1        2                  1          1          1         1         2         9
         34                 2         1        2          1          1                   2         9
         35                 2         1        1          1                                        5
         36                 2                  2                     1                             5
         37                 2         4        1                                                   7
         38        1        3         4        2                                                  10
         39                 3         4        1                                                   8
         40                 3         4        2                     2                            11
         41                 3         4        1                                                   8
         42                 3         4        2                     1                            10
         43        1        2         4        1                               1                   9
         44                 2         2        2                     2                             8
    Source: FY2015 30-year (FY2015-FY2044) shipbuilding plan.
    Key: FY = Fiscal Year; CVN = aircraft carriers; LSC = surface combatants (i.e., cruisers and destroyers); SSC
    = small surface combatants (i.e., Littoral Combat Ships [LCSs]); SSN = attack submarines; SSGN = cruise
    missile submarines; SSBN = ballistic missile submarines; AWS = amphibious warfare ships; CLF = combat
    logistics force (i.e., resupply) ships; Supt = support ships.

In devising a 30-year shipbuilding plan to move the Navy toward its ship force-structure goal, key
assumptions and planning factors include but are not limited to the following:

    •    ship service lives;
    •    estimated ship procurement costs;
    •    projected shipbuilding funding levels; and
    •    industrial-base considerations.

Congressional Research Service                                                                                      7
Navy Force Structure and Shipbuilding Plans: Background and Issues for Congress Navy’s Projected Force Levels Under 30-Year Shipbuilding Plan Table 4 shows the Navy’s projection of ship force levels for FY2015-FY2044 that would result from implementing the FY2015 30-year (FY2015-FY2044) shipbuilding plan shown in Table 3. As part of its FY2015 budget submission, the Navy is proposing to modify the rules for what ships to include in the count of the number of battle force ships in the Navy. In its FY2015 budget submission, the Navy has presented figures for projected Navy ship force levels using both the existing rules and the proposed modified rules. Table 4 and Table 6 show figures using both the existing rules and the proposed modified rules. Congressional Research Service 8
Navy Force Structure and Shipbuilding Plans: Background and Issues for Congress

  Table 4. Projected Force Levels Resulting from FY2015 30-Year (FY2015-FY2044)
                                  Shipbuilding Plan
  Where two figures are shown, the first is the figure using existing rules for counting battle force ships,
  and the second is the figure using the Navy’s proposed modified rules for counting battle force ships.
                        CVN      LSC     SSC     SSN     SSGN       SSBN     AWS       CLF     Supt       Total
 306 ship plan           11       88      52      48        0         12       33       29      33         306
        FY15             10       85     19/26     54       4         14       30       29     29/32    274/284
        FY16             11       88     23/30     53       4         14       31       29     27/30    280/290
        FY17             11       90     27/34     50       4         14       32       29     29/32    286/296
        FY18             11       91     31/38     52       4         14       33       29     29/32    295/304
        FY19             11       93     35/40     51       4         14       33       29     31/34    301/309
        FY20             11       95     36/37     49       4         14       33       29     33/36    304/308
        FY21             11       96     36/33     49       4         14       33       29     32/35       304
        FY22             11       97     38/36     48       4         14       33       29     32/35    306/307
        FY23             12       98      39       49       4         14       33       29     33/36    311/314
        FY24             12       98     41/40     48       4         14       34       29     33/36    313/315
        FY25             11       98      43       47       4         14       34       29     34/37    314/317
        FY26             11       97      46       45       2         14       36       29     34/37    314/317
        FY27             11       99      49       44       1         13       35       29     34/37    315/318
        FY28             11      100      52       41       0         13       36       29     34/37    316/319
        FY29             11       98      52       41       0         12       35       29     34/37    312/315
        FY30             11       95      52       41       0         11       35       29     34/37    308/311
        FY31             11       91      52       43       0         11       34       29     34/36    305/307
        FY32             11       89      52       43       0         10       34       29     35/37    303/305
        FY33             11       88      52       45       0         10       35       29     35/37    305/307
        FY34             11       86      52       46       0         10       34       29     35/37    303/305
        FY35             11       87      52       48       0         10       32       29     35/37    304/306
        FY36             11       88      52       49       0         10       32       29      35         306
        FY37             11       90      52       51       0         10       33       29      34         310
        FY38             11       91      52       50       0         10       33       29      35         311
        FY39             11       92      52       51       0         10       33       29      34         312
        FY40             10       90      52       51       0         10       32       29      34         308
        FY41             10       89      52       51       0         11       33       29      34         309
        FY42             10       87      52       52       0         12       32       29      34         308
        FY43             10       84      52       52       0         12       31       29      34         304
        FY44             10       83      52       52       0         12       31       29      34         303

    Source: FY2015 30-year (FY2015-FY2044) shipbuilding plan.
    Note: Figures for support ships include five JHSVs transferred from the Army to the Navy and operated by the
    Navy primarily for the performance of Army missions.
    Key: FY = Fiscal Year; CVN = aircraft carriers; LSC = surface combatants (i.e., cruisers and destroyers); SSC
    = small surface combatants (i.e., frigates, Littoral Combat Ships [LCSs], and mine warfare ships); SSN = attack
    submarines; SSGN = cruise missile submarines; SSBN = ballistic missile submarines; AWS = amphibious
    warfare ships; CLF = combat logistics force (i.e., resupply) ships; Supt = support ships.

Congressional Research Service                                                                                        9
Navy Force Structure and Shipbuilding Plans: Background and Issues for Congress
Observations that can be made about the Navy’s FY2015 30-year (FY2015-FY2044) shipbuilding
plan and resulting projected force levels included the following:
• Total of 264 ships; average of about 8.8 per year. The plan includes a total of
264 ships to be procured, two less than the number in the FY2014 30-year
(FY2014-FY2043) shipbuilding plan. The total of 264 ships equates to an
average of about 8.8 ships per year, which is slightly higher than the approximate
average procurement rate (sometimes called the steady-state replacement rate) of
about 8.7 ships per year that would be needed over the long run to achieve and
maintain a fleet of 306 ships, assuming an average life of 35 years for Navy
ships.
• Proposed modified counting rules affect small surface combatants and
support ships. As can be seen in Table 4, the Navy’s proposed modified rules
for what ships to include in the count of the number of battle force ships (see
“Oversight Issues for Congress for FY201”) would affect the reported figures for
small surface combatants during the period FY2015-FY2024 and the reported
figures for support ships during the period FY2015-FY2035.
• Eleven cruisers proposed for some form of reduced operating status
included in count. As part of its FY2015 budget submission, the Navy is
proposing to put 11 of its 22 Aegis cruisers into some form of reduced operating
status starting in FY2015, and then return them to service years from now. The 11
cruisers proposed for some form of reduced operating status are included in the
count of battle force ships shown in Table 4 and Table 6 during the years that
they are in reduced operating status.
• Projected shortfalls in amphibious ships, small surface combatants, and
attack submarines. The FY2015 30-year shipbuilding plan, like many previous
Navy 30-year shipbuilding plans, does not include enough ships to fully support
all elements of the Navy’s 306-ship goal over the entire 30-year period. In
particular, the Navy projects that the fleet would experience a shortfall in
amphibious ships from FY2015 through FY2017, a shortfall in small surface
combatants from FY2015 through FY2027, and a shortfall in attack submarines
from FY2025 through FY2034.
• Ballistic missile submarine force to be reduced temporarily to 10 boats. As a
result of a decision in the FY2013 budget to defer the scheduled procurement of
the first Ohio replacement (SSBN[X]) ballistic missile submarine by two years,
from FY2019 to FY2021, the ballistic missile submarine force is projected to
drop to a total of 10 or 11 boats—one or two boats below the 12-boat SSBN
force-level goal—during the period FY2029-FY2041. The Navy says this
reduction is acceptable for meeting current strategic nuclear deterrence mission
requirements, because none of the 10 or 11 boats during these years will be
encumbered by long-term maintenance.7
7
For further discussion of this issue, see CRS Report R41129, Navy Ohio Replacement (SSBN[X]) Ballistic Missile
Submarine Program: Background and Issues for Congress, by Ronald O'Rourke.
Congressional Research Service 10Navy Force Structure and Shipbuilding Plans: Background and Issues for Congress Comparison of First 10 Years of 30-Year Plans Table 5 and Table 6 below show the first 10 years of planned annual ship procurement quantities and projected Navy force sizes in 30-year shipbuilding plans dating back to the first such plan, which was submitted in 2000 in conjunction with the FY2001 budget. By reading vertically down each column, one can see how the ship procurement quantity or Navy force size projected for a given fiscal year changed as that year drew closer to becoming the current budget year. Congressional Research Service 11
Table 5. Ship Procurement Quantities in First 10 Years of 30-Year Shipbuilding Plans
                                                                     Years shown are fiscal years
  FY of 30-year plan
   (year submitted)      01    02    03    04    05    06    07    08    09    10    11    12    13     14    15    16    17    18    19    20    21    22    23     24

 FY01 plan (2000)        8     8     8     8      7     5     6     6     6     7
 FY02 plan (2001)              6     n/a   n/a   n/a   n/a   n/a   n/a   n/a   n/a   n/a
 FY03 plan (2002)                    5     5      7     7    11    n/a   n/a   n/a   n/a   n/a
 FY04 plan (2003)                          7      8     7     7     9    14    15    13    14     15
 FY05 plan (2004)                                 9     6     8     9    17    14    15    14     16    15
 FY06 plan (2005)                                       4     7     7     9    10    12    n/a   n/a   n/a    n/a
 FY07 plan (2006)                                             7     7    11    12    14    13     12    11    11    10
 FY08 plan (2007)                                                   7    11    12    13    12     12    10    12    11     6
 FY09 plan (2008)                                                         7     8     8    12     12    13    13    12    12    13
 FY10 plan (2009)                                                               8    n/a   n/a   n/a   n/a    n/a   n/a   n/a   n/a   n/a
 FY11 plan (2010)                                                                     9     8     12    9     12     9    12     9    13     9
 FY12 plan (2011)                                                                          10     13    11    12     9    12    10    12     8     9
 FY13 plan (2012)                                                                                 10    7     8      9     7    11     8    12     9     12
 FY14 plan (2013)                                                                                       8     8      7     9     9    10    10    10     11   14
 FY15 plan (2014)                                                                                             7      8    11    10     8    11     8     11   11     13

   Source: Navy 30-year shipbuilding plans supplemented by annual Navy budget submissions (including 5-year shipbuilding plans) for fiscal years shown. n/a means not
   available—see notes below.
   Notes: The FY2001 30-year plan submitted in 2000 was submitted under a one-time-only legislative provision, Section 1013 of the FY2000 National Defense
   Authorization Act (S. 1059/P.L. 106-65 of October 5, 1999). No provision required DOD to submit a 30-year shipbuilding plan in 2001 or 2002, when Congress
   considered DOD’s proposed FY2002 and FY2003 DOD budgets. (In addition, no FYDP was submitted in 2001, the first year of the George W. Bush Administration.)
   Section 1022 of the FY2003 Bob Stump National Defense Authorization Act (H.R. 4546/P.L. 107-314 of December 2, 2002) created a requirement to submit a 30-year
   shipbuilding plan each year, in conjunction with each year’s defense budget. This provision was codified at 10 U.S.C. 231. The first 30-year plan submitted under this
   provision was the one submitted in 2003, in conjunction with the proposed FY2004 DOD budget. For the next several years, 30-year shipbuilding plans were submitted
   each year, in conjunction with each year’s proposed DOD budget. An exception occurred in 2009, the first year of the Obama Administration, when DOD submitted a

CRS-12
proposed budget for FY2010 with no accompanying FYDP or 30-year Navy shipbuilding plan. Section 1023 of the FY2011 Ike Skelton National Defense Authorization Act
(H.R. 6523/P.L. 111-383 of January 7, 2011) amended 10 U.S.C. 231 to require DOD to submit a 30-year shipbuilding plan once every four years, in the same year that
DOD submits a Quadrennial Defense Review (QDR). Consistent with Section 1023, DOD did not submit a new 30-year shipbuilding plan at the time that it submitted
the proposed FY2012 DOD budget. At the request of the House Armed Services Committee, the Navy submitted the FY2012 30-year (FY2012-FY2041) shipbuilding
plan in late-May 2011. Section 1011 of the FY2012 National Defense Authorization Act (H.R. 1540/P.L. 112-81 of December 31, 2011) amended 10 U.S.C. 231 to
reinstate the requirement to submit a 30-year shipbuilding plan each year, in conjunction with each year’s defense budget.
Table 6. Projected Navy Force Sizes in First 10 years of 30-Year Shipbuilding Plans
Years shown are fiscal years; where two figures are shown, the first is the figure using existing rules for counting battle force ships, and the second is the
figure using the Navy’s proposed modified rules for counting battle force ships.
FY of 30-year
plan (year
submitted) 01 02 03 04 05 06 07 08 09 10 11 12 13 14 15 16 17 18 19 20 21 22 23 24
FY01 plan (2000) 316 315 313 313 313 311 311 304 305 305
FY02 plan (2001) 316 n/a n/a n/a n/a n/a n/a n/a n/a n/a
FY03 plan (2002) 314 n/a n/a n/a n/a n/a n/a n/a n/a n/a
FY04 plan (2003) 292 292 291 296 301 305 308 313 317 321
FY05 plan (2004) 290 290 298 303 308 307 314 320 328 326
FY06 plan (2005) 289 293 297 301 301 306 n/a n/a 305 n/a
FY07 plan (2006) 285 294 299 301 306 315 317 315 314 317
FY08 plan (2007) 286 289 293 302 310 311 307 311 314 322
FY09 plan (2008) 286 287 289 290 293 287 288 291 301 309
FY10 plan (2009) 287 n/a n/a n/a n/a n/a n/a n/a n/a n/a
FY11 plan (2010) 284 287 287 285 285 292 298 305 311 315
FY12 plan (2011) 290 287 286 286 297 301 311 316 322 324
FY13 plan (2012) 285 279 276 284 285 292 300 295 296 298
FY14 plan (2013) 282 270 280 283 291 300 295 296 297 297
FY15 plan (2014) 274/ 280/ 286/ 295/ 301/ 304/ 304 306/ 311/ 313/
284 290 296 304 309 308 307 314 315
CRS-13Source: Navy 30-year shipbuilding plans supplemented by annual Navy budget submissions (including 5-year shipbuilding plans) for fiscal years shown. n/a means not available—see notes below. Notes: The FY2001 30-year plan submitted in 2000 was submitted under a one-time-only legislative provision, Section 1013 of the FY2000 National Defense Authorization Act (S. 1059/P.L. 106-65 of October 5, 1999). No provision required DOD to submit a 30-year shipbuilding plan in 2001 or 2002, when Congress considered DOD’s proposed FY2002 and FY2003 DOD budgets. Section 1022 of the FY2003 Bob Stump National Defense Authorization Act (H.R. 4546/P.L. 107-314 of December 2, 2002) created a requirement to submit a 30-year shipbuilding plan each year, in conjunction with each year’s defense budget. This provision was codified at 10 U.S.C. 231. The first 30-year plan submitted under this provision was the one submitted in 2003, in conjunction with the proposed FY2004 DOD budget. For the next several years, 30-year shipbuilding plans were submitted each year, in conjunction with each year’s proposed DOD budget. An exception occurred in 2009, the first year of the Obama Administration, when DOD submitted a proposed budget for FY2010 with no accompanying FYDP or 30-year Navy shipbuilding plan. The FY2006 plan included data for only selected years beyond FY2011. Section 1023 of the FY2011 Ike Skelton National Defense Authorization Act (H.R. 6523/P.L. 111-383 of January 7, 2011) amended 10 U.S.C. 231 to require DOD to submit a 30-year shipbuilding plan once every four years, in the same year that DOD submits a Quadrennial Defense Review (QDR). Consistent with Section 1023, DOD did not submit a new 30-year shipbuilding plan at the time that it submitted the proposed FY2012 DOD budget. At the request of the House Armed Services Committee, the Navy submitted the FY2012 30-year (FY2012-FY2041) shipbuilding plan in late-May 2011. Section 1011 of the FY2012 National Defense Authorization Act (H.R. 1540/P.L. 112-81 of December 31, 2011) amended 10 U.S.C. 231 to reinstate the requirement to submit a 30-year shipbuilding plan each year, in conjunction with each year’s defense budget. CRS-14
Navy Force Structure and Shipbuilding Plans: Background and Issues for Congress

Oversight Issues for Congress for FY2016

Potential Impact on Size and Capability of Navy of Limiting DOD
Spending to BCA Caps Through FY2021
One potential issue for Congress concerns the potential impact on the size and capability of the
Navy of limiting DOD spending through FY2021 to levels at or near the caps established in the
Budget Control Act of 2011 (BCA) as amended. Navy officials state that a decision to reduce
DOD’s budget to such levels would eventually lead to a smaller and less capable Navy.

Admiral Jonathan Greenert, the Chief of Naval Operations, provided detailed testimony on this
question in his prepared statements for hearings before the Senate Armed Services Committee on
November 7, 2013, and the House Armed Services Committee on September 18, 2013.8 In further
testimony on this issue to the Senate Armed Services Committee on January 28, 2015, Greenert
stated:

         A return to sequestration in FY 2016 would necessitate a revisit and revision of the DSG
         [Defense Strategic Guidance document of January 2012]. Required cuts will force us to
         further delay critical warfighting capabilities, reduce readiness of forces needed for
         contingency response, forego or stretch procurement of ships and submarines, and further
         downsize weapons capability. We will be unable to mitigate the shortfalls like we did in
         FY2013 [in response to the sequester of March 1, 2013] because [unobligated] prior-year
         investment balances [which were included in the funds subject to the sequester] were
         depleted under [the] FY 2013 sequester [of March 1, 2013].

         The revised discretionary caps imposed by sequestration would be a reduction of about $10
         billion in our FY 2016 budget alone, as compared to PB-2015. From FY 2016-2020, the
         reduction would amount to approximately $36 billion. If forced to budget at this level, it
         would reduce every appropriation, inducing deep cuts to Navy Operation and Maintenance
         (O&M), investment, and modernization accounts. The Research, Development, Test and
         Evaluation (RDT&E) accounts would likely experience a significant decline across the
         FYDP, severely curtailing the Navy’s ability to develop new technologies and asymmetric
         capabilities.

         As I testified to this committee in November 2013, any scenario to address the fiscal
         constraints of the revised discretionary caps must include sufficient readiness, capability and
         manpower to complement the force structure capacity of ships and aircraft. This balance
         would need to be maintained to ensure each unit will be effective, even if the overall fleet is
         not able to execute the DSG. There are many ways to balance between force structure,
         readiness, capability, and manpower, but none that Navy has calculated that enable us to
         confidently execute the current defense strategy within dictated budget constraints.

8
  See Statement of Admiral Jonathan Greenert, U.S. Navy, Chief of Naval Operations, Before the Senate Armed
Services Committee on the Impact of Sequestration on the National Defense, November 7, 2013, pp. 7-11, and
Statement of Admiral Jonathan Greenert, U.S. Navy, Chief of Naval Operations, Before the House Armed Services
Committee on Planning for Sequestration in FY 2014 and Perspectives of the Military Services on the Strategic
Choices and Management Review, September 18, 2013, pp. 6-10.

Congressional Research Service                                                                                  15
Navy Force Structure and Shipbuilding Plans: Background and Issues for Congress
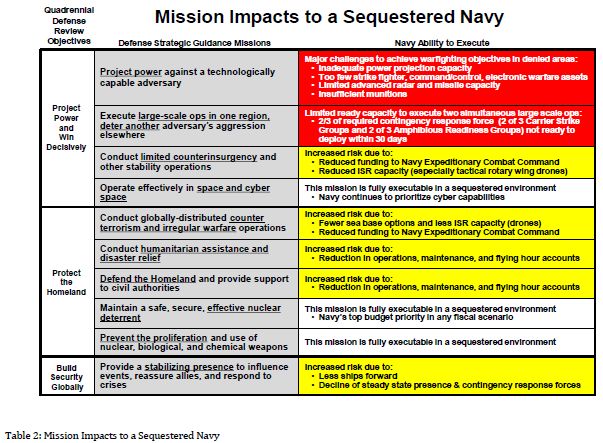
As detailed in the Department of Defense’s April 2014 report, “Estimated Impacts of
Sequestration-Level Funding,” one potential fiscal and programmatic scenario would result
in a Navy of 2020 that would be unable to execute two of the ten DSG missions due to the
compounding effects of sequestration on top of pre-existing FY 2013, 2014, and 2015
resource constraints. Specifically, the cuts would render us unable to sufficiently Project
Power Despite Anti-Access/Area Denial Challenges and unable to Deter and Defeat
Aggression. In addition, we would be forced to accept higher risk in five other DSG
missions: Counter Terrorism and Irregular Warfare; Defend the Homeland and Provide
Support to Civil Authorities; Provide a Stabilizing Presence; Conduct Stability and
Counterinsurgency Operations; and Conduct Humanitarian, Disaster Relief, and Other
Operations. (Table 2 provides more detail on mission risks.) In short, a return to
sequestration in FY 2016 will require a revision of our defense strategy.
Critical assumptions I have used to base my assessments and calculate risk:
Navy must maintain a credible, modern, and survivable sea-based strategic deterrent
Navy must man its units
Units that deploy must be ready
People must be given adequate training and support services
Readiness for deployed forces is a higher priority than contingency response forces
Capability must be protected, even at the expense of some capacity
Modernized and asymmetric capabilities (advanced weapons, cyber, electronic warfare)
are essential to projecting power against evolving, sophisticated adversaries
The maritime industrial base is fragile—damage can be long-lasting, hard to reverse
The primary benchmarks I use to gauge Navy capability and capacity are DoD Global Force
Management Allocation Plan presence requirements, Combatant Commander Operation and
Contingency Plans, and Defense Planning Guidance Scenarios. Navy’s ability to execute
DSG missions is assessed based on capabilities and capacity resident in the force in 2020.
The following section describes specific sequestration impacts to presence and readiness,
force structure investments, and personnel under this fiscal and programmatic scenario:
Presence and Readiness
A return to sequestration would reduce our ability to deploy forces on the timeline required
by Global Combatant Commands in the event of a contingency. Of the Navy’s current battle
force, we maintain roughly 100 ships forward deployed, or 1/3 of our entire Navy. Included
among the 100 ships are two CSG and two ARG forward at all times. CSGs and ARGs
deliver a significant portion of our striking power, and we are committed to keeping, on
average, three additional CSGs and three additional ARGs in a contingency response status,
ready to deploy within 30 days to meet operation plans (OPLANs). However, if sequestered,
we will prioritize the readiness of forces forward deployed at the expense of those in a
contingency response status. We cannot do both. We will only be able to provide a response
force of one CSG and one ARG. Our current OPLANs require a significantly more ready
force than this reduced surge capacity could provide, because they are predicated on our
ability to respond rapidly. Less contingency response capacity can mean higher casualties as
Congressional Research Service 16Navy Force Structure and Shipbuilding Plans: Background and Issues for Congress
wars are prolonged by the slow arrival of naval forces into a combat zone. Without the
ability to respond rapidly enough, our forces could arrive too late to affect the outcome of a
fight.
Our PB-2015 base budget funded ship and aviation depot maintenance to about 80 percent of
the requirement in FY 2016-2019. This is insufficient in maintaining the Fleet and has forced
us to rely upon Overseas Contingency Operations (OCO) funding to address the shortfall.
Sequestration would further aggravate existing Navy backlogs. The impacts of these growing
backlogs may not be immediately apparent, but will result in greater funding needs in the
future to make up for the shortfalls each year and potentially more material casualty reports
(CASREPs), impacting operations. For aviation depot maintenance, the growing backlog
will result in more aircraft awaiting maintenance and fewer operational aircraft on the flight
line, which would create untenable scenarios in which squadrons would only get their full
complement of aircraft just prior to deployment. The situation will lead to less proficient
aircrews, decreased combat effectiveness of naval air forces, and increased potential for
flight and ground mishaps.
Critical to mission success, our shore infrastructure provides the platforms from which our
Sailors train and prepare. However, due the shortfalls over the last three years, we have been
compelled to reduce funding in shore readiness since FY 2013 to preserve the operational
readiness of our fleet. As a result, many of our shore facilities are degrading. At
sequestration levels, this risk will be exacerbated and the condition of our shore
infrastructure, including piers, runways, and mission-critical facilities, will further erode.
This situation may lead to structural damage to our ships while pierside, aircraft damage
from foreign object ingestion on deteriorated runways, and degraded communications within
command centers. We run a greater risk of mishaps, serious injury, or health hazards to
personnel.
Force Structure Investments
We must ensure that the Navy has the required capabilities to be effective, even if we cannot
afford them in sufficient capacity to meet the DSG. The military requirements laid out in the
DSG are benchmarked to the year 2020, but I am responsible for building and maintaining
capabilities now for the Navy of the future. While sequestration causes significant near-term
impacts, it would also create serious problems that would manifest themselves after 2020 and
would be difficult to recover from.
In the near term, the magnitude of the sequester cuts would compel us to consider reducing
major maritime and air acquisition programs; delaying asymmetric capabilities such as
advanced jammers, sensors, and weapons; further reducing weapons procurement of
missiles, torpedoes, and bombs; and further deferring shore infrastructure maintenance and
upgrades. Because of its irreversibility, force structure cuts represent options of last resort for
the Navy. We would look elsewhere to absorb sequestration shortfalls to the greatest extent
possible.
Disruptions in naval ship design and construction plans are significant because of the long-
lead time, specialized skills, and extent of integration needed to build military ships. Because
ship construction can span up to nine years, program procurement cancelled in FY 2016 will
not be felt by the Combatant Commanders until several years later when the size of the battle
force begins to shrink as those ships are not delivered to the fleet at the planned time.
Likewise, cancelled procurement in FY 2016 will likely cause some suppliers and vendors of
our shipbuilding industrial base to close their businesses. This skilled, experienced and
innovative workforce cannot be easily replaced and it could take years to recover from
layoffs and shutdowns; and even longer if critical infrastructure is lost. Stability and
Congressional Research Service 17Navy Force Structure and Shipbuilding Plans: Background and Issues for Congress
predictability are critical to the health and sustainment of this vital sector of our Nation’s
industrial capacity.
Personnel
In FY 2013 and 2014, the President exempted all military personnel accounts from
sequestration out of national interest to safeguard the resources necessary to compensate the
men and women serving to defend our Nation and to maintain the force levels required for
national security. It was recognized that this action triggered a higher reduction in non-
military personnel accounts.
If the President again exempts military personnel accounts from sequestration in FY 2016,
then personnel compensation would continue to be protected. Overall, the Navy would
protect personnel programs to the extent possible in order to retain the best people. As I
testified in March 2014, quality of life is a critical component of the quality of service that
we provide to our Sailors. Our Sailors are our most important asset and we must invest
appropriately to keep a high caliber all-volunteer force. We will continue to fund Sailor
support, family readiness, and education programs. While there may be some reductions to
these programs if sequestered in FY 2016, I anticipate the reductions to be relatively small.
However, as before, this would necessitate higher reductions to the other Navy accounts.
Conclusion
Navy is still recovering from the FY 2013 sequestration in terms of maintenance, training,
and deployment lengths. Only 1/3 of Navy contingency response forces are ready to deploy
within the required 30 days. With stable and consistent budgets, recovery is possible in 2018.
However, if sequestered, we will not recover within this FYDP.
For the last three years, the Navy has been operating under reduced top-lines and significant
shortfalls: $9 billion in FY 2013, $5 billion in FY 2014 and $11 billion in FY 2015, for a
total shortfall of about $25 billion less than the President’s budget request. Reverting to
revised sequester-level BCA caps would constitute an additional $5-10 billion decrement
each year to Navy’s budget. With each year of sequestration, the loss of force structure,
readiness, and future investments would cause our options to become increasingly
constrained and drastic. The Navy already shrank 23 ships and 63,000 personnel between
2002 and 2012. It has few options left to find more efficiencies.
While Navy will do its part to help the Nation get its fiscal house in order, it is imperative we
do so in a coherent and thoughtful manner to ensure appropriate readiness, warfighting
capability, and forward presence—the attributes we depend upon for our Navy. Unless naval
forces are properly sized, modernized at the right pace, ready to deploy with adequate
training and equipment, and capable to respond in the numbers and at the speed required by
Combatant Commanders, they will not be able to carry out the Nation’s defense strategy as
written. We will be compelled to go to fewer places, and do fewer things. Most importantly,
when facing major contingencies, our ability to fight and win will neither be quick nor
decisive.
Unless this Nation envisions a significantly diminished global security role for its military,
we must address the growing mismatch in ends, ways, and means. The world is becoming
more complex, uncertain, and turbulent. Our adversaries’ capabilities are diversifying and
expanding. Naval forces are more important than ever in building global security, projecting
power, deterring foes, and rapidly responding to crises that affect our national security. A
Congressional Research Service 18Navy Force Structure and Shipbuilding Plans: Background and Issues for Congress
return to sequestration would seriously weaken the United States Navy’s ability to contribute
to U.S. and global security.9
Greenert’s testimony concluded with the following table:
Figure 1. Navy Table on Mission Impacts of Limiting Navy’s Budget to BC Levels
Source: Statement of Admiral Jonathan Greenert, U.S. Navy, Chief of Naval Operations, Before the Senate
Armed Services Committee on the Impact of Sequestration on National Defense, January 28, 2015.
Appropriate Future Size and Structure of Navy in Light of Strategic
and Budgetary Changes
A related oversight issue for Congress concerns the appropriate future size and structure of the
Navy. Changes in strategic and budgetary circumstances have led to a broad debate over the
future size and structure of the military, including the Navy. Changes in strategic circumstances
include, among other things, the end of major U.S. ground combat operations in Iraq, the winding
down of U.S. combat operations in Afghanistan, China’s military (including naval) modernization
9
Statement of Admiral Jonathan Greenert, U.S. Navy, Chief of Naval Operations, Before the Senate Armed Services
Committee on the Impact of Sequestration on National Defense, January 28, 2015, pp. 4-9.
Congressional Research Service 19Navy Force Structure and Shipbuilding Plans: Background and Issues for Congress
effort,10 maritime territorial disputes involving China,11 Russia’s seizure and annexation of
Crimea, and the U.S. commitment to counter the Islamic State organization.
The Navy’s current goal for a fleet of 306 ships reflects a number of judgments and planning
factors (some of which the Navy receives from the Office of the Secretary of Defense), including
but not limited to the following:
• U.S. interests and the U.S. role in the world, and the U.S. military strategy for
supporting those interests and that role;
• current and projected Navy missions in support of U.S. military strategy,
including both wartime operations and day-to-day forward-deployed operations;
• current and projected capabilities of potential adversaries, including their anti-
access/area-denial (A2/AD) capabilities;
• regional combatant commander (COCOM) requests for forward-deployed Navy
forces;
• the individual and networked capabilities of current and future Navy ships and
aircraft;
• basing arrangements for Navy ships, including numbers and locations of ships
homeported in foreign countries;
• maintenance and deployment cycles for Navy ships; and
• fiscal constraints.
With regard to the fourth point above, Navy officials testified in March 2014 that a Navy of 450
ships would be required to fully meet COCOM requests for forward-deployed Navy forces.12 The
difference between a fleet of 450 ships and the current goal for a fleet of 306 ships can be viewed
as one measure of the operational risk associated with the goal of a fleet of 306 ships. A goal for a
fleet of 450 ships might be viewed as a fiscally unconstrained goal.
Actions by China starting in November 2013 that appear aimed at achieving a greater degree of
control over China’s near-seas region,13 followed by Russia’s seizure and annexation of Crimea in
March 2014, have led to a discussion among observers about whether we are currently shifting
from the familiar post-Cold War era of the last 20 to 25 years to a new and different strategic era
characterized by, among other things, renewed great power competition and challenges to key
aspects of the U.S.-led international order that has operated since World War II. A shift in
strategic eras can lead to a reassessment of defense funding levels, strategy, missions, plans, and
programs. The shift from the Cold War to the post-Cold War era led to such a reassessment in the
10
For more on the modernization of China’s military (particularly naval) capabilities and its potential implications for
required U.S. Navy capabilities, see CRS Report RL33153, China Naval Modernization: Implications for U.S. Navy
Capabilities—Background and Issues for Congress, by Ronald O'Rourke.
11
For a discussion of these disputes, see CRS Report R42784, Maritime Territorial and Exclusive Economic Zone
(EEZ) Disputes Involving China: Issues for Congress, by Ronald O'Rourke. See also CRS Report R42930, Maritime
Territorial Disputes in East Asia: Issues for Congress, by Ben Dolven, Mark E. Manyin, and Shirley A. Kan.
12
Spoken testimony of Admiral Jonathan Greenert at a March 12, 2014, hearing before the House Armed Services
Committee on the Department of the Navy’s proposed FY2015 budget, as shown in transcript of hearing.
13
For a summary of these actions, see CRS Report R42784, Maritime Territorial and Exclusive Economic Zone (EEZ)
Disputes Involving China: Issues for Congress, by Ronald O'Rourke.
Congressional Research Service 20You can also read