COMMISSIONING PLAN FOR EDUCATION PROVISION - PLANNING FOR GROWTH LONDON BOROUGH OF BEXLEY 2019-2022 - Bursted Wood Expansion delivered September ...
←
→
Page content transcription
If your browser does not render page correctly, please read the page content below
COMMISSIONING PLAN FOR EDUCATION
PROVISION – PLANNING FOR GROWTH
LONDON BOROUGH OF BEXLEY
2019-2022
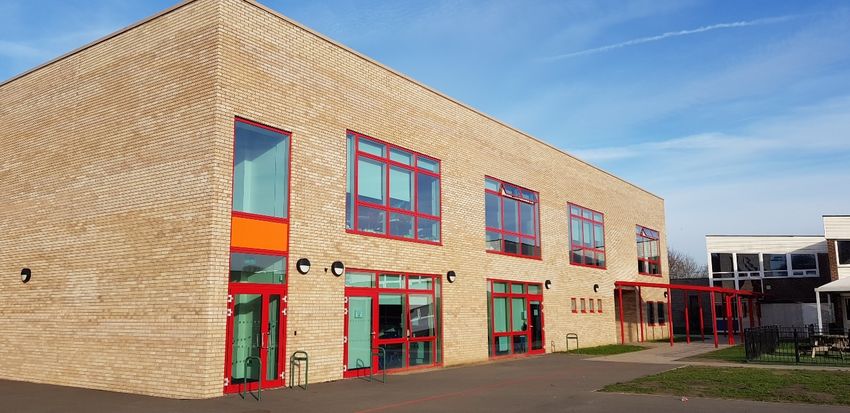
Bursted Wood Expansion delivered September 2018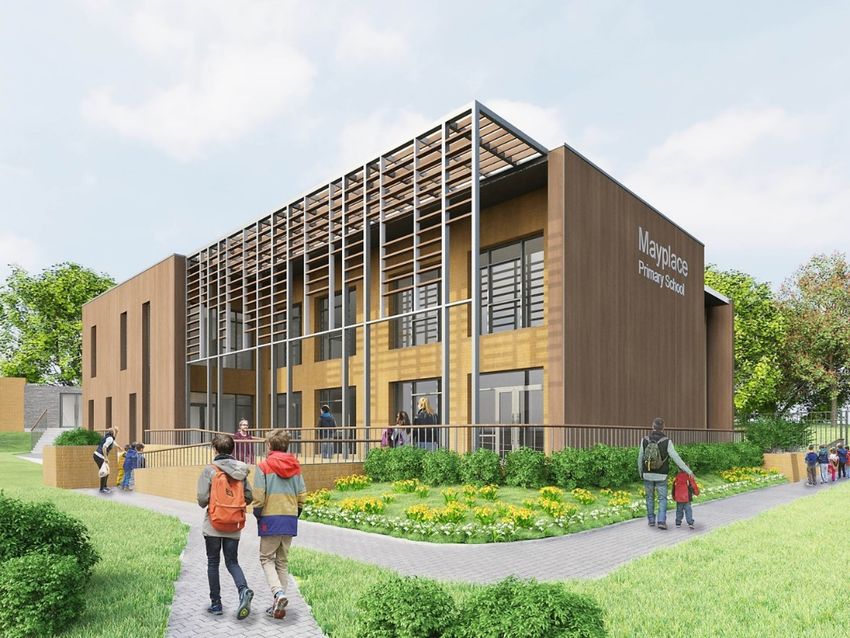
Table of Contents

Section                                                              Page
          Foreword by Councillor John Fuller, Cabinet Member for      3
          Education
  1       Executive Summary (Including an Overview for Head           4–9
          Teachers on Page 8)
  2       The Bexley Context                                         10 – 11
  3       Demand for Places                                          12 – 22
  4       School Pupil Forecasting Methodology                       23 – 26
  5       Analysis: Primary and Secondary Provision                  27 – 37
  6       Analysis: Early Years Education, Planning and Provision    38 – 42
  7       Analysis: Post 16 Education                                43 – 54
  8       Housing Projections                                        55 – 57
  9       Capital Funding                                            58 – 59
  10      Schools Land Ownership                                     60 – 63
  11      Appendices
             • A – Housing trajectory for net additional dwellings   64 – 67

                                       2
FOREWORD

With the education landscape changing and Central Government moving to a system
where every school will be an Academy, The London Borough of Bexley no longer
entirely provides school places directly but instead commissions them from a range of
providers including schools, academy trusts and sponsors of academy chains. This
Plan sets out how we will reach decisions on the number of mainstream school places,
we will need to provide over the next few years ensuring that we meet our statutory
requirement that every Bexley resident has a School place both now and in the future.
In making these decisions this report will identify whether schools need to be
expanded and any associated Capital costs required to discharge this duty. Whilst
Bexley still experiences pressure at Primary school level in particular through in-year
applications this bucks the trend across a number of Local Authorities who are seeing
the pressure for Primary School places reduce. The work of the Local Authority and
the Strategic Education Partnership is not only to ensure there are sufficient places
but also to look at the possibility of reducing primary school PANs where necessary
but ensuring we keep one eye on the future Housing Growth.

Predicting the number of new places we will need is an on-going challenge as Bexley,
along with many others boroughs, experiences a period of demographic change.
Despite this, I am proud that we have continued to maintain our strong track record of
providing those who apply on time with a school place. Historic capacity which has
previously allowed applicants flexibility, choice and the ability to place larger sibling
groups together has gone. Applicants are now advised to check before they apply
and that there is no choice as many of our primary schools are now full.

Looking to the next two to three years, I believe the programme identified in this Plan
provides a clear vision of what we can achieve based on the evidence available to us
whilst also being realistic as capital funding for school building continues to be limited
and uncertain. We must continue to deliver good value for money via cost-effective
procurement and construction options, including through innovative, good quality
buildings and making use where we can of Bexley’s collective school estate.

As always, as champions of children, we will continue to work with our wider school
community to ensure that every child has a school place of which we can all be proud.

This plan has been developed in consultation with the Strategic Education
Partnerships, Places and Planning Sub-Group

Councillor John Fuller
Cabinet Member for Education
April 2019

                                            3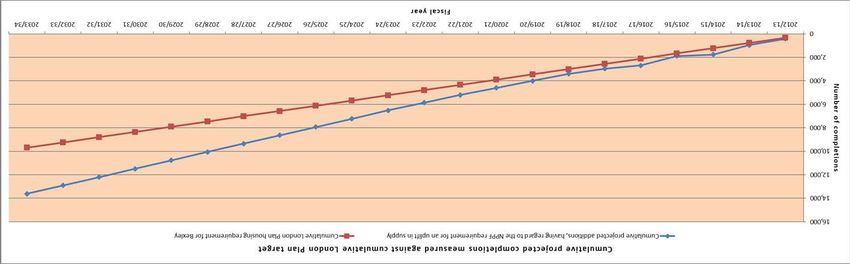
SECTION 1 EXECUTIVE SUMMARY

As the local strategic commissioner of education, The London Borough of Bexley has
the statutory responsibility to provide a school place for every child resident in the
borough.

The last ten years have seen increasing pressures on school places right across
London and the wider South East. If numbers in Bexley continue to increase there will
be demand for additional reception places until at least 2022 with a potential need to
provide at least a further four/five forms of entry by 2022/3. However latest evidence
is that the birth rate has peaked and may be starting to fall across most of London
which means that future plans for primary expansion at this stage should be cautious.
Within Bexley, unlike many parts of London and the South East, we continue to face
a growing demand for in year primary school places with over 5,000 primary in year
applications received since January 2015 with October 2018 being the highest amount
of in year applications received compared to the same month in previous years (137)
and whilst not all of these equate into actual school places this highlights the continual
pupil place planning pressure that we have to continue to manage. This figure equates
to 20% of the Borough’s entire primary school places available. This level of ‘in year’
applications means that Bexley has to not only ensure that we have sufficient school
places on National Offer Day but for 7 years of in year growth and this level of
applications bucks the trend across London. Our School Place Planning strategy looks
between 3-5 years ahead and is based on known population projects, pipeline housing
projects together with the likely level of ‘in year’ growth. This can sometimes result in
places not being filled straight away but ensures that Bexley has sufficient places when
required. Within the backdrop of the current financial pressures being faced by our
schools this policy is sometimes not universally popular.

Currently, given the site capacity in our existing secondary schools and the expansion
plans in surrounding boroughs, we do not anticipate a requirement for a new
secondary school, although we have begun to increase our secondary capacity from
2017/18 and If numbers in Bexley grow based on current trends, there will be demand
for as many as 14 additional forms of entry across the borough by 2023/24. Whilst the
number of secondary ‘in year’ applications is not as high as our primary numbers since
January 2015 we have received over 2,400 in year applications and this shows no
sign of declining in the near future.

Previous forecasts have indicated no immediate pressure on secondary places which
we have managed to continue by building a new secondary school in 2011/12 and
through filling surplus places with pupils from neighbouring boroughs we have avoided
large scale PAN reductions. We have also been working closely with Head Teachers
in secondary schools and through this increased the intake at Blackfen Girls,
Bexleyheath Academy and Townley Grammar School. Discussions are also currently
being held with at least 2 schools that are looking to increase their intakes whilst a
third is consulting on a possible admissions change which again could lead to an
increase in places. Given this, we should be able to continue to meet the growth we
have had in our primary schools which started to come through in September 2018.
This is providing our secondary schools, which are all Academies, do not seek to
change their Admissions criteria or decide to reduce their planned admission numbers.

                                            4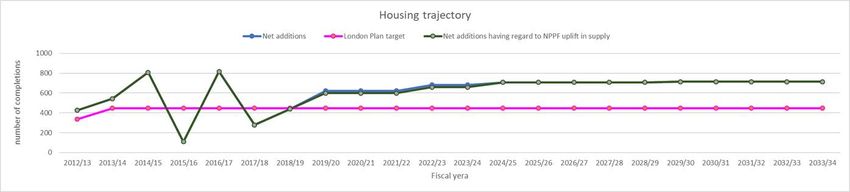
Our neighbouring boroughs deliver sufficient growth within their own secondary
schools and that our four grammar schools do not elect to go super selective or that
none of our secondary schools elect to go grammar. At this stage our biggest
challenge remains “in year” applications in Secondary schools.

The numbers and plans quoted in this report do not reflect the Council’s developing
growth strategy and as this strategy takes shape a separate analysis of the education
infrastructure needed to support this higher level of growth will be required with initial
discussions having already taken place with the GLA and our neighbouring boroughs.

Bexley already has a diverse range of schools. There are 60 primary, infant and junior
schools; 16 secondary schools; 5 special schools and a pupil referral unit. The
borough is a net importer of children with the latest figures from the October 2018
census showing that 8.3% of primary and 29.1% of secondary places taken up by
children who do not live in Bexley driven predominantly by the 4 grammar schools.
Since 2011, 12 primary schools have been permanently expanded with two
expansions delivered in time for September 2018 with one of these officially opening
in September 2019 (Parkway Primary School) in order to accommodate the pressures
coming out of the Thamesmead Housing Zone. Two more school expansion projects
are due to be delivered in September 2019; Mayplace, whilst it has increased its PAN
will be completed by spring 2019 and Birkbeck will be providing an additional 210
places from October 2019. Separate linked infant and junior schools have been re-
organised into two all-through primary schools. As well as this, classrooms have been
provided to facilitate bulge classes and temporary expansions and between 2011 until
2020 by which we would have provided 3850 places.

The ongoing challenge for school place commissioning is to decide the basis on which
to plan and expand school places over the next few years. Given the scale of demand,
and uncertainty around future demographic change, the programme over the next two
years will use the GLA School Roll Projections with 2.5% additional capacity. Using
the new methodology, we estimate that Bexley may need to provide at least a further
four reception classes by 2022.

We will continue to use clusters of schools in a locality, rather than individual
institutions, as the basis on which to plan for new places. Our options to do so are,
however, increasingly limited as our programme has developed over recent years
reducing the number of schools with remaining capacity. The work of the new
Education Strategic Partnership will also ensure that our school community comes
with us on this continued journey.

Our analysis shows that pressures on school places are not isolated but are arising
across the borough and across year groups. Our challenge is to assess if this will
continue at current levels, which would suggest the need for permanent expansions
particularly where new housing is already known to be planned, or stabilise and even
reduce, in which case bulge classes may be more appropriate in some locations.
Secondary schools

For secondary schools despite the popularity of a number of our schools resulting in
29.1% of pupil places taken up by pupils from outside of the Borough, we previously
anticipated demand levels increasing by 2018-19 but there is currently still adequate

                                            5
capacity in the borough. The GLA forecasts, together with the primary school growth
which began in 2012 suggest that Bexley will need to start looking into potentially
increasing its Secondary capacity for future years. The data suggests by 2023 as
many of 14 additional forms of entry may need to be provided but this is very much
based on the delivery of Bexley’s growth strategy and will be monitored. This increase
will either have to be accommodated through existing schools increasing their planned
admission number (PAN) or secondary school expansion. However, new schools and
new communities in neighbouring boroughs as well as the proposed housing schemes
that are expected to come into play over the next two years to provide new homes will
need new and improved education facilities and could influence the level and speed
of demand for secondary places in Bexley, particularly in the identified Growth areas,
being; Erith, Belvedere, Thamesmead, Slade Green and Crayford.

We have met secondary demand with the help from some of our Secondary’s
providing extra places for September 2018 so no permanent expansion is yet required,
as well as this the use of moth-balled classrooms can be established before the need
to expand becomes apparent.

Early years

From September 2017, eligible working parents were able to access up to a further 15
hours of free child care per week, over 38 weeks; this is to support working parents
with the cost of childcare. There are an estimated number of 6,544 children aged 3
and 4 years who are eligible to take up the Early Years Funding. Local Authorities
have had a statutory duty to provide free early education to disadvantaged two-year-
olds since September 2013; Bexley has been able to meet its statutory requirements
over the past years. Assessing the childcare market and sufficiency of provision is
both a complex and constantly moving challenge, Bexley has carried out a full audit of
Early Years Providers, this provided information on how many extra places can be
made available by local providers and what needs to be done to increase supply and
where this can be accommodated. Our main challenge is to not only ensure that there
is sufficient early years provision and that school nurseries remain financially viable
and have an offer which allows them to compete with the private sector.

Post 16 education

The Council has a duty to ensure that there is sufficient suitable education and training
provision for all young people aged 16-19, and up to the age of 25 for those with an
Education Health Care Plan (EHCP), who are resident within the borough. The
Department for Education (DfE) provides funding for the provision of education and
training with Apprenticeships for 16-19 year olds and those aged 19-25 with an EHCP.
With all Secondary Schools within Bexley having Academy status, that means all
funding for mainstream post-16 provision goes directly to the Schools, Colleges and
Training Providers. We are committed to working in partnership with the learning
community to ensure the needs of our young people are met through the development
of clear progression pathways at all levels. In the future an increasing number of jobs
will require higher level skills, with employees being qualified to Level 4 or above, to
ensure Bexley young residents are able to access such opportunities it will be
important to raise young people’s aspirations for progressing to Higher Education and

                                           6
to further explore alternative pathways such as Higher Apprenticeships which we
encourage at Bexley.
Capital Projects
Completing the primary expansion at Mayplace Primary School and Birkbeck Primary
School, the new Cleeve Meadow SEN Free School together with long term provision
for the MLD pupils at Woodside and increasing the capacity on the Endeavour School
site will be the top priority projects over the next two years. As part of the external
funding secured to deliver pupil growth from the Thamesmead Housing Zone a
feasibility study will be looking at a possible second 1FE expansion following the
already completed 1FE expansion of Parkway Primary School. Any further expansion
will only occur if there is likely to be sufficient additional child yield so as not to
destabilise the existing schools. Mayplace Primary School has completed Phase 1 of
the project delivering 30 new places to Reception in September 2018. The new two
storey building is to be ready for use by September 2019. Birkbeck 1FE expansion will
be delivered in October 2019.
Ensuring the right learning environment is critical and funding is extremely tight. The
next phase of our expansion programme will be supported by a mix of capital funding
from central government, the Council’s own resources and, where available, those of
schools as well. This will enable plans to include improvements in school buildings
beyond the classrooms themselves to ensure the offer is at least as good as, if not
better, than that currently available. Whilst some new building will continue to be
required, we will also continue to work with schools to maximise the efficient use of
the current estate.
Working Together
We are very much aware that none of this can be achieved without the support of and
close working relationship with Governors, Head teachers, staff, parents and residents
underlining the essential partnership with schools, colleges and the wider community.
We are grateful for all the help and co-operation we have received and for the ongoing
dialogue in place to ensure that every child has the best quality of provision we can
deliver.
7Summary for Head Teachers
This Commissioning Plan has been developed in consultation with the Strategic
Education Partnerships, Places and Planning Sub-Group. This group will monitor the
delivery of the plan.
Purpose of the Commissioning Plan
• This Plan sets out how we will reach decisions on the number of school places,
both mainstream and specialist, we will need to provide over the next three
years ensuring that we meet our statutory requirement that every Bexley
resident has a School place both now and in the future.
• Predicting the number of new places we will need is an on-going challenge as
Bexley, along with many others boroughs, experiences a period of
demographic change.
In-Year Demand
• Over 5,000 In-year applications received since Jan 2015
• Recent months have seen highest amount of In-Year Applications as opposed
to previous years. During 2017/18 academic year a total of 1,442 primary and
690 secondary ‘in year’ applications were received and this trend is continuing
in 2018/19.
Early Years
• There are an estimated number of 6,544 children aged 3 and 4 years who are
eligible to take up the Early Years Funding
• There is sufficient places within the borough for early years provision starting
from 2 years old
Primary Demand
• By 2020/21 we would have provided 3850 school places since 2011 with
further places planned for if and when they are required.
• We are currently meeting the demand and are planning ahead, so whilst
some places may currently be vacant once pipeline Housing projects come
into play we are already prepared.
Secondary Demand
• We have not yet had the need to expand any of our Secondary Schools
permanently however multiple schools have increased their PAN to
accommodate extra pupils from September 2017.
• GLA forecasts, together with the primary school growth which began in 2012
suggested that Bexley would need to start increasing its secondary capacity
from 2018/19 and that by 2023 as many of 14 additional forms of entry may
need to be provided which will be monitored and works planned accordingly.
Funding
• We have spent over £64m on School expansion projects since 2011 with
£13m planned to be spent by 2020.
8• We receive funding from the Government which we allocate to expansion
projects based on current pressures in the five planning areas –
Thamesmead/Belvedere, Erith/Crayford, Bexleyheath, Welling and Sidcup.
Proposed & Current Projects
Project Progress Academy Trust (If
Appropriate)
Mayplace Primary School 1 Project due to be Primary First Trust
FE permanent expansion completed June 2019 with
School occupation in
September 2019. The first
of the additional 30 pupils
started in September 2018.
Birkbeck Primary School 1 Project due to be
FE permanent expansion completed by October 2019
with the first of the
additional 30 pupils due to
start September 2019.
Cleeve Meadow 120 place Planning application TKAT
SEN Free School secured on 6 September,
school to open from
September 2019.
Shenstone Specialist Works completed in time TKAT
School (20 additional for first pupils in September
places) 2018.
Limewood 3 FE Free First phase 1 FE due to Woodlands Trust
School open from September
2020.
Mayplace Primary School 3D drawing, to be delivered by September 2019
9SECTION 2 THE BEXLEY CONTEXT
Bexley is situated in the South East of London and covers an area of 23 square miles
(6,400 hectares). Bexley borders the Thames to the north, the boroughs of Royal
Greenwich to the west and Bromley to the south and the County of Kent to the east.
The borough has one Strategic Town Centre Bexleyheath, and has four major district
centres – Crayford, Erith, Sidcup and Welling.
Our Council’s Corporate Plan –2017-2025 sets out five main priorities: -
1. Growth that benefits all
2. Clean and green local places
3. Strong and resilient communities and families
4. Living Well
5. Innovation and self sufficiency
Providing good school places is a key performance indicator under the Growth that
benefits all priority. The provision of high quality additional school places will support
the development of a successful local economy and enhance Bexley as a place to live
and work as well as keeping up with estimations that Bexley can deliver 31,500 new
homes and 17,500 net new jobs across the borough by 2050 and the impact on school
places this will bring.
As at October 2018 just under 44,000 pupils are educated in Bexley schools including
nursery classes and special School census schools. There are 533 private and
voluntary early years’ providers and accredited child-minders and 84 primary,
secondary and special schools and pupil referral units.
There are currently 60 primary, infant and junior schools. As at the date of publication,
12 are community schools, 8 are voluntary aided, 1 is voluntary controlled, 38 are
Academies and 1 is a free school. Other schools are in the process of conversion to
Academy status. 38 infant and primary schools have attached nursery classes for
children aged 3 and 4.
There are 16 secondary schools, all of which are Academies. Four of the Academies
are grammar schools and three are faith schools.
Bexley’s schools are generally popular and the borough is a net importer of children
living in other areas. For the September 2018 reception and year 7 intake 8.44% of
our primary places and 26.02% of our secondary offers (concentrated in our grammar
schools) were provided to out borough children. As per the January 2018 School
census 5.7% of Reception- age Bexley resident children attend out borough primary
schools, and 20.2% Year 7 Bexley resident children attend out borough secondary
schools.
We believe that children and teachers deserve high quality premises which support
high aspiration and achievement, and are safe, healthy and environmentally
sustainable.
10By clearly setting out our commissioning plans on a regular basis, we hope that
parents and providers will be in a better position to work collaboratively with us
regarding how the need for more places can be met. We recognise that new providers
are entering the market. We also recognise that popular schools may wish to expand,
or be under pressure from the local community to do so.
The role of the Local Authority
The education world continues to evolve with Central Government pushing towards
approving more academies and free schools. This will always create a level of tension
between Central and Local Government all the time that the statutory duty to provide
a school place for every resident remains with the Local Authority.
As strategic commissioners of education provision there is a strong interlink with the
school improvement, regeneration and growth agendas. Our statutory duties include:
• The need to ensure sufficient places for 3 and 4 year old children, and
disadvantaged 2 year olds, to be able to access their free early years
entitlement (15 hours a week, 38 weeks per year)
• A school place for all Bexley residents of statutory school age (5 to 16 years
old) who require one
• Full time education for children who are not in school for reasons of ill health,
exclusion of otherwise
• All young people are in education or training up to their 18th birthday
• That children and young people assessed and, as necessary, issued with
Education, Health and Care (EHC) Plans have appropriate provision. This may
extend up to the age of 25. We have a separate Commissioning Plan for SEN
Education which will detail this further.
The local authority’s failure to provide sufficient school places could lead to
• the council being taken to court by parents for breach of its statutory duty
• potential safeguarding issues if these children are not in school
• potential for Department for Education intervention
These requirements are defined in statute in
• The Childcare Act 2006
• The Education and Skills Act 2008
• The Apprenticeships, Skills, Children and Learning Act 2009
• The Education Acts of 1996, 2002 and 2011
• The Academies Act 2010
• The SEN and Disability Act 2001
11SECTION 3 DEMAND FOR PLACES
This section focuses on the demographic issues that lead to demand for school places
in the Borough, including births; short, medium and long term population projections;
admission patterns; and the impact of pupil migration. Population projections are
analysed to forecast future demand for primary and secondary school places.
Forecast demand for primary places is divided into five geographical planning areas
to reflect local trends accurately.
The primary factor in the rise of school aged pupils in Bexley has been an increase in
the overall population and crucially a rise in net migration into the borough, particularly
by families with children who have already been born. This is being complemented by
an increase in development in the Borough in the last five years and is projected to
increase significantly as the growth strategy is delivered.
Births and population forecasts
Figure 1 shows the conception rate in Bexley over 6 years compared to London, outer
London and England. The graph shows that Bexley has a conception rate which is
slightly higher than that for London and higher than the national average. The
conception rate has remained relatively stable between 2011 and 2016 in Bexley.
London and Outer London areas show falls in the conception rates and the gap
between conception in London and Bexley has narrowed, with Bexley now slightly
above the London rate.
Figure 1 - Conception rate per 1,000 women
aged 15-44, 2011-2016
100.0
95.0
90.0 ENGLAND
85.0 LONDON
OUTER LONDON
80.0
BEXLEY
75.0
70.0
2011 2012 2013 2014 2015 2016
Source: ONS Conception Statistics England and Wales
Figure 2 illustrates how births have risen since 2001 peaking in 2011 - a rise of nearly
23.7% over the decade. Births fell in 2012 and 2013, in line with 26 of 33 London
boroughs and showed a slight rise in 2014. In 2015 the number of births in Bexley
was almost as high as the 2011 peak but has since reduced slightly. It is too early to
say whether this is a short term anomaly or a longer term trend. The steady rise in
births experienced in recent years may have come to an end and may return to historic
norms. Our assessment is that the birth rate may stabilise at a certain level but not
12fall back to the lower levels experienced between 2001 and 2006 given the higher
population and key changes in the demographic profile of the borough. This view is
underpinned by anticipated population growth which will result in more women of child
bearing age living in Bexley. Latest projections show a stabilising of the birth rate and
future projections envisage a relatively consistent number of births in the Borough with
a slight fall in the total fertility rate compensated by a general rise in the population.
Latest school roll projections assume a relatively stable future birth rate, which needs
to be viewed in the context of a rising projected population. This may bring some
stability for school place planning in terms of planning for the needs of the existing
population. However the impact of the Growth Strategy creates an entirely new
scenario for the Borough for which solutions will need to be developed including new
schools for these new residents in the localities with the greatest growth.
Figure 2: Births in Bexley 2001-2017
3,600
3,500
3,400
3,300
3,200
3,100
3,000
2,900
2,800
2,700
2,600
2,500
2,400
2001 2002 2003 2004 2005 2006 2007 2008 2009 2010 2011 2012 2013 2014 2015 2016 2017
Source: ONS: Live Births, General Fertility Rates and Total Fertility Rates, published
July 2016
The 2011 Census provided information on Bexley's population and how it had grown
since 2001. Over the decade since the previous census Bexley's population grew by
around 6% (13,693). Since the 2011 Census, GLA population estimates based on
data from the ONS indicate that the overall population has grown a further 7% to 2018,
while Bexley’s statutory school-age population is estimated to have grown by 11.5%
in the same period. Whilst the difference between births and deaths has remained
broadly similar, the major factor in population growth has been an increase in net
migration - often into areas seeing a surge in the private rented sector of the housing
market but where there have been relatively fewer housing developments. In recent
years some significant new development has added pressure on places particularly in
the Crayford and Bexleyheath areas.
Figure 3 shows the population pyramid by gender as at Mid-2016 (published June
2017). It demonstrates how the younger 4 – 8 year old cohorts are larger than older
age children of statutory school age.
The 2011 Census results demonstrated how the Borough had changed in the previous
decade with a much larger cohort of school aged children resident in Bexley. The
proportion of 0 - 4 year olds has grown at a slower rate since the 2011 Census as the
largest birth cohorts move through the years and later potentially more stable births
13are added to the figures. The broad range of factors which help explain the rise in the
population include:
• An increasing and then stabilising birth rate
• Increased net migration into the borough (from other parts of London, the UK
and internationally)
• The difference between the number of births and deaths is growing
• Changes in demographic patterns, i.e. a rise in the number of residents renting
privately in the Borough, more school aged children remaining resident in the
Borough rather than moving out of Bexley
Figure 3
Data source: GLA 2016-based Demographic Projections (housing-led)
However, in 2018 the GLA identified issues with the ONS calculation of projections
that has led to an inflation of projection figures for London and potentially other urban
areas, and these issues impact particularly on the projections of 0 – 4 year olds. The
GLA is working on refining a model of projection to mitigate this factor. Additionally, as
an outer London borough with increased net migration, it is likely that the impact of
this inflation is reduced for Bexley compared to inner-London areas.
The Local Authority accesses a range of data in order to verify the accuracy of
population estimates. For example, GP registration data is made available to the Local
Authority and this can be used to validate the accuracy of forecasts. Figures 4a - 4f
show the population projections for the five planning areas through to 2030.
14Figure 4a: Population Projections 2018-2030
for all Planning Area 1 - Thamesmead and Belvedere
6000
5000
4000 0-4
3000 5-10
11-16
2000
17-19
1000
0
2018 2019 2020 2021 2022 2023 2024 2025 2026 2027 2028 2029 2030
Figure 4b: Population Projections 2018-2030
for all Planning Area 2 - Erith and Crayford
7000
6000
5000
0-4
4000
5-10
3000
11-16
2000 17-19
1000
0
2018 2019 2020 2021 2022 2023 2024 2025 2026 2027 2028 2029 2030
Figure 4c: Population Projections 2018-2030
for all Planning Area 3 - Bexleyheath
6000
5000
4000 0-4
3000 5-10
11-16
2000
17-19
1000
0
2018 2019 2020 2021 2022 2023 2024 2025 2026 2027 2028 2029 2030
15Figure 4d: Population Projections 2018-2030
for all Planning Area 4 - Welling
5000
4500
4000
3500
0-4
3000
2500 5-10
2000 11-16
1500
17-19
1000
500
0
2018 2019 2020 2021 2022 2023 2024 2025 2026 2027 2028 2029 2030
Figure 4e: Population Projections 2018-2030
for all Planning Area 5 - Sidcup
5000
4500
4000
3500
0-4
3000
2500 5-10
2000 11-16
1500 17-19
1000
500
0
2018 2019 2020 2021 2022 2023 2024 2025 2026 2027 2028 2029 2030
Figure 4f: Population Projections 2018-2030
for all 5 Planning Areas combined
25000
20000
0-4
15000
5-10
10000 11-16
17-19
5000
0
2018 2019 2020 2021 2022 2023 2024 2025 2026 2027 2028 2029 2030
Source for Tables 4a to 4f: GLA 2018 Population Projections
16Tables 4a to 4e show the projected increases in population across each area before
considering any additional school aged population arising from the impact of the
Growth Strategy. Varying degrees of projected growth in the number of 0 - 4 and 5 -
10 year olds over the next ten years are anticipated by area. Figure 4f shows the level
of expected growth for the whole Borough. It shows a very small increase of 2% in the
projected number of 0 - 4 year olds by 2028, reflecting a slowing in the rise in birth rate
whilst the school aged 5 - 10 year old cohort is expected to rise by around 3%. The
projected number of 11 – 16 year olds is expected to rise by an average of 21% with
highest growth in Thamesmead and Belvedere projected at 29% and lowest in Welling
at 15%. This re-enforces the trend that while children already born continue to age
through the school years, fewer new babies are expected to be born.
Figure 5 below provides data in tabular format for the projected number of 4 - 10 year
olds (primary aged pupils) to 2028. Overall a net increase is projected across the
Borough although there is a projected decrease in Planning Area 5 Sidcup, and it is
projected that figures in Planning Area 1 Thamesmead & Belvedere will remain at
similar levels. However, these projections are based on current trends and do not
incorporate additional pupils arising from the implementation of the Bexley Growth
Strategy.
Figure 5
Projected numbers of 4-10
year olds by planning area 2018 2020 2022 2024 2026 2028
1 Thamesmead & Belvedere 4300 4300 4300 4300 4300 4300
2 Erith & Crayford 7700 7800 7900 7900 8000 8100
3 Bexleyheath 3000 3100 3100 3100 3200 3300
4 Welling 4000 4000 3900 4000 4100 4100
5 Sidcup 4900 5000 4900 4900 4800 4800
Total 23900 24200 24100 24200 24400 24600
Data source: GLA 2016-based Demographic Projections London Ward population projections Housing-led Model, rounded
to the nearest 100
Figure 6 below provides data in tabular format for the projected number of 11 - 16 year
olds (secondary aged pupils) to 2028. Overall a net increase is projected across the
Borough with the largest increases expected in Erith and Crayford. However, these
increases are based on current trends and do not incorporate additional pupils arising
from the implementation of the Bexley Growth Strategy.
Figure 6
Projected numbers of 11-16
year olds by planning area 2018 2020 2022 2024 2026 2028
1 Thamesmead & Belvedere 3200 3500 3700 3800 3800 3900
2 Erith & Crayford 5700 6200 6700 6900 7000 7000
3 Bexleyheath 2200 2400 2700 2900 2900 2900
4 Welling 3300 3500 3700 3700 3700 3700
5 Sidcup 3900 4100 4400 4500 4600 4500
Total 18300 19700 21200 21800 22000 22000
Data source: GLA 2016-based Demographic Projections London Ward population projections Housing-led Model, rounded
to the nearest 100
17Primary pupils’ resident outside Bexley
Figure 7 shows the percentage of Bexley primary school pupils living in each area.
This highlights that the majority of primary pupils who live outside Bexley come from
the Royal Borough of Greenwich (6.02%).
Data source: January 2018 School Census
Figure 8 shows that the largest number of Bexley primary pupils resident outside the
borough come from Greenwich to attend schools in the Thamesmead & Belvedere
and Welling planning areas, reflecting the geographical proximity of these areas. The
planning area with the fewest primary pupils resident out of borough is Erith &
Crayford.
Data source: January 2018 School Census
18Secondary pupils’ resident outside Bexley
Pupil mobility at secondary school level is much greater than at primary, resulting in a
lower proportion of pupils in Bexley schools who are Bexley residents.
Figure 9 shows that 70.2% of pupils attending Bexley secondary schools live within
Bexley, which is only 0.4 percentage points lower than that shown by the autumn 2016
school census data. The Royal Borough of Greenwich has 17.7% of all pupils in Bexley
secondary schools, followed by Kent at 4.6% and Bromley with 4.4% of pupils.
The Bexley selective system plays a significant role in this as pupils from boroughs
without grammar schools choose to take the Bexley selective test and travel to Bexley
for their education. The relatively short distances involved and free bus transport for
11-16 year olds within London also plays a role in enabling a high degree of cross-
border migration of pupils.
Figure 10 shows the number of Secondary school pupils who live outside of Bexley,
broken down by their school’s Planning area. Similarly to primary school pupils, the
largest number of pupils come from the Royal Borough of Greenwich.
Unlike primary school pupils, the largest proportion of out of borough pupils attends
schools in the Bexleyheath planning area. Pupils who live in Bromley mostly attend
Sidcup schools.
19Data source: January 2018 School Census
Bexley planning area of school location
Borough of
residence of 1 Thamesmead 2 Erith &
3 Bexleyheath 4 Welling 5 Sidcup Total %
Bexley secondary & Belvedere Crayford
pupils
Bexley 1180 2312 3938 2743 3379 13552 70.2%
Greenwich 491 157 1241 1082 445 3416 17.7%
Bromley 1 1 264 23 563 852 4.4%
Kent 22 201 483 53 121 880 4.6%
Lewisham 8 7 300 48 164 527 2.7%
Other 5 4 48 7 11 75 0.4%
Total 1707 2682 6274 3956 4683 19302
Types of School in Bexley and those who attend
Figure 11 shows the residential origin of all Secondary pupils by Local Authority area
broken down by type of school. The vast majority of pupils in non-selective schools
are Bexley pupils. The distribution for faith schools is more mixed, whilst the lowest
proportion of Bexley pupils are in Bexley selective schools. Bexley residents who
attend schools outside of Bexley mainly choose schools close to the borough
boundary in Royal Greenwich, Kent and Bromley.
20Borough of Non-
Selective Faith
residence selective
Bexley 8818 2883 1851
Greenwich 1443 1410 563
Kent 377 239 264
Bromley 118 710 24
Lewisham 45 459 23
Other 20 49 6
Bromley residents who attend Bexley secondary schools predominantly attend
selective schools. This could be due to one of the four selective schools in Bexley
being in close proximity to the border with Bromley.
Bexley Growth Strategy
The London Borough of Bexley has produced a Growth Strategy for the Borough which
would involve a substantial increase in new development over 20 years.
As part of the planning for new development, land for new infrastructure that will be
required, including schools, will need to be identified. This will help ensure that the
demand for school places arising from the scale of such development is met.
Five key areas have been identified, where the majority of new development may take
place.
• Belvedere
• Crayford
• Erith
• Slade Green
• Thamesmead
21This potential future growth is linked with future improved accessibility and provision
of major new transport infrastructure in the north of the borough, for example through
a potential extension to Crossrail from Abbey Wood and new river crossings. The
potential scale of the Growth Strategy will mean that existing schools will not have
sufficient capacity to provide places for a potential increased number of additional
school age residents. New primary and secondary schools may need to be provided
in phases so that new places are provided in line with occupation of new dwellings.
22SECTION 4 SCHOOL PUPIL FORECASTING METHODOLOGY
School place planning projections are provided so that the Local Authority can
anticipate the demand for school places and plan accordingly. Along with the majority
of London boroughs, Bexley subscribes to the Greater London Authority’s (GLA)
School Roll Projection Service, which supplies projections up to 3 times a year.
These projections are based on the GLA’s population estimates for the borough, which
are broken down into planning areas from ward level data. These are then
complemented with actual school roll data for the previous 4 years, information on
existing school provision and patterns of in/out Borough migration of residents.
The Local Authority refines the projections by applying local knowledge, historic school
admissions data and other intelligence, which the GLA is unable to apply to a London-
wide statistical model.
Net Migration
Net migration is the resulting additional population resident in the borough when you
compare the number of people who have come to live in the borough with the number
who have left to live elsewhere.
In recent years Bexley has received significant numbers of in-year applications from
families moving into the Borough, both for mainstream and SEN places. As a result,
primary school year group cohorts have grown and then stabilised, and this is reflected
in forecast numbers for the coming years. It is very difficult to anticipate changes in
the composition of communities in Bexley and how this will affect demand for places.
This is something that is kept under constant review. The rise in net migration has
resulted in a shortage of school places in some year groups in recent years, and
additional classes have had to be opened to meet demand.
Bexley remains a high net importer of pre-statutory school age children from other
London Boroughs, particularly the Royal Borough of Greenwich. Data from the
Department for Education shows that more children come into the borough to attend
school than those who go out. This highlights the extent to which children approaching
school age and of primary age has been moving into Bexley in recent years and
providing pressure and upward demand on the number of Reception places in the
borough available.
Quality of Provision
The quality of provision on offer impacts on the number of pupils that are attracted to
Bexley schools, particularly in terms of out borough pupils. As reputations rise or fall,
existing admission patterns can quickly change. The opening of new schools and
provision of additional capacity in existing schools can also affect admission patterns
and result in changing demand for places at some schools.
23Academies/Free Schools
Whilst the Local Authority retains the overall statutory responsibility for the supply of
sufficient places, changes in legislation relating to school governance including the
Academy and Free Schools programmes have created more variables in the system.
Academies set their own admissions criteria, which they can alter to give priority to
certain groups so long as they are compliant with the School Admissions Code. They
also have the ability to increase their Published Admission Number without any
requirement to consult with the community or the Local Authority.
Free Schools can have the effect of providing places in areas where there may or may
not be a shortage of places. As schools that are established through an agreement
with the Department for Education, the Local Authority has no control over Free
Schools or Academies although the number of places provided are taken into account
when planning for the availability of sufficient places. Protocols on data and
information sharing are put in place to encourage non-LA schools to work with Bexley
in order to make the planning of provision easier.
External Factors
The economic climate may also have an impact upon the demand for school places.
For example, during a recession the proportion of resident children seeking a state
school place rather than attending an independent school may increase. Issues such
as the state of the housing market, impact of welfare reform, cost of renting and many
other factors will impact on the choices people make and the number of families living
in Bexley and seeking school places.
Rising Demand
The continuous demand for places has, in some areas, resulted in significant strain on
the capacity in primary schools through in-year applications across age groups; please
see below Table Figure A which demonstrates a snapshot of the high level of in-year
applications we receive every month. Whilst data projects that the birth rate is steadily
increasing and we plan 3-5 years in advance, continuous monitoring of in-year
applications has become increasingly important since we first experienced this
pressure in 2015. We have planned proposed developments to meet this demand
which are detailed in this report.
Figure A – In Year Applications
Secondary In Year
Date Primary In Year Applications
Applications
Oct-17 120 78
Nov-17 118 56
Dec-17 67 37
Jan-18 175 84
Feb-18 101 46
Mar-18 123 47
Apr-18 92 44
May-08 89 31
24Jun-18 150 57
Jul-18 172 91
Aug-18 57 47
Sep-18 184 83
Oct-18 137 77
TOTAL 1585 778
As at October 2018 we have received 5441 Primary and 2442 Secondary in year
applications since January 2015 with October 2018 being the highest record for that
month in previous years. Whilst not all of these applications materialise into actual
places this continual pressure means that Bexley has to plan not only for sufficient
places on National Offer Day but for 7 and 5 years growth to ensure that there are
sufficient places to deal with this ‘in year’ demand.
Approaches to Forecasting – Methodology
There are a number of approaches to forecasting future demand for school places.
These can be based on live births, population estimates or more directly linked to
trends of numbers of pupils at schools in the borough. Bexley uses the Greater
London Authority School Roll Projection Service, which has long standing experience
of developing accurate forecasts for the majority of London boroughs that opt into the
subscription service. The basis for GLA projections is ward level population estimates,
which are developed from the starting point of the 2011 Census population data, and
then have the following applied to produce revised estimates: -
• Births and deaths
• Net migration
• Future fertility trends
Through the application of a range of methodologies, a range of population estimates
can be produced on which a series of alternative scenarios can be forecast.
In 2018 the GLA identified issues with the methodology of an element of the Office for
National Statistics data upon which the school roll projections depend, which had led
to an overestimate in the projected number of Reception age pupils. The GLA is
working with the ONS and the Department for Education to resolve this issue, and in
the meantime adapted its own methodology for 2018 forecasts to try to mitigate this
change. The resulting revised forecasts for Bexley continued to under-estimate
demand as has been our experience in recent years, possibly due to Bexley’s position
as having higher net migration in recent years as well as being a net importer of pupils.
Whilst birth rates have now fallen slightly and are beginning to stabilise from historic
highs in 2011/12, the degree of in-year movement into the Borough in terms of net
gains in pupils remains a challenge.
Fundamentally, GLA trend-based projections are produced based on an assessment
of future fertility, population growth and mortality. They assume that trends
experienced in the previous few years will remain broadly the same. As a borough
with limited new housing development in recent years but a rising population, trend-
based forecasts are the most appropriate way for Bexley to assess future demand.
25Whilst future development data is not directly linked to such forecasts, such models
implicitly assume that recent development trends will continue in the future.
The Bexley Growth Strategy is likely to greatly change the dynamics of School Place
forecasting in the Borough. It will no longer be possible to forecast based on recent
trends if development levels vastly exceed those seen in the last few years. The need
for a new approach to the Commissioning of School Places in the Borough will be
required.
Secondary pupil projections differ from those for primary schools in that they are not
based on the proportion of young people in the population estimates who are expected
to require a school place. Demand for secondary places is forecast by the transfer
rate between Year 6 to Year 7 in previous years. This has the advantage of replicating
the admission patterns in the Borough and ensures that sufficient places are provided
given the complexities of secondary admissions and large distances many pupils
travel both out of and into the Borough for their education.
Where caution must be exercised is where admission patterns change due to changes
that have taken place such as the provision of new schools or additional capacity,
changes in demand altering historic patterns and the reduction of out of Borough pupils
obtaining places at Bexley secondary schools. For the September 2018 reception and
year 7 intake 8.44% of primary and 26.02% of secondary offers went to out of Borough
pupils. If this were to significantly reduce it would alleviate future pressure on places
that might arise.
Bexley continually reviews the appropriateness of the type of population projections
used to forecast future demand to ensure that they remain realistic. There are a variety
of other models produced to forecast population growth and we will check actual
evidence of demand against the range of estimates available to ensure that they are
accurate and relevant.
26SECTION 5 ANALYSIS: PRIMARY AND SECONDARY
In Bexley, pressure on primary places was first experienced in the north of the borough
in 2009/10. Since then, the number of primary aged children has increased in all parts
of the borough, and a comprehensive school expansion programme was put in place
to meet demand. The table below shows all the primary schools that have been
expanded from 2011 to 2018.
Academic New
year of places Total
first per year places
School Expansion type expansion group created
Castilion Primary School Permanent 2010/11 20 140
Jubilee Primary School Permanent 2010/11 15 105
Business Academy Bexley Permanent 2010/11 30 210
Lessness Heath Primary School Permanent 2010/11 10 70
Crook Log Primary School Permanent 2011/12 15 105
Foster's Primary School Permanent 2011/12 15 105
Northumberland Heath Primary School Permanent 2011/12 30 210
Peareswood Primary School Permanent 2011/12 30 210
Willow Bank Primary School New School 2011/12 60 420
Christ Church Erith CE Primary School Permanent 2011/12 50 315
St Thomas More Catholic Primary School Permanent 2011/12 15 105
Royal Park Primary School Permanent 2011/12 30 210
Barrington Primary School Bulge class 2012/13 30 30
Gravel Hill Primary School Permanent 2012/13 30 210
Old Bexley CE Primary School Permanent 2012/13 30 210
Northwood Primary School Bulge classes 2013/14 30 60
Hope Community School New School 2013/14 30 210
St Pauls (Slade Green) Primary School Permanent 2014/15 N/A 150
Haberdashers' Aske's Primary Academy Permanent 2014/15 N/A 60
Danson Primary School Permanent 2016/17 30 210
Uplands Primary School Bulge 2016/17 30 30
Uplands Primary School Bulge 2017/18 30 30
Permanent
Mayplace Primary School (Reception) 2018/19 30 30*
Bursted Wood Permanent 2018/19 30 210
Parkway Primary School Permanent 2018/19 30 210**
All schools 3855
*Permanent completion will be completed by September 2019 which will result in 210 permanent
places
** Places have been built but will be filled from September 2019 due to being in line within the
Peabody Housing Zone
Impact on Primary Provision
The London Borough of Bexley differs from the majority of the other London boroughs
in that its main pressure still remains in delivering sufficient primary school places.
This is driven through a combination of factors including migration linked to its
geographical location (outer London borough bordering Kent and its motorway
27network from major sea ports), the reduction in the Housing Benefit cap and the ability
to still rent properties within Bexley at a lower market value.
Since 2015 Bexley has received over 5,000 primary in year applications which is
nearly 20% of our entire primary school places. This level of demand is unpredictable,
hard to plan for and results in Bexley needing to ensure that there is sufficient in year
growth built into any primary school place planning. Whilst applications for the
September 2018 reception intake were slightly down on the same stage in 2017 (42)
Bexley is mindful of the continuous in year application pressures which it has faced
over the last 3 years, and the difficulty encountered in attempting to create in year
bulge classes. Between April and October 2018 we have received a further 220
applications for reception places. Our projections coupled with the in-year demand
require 4/5 additional reception classes between now and 2022; this does not include
Bexley’s growth agenda. This includes the proposed new Limewood Free School
being built as part of the Erith Quarry development which will provide up to 90 new
reception places (60 of those within this period). However, without this development
these school places are not required in this area and the 60 places would not be
necessary. Additionally this does not include the proposed 1FE expansion within the
Thamesmead Housing Zone which would not be required without the expected net
increasing homes.
Current projects in progress to meet the expected
SEN projects can be found in the SEN Commissioning Plan.
• 1FE permanent expansion at Bursted Wood Primary School (Planning Area 3
– Bexleyheath) completed in September 2018
• The permanent expansion of Mayplace Primary School (Planning Area 3 –
Bexleyheath) which will be delivered by September 2019 with the Reception
class that has was opened in September 2018.
• The permanent expansion of Birkbeck Primary School (Planning Area 5 –
Sidcup) which will be delivered by September 2019.
• The permanent expansion of Parkway Primary School by 1FE (Planning Area
1 – Thamesmead & Belvedere), in order to meet the proposed growth arising
from the Thamesmead Housing Zone, to be opened in September 2019.
• Up to a 3FE new Free School as part of the Erith Quarry Development
(Limewood) to be opened from 2020 (Planning Area 2 – Erith & Crayford)
Proposed future expansion
Subject to the necessary statutory approvals it is anticipated that the following projects
will be delivered during 2019-2022:
• Additional capacity at Woodside Colyers
• New 120 place Cleeve Meadow SEN Free School
• New Limewood Primary Free School
• Potential double modular at Endeavour Academy (SEN places)
More information on the SEN projects can be found in the SEN commissioning
plan.
Figure 12 –GLA Alternate projection aged pupils 4 – 10
28Figure 12 shows actual and forecast primary pupil numbers, compared with the
primary age resident population, which have risen and then stabilised, before any
account of the growth strategy is taken. More recent published forecast data is not
currently being used due to ongoing issues with new Office for National Statistics
methodology which adversely affects the GLA forecasts.
Figure 12 – GLA Alternate Projection Autumn 2015 Primary 4 – 10 years
28,000
26,000 23,926 24,021 24,207 24,312 24,339 24,264 24,331 24,429
24,488
23,253 23,674
24,000 22,610
21,929
23,924
22,000 23,357 23,452 23,689 23,805 23,855 23,756 23,812 23,886
22,698 23,166
20,000 22,100
21,523
18,000
16,000
14,000 12,347
11,792 11,969 12,070 12,102 12,199 12,234 12,237 12,214 12,258 12,317
11,202 11,516
12,000
12,078 12,102 12,050 12,073 12,112 12,142
10,000 11,460 11,705 11,856 11,919 12,009
10,727 11,094
8,000
6,000
Boys Girls Primary school roll projection Population
4,000
2,000
2014 2015 2016 2017 2018 2019 2020 2021 2022 2023 2024 2025 2026
Capacity
The table below illustrates the anticipated increase in demand for reception school
places and the number of additional classrooms required. In the –2017-19
Commissioning Plan, we increased raw GLA projections by 2.1% and allowed for an
minimum of an additional 2.5% capacity at Reception stage to allow for in year
applications between Reception and Year 6. Future growth in the number of primary
school places required is instead largely expected to be driven by the Growth Strategy
and new residents who will require new school places over and above these forecasts
which meet the needs of the forecast existing population and increases based on
current trends.
This gives more flexibility to prioritise capital expenditure and to provide additional
places where and when they are needed, on a short-term basis via bulge classes if no
long term demand is projected at that time. There are 3,430 primary places already
available with further places currently under construction. These figures will need to
be kept under review as and when large development comes on stream. For example
the former Civic Office site which will deliver 500 new homes and the proposed Erith
Quarry which will deliver 630 new homes although places required from this
development are already planned for through the new Limewood Free School.
Figure 13 shows actual and forecast secondary pupil numbers, compared with the
secondary age resident population. These also continue to rise to the end of the
decade.
29Figure 13 – GLA Alternate Projection Secondary 11 to 15 years
22,000
20,060
19,640 19,755 19,983
20,000 19,218
18,665
18,237
17,795
18,000 17,113
16,515
16,029 15,945 16,224 18,307 18,439 18,493
17,803 18,211
16,000 17,346
16,908
16,390
15,719
14,000 14,823 14,772 14,909 15,213
12,000
9,125 9,300 9,324 9,386 9,399
10,000 8,458 8,681 8,895
7,817 8,086
7,553 7,573 7,660
8,000 8,911 8,983 9,053 9,094
8,451 8,678
7,932 8,227
7,271 7,250 7,396 7,634
6,000 7,200
4,000
Boys Girls Secondary school roll projection Population
2,000
2014 2015 2016 2017 2018 2019 2020 2021 2022 2023 2024 2025 2026
Secondary Provision
From September 2018, there were 3460 Year 7 places which is 67 more places from
last year with 3036 home LA applications, 218 up on last year. Of the 3460 places only
157 remained vacant on national offer day which is 94 less at the same stage last
year. There are currently 17,113 secondary school places in Bexley in Years 7 to 11
based on the previous and current PAN, Any spare places are needed for in year
growth for applicants moving into the borough. However, a risk is that schools with
large numbers of unfilled Year 7 places may adjust their staffing budgets accordingly
and cap the intake, leading to a shortage of places in the year group by Years 8 and
9.
Bexley’s secondary provision is currently sufficient to deal with demand and growth
levels as we are not experiencing the same demand levels as many other London
local authorities. However, the GLA forecasts, together with the primary school growth
which began in 2012 suggested that Bexley would need to start increasing its
secondary capacity from 2018/19 and that by 2023 as many of 14 additional forms of
entry may need to be provided. This will either have to be accommodated through
existing schools increasing their planned admission numbers (PAN) or secondary
school expansion. Whilst we currently have sufficient places, two of our Selective
Grammar Schools have increased their PAN and two more are in the process of doing
so, therefore we have been able to meet this need. New schools and new communities
in neighbouring boroughs will also influence the level and speed of demand for
secondary places in Bexley
Existing schools that have previously reduced their admission numbers and retained
the building capacity to expand again in the future will have to increase their year 7
intake when it is required. That said, new schools and new communities in
30You can also read