A case against demographic destiny - Age and arts participation: National Endowment for the Arts
←
→
Page content transcription
If your browser does not render page correctly, please read the page content below
National Endowment for the Arts

Age and arts participation:
A case against demographic destiny

                              Mark J. Stern
                              University of Pennsylvania
National Endowment for the Arts
Age and arts participation:
A case against demographic
destiny
Mark J. Stern
University of Pennsylvania
Based on the 2008 Survey of
Public Participation in the ArtsResearch Report #53
February 2011
National Endowment for the Arts
1100 Pennsylvania Avenue, NW
Washington, DC 20506-0001
Telephone: 202-682-5400
Prepared by Mark J. Stern
Produced by the Office of Research & Analysis
Sunil Iyengar, Director
Sarah Sullivan, Senior Program Analyst
Other staff contributors: Tom Bradshaw, Bonnie Nichols, Ellen Grantham, Patricia Shaffer, Nona Milstead, and Michael Acton
Designed by Roman/Thayer Design Inc.
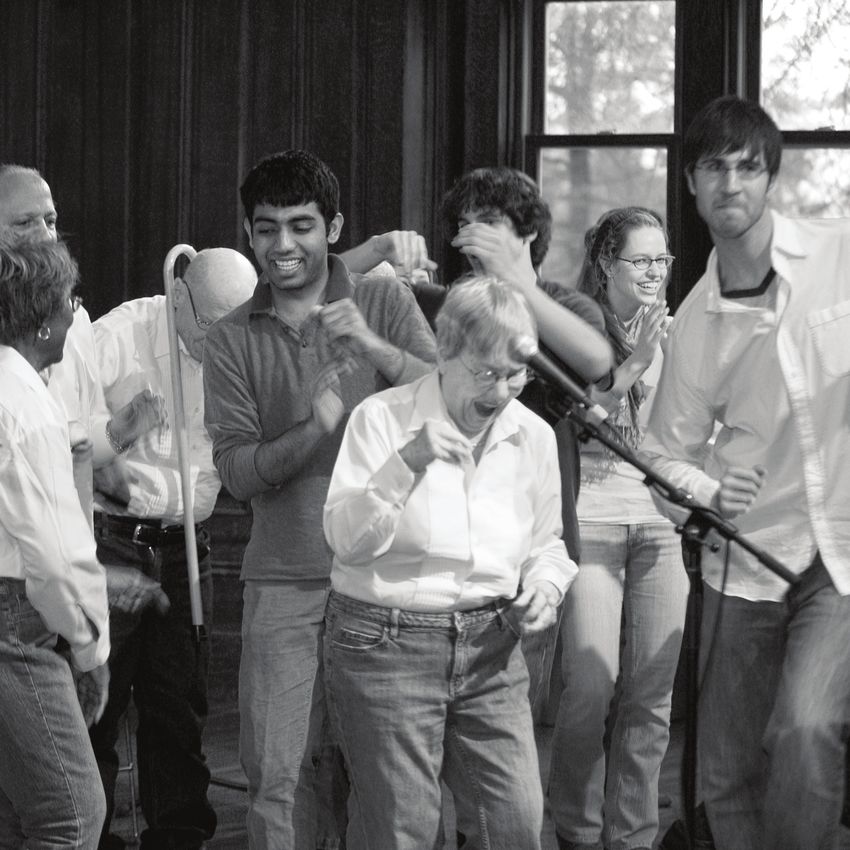
Front Cover Photo: Dartmouth College students get down with members of Young@Heart. Photo by Kawakahi Amina
Printed in the United States of America
Library of Congress Cataloging-in-Publication Data
Stern, Mark J.
Age and arts participation : a case against demographic destiny / Mark J.Stern.
p. cm. -- (Research report ; #53)
“Based on the 2008 Survey of public participation in the arts.”
Includes bibliographical references and indexes.
1. Arts audiences--United States. 2. Arts surveys--United States. 3. Arts--United States--Citizen participation.
I. Title. II. Title: Case against demographic destiny.
NX220.S74 2011
700.973’090511--dc22
2010054573
Available after February 24, 2011, in the PDF version of the report at www.arts.gov.
202-682-5496 Voice/TTY
(a device for individuals who are deaf or hearing-impaired)
Individuals who do not use conventional print materials may contact the Arts Endowment’s Office for
AccessAbility at 202-682-5532 to obtain this publication in an alternate format.
This publication is available free of charge at www.arts.gov, the website of the National Endowment for the Arts.CHAIRMAN’S NOTE
Photo by
Michael Eastman
“Art works.” Those two words — with their three Each of these reports individually expands and
meanings — are perhaps the simplest and clearest shades our understanding of the arts participation
declaration of what we are about at the National numbers. Collectively they report that one
Endowment for the Arts. They first refer to works of factor, above all others, is the prime indicator of
art themselves, to the creations of artists. They also arts participation — a factor not surprising to
remind us that art works on audiences, to comfort, any Glee-ks:
challenge, and inspire us. And finally, they are a bold
Arts education in childhood is the most significant
reminder of the artists and arts workers across this
predictor of both arts attendance and personal arts
country who earn wages, pay taxes, and contribute
creation throughout the rest of a person’s life.
toward our country’s economy.
All of us who care about the arts in this country
Our 2008 Survey of Public Participation in the
have to care about arts education, about exposing
Arts seems to report that art is working for fewer
young people, early and often, to the arts in rich,
Americans, a finding that is deeply disturbing
rigorous, and repeated ways. That is largely why, over
to all of us who care about the arts in our country.
the past year, we funded arts education projects in
It reports a 5 percentage point decline in arts
every Congressional district in America.
participation by Americans.
The reports on technology and personal creation
But as I have been traveling across this country, those
greatly expand our institutional understanding of
findings did not ring true with what I was seeing:
meaningful arts participation.
young people signing on to Pandora and plugged into
all manner of mp3 players; people of all ages watching And the report on age shows that it’s not the
Dancing with the Stars and So You Think You Can audiences who are graying, it’s our country: the age
Dance; the prevalence of etsy.com and the quarter distribution of audiences generally mirrors the
of a million military families who visited one of our adult population of the United States. Baby Boomers
920 Blue Star Museums over 4 months this summer; continue to dominate audiences, just as we did
the Kindles and Nooks in front of every airport in the 1980s, when we were among the youngest
passenger; Netflix and YouTube allowing all manner audience members.
of film and media, past and present, to be consumed
Taken together, the 2008 Survey of Public
anywhere. And how about Glee?
Participation in the Arts with its follow-up reports,
I am witness to a voracious American appetite present the most nuanced understanding of arts
for the arts that does not seem to track with a decline participation that the NEA has yet presented. I am
in arts participation. Luckily, Sunil Iyengar, our pleased to share these reports with you, and proud
director of research and analysis, had the foresight to of the way we are expanding our understanding
commission a series of deeper looks at this data, of how art works in America.
and asked fellow researchers to interrogate this data
about the roles that technology, arts education,
age, and personal arts creation play in American Rocco Landesman
arts participation. Chairman
National Endowment for the Arts“I was so much older then;
I’m younger than that now.”
– Bob Dylan
6 National Endowment for the ArtsTABLE OF CONTENTS 11 PREFACE 15 EXECUTIVE SUMMARY 25 INTRODUCTION 27 Consumption across the life cycle 28 Civic participation 33 CHAPTER 1. BENCHMARK ARTS PARTICIPATION BY AGE AND COHORT 33 Introduction 33 Summary measures 33 Any benchmark participation 33 Number of activities 34 Events attended 34 Analysis 36 Individual activities 36 Participation rates by age 37 Participation rates by cohort 38 Audience share 42 Educational attainment and age: a confounding relationship 43 Multivariate analysis of benchmark activities 43 Number of activities and age 46 Number of activities and cohort 47 Conclusion 49 CHAPTER 2. PATTERNS OF PARTICIPATION 49 Introduction 49 Cluster analysis 50 Patterns of participation by age and cohort 52 The impact of declining omnivore behavior on total attendance 53 Conclusion 55 CHAPTER 3. LITERARY READING 55 Introduction 55 What factors are correlated with reading? 55 Education 56 Gender, race, and ethnicity 56 Age and cohort 58 Multivariate analysis 61 CHAPTER 4. MEDIA-BASED AND PERSONAL ARTS PARTICIPATION 61 Introduction 61 Overall patterns in media-based and personal arts participation 61 Media-based and personal arts participation by age and cohort 62 Conclusion 65 CHAPTER 5. CONCLUSION AND IMPLICATIONS 69 REFERENCES 73 TECHNICAL APPENDIX
LIST OF TABLES

34 		 Table 1:    Percent of respondents who reported attending at least one event of a given type by year
35 		 Table 2:    Distribution of respondents by birth cohort, 1982–2008
38 		 Table 3:    Distribution of participants by age and year, benchmark arts activities
39 		 Table 4:    Audience share by age, benchmark participants
40 		 Table 5:    Jazz participation: audience share by age and year of survey
40 		 Table 6:    Ballet participation: audience share by age and year of survey
41 		 Table 7:    Classical music participation: audience share by age and year of survey
42 		 Table 8:    Average age of benchmark arts participants, by activity and year
43 		 Table 9:    Benchmark participation index, by year. General linear analysis
43 		 Table 10: Average number of activities. General linear model, summary statistics
44 		 Table 11: Average number of activities. General linear model (age included), summary statistics
46 		 Table 12: Average number of activities. General linear model (cohort included), summary statistics
50 		 Table 13: Distribution of U.S. adults by arts participation patterns, by survey year
56 		 Table 14: Percent of respondents reporting any reading, by gender, educational attainment, ethnicity, and year
58 		 Table 15: 	Percent of respondents who read any novels or short stories, poetry, or plays in the previous year.
                  General linear model analysis, summary statistics
62 		 Table 16: Media-based and personal arts participation rates by age and year
62 		 Table 17: Media-based and personal arts participation rates by birth cohort and year
LIST OF FIGURES
17 Figure A: Indices of arts participation by age, U.S. adults, 1982–2008
17 Figure B: Percent of U.S. adults who attended different types of events, by cohort, 1982–2008
18 Figure C: Percent of U.S. adults who attended any benchmark event, by age and birth cohort, 1982–2008
20 Figure D: Percent of U.S. adults classified as omnivores, by age and birth cohort, 1982–2008
27 Figure 1: Expenditures: Nondurables
34 Figure 2: Indices of arts participation by age, U.S. adults, 1982–2008
36 Figure 3: Number of activities attended and percent attending any benchmark events, U.S. adults,
by birth cohort, 1982–2008
36 Figure 4: Percent of U.S. adults who attended different types of events, by age, 1982–2008
37 Figure 5: Percent of U.S. adults who attended different types of events, by cohort, 1982–2008
37 Figure 6: Percent of U.S. adults who attended any benchmark event, by age and birth cohort, 1982–2008
45 Figure 7: Average number of activities attended by U.S. adults, by age, uncontrolled and controlling for
other variables, 1982–2008
45 Figure 8: Strength of relationship between age and average activities attended by U.S. adults, uncontrolled
and controlling for other variables, 1982–2008
47 Figure 9: Average number of events attended by U.S. adults, by birth cohort, uncontrolled and controlling
for other variables, 1982–2008
51 Figure 10: Percent of U.S. adults classified as omnivores, by age and birth cohort, 1982–2008
51 Figure 11: Percent of U.S. adults classified as highbrow participants, by age and birth cohort, 1982–2008
52 Figure 12: Percent of U.S. adults by type of participant and number of events attended
53 Figure 13: Average number of events attended by U.S. adults, by type of participant, 1982–2008
55 Figure 14: Percent of U.S. adults who read any novels or short stories, poetry, or plays in the previous year,
1992–2008
56 Figure 15: Percent of U.S. adults who read any novels or short stories, poetry, or plays in the previous year,
by age of respondent, 1992–2008
57 Figure 16: Percent of U.S. adults who read any novels or short stories, poetry, or plays in the previous year,
by birth cohort, 1992–2008
57 Figure 17: Percent of U.S. adults who read any novels or short stories, poetry, or plays in the previous year,
by age and birth cohort, 1982–200810 National Endowment for the Arts
PREFACE

The National Endowment for the Arts’ Survey                  Results from the study of media, technology, and
of Public Participation in the Arts (SPPA) is the            arts participation appeared in June 2010.3 For the
nation’s largest periodic survey of adult involvement        remaining topics, the NEA was fortunate to obtain
in arts and cultural activities. For more than a             the services of four researchers or research teams
quarter-century, since the survey was first                  already renowned for their work in characterizing
conducted, researchers at the Arts Endowment                 trends in arts participation. Those researchers
have issued summary reports and key findings to              included Mark Stern, University of Pennsylvania,
the public. In addition to reporting the survey              and separate teams at WolfBrown and the National
results as a whole, the NEA has made the data files          Opinion Research Center (NORC) at the University
available to other arts and cultural researchers             of Chicago.
for their own analyses and publications.1
                                                             Each of these researchers has added a vitally new
The 2008 SPPA provided a fascinating glimpse into            dimension to the NEA’s official summary of the
changing patterns of arts participation. Since the           2008 data, as published in 2009.4 This report, one of
prior survey period of 2001–2002, rapid advances in          three to become available in 2011, is a direct result
technology had enabled more access to arts events            of their efforts.
and arts creation through portable devices and the
                                                             In their analysis, NORC researchers Nick Rabkin
Internet. Also, in 2007–2008, many representatives
                                                             and Eric Hedberg test and ultimately confirm the
of Gen Y (or the “Millennials”) — the second largest
                                                             validity of an assumption made with prior SPPA
generation since the Baby Boomers — became
                                                             data, that participation in arts lessons and classes is
eligible for taking the survey.
                                                             the most significant predictor of arts participation
These factors alone would have made the 2008                 later in life, even after controlling for other
SPPA data an attractive prospect for researchers. But        variables. They also show that long-term declines
in still other ways the 2007–2008 survey year                in Americans’ reported rates of arts learning align
marked an aberration. For the first time since 1982,         with a period in which arts education has been
attendance rates declined for virtually all art forms        widely acknowledged as devalued in the public
captured by the survey; also for the first time, many        school system. Nor are the declines distributed
of those declines occurred for adults 45 years or            equally across all racial and ethnic groups.
older — an age group that historically has accounted
                                                             Working along quite different lines, Mark Stern
for the largest share of arts audiences.
                                                             similarly concludes that arts education is the
Therefore, even before the 2008 SPPA results had             most important known factor in influencing arts
been announced, the NEA posted the survey data               participation trends. But he is much more skeptical
online, to allow researchers to conduct their own            about the impact of other variables, especially age.
analyses. The NEA also commissioned reports on               Practically since the SPPA began, in 1982, there has
five cross-cutting topics: media and technology, arts        been much talk about the “graying” of arts audiences.
education, arts creation, age, and race and ethnicity.2      And while it is certainly true that the audiences

                                                          Age and arts participation: A case against demographic destiny   11
for many art forms tracked by the SPPA are aging
more rapidly than the U.S. population, Stern brings
out the sobering fact that age and generational
cohort differences account for less than 1 percent of
the variance in the total number of arts events that
Americans attended over the period of 1982–2008.
Observing that arts attendance may be far less
dependent on age than usually considered, he
gives the lie to the notion of “demographic destiny”
when it comes to arts engagement.
Based on their own analysis of the SPPA data,
Jennifer Novak-Leonard and Alan Brown advance a
“multi-modal” framework for understanding arts
participation. Novak-Leonard and Brown challenge
the orthodoxy of representing overall participation
rates merely as a function of visual or performing
arts attendance. They suggest that a more expansive
benchmarking system — one accounting for
participation across three modes (arts creation or
performance; arts engagement through media; and
attendance at a broader array of activities) — would
produce more relevant results for arts funders,
arts managers, and the general public.
The NEA’s Office of Research & Analysis already has
begun to incorporate the ideas of these report-writers
into its deliberations about the future of the SPPA.
The authors offer three distinctive takes on a federal
data source which, since 1982, has shaped much of
the conversation about how arts and cultural policies
and programming can engage audiences more
effectively. By supporting independent research of
this type, we hope to broaden the scope of that
conversation.
Sunil Iyengar
Director, Research & Analysis
National Endowment for the Arts
12 National Endowment for the ArtsNOTES
1 For example, see the National Endowment for the Arts website,
Supplementary Materials Related to the NEA’s 2008 Survey of
Public Participation in the Arts, www.nea.gov/research/SPPA/
index.html.
2 The report on race/ethnicity and arts participation is still in
progress. Authored by Vincent Welch, et al. of the National
Opinion Research Center (NORC), it will be made available
via the NEA website in 2011.
3 This report was published in multi-media and PDF versions as
Audience 2.0: How Technology Influences Arts Participation,
based on research by Sameer Bawa, Kevin Williams, and
William Dong, BBC Research & Consulting. Audience 2.0,
Research Report #50 (Washington, DC: National Endowment for
the Arts, 2010), available online, www.nea.gov/research/
ResearchReports_chrono.html.
4 See 2008 Survey of Public Participation in the Arts,
Research Report #49 (Washington, DC: National Endowment
for the Arts, 2009), available online, www.nea.gov/research/
2008-SPPA.pdf. The Executive Summary of that data appeared
as Arts Participation 2008: Highlights from a National
Survey (Washington, DC: National Endowment for the Arts,
2009), available online, www.nea.gov/research/NEA-SPPA-
brochure.pdf.
Age and arts participation: A case against demographic destiny 13The predictive powers
of age and cohort were never
particularly strong, and
they declined over time.
14 National Endowment for the ArtsEXECUTIVE SUMMARY
INTRODUCTION Age consciousness has affected our understanding
of arts participation as well. Differences in rates
A century ago, many Americans did not know of arts participation of the Baby Boomers and earlier
exactly how old they were, so they often would and later generations have been of particular
round off their age to the nearest five years, a concern. Yet we might ask: has age consciousness
phenomenon that demographers call “age-heaping.” gotten out of hand?
As late as 1910, for example, the U.S. Census listed
24 percent more 20-year-olds than 19-year-olds. The Specifically, does age matter to arts participation?
disappearance of age-heaping and its replacement The answer to that question depends on who is
by age consciousness — an increased sensitivity asking it. To an arts administrator who sees the
to the role of age and generation on behavior — by the average age of her audience increase year after year,
middle of the 20th century represents a profound it does matter, even if what she’s noting is simply the
change in how Americans thought about their lives general aging of the population. From a sociological
and their relationship to the rest of society. Today, viewpoint, however, the question can be reframed:
age consciousness has so penetrated our society does knowing a person’s age or year of birth allow
that one’s membership in a particular generation one to more accurately predict his or her level of
or birth cohort is often offered to explain a variety arts engagement?
of behaviors — from consumption decisions to Age and cohort have a statistically significant —
political preferences. but weak — relationship to different measures
of arts participation. Knowing someone’s age or
year of birth provides very little power in
Throughout this report, we classify respondents by their explaining his or her level of arts participation.
year of birth into a set of birth cohorts: In this specific sense, age does not seem to matter.
Other influences — educational attainment
Year of birth Birth cohort
and gender, in particular — have a much stronger
1935–1944 World War II
role in explaining arts participation.
1945–1954 Early Baby Boom
1955–1964 Late Baby Boom
Arts participation as consumption and civic
1965–1974 Generation X
engagement
Economists have long been interested in the
For the purpose of long-term trend analysis, we influence of age, cohort, and the business cycle on
lack sufficient data on adults born before 1935 consumption. Empirical research has produced
and after 1975. Therefore, we have not named these general agreement that the life-cycle of individuals
cohorts, although they are sometimes included in plays an important role in explaining aggregate
tables and figures. trends in consumption. Consumption rises through
one’s twenties and thirties, peaks during one’s
forties, and then declines steadily as one ages.
Age and arts participation: A case against demographic destiny 15Fears about falling rates of arts participation echo a BENCHMARK ARTS PARTICIPATION BY
broader debate over declines in Americans’ civic AGE AND COHORT
engagement. Robert Putnam has argued strenuously
that Americans born since the 1930s have been less Age consciousness has led many scholars to
involved in community life than earlier generations. assume that age and cohort strongly influence arts
Other scholars — including the authors of A New participation. Yet, as with civic engagement
Engagement? — have sought to counter Putnam by generally, we need to distinguish three aspects of the
expanding the definition of engagement. They relationship of age, cohort, and arts participation.
conclude that more conventional forms of political ■■ From the standpoint of description, we may find
involvement rise with age, while civic engagement in a pattern of relationships. Average participation
a broader sense is highest among Baby Boomers, may go up or down for older age groups or cohorts
with older and younger age-groups having somewhat born earlier or later.
lower rates. ■■ In addition, because the Baby-Boom cohorts
Certainly, it would be a mistake to ignore cohort are larger than those born before or after, age has
effects on civic participation, but a close a compositional effect on the make-up of the
examination of data from these studies suggests arts audience.
that the influence of age and cohort may be less ■■ However, we need to distinguish these issues
important than the authors suggest.5 The same from the predictive value of age and cohort.
observation may hold true for arts participation, if When we control for other influences — especially
prior NEA research offers a clue. the role of educational attainment — the predictive
In 1996, the National Endowment for the Arts issued value of age and cohort turns out to be quite
a monograph exploring the influence of age and minor. Although they are statistically significant,
cohort on arts participation in the United States. the relationships of age and cohort to levels of
That report, authored by Richard A. Peterson et al., arts participation are generally quite weak.
focused on the decline of arts participation Summary measures
among Baby Boomers, compared with the preceding
generational cohort. The study uses methods similar In order to get an overview of general trends,
to the present report, to correct for confounding this report uses three measures of overall arts
factors. Peterson’s analysis makes clear that other attendance: a dichotomous measure of any
variables — above all, educational attainment — involvement in the SPPA “benchmark” activities
have a stronger influence on arts participation than (attendance at jazz, classical music, opera, musical
age and birth cohort. plays, non-musical plays, ballet, and other dance;
and visits to art museums and galleries); the number
Peterson’s more important contribution to our of activities that a respondent did at least once;
understanding of arts participation patterns is and the totalnumber of individual events attended,
connected with his SPPA-based analysis of cultural inclusive of frequency. (See Figure A.)
omnivores. With the first SPPA in 1982, the survey
has included information on the musical tastes of The relationships of these three summary measures
respondents. In 1992 Peterson and Simkus used to age exhibit the same curvilinear relationship.
these data to test theories of cultural capital, Very young and very old respondents have lower
particularly the correlation between individuals’ scores than those in the middle of the age
occupational status and their musical tastes. While distribution. The drop-off among older respondents
their analysis largely confirmed the theory that appears sharper for the number of events attended
musical tastes were a status marker, the researchers than for the breadth of activities attended.
were surprised by one finding: respondents with
higher occupational status not only had higher
rates of appreciation for potentially “elite” cultural
forms, but they had higher rates of appreciation for
middle- and lowbrow forms as well.
16 National Endowment for the ArtsEXECUTIVE SUMMARY
In aggregate, the strength of the relationships The predictive powers of age and cohort were never
between age and these summary measures declined particularly strong, and they declined over time.
over time, with the most profound fall between 2002 Age and cohort predicted between one and two
and 2008. While this link remained statistically percent of the variance in number of activities and
significant, it suggests that the predictive value any benchmark participation in the 1980s. By 2008,
of age went through a steady decline since however, their predictive power had fallen to less
the 1980s and that this tendency accelerated than one percent. The predictive power of number
between 2002 and 2008. of events never exceeded one-half of one percent.
Early Baby Boomers consistently had the highest Individual disciplines
rate of arts participation overall. In each of
Overall, the SPPA has tracked a precipitous decline
the five survey waves, 44 percent of early Baby
in attendance at benchmark arts events since 1992.
Boomers reported attending at least one benchmark
With the exception of attendance at musicals —
activity during the previous year. However, the
which held steady — the percent of respondents who
differences across the four central cohorts are
reported attending at least one event in the previous
hardly dramatic — ranging from 44 to 41 percent.
year dropped for all of the benchmark indicators.
FIGURE A FIGURE B
Indices of arts participation by age, U.S. adults, Percent of U.S. adults who attended different types of
1982-2008 events, by cohort, 1982–2008
2.0 30%
1.8
25%
1.6
1.4
20%
Percent of U.S. adults
Proportion/average
1.2
1.0 15%
0.8
10%
0.6
0.4
5%
0.2
0.0 0%
om
5
25
34
I
om
X
9
4
9
9
4
9
4
9
er
4
I
97
–6
–4
–2
–5
–3
–3
–5
–6
–4
ar
ov
n
19
n
Bo
Bo
tio
r1
25
35
55
30
65
50
W
45
60
40
a
d
re
th
te
ra
an
by
by
ld
fo
Af
ne
ss
or
Ba
Ba
70
Be
W
Le
Ge
rly
te
Age
La
Ea
Average number of events attended Birth Cohort
Average number of types of activities attended Jazz Musicals Other dance
Percent who attended any benchmark arts event Classical Plays Art museums
Opera Ballet
Source: Author’s calculations from Survey of Public Participation in the Arts,
1982–2008 combined file. Source: Author’s calculations from Survey of Public Participation in the Arts,
1982–2008 combined file
Age and arts participation: A case against demographic destiny 17Jazz has historically been more youth-oriented. Overall, cultural participation declined steadily
Respondents in their twenties have generally across the four central cohorts. Jazz attendance
reported participation rates in the mid-teens, but peaked at 14 percent among late Baby Boomers and
those above the age of 50 have shown little then fell to 10 percent. For other disciplines, either
inclination to participate. For other activities, the the World War II or early Baby-Boom cohort had
participation-age profile has tended to be curvilinear the highest rate. For five of the seven disciplines
— rising through middle age and then declining as for which we have data since the 1980s, the
respondents reach old age; with some activities overall trend was downward. The classical music
(like art museum attendance) peaking among those attendance rate fell by 0.2 percentage points per year6
in their forties and others (like classical music and while attendance rates for musicals and plays
opera) peaking a bit later. All forms of participation fell by 0.1 percentage points per year among the four
declined sharply after the age of 70. All of these cohorts. The jazz attendance rate rose among the
relationships are “statistically significant,” but for first three cohorts, but then fell among Generation X
none of the benchmark measures did age explain respondents. Only art museum attendance held
more than 1 percent of the variance. Statistical its own across the four cohorts, varying between
significance estimates the likelihood that a 25 and 28 percent of respondents.
relationship found in a sample will also be found in
Audience share by age
the general population from which the sample
is drawn. It is a function of the strength of a Another way to look at the impact of age and cohort
relationship and the size of the sample. In studies on arts participation is to track the composition of
using a large sample — like the SPPAs — one the audience for benchmark activities over time. As
often finds statistically significant results even an earlier report noted, the arts audience, like the
though the relationships are quite weak. population as a whole, has grown older over the past
decade (NEA 2009b).
FIGURE C Much of the shift of audience toward older age
Percent of U.S. adults who attended any benchmark groups resulted from the aging of the population.
event, by age and birth cohort, 1982–2008 If we correct for this factor, then audience-share
60% figures show a less dramatic aging pattern. For
example, the decline in the participation index for
young adults was only from 28 to 25 percent, using
50%
corrected figures, while the increase in the older
middle-age audience was less than one percent
(23.6 to 24.3 percent). The increase in the older-adult
40%
audience remained a substantial 5 percentage points.
Percent of U.S. adults
Overall, audience shares in 2008 more closely
30%
tracked the distribution of the entire population
in 2008 than it had earlier. While the aging of
the arts audience was real, it was less a product of
20%
changes in people’s tastes and behavior, than
of the aging of the overall population. With
10%
a few exceptions — especially jazz and ballet —
changes in audience share by age groups for arts
activities tracked changes in the composition
0% of the population.
9
4
9
9
4
9
4
9
25
4
er
–6
–4
–2
–5
–3
–3
–5
–6
–4
ov
an
25
35
55
30
65
50
45
60
40
d
th
an
ss
70
Le
Age
Before 1935 Late Baby Boom
World War II Generation X
Early Baby Boom After 1975
Source: Author’s calculations from Survey of Public Participation in the Arts,
1982–2008 combined file.
18 National Endowment for the ArtsPATTERNS OF PARTICIPATION
EXECUTIVE SUMMARY
Educational attainment and age: a confounding
relationship
In this section we examine how age and cohort
Age has a statistically significant, but weak influence patterns of participation — that is,
relationship to our summary measures of arts how individuals mix and match different types
participation. However, we can judge the of participation. In particular, we examine
importance of this relationship only in comparison two patterns that have been of interest to Peterson
to other variables that might influence participation. and other researchers. One is “highbrow,” the
tendency of people who are active in one high-status
As virtually all research on participation has
cultural form to be active in one or more other
demonstrated, educational attainment is the
high-status form. The other is “omnivore.” Following
strongest predictor of cultural engagement
Richard A. Peterson, we define omnivores as
(DiMaggio and Ostrower 1992; Peterson et al. 2000).
individuals who are involved in both “highbrow”
Not only is education strongly correlated with
and middle- or lowbrow activities. For example, an
arts participation, but before 2008, it had a strong
omnivore might report they they attended highbrow
relationship with age as well. During the 1980s,
disciplines such as ballet and classical music, as well
individuals with less than a high school diploma and
as lesser-status art forms such as musicals, while
those with a graduate degree were considerably
a highbrow would restrict his or her attendance to
older than those with either a high school degree or
higher-status events like art museums, ballet, and
some college.
classical music.
Multivariate analysis allows us to answer two
Admittedly, these categories are largely subjective.
questions. First, does adjusting for age or cohort
Yet they can shed light on the variance in arts
change our conclusions about the rapid decline
participation rates for “benchmark” arts events
in benchmark participation over time? Second, if
tracked by the SPPA.
we adjust for other factors, how strongly do age
and cohort influence benchmark participation? Approximately twice as many respondents were
classified as omnivores than highbrows. Omnivore
The year-to-year declines in the participation
representation declined from 15 percent in 1982 to
indices were unaffected by adjusting for cohort or
10 percent in 2008. Highbrows represented just over
age. For example, controlling for other variables,
7 percent of all respondents in 1985 and 1992 and
including gender, marital status, educational
then declined to 5.3 percent in 2008.
attainment, ethnicity, and year of survey, attendance
fell by 9 percentage points between 1992 and 2008, The omnivore pattern of cultural participation is
three percentage points more than the uncontrolled associated with distinctive age and cohort features.
figure. The decline in benchmark attendance First, the proportion of cultural omnivores tends
was not the result of changes in the influence of to decline with age. Younger adults are more likely to
age or cohort. be omnivores than older adults. Second, omnivores
are more likely to have been born between 1935
Controlling for other variables, age and cohort
and 1954. The omnivore pattern is most associated
effects — which were already quite weak influences
with the World War II and early Baby-Boom cohorts
— grew a bit weaker. They remain statistically
than with later groups.
significant, but not strong determinants of these
measures of arts participation. Highbrow participation was not as strongly
associated with age. With the exception of an
increase in highbrow participation among older
members of the World War II cohort, the highbrow
rate remained relatively flat within each cohort.
Only those born after 1975 showed a distinctly
lower rate of highbrow participation.
Age and arts participation: A case against demographic destiny 19The impact of omnivore decline on total LITERARY READING
attendance
In this chapter we examine the variables on literary
Omnivores represent the most active segment of reading that have been included in the SPPA
the entire arts audience. They go to more types of arts since 1992. The yes/no questions ask whether the
activities than other groups, and they go to more respondent had read any novels or short stories,
individual events than others. In fact, although the poetry, or plays during the previous 12 months.
omnivores represented only 13 percent of the
Since 1992, the reading rates of Americans have
population, they accounted for 58 percent of all
declined (NEA 2004, 2007). In 1992, 52 percent of
events attended between 1992 and 2008.
SPPA respondents reported reading a novel or short
Between 2002 and 2008, a double blow hit cultural story in the previous year. Ten years later, this
participation. First, the proportion of the population figure had fallen to 45 percent. Although it rose to 47
that we characterize as omnivores — individuals percent in 2008, the percentage was still below that
who attend a variety of different cultural forms for 1992 (NEA 2009b). In contrast, poetry and play
— dropped sharply. At the same time, like the rest of reading both fell from survey to survey. The 2008
the population, the number of events that omnivores rates for these two activities were less than half what
attended fell as well, by more than one event they had been in 1992.
per respondent. Taken together, the decline of
Age and birth cohort have had a relatively minor
omnivores’ share of the population and their drop
influence on reading rates. Educational attainment,
in average events attended represented 82 percent
gender, and ethnicity are stronger predictors of
of the entire decline in attendance at benchmark
reading. In 1992, middle-aged adults were more likely
events between 2002 and 2008.
to report any reading than older adults. The highest
rates were among those in their forties — at around
60 percent — while those in their twenties and
FIGURE D
sixties had rates nearer 50 percent. Rates dropped
Percent of U.S. adults classified as omnivores, by age
across the board in 2002, although the declines
and birth cohort, 1982–2008
among Americans in their fifties were much smaller
20% than for other age groups.
18% The World War II cohort (1935–44) had the lowest
reading rate in all three years, and the early Baby
16%
Boomers had the highest. The late Baby Boomers
14% rate, which fell from 56 percent in 1992 to 49 percent
in 2008, was closer to that of the World War II
Percent of U.S. adults
12% cohort in all three years. This finding is consistent
with age-related data from the SPPA. That data
10%
suggest that as the early Baby Boomers aged, their
8% reading rate tended to rise, while the age group
behind them — populated by the late Baby Boomers
6%
— tended to fall.
4%
2%
0%
9
4
9
9
4
9
4
9
25
4
er
–6
–4
–5
–2
–3
–3
–5
–6
–4
ov
an
25
35
55
30
65
50
45
60
40
d
th
an
ss
70
Le
Age
Before 1935 Late Baby Boom
World War II Generation X
Early Baby Boom After 1975
Source: Author’s calculations from Survey of Public Participation in the Arts,
1982–2008 combined file.
Note: See text and appendix for explanation of classification procedure.
20 National Endowment for the ArtsMEDIA AND PERSONAL PARTICIPATION CONCLUSION AND IMPLICATIONS
EXECUTIVE SUMMARY
In this chapter we turn to two topics to fill in our Given the various dimensions of arts engagement
portrait of participation: consumption of cultural examined in this report, it is striking how consistent
content through media,7 and personal performance the findings are. For each dimension, we discovered
or creation of arts.8 The core conclusions of our that age and cohort have statistically significant, but
analysis are similar to those we have reached extremely modest impacts on levels of participation.
in other aspects of this project. The most important Indeed, when educational attainment and gender are
determinants of participation within survey years taken into consideration, the roles of age and cohort
are educational attainment and gender. While fade even more.
age and cohort in most cases have a statistically
This is not to say there are no patterns related to age
significant effect on participation, the magnitude
and cohort. It appears that, overall, Americans born
of the effect is quite modest. Furthermore, when we
between 1935 and 1954 are more likely to participate
control for other variables, even this apparent
in arts-related activities than those born since 1955.
effect-size is reduced.
The strongest relationship noted in this report tied
Overall, media-based arts engagement and personal these cohorts to the omnivore cultural pattern. The
performace or creation of art have experienced decline of omnivores is a major cause of the decline
the same declines as live attendance since 1992. in overall arts attendance since 1992. Generally,
That year, 58 percent of respondents reported some participation is higher among middle-aged persons
media-based participation and 55 percent some than among very young adults and older Americans.
form of personal participation. The proportion of
The interest with age and cohort has as much to do
respondents reporting media participation fell
with the future as with the past. If age and cohort are
sharply after 1992, from 63 to 41 percent in 2008.
strong predictors of arts participation, it is reasoned,
Personal participation fell from 56 in 1992 to 44
then we may be able to better predict the future of
percent in 2002 and 42 percent in 2008.
cultural audiences by looking at younger cohorts and
Between 1992 and 2008, neither media nor personal examining their preferences. The life-cycle literature
participation exhibited a distinctive relationship with its conception of life trajectory supports this
to age. Media participation was lower among those line of reasoning. If younger adults get into the habit
under the age of 25 and over the age of 70; for other of attending events, it is hoped, they will keep this
age groups, however, it hovered between 58 and habit as they age. Viewed this way, the decline of
54 percent across the three SPPA years. Personal youth interest in a number of activities — not only
participation exhibited a somewhat stronger classical music, but also jazz — may indicate that the
relationship. It was lower among respondents in future of these activities is in jeopardy.
their twenties, rose to about 48 percent among age
This study suggests that such reasoning is wrong on
groups between 40 and 64, and then fell off slightly.
two counts. First, the power of age and cohort are
Age differences explained less than one-half of one
limited for explaining past and current patterns of
percent of the variation in arts participation rates,
participation. Factors that explain a few thousandths
for both media-based and personal participation.
of the variation in participation will hardly define
Cohort, too, had little influence on either media or the future of art in America for either good or ill.
personal participation. The youngest and oldest
cohorts had the lowest rates, while the World War II
and the two Baby-Boom cohorts had the highest
rates. Generation X’s media and personal
participation rates were about five percentage points
below those of the Baby-Boom generations.
Age and arts participation: A case against demographic destiny 21More importantly, this approach underestimates
how broader changes in personal life are influencing
civic and arts participation. The middle of the 20th
century represented the high-point of processes that
standardized the life-course of individuals. After
1970, this uniformity gave way to a new diversity of
personal decision-making. The transition to adult-
hood became more protracted and characterized by
diversity and autonomy. Models for growing old also
varied; workers no longer retired in their early and
mid-sixties, and the “empty nest” life-cycle stage
went from an exceptional to a typical household form
for older adults.
This same pursuit of flexibility and informality has
influenced the art world as well. If we are correct
that the cultural omnivore is in decline, it may be
because the omnivore represented a transitional
stage in our cultural development. After all, the
omnivore concept originated with the surprise that
Peterson and his collaborators experienced in
discovering that the straitjacket of cultural capital,
which they had expected to define musical tastes,
was no longer as tight as it had been (or was
presumed to have been). Cultural participants were
no longer willing to let their social status define
what cultural tastes were acceptable for them.
Although the omnivore — as measured by the SPPA
— may be foundering, this quest for a more
personal, flexible, and protean approach to cultural
engagement appears to be very much alive.
The findings from this study suggest that age and
cohort are not destiny. The ability of established or
emerging arts groups to attract participants will
have less to do with the age distribution of the
population than with their ability to connect to the
creative aspirations of their potential audiences.
22 National Endowment for the ArtsNOTES
EXECUTIVE SUMMARY
5 “The Strange Disappearance of Civic America,” Robert D.
Putnam, The American Prospect 24 (Winter 1996), 44; and
A New Engagement? Political Participation, Civic Life, and
the Changing American Citizen, Cliff Zukin, Scott Keeter,
Molly Andolina, Krista Jenkins, and Michael X. Delli Carpini
(Oxford and New York: Oxford University Press, 2006).
6 Thus, between 2002 and 2008, the proportion of U.S. adults who
attended classical music performances fell by 1.2 percentage
points.
7 This mode of arts participation includes engaging with art
through the Internet or watching or listening to recorded or live
broadcasted arts performances on TV, radio, or on the computer,
including watching or listening on portable media devices such as
an iPod, cell phone, or portable DVD player.
8 This includes personal arts activities such as: working with
pottery, ceramics, jewelry or any leatherwork or metalwork;
weaving, crocheting, quilting, needlepoint, or sewing; making
photographs, movies, or video tapes as an artistic activity;
painting, drawing, sculpture, or printmaking; creative writing
such as stories, poems, or plays; owning original pieces of art;
playing a musical instrument; performing or rehearsing jazz,
classical music, or opera; singing or acting in a musical play;
acting in a non-musical play; singing with a chorale, choir, or glee
club; or dancing ballet or other dance such as modern, folk, tap,
or Broadway-style.
Age and arts participation: A case against demographic destiny 23Knowing someone’s age or
year of birth provides very little
power in explaining his or
her level of arts participation.
24 National Endowment for the ArtsINTRODUCTION
A century ago, many Americans did not know Still, the importance of age emerges in multiple,
exactly how old they were, so they often would sometimes contradictory, ways. Sociologists often
round off their age to the nearest five years. As see people’s lives as a developmental trajectory in
late as 1910, the U.S. Census listed 24 percent more which each generation follows a similar course.
20-year-olds than 19-year-olds — a phenomenon At the same time, we know that history — the impact
demographers refer to as “age-heaping.” By the of external events on behavior — can alter the
middle of the 20th century, age-heaping had virtually trajectory of particular cohorts. For example, the
disappeared. Age-heaping is not simply a technical Great Depression had a profound impact on
data problem; its decline represented a profound the generation that came of age during the 1930s,
change in how Americans thought about their lives an impact that could be observed decades later
and their relationship to the rest of society. Age (Elder 1974). Finally, age has a compositional effect
consciousness has so penetrated our society that on behavior. If a particularly large generation
one’s membership in a particular generation or engages in a particular activity — for example,
birth cohort — a group defined by the years in delaying marriage or having more children — this
which they were born — is now often offered as an tendency can have a disproportionate effect on
explanation of a variety of behaviors — from overall rates.
consumption decisions to political preferences
Age consciousness has had an impact on our
(Katz and Stern 2006).9
understanding of arts participation as well. At
The size of the Baby-Boom generations born in the least since Peterson et al. (1996), trends in arts
20 years after the end of World War II are largely participation have been seen as a function of cohort
responsible for this heightened use of “generation” and age. “Life-course influences,” they write,
as the template for understanding social change. “have a direct and tangible bearing on how often
As Baby Boomers aged, their developmental individuals are able to attend live artistic
challenges became the agenda for the entire society, performances and exhibits, and these effects vary
whether erecting new school buildings in the with age.” Differences in rates of arts participation of
1950s, accommodating labor force entrants in the the Baby Boomers and earlier and later generations
1970s, or preparing for their retirement since the have been of special concern.
1990s (Easterlin 1978). Indeed, other cohorts have
This tendency to interpret changes in cultural
had to scramble to keep up with the Baby Boomers
participation through the lens of age and cohort
by defining their own identities — the “greatest
continued with the early interpretations of the 2008
generation,” Generation X, and the Millennials —
Survey of Public Participation in the Arts (SPPA).
in contrast to Baby Boomers.
The first overview of the data focused on the
aging of the arts audience and the decline in arts
participation among both young and middle-aged
adults (NEA 2009a).
Age and arts participation: A case against demographic destiny 25But the importance of age or cohort is an empirical Age and cohort have a statistically significant
question. We need to ask if demography really relationship to different measures of arts
is destiny. Given the host of other influences on participation. This report suggests, however, that
behavior, should we sustain the argument that those relationships are consistently quite weak.
one’s year of birth defines behavior, even partly? Knowing someone’s age or year of birth provides
Indeed, there is a certain irony in the association of very little power in explaining his or her level of arts
the Baby-Boom generation with the rise in age- participation. In this specific sense, age does not
consciousness. While it is true that the Baby Boomers seem to matter. Other influences — educational
— at a time when they had considerably less weight attainment and gender, in particular — have a much
and more hair — called on themselves to “not trust stronger role in explaining arts participation.
anyone over 30,” it was this very generation that In addition, while the present analysis confirms a
spawned an identity politics, which highlighted the dramatic drop in levels of arts participation over
role of race, ethnicity, gender, social class, and sexual time, age and birth cohort shifts were not the cause
orientation. Given the vast literature that supports of this decline.
the influence of these factors on social behavior,
Given the minor influences that age and cohort have
we may want to retain a healthy skepticism about age
on participation, why has so much attention been
and birth cohort’s influences on social behavior.
paid to them? One answer to this question is the
Those who argue that age and cohort have a strong “white bear” phenomenon in social psychology. This
influence on social behavior are, to some extent, experimental approach to “thought suppression”
swimming against the tide. A review of life-course asks subjects to not think about some trivial image
behavior over the 20th century leads to the (white bears, pink rhinoceros, etc.). Researchers find
conclusion that the call to “act one’s age” has lost that such an instruction generally leads an increase
much of its power. At mid-century, it is true, the in the subject’s attention to that image (Wegner 1989).
timing of life events — such as entering the work
So it is with generation. The template of generational
force, getting married, or having children — became
and age difference, which a century ago barely
more standardized. But at least since the 1970s, that
existed, is now so strong that we apply it to
standardization has given way to a new flexibility
phenomena to which it has little relevance. And
in life events.
yet, as we become more sophisticated in our
So, does age matter to arts participation? The answer understanding of the forces that do influence arts
to that question depends on who is asking it. To participation, we may wish to reassess this
an arts administrator who sees the average age of automatic response and place age and cohort in
her audience increase year after year, it does, their proper, more modest, perspective.
even if what she’s noting is primarily the aging of
This report begins with a review of existing social-
the general population.
science literature on age and cohort. It suggests that
From a sociological point of view, however, the arts participation can be seen from at least two
question can be reframed. We should ask if a perspectives. On the one hand, it might be seen as a
person’s age or year of birth has an influence on consumption decision — deciding to buy a ticket
decisions about arts participation. Specifically, to a performance or exhibition. On the other hand,
does knowing a person’s age or year of birth allow it can be viewed as a form of civic engagement —
one to better predict levels of arts engagement? a way of participating in community life. Both
of these perspectives offer ways of thinking about
how age influences arts participation.
26 National Endowment for the ArtsAfter the literature review, this report then examines CONSUMPTION ACROSS THE LIFE CYCLE
specific forms of arts participation. It begins with
an examination of the benchmark standards of arts Economists have long been interested in the
INTRODUCTION
participation that form the core of the NEA’s Survey influence of age, cohort, and the business cycle on
of Public Participation in the Arts (SPPA). It then consumption. Empirical research has produced
turns to patterns of participation, in particular, general agreement that the life-cycle plays an
using Peterson’s concepts of omnivore and highbrow important role in explaining aggregate trends in
patterns of participation to examine SPPA data. consumption. Consumption rises through one’s
Subsequent sections of the report focus on reading, twenties and thirties, peaks during one’s forties and
media participation, and personal participation then declines steadily as one ages (Attanasio and
in the arts. Browning 1995). (See Figure 1, below.)
Whatever the form of participation, we conclude The economics literature makes two points of value
that age and cohort have two broad influences. The to the present investigation. First, it finds a
shifting size of different generations — especially relatively strong relationship between education and
the large size of the Baby-Boom generation and the consumption. On average, by the time an adult is in
smaller size of Generation X — has had an impact her forties, her annual expenditures will be about
on the composition of arts audiences. At the 25 percent higher than when she was in her early
same time, age and cohort have a weak impact on twenties. However, people with a college education
the likelihood that a respondent will participate are likely to see their consumption peak at nearly 60
in the arts. percent above its starting point, while those with less
education will see their expenditures peak at only
The relationship of age to arts participation is about 10 percent above its starting point. Second,
informed by previous work in economics and economists have generally concluded that age has, at
sociology. For economists, arts participation is best, a modest influence on aggregate consumption.
primarily a consumption decision. For sociologists, It is not irrelevant, but hardly the strongest influence
arts participation is often seen as a form of civic on levels of consumption (Fernandez-Villaverde
engagement. Existing literature on how age and Krueger 2007).
influences consumption and civic engagement
provides a useful starting point for thinking through
FIGURE 1
the relationship between age and arts participation.
Expenditures: Nondurables
$2000
$1800
$1600
1982–84
$1400
$1200
$1000
$800
20 30 40 50 60 70 80 90
Age
Source: Fernandez-Villaverde and Kruger 2007.
Age and arts participation: A case against demographic destiny 27CIVIC PARTICIPATION Putnam believes that a variety of social phenomena
— civic involvement, social trust, voting, and reading
Virtually since Alexis de Tocqueville spotlighted newspapers — are all involved in the generational
the importance of civic engagement to the strength shift. The consistency of this pattern led Putnam to
of our democracy, Americans have used levels conclude:
and intensity of civic involvement as a measure
of our overall social health. For much of that By any standard, these intergenerational
time, a narrative of decline has dominated this differences are extraordinary. Compare, for
conversation. Today’s young people, it has been example, the generation born in the early 1920s
argued over and over again, are not as responsible with the generation of their grandchildren born
and do not care as much as earlier generations. in the late 1960s. Controlling for educational
disparities, members of the generation born in the
In recent years, however, the Tocquevillian question 1920s belong to almost twice as many civic
— how an active civil society makes democracy associations as those born in the late 1960s
work — has gained academic interest. Both in the (roughly 1.9 memberships per capita, compared
United States and abroad, scholars have pointed to to roughly 1.1 memberships per capita). The
the importance of civil society as the foundation of grandparents are more than twice as likely to
prosperous and democratic social life. trust other people (50–60 percent compared with
No scholar is more responsible for this equation of 25 percent for the grandchildren). They vote at
civic health, democratic institutions, and economic nearly double the rate of the most recent cohorts
prosperity than Robert Putnam. In Making (roughly 75 percent compared with 40–45
Democracy Work (Putnam 1993), Putnam argued percent), and they read newspapers almost three
that inter-regional patterns of civic engagement in times as often (70–80 percent read a paper daily
Italy were the best predictor of economic and compared with 25–30 percent). And bear in mind
political development over the past five centuries. that we have found no evidence that the youngest
He then turned to the United States where, generation will come to match their grandparents’
in Bowling Alone (Putnam 2000), he argued higher levels of civic engagement as they grow
that decline was the dominant pattern of civic older (Putnam 1996: 44).
participation, from 4-H clubs to the Kiwanis. Zukin et al. (2006) sought to counter Putnam in their
Putnam concluded that the decline in civic study of civic engagement by widening the forms
engagement was the result of generational shifts — of civic involvement examined. Their study focused
a cohort effect. Using data from the General Social on four cohorts: Dutifuls (people born before
Survey (GSS), Putnam argued that a “long civic the end of World War II); Boomers (born between
generation” including people born before World War 1945 and 1964); GenXers (born between 1965 and
II had propped up participation rates for a long 1976); and DotNets (born after 1976). Based on the
time, but that as it had aged, younger birth cohorts National Civic Engagement Survey 1, conducted in
exhibited progressively lower rates of engagement. 2002, the authors examined four dimensions of
engagement — electoral engagement, political voice,
cognitive engagement, and civic engagement.10
They concluded that more conventional forms of
political involvement rose with age, while civic
engagement — the form most relevant for this study
— was highest among Baby Boomers, with older and
younger groups having somewhat lower rates.
28 National Endowment for the ArtsYou can also read