The Glen Eden Project - Phase 1 Report Compiled by: Sue Berman on behalf of LIFEWISE Family Services.
←
→
Page content transcription
If your browser does not render page correctly, please read the page content below
The Glen Eden Project
Phase 1 Report

Compiled by:

Sue Berman on behalf of LIFEWISE Family Services.

September 2010
Page |2

Nau mai haere mai
Warm Pacific greetings
To all people with a heart, hands and mind for
what’s happening in Glen Eden.

Thank you to all who have contributed to what we have learnt
about Glen Eden.

There is still much to add and we welcome the dialogue.
Page |3

Table of Contents

Summary Overview ................................................................................................................................. 5
The Project Brief ..................................................................................................................................... 6
   Methodology....................................................................................................................................... 7
Glen Eden Community Profile ................................................................................................................. 8
   A brief history...................................................................................................................................... 8
   Glen Eden today .................................................................................................................................. 9
   Demographics ................................................................................................................................... 10
       Population figures ......................................................................................................................... 11
       Social Deprivation Index ............................................................................................................... 11
       Housing ......................................................................................................................................... 12
       Households and families ............................................................................................................... 14
       Age of population.......................................................................................................................... 15
       Ethnicity ........................................................................................................................................ 16
       Usual Residence 5 years ago ......................................................................................................... 17
       Birthplace ...................................................................................................................................... 17
       Religion.......................................................................................................................................... 18
       Labour Force ................................................................................................................................. 18
       Education ...................................................................................................................................... 19
       Health ............................................................................................................................................ 20
       Summary ....................................................................................................................................... 20
Review of Previous Consultations ......................................................................................................... 21
   Waitakere City Council (WCC)........................................................................................................... 21
   Shore/Whariki Massey University Report......................................................................................... 22
   EcoMatters Trust............................................................................................................................... 22
   Titirangi Baptist ................................................................................................................................. 22
   Glen Eden Community House ........................................................................................................... 23
Stakeholder Organisations in Glen Eden .............................................................................................. 24
   Overview ........................................................................................................................................... 24
   Communications ............................................................................................................................... 26
   Summary of stakeholder conversations ........................................................................................... 27
       What makes up Glen Eden? .......................................................................................................... 27
       What are the issues? ..................................................................................................................... 29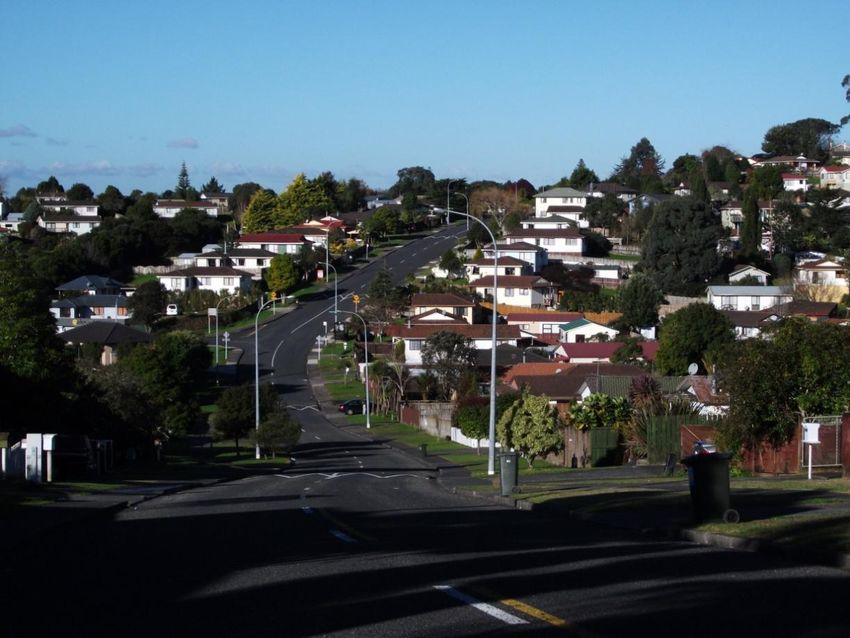
Page |4

        What works? ................................................................................................................................. 31
        Profile of LIFEWISE ........................................................................................................................ 33
        What’s needed? ............................................................................................................................ 34
Use of the Premises .............................................................................................................................. 38
Possible collaborations ......................................................................................................................... 40
Summary ............................................................................................................................................... 42
        What Makes a Fire Burn................................................................................................................ 42
Appendixes............................................................................................................................................ 43
   1       Social Deprivation Index map of Glen Eden .............................................................................. 43
   2.      Demographic table and graphs ................................................................................................. 44
   3.      Wall Chart Presentations – CAUs .............................................................................................. 50
   4.      Glen Eden Concept Plan Map ................................................................................................... 59
   5.      Table of Stakeholder contacts .................................................................................................. 60
   6.      What’s up in Glen Eden............................................................................................................. 63

Table of Figures
Figure 1: Family type by CAU ................................................................................................................ 14
Figure 2: Source of family income - Domestic Purposes Benefit .......................................................... 15
Figure 3: Age distribution – Glen Eden East & Parrs Park CAUs ........................................................... 15
Figure 4: Table of Ethnic Affiliation by CAU (Census 2006) .................................................................. 16
Figure 5: Place of usual residence 5 years ago (2006 Census) .............................................................. 17
Figure 6: Table of religious affiliation by CAU (2006) ........................................................................... 18
Figure 7: Table of number resident benefits by benefit types ............................................................. 19
Figure 8: Helping or voluntary work for an organisation, group or marae........................................... 19
Figure 9: Percentage of resident population with no educational qualification .................................. 20
Figure 10: Residential home ownership and residential tenancy......................................................... 44
Figure 11: Number of children for females 15+yrs ............................................................................... 44
Figure 12: Median household Income .................................................................................................. 45
Figure 13: Total household income by CAU area .................................................................................. 45
Figure 14: Age distribution by CAU and Waitakere City ....................................................................... 46
Figure 15: Age of population in cohort groups – by CAUs (%).............................................................. 47
Figure 16: Place of birth ........................................................................................................................ 47
Figure 17: Type of employment by CAUs.............................................................................................. 48
Figure 18: Level of education qualification ........................................................................................... 48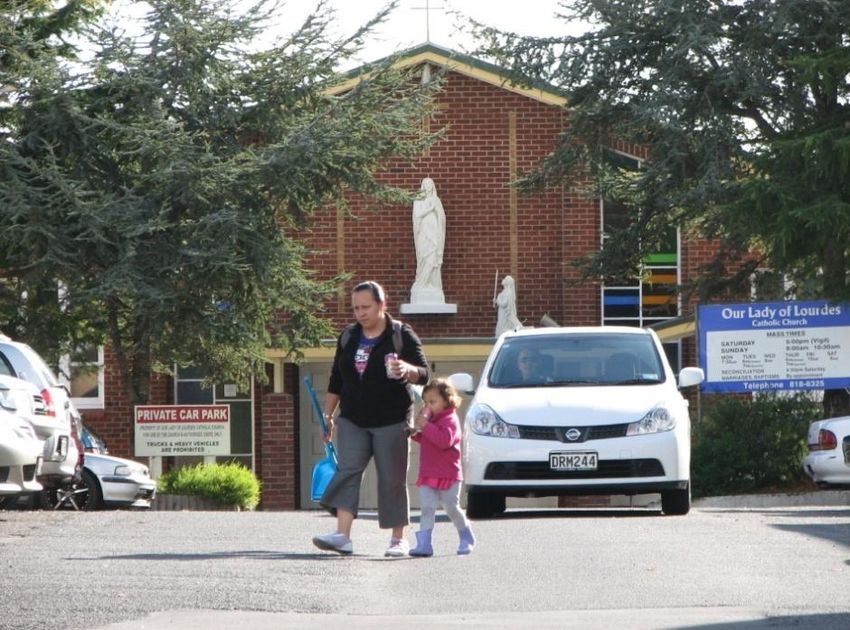
Page |5
Summary Overview
Te Kawarau a Maki, tangata whenua, refer to the area as Waikomiti or Waikumete. Today
this area is most commonly called Glen Eden.
Glen Eden covers a large geographical area. Its population of over 23,000 is diverse in
ethnicity, has disparate incomes levels, and is made up of new and longer term residents.
The social deprivation index map shows pockets of high deprivation amongst a mix of
medium to low deprivation areas.
Glen Eden Township is built on critical transport routes including the railway and West Coast
Road. Essential services in the township centre include Work and Income NZ, the Post Office,
Citizen’s Advice Bureau and the Library, amongst varied small retail outlets. A current Urban
Renewal Plan includes LIFEWISE Family Services premises at 298 West Coast Rd. There is
significant population growth projected for this area.
The general population is younger than average with a large number of young families. This
has created a demand for Early Childhood Education and youth facilities. There are six
primary schools in the area, including a Kura Kaupapa Maori, and Hoani Waititi Marae.
Maori ethnic identity is higher in the Parrs Park and Tangutu areas than the average for
Waitakere. Pacific peoples are the second largest ethnic group after European (except for
Kaurilands) with a third of the population in the Parrs Park area identifying as being from a
Pacific people. There are several Pacific Churches in the area and a preschool Samoan
language nest.
Demographics indicate a growing number of new migrants into the area, especially from
south Asia/India, particularly in the Glen Eden East and Tangutu areas.
The number of rental houses compared to resident home ownership increased between
2001 -2006. An investment in social housing by community and Housing NZ has seen a
critical increase in affordable housing particularly in the Parrs Park area, but more is needed.
Single Parent families make up a third to a quarter of family types in Glen Eden.
Issues related to financial stress, unemployment, child poverty, alcohol abuse, and domestic
violence are present within the Glen Eden community. There are a number of social services
who provide advocacy, legal, budgeting, housing, food, and counselling support in Glen
Eden.
Stakeholder feedback indicates a number of positive interventions and possible
opportunities for neighbourhood connections. Stakeholders identified that Glen Eden is in
need of a linker or community advisor to strengthen cross service and community
networking, and neighbourhood identity.
Stakeholders currently look to LIFEWISE Family Service to provide a networking role in the
Glen Eden area and for ongoing dialogue on the use of 298 West Coast Rd.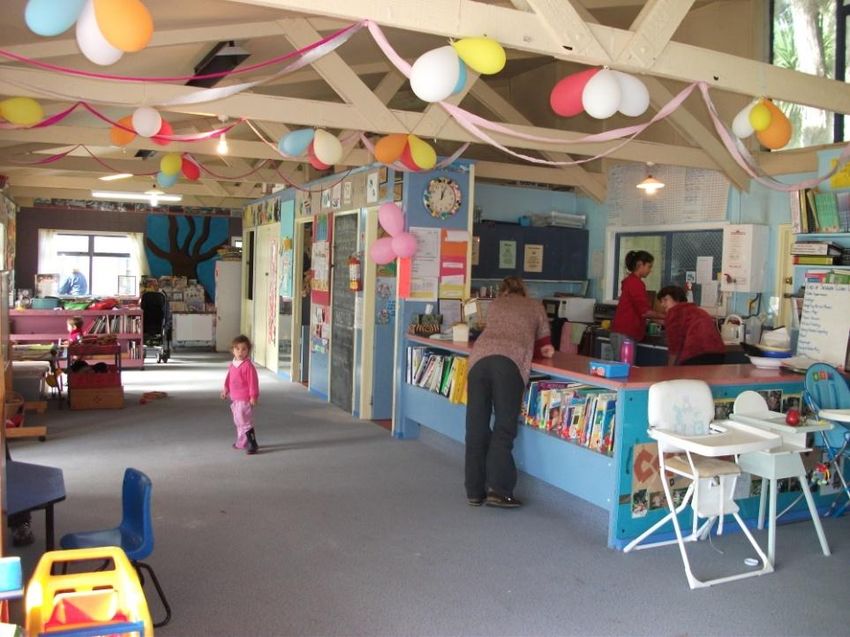
Page |6
The Project Brief
This project is a result of LIFEWISE asking key questions to enable informed decision making for
future planning. The essence of these questions is -
Who is doing what and where in Glen Eden?
What can we learn from knowing our community?
What is the best community use of the premises at 298 West Coast?
As a starting point LIFEWISE has sought to understand the resident demographic of the community
and engage with the community sector through service provider stakeholder conversations in the
physical locality that LIFEWISE currently works (Glen Eden).
Once LIFEWISE is confident of its place in the community and has strengthened its relationships
within Glen Eden, a resident level engagement may be pursued as a next phase.
The key tasks and reporting for this phase of the project is to:
Map and present the social and geographical demographic of Glen Eden.
Describe and create a data base of “who is doing what and where” in Glen Eden.
Explore through stakeholder conversations, what’s working, issues, gaps and visions.
Identify other stakeholders who may be interested in collaborative locality based work.
Describe the potential role/s for LIFEWISE services within this community that will also help
to determine the best use of the premises (298 West Coast Rd).
Welcome to Glen Eden on View Rd Boundary & LIFEWISE premises on West Coast Rd (2010).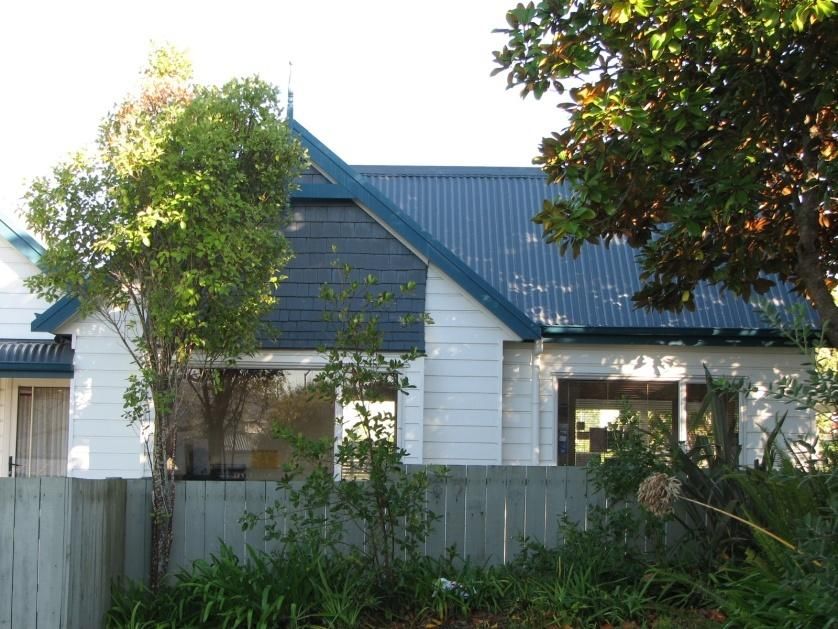
Page |7

Methodology

The development of a project brief was enabled by dedicating time to gain a shared understanding
of the project questions and desired outcomes. Core to this development was a framework for
research with integrity, a fit with community development/research protocols as well as a check on
the constraints of allocated time and resources for the project.

The project journey utilised a variety of research methodologies.

A review of literature included previous reports and research conducted in the Glen Eden
community. The Waitakere City Council’s recent Glen Eden Urban Renewal Project during
March/May 2010 is also part of the review and resulted in LIFEWISE making a submission and meet
face to face with the planning team. An understanding of best practice was helped by the active
collection and distribution of literature and resources related to community led development -
particularly neighbourhood or locality based literature, partnerships and collaboration and
organisational capacity building.

This report is further informed by a community profile based on demographic quantitative analysis
of National Census data selected from 5 local Census Area Units (CAUs). The area of study was
determined by a commonly defined sense of ‘Glen Eden’ to include the CAU’s Glen Eden East,
Kaurilands, Woodglen, Tangutu and Parrs Park.

An informal process of participatory observation through participation in community based events
over the months March –June offers additional insight and information. The taking of photographs
of the environmental and social surroundings in Glen Eden provides a useful visual resource.

In order to gain insight into the question of Who is doing what, where (and how) in Glen Eden?,
interviews and conversations were held with stakeholders. The project focused on relationship
building with stakeholders already engaged with residents in Glen Eden. A data base of contacts,
brochures, flyers, pamphlets and illustrative material has been collected. It was concluded that a
comprehensive or statistically significant resident focused survey was impossible within the time
frame and budget. Slow, purposeful steps of engagement in the community would create better
longer term outcomes if LIFEWISE were to commit to ongoing resourcing for work in the area.1

Notes made during stakeholder conversations were written and returned for checking, including
permission to quote from the conversation both publically and within the report. A stakeholder
feedback meeting invited further input and acted as a gift to the community for sharing what we
have learnt along the journey.

An executive summary feedback report has been written and distributed to stakeholders. This
document gives a brief overview of some of the stakeholder activity within Glen Eden.2

1
    See notes from conversations and discussions with John Raeburn & Project Meeting Notes.
2
    See Appendix 6 ‘What’s up in Glen Eden?’
Page |8

Glen Eden Community Profile

Pou at Glen Eden Library (2010)                                            Illustrated power box, Glenview Rd (2010)

A brief history
The area is described by tangata whenua Te Kawarau a Maki through whakapapa and stories of
tipuna, and through the streams, waterways and landscape. Te Kawarau a Maki describe landscapes
of meaning that stretch out from the West Coast and into the heart of what is now called
Henderson. This area was originally known as Waikomiti or Waikumete.

In the late 19th century with the steady growth of European immigration into the Tamaki Makaurau/
Auckland area, a new cemetery was required. In 1886 West of Auckland was chosen and the
cemetery was named Waikomiti. The early township essentially grew as a service town for
mourners and visitors coming by train to the “city of the dead”. Because the township name
(Waikumete) was similar to that of Waikomiti Cemetery, residents opted for a name change. Glen
Eden was chosen to reflect its valley like landscape and Eden like orchards and gardens.
Subsequently the cemetery took on the name Waikumete. Today the original township bakery still
stands on West Coast Rd as a Jewelers Store.

Glen Eden did not grow significantly until after World War I with further development of the rail line,
and an expansion of orchard and viticulture. Land use was mainly rural until the mid 1950’s when
increased residential development began to occur creating lots of a quarter acre or more. Since that
time Glen Eden’s location between Henderson and New Lynn meant that the Borough continued to
grow and by the 1980’s the present pattern of residential development was established. The town
centre focussed around West Coast Road and Glen Mall continued to expand.

The building that is now the Playhouse Theatre once served as the Borough Council Chambers, the
City Library, and was the original town hall.3

3
 References: Waitakere Library and Information Services Local History and Kaiwhakahaere/ Māori Services; The Glen Eden
Protection Society – Heritage Trail; In those Days by Pauline Vela -drawn from Oral History interviews conducted in the
1980s; Waitakere City Council (2010); Wikipedia.
Page |9

Glen Eden today
This brief overview is drawn from a social planning infrastructure report prepared for Waitakere City
Council as part of the Urban Renewal Plan. It describes Glen Eden today in its broadest terms.

“The Glen Eden area has a wide range of housing including a few original farm houses, some art deco
homes, post war bungalows and the more recent weatherboard styles. It also has new terraced
housing, smaller town houses and older group housing. Levels of Housing New Zealand properties in
the area are lower than the Waitakere City average. A number of the larger sections in the area
have been subdivided in recent times.

Today Glen Eden plays an important role in providing services to residents living in the area between
Henderson and New Lynn. The town centre provides access to a range of retail outlets and food
retailers, a modern library and Citizens Advice Bureau, community centre, health centre and a range
of other social infrastructure.

The area contains Waikumete Cemetery, which is Auckland’s largest cemetery and of significant
heritage value, both as a “social document” and for its significant areas of natural vegetation. It is
also one of the largest single areas of public open space within the urban limits of the City.

Accessibility by public transport in the area is comparatively good, particularly in the central areas of
Glen Eden East and Woodglen. There is expected to be some future improvements to bus
frequencies within the area particularly to and from Henderson and New Lynn. The area is also
served by two train stations on the Western line at Sunnyvale and Glen Eden.

Glen Eden town centre is expected to see significant population increases and there is considered to
be sufficient capacity to provide a higher level of local employment. In order to accommodate the
potential growth, any future redevelopment of the existing Glen Mall and West Coast Road main
street areas, is likely to produce higher density developments which, for example, allow for offices
and/or residential uses on upper floors. Retention of the existing industrial “strip” along the West
Coast Road is expected to provide increased employment opportunities. Areas within walking
distance of the town centre/railway line will become medium density housing or apartments”.4

Glen Eden Rail Station, Glen Mall and new housing development in Woodglen (2010)

4
    Quoted from a report by Andrew Wood (2010) A Demographic Analysis of the Glen Eden Area, Implication for social
           infrastructure provision. Waitakere City Council.
P a g e | 10
Demographics
The project team envisioned that LIFEWISE will be better informed for future decision making by
gaining a comprehensive understanding of the Glen Eden community through studying the social
demographics of the area. This section is the result of an analysis, description and mapping of
geographical and demographic material relevant to the defined area of study.
The physical mapping of the infrastructural data and the supply of raw demographic data was
generously enabled through the support of Andrew Wood (Planner) at Waitakere City Council.
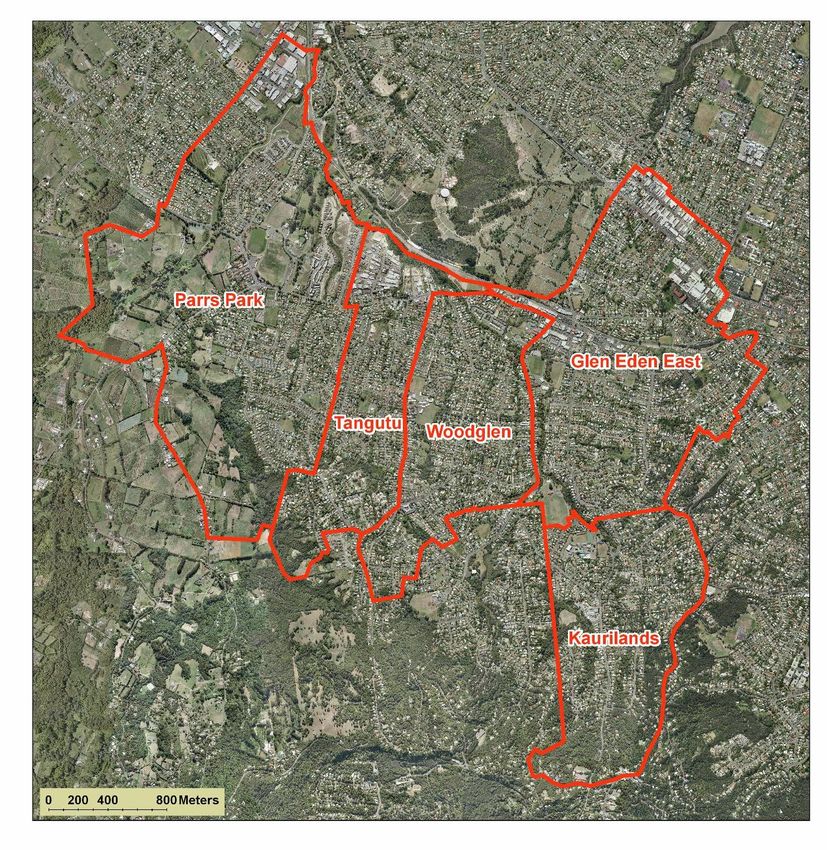
There are five different Census area units between Pleasant Rd in the East and Glengarry Rd in the
West, Titirangi foothill to the South and Great North Rd – Glen Eden East, Kaurilands, Woodglen,
Tangutu and Parrs Park. When asked, people generally saw these areas as defining Glen Eden today.
These five areas are the basis for the demographic analysis.
Glen Eden’s 5 CAU areas. Map supplied by Waitakere City Council (2010).P a g e | 11
Population figures
The total population as reported at 2006 census for the whole Glen Eden area is 23,031.
The total population breaks down as:
Usual Resident
Census Area Unit Population
Glen Eden East 6609
Parrs Park 6198
Woodglen 4206
Kaurilands 3063
Tangutu 2955
Resident Population by CAU (2006)
Glen Eden is projected to be a high growth area. In all areas except Kaurilands significant population
growth has occurred between 2001 and 2006.
“This trend is likely to continue as the Growth Management Strategy for Waitakere City identifies
Glen Eden as a growth node and anticipates that the population for Glen Eden (700m radius from
Glen Eden station) will see increases of up to 75% around 2200 people when compared with the
population at 2006” (Waitakere City Council, 2009).
This projected population growth has significant implications for service demands and delivery in the
area.
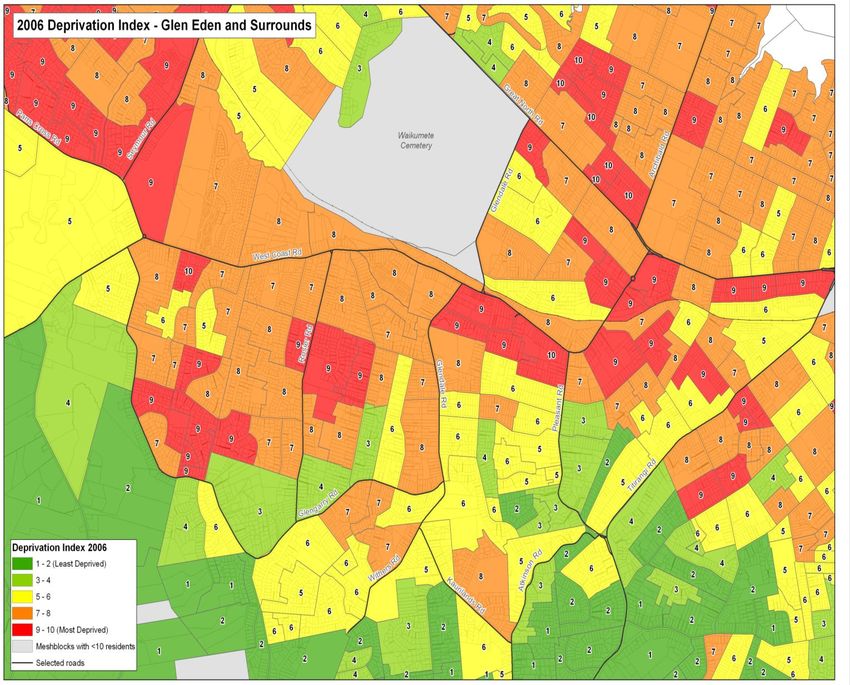
Social Deprivation Index
A Social Deprivation index measures the social deciles rating for an area. It is a useful tool for
viewing the broader dynamic of locality based need as colour coded mesh blocks indicate areas of
high or low social deprivation.
“Social Deprivation Index is a measure of socio-economic status calculated for small
geographic areas rather than individuals. The calculation uses a range of variables from the
2006 Census of Population and Dwellings which represent nine dimensions of social
deprivation. The variables include Income, Employment, Support, Living Space and Home
ownership”.
Waitakere City Council 2010
Taking a view of the social wellbeing indicators as they relate to structural issues such as housing,
employment and income levels is a critical additional aspect to understanding the community
beyond the individual demographics or the single narrative of needs in households. For those
working at a street based engagement this kind of mapping can help to set priority areas.P a g e | 12
The map below reflects an amalgamation of factors drawn from statistics and applied to view in
small mesh blocks as deciles ratings. See full size map Appendix 1.
Supplied by Waitakere City Council, 2010
Housing
As at the 2006 Census, there were 23,031 residents living within the five CAUs and a total of 7785
occupied dwellings, giving an average household size of three people which is equivalent to the
average household occupancy for Waitakere City as a whole.
Home ownership numbers vary across the CAUs. Kaurilands has the highest level of home ownership
(65.5%), with Woodglen (58.1%) and Tangutu (61.9%) areas above the Waitakere City average (58%).
Glen Eden East (53%) and Parrs Park (53.9%) are comparatively below average number of home
ownership. See Appendix 2 Figure 10.
Glen Eden East has seen an increase in non-residentially owned properties between the 2001 and
2006 census years. Property prices have been driven up by a sharp increase in investment property
purchasing and a growing level of mobility into the area. Available rental housing has also increased
through the investment of new social housing built, particularly in the Parrs Park area.
The increase in residential based private rental property has the parallel social consequence of
increased mobility of residents, and a reported rise in issues between tenants and landlords
(breaches to the Tenancy Act), including an increase in substandard housing conditions.
The shortage of affordable housing for families is widely recognised and Housing New Zealand plays
an important part in providing affordable rental homes to families. Four of the five CAUs have lowerP a g e | 13
levels of Housing New Zealand properties as a % of rental properties than the Waitakere City
average (14.6%). In Glen Eden East, Woodglen and Tangutu just over 10% of the rental housing is
owned by the Housing New Zealand. The remaining CAU, Parrs Park is well above the average with
26.7% of rental housing owned by Housing New Zealand.
Smaller family sizes are most common (1-3 children) however Parrs Park (15.6%) and Tangutu (14%)
have above average numbers for females (15+) with more than four children compared to Waitakere
City (12.8%) See Appendix 2 Figure 11.
An overall feature of the area is the comparatively high number of dwellings with three bedrooms or
less and the lower number of larger sized homes that have 4+ bedrooms. Kaurilands is the exception
with more 4+bedroomed homes than average. There is every chance that housing with adequate
facilitates for larger families are unavailable in the areas of need.
In 2006 Glen Eden East had the lowest mean weekly rental at $237. This was $17 a week lower than
Waitakere City. Parrs Park, Woodglen and Tangutu were also below the City average, but Kaurilands
area averaged $21 a week more. These figures have changed considerably in terms of dollar value
over the last 4 years as housing demands have shifted. Current data from Crocker Property Group
drawn from the Real Estate Institute of New Zealand5 show West Auckland (Glen Eden, Glendene &
Massey) as experiencing (on average across house types i.e. no of bedrooms) a 5% variance in rental
between 2009 and May 2010. The average three bedroom rental has increased from $237 in 2006 to
the current rate of $350 a week.
The majority of households heat their accommodation with electricity. To a less extent heating is
also acquired through the use of wood/coal fires and gas bottle heaters. There are more residents in
the Parrs Park (5.8%), Glen Eden East (5.1%) and Tangutu (4%) that use no fuels to heat their
accommodation compared to Waitakere City as a whole (3.9%). This has implications for residents’
health – cold damp homes due to poor maintenance and cheap building materials, coupled with no
method of heating in winter because of low family income, results in poor health outcomes for
families.
New neighbourhood housing developments in the area of Woodglen, Tangutu and Parrs Park are
intensive upstairs downstairs housing. Some social infrastructures such as small park areas have
been built at street ends.
New intensive housing built in Woodglen area (2010). This development is in eye view of 298 West Coast Rd.
5
http://www.crocker.co.nz/services/research/prices.htmlP a g e | 14
Households and families
Compared to Waitakere City (32.3%), the Woodglen area (33.2%) has a higher proportion of couples
without children whilst Kaurilands (50.2%) has a comparatively higher percentage of couples with
children.
Figure 1: Family type by CAU
60.0%
50.0%
40.0%
29.7% 29.4%
30.0% 25.4% 26.2% Couple without children
17.9%
20.0%
Couple with child(ren)
10.0%
0.0% One parent with
child(ren)
There are significantly more single parent households in the Parrs Park (29.7%), Woodglen (29.4%),
Tangutu (26.2%) and Glen Eden East (25.4%) areas than on average across Waitakere City (21.2%).
Between a quarter and close to a third of families in the Parrs Park and Woodglen areas identify as
single parent families.
The median household income for residents aged 15+ years across the CAUs, is lowest in Glen Eden
East. This may be due to the area housing a higher than average senior citizen population. All areas
(bar Kaurilands) have a median household income that is less than the average in Waitakere City
($58,500) (See Appendix 2 Figure 12). Glen Eden East has the highest number of residents earning
less than $20,000 (20%) while in Parrs Park and Woodglen over 10% of households earn less than
$20,000.6 See Appendix 2 Figure 13.
The economic downturn with consequential rising unemployment experienced since the 2006
census is likely to be reflected as a growing disparity in household income in the upcoming 2011
census.
The majority of household income in all CAUs is earned through wages, salaries, self employment,
bonuses and investments. On average about 2% of workers are receiving payments from a Work
Accident Insurer (i.e. ACC).
Parrs Park and Tangutu CAUs have significantly higher percentages of households whose source of
family income is the Domestic Purposes Benefit compared to Waitakere City. Glen Eden East and
Woodglen also have above average numbers. Unemployment, invalid and sickness benefits are also
higher than average in all CAUs except Kaurilands.
6
Total household income is the money that a parent(s) and child(ren) bring into the occupied dwelling.P a g e | 15
Figure 2: Source of family income - Domestic Purposes Benefit
16.0% 14.5%
14.0% 13.0%
12.0% 10.7% 11%
10.0% 8.9%
8.0% 7.1%
6.0%
4.0%
2.0%
0.0%
Glen Eden Parrs Park Woodglen Tangutu Kaurilands Waitakere
East (%) (%) (%) (%) (%) City (%)
NZ Superannuation or Veteran Pension is drawn as earning in Kaurilands by 12% of residents and
10% in Glen Eden East. Other CAU areas have between 6-8% of residents drawing NZ
Superannuation or Veterans Pension.
Age of population
Since the 2001 Census, the median age for the Glen Eden East and Kaurilands CAUs have increased
in line with Waitakere City as a whole, whilst contrary to general demographic trends, the Woodglen
CAU median age has got younger by a year.
Age distribution data is useful for analysing the potential service needs in a community. The graph
Appendix 2 Figure 14 indicates that compared with Waitakere City, Glen Eden’s CAUs house a
younger than average population, particularly in the Parrs Park area. Glen Eden East has a higher
than average older population. The following graph compares Glen Eden East and Parrs Park age
distribution.
Figure 3: Age distribution – Glen Eden East & Parrs Park CAUs
12.0%
10.0%
8.0%
6.0%
4.0%
2.0% Glen Eden East (%)
0.0% Parrs Park (%)
0-4 Years
5-9 Years
45-49 Years
10-14 Years
15-19 Years
20-24 Years
25-29 Years
30-34 Years
35-39 Years
40-44 Years
50-54 Years
55-59 Years
60-64 Years
65 Years and OverP a g e | 16
Collapsed data using cohorts useful for LIFEWISE family services enable a view of the population by
groups such as: preschool (0-4yrs); school aged (5-19yrs); young adults (20-34yrs); adults (35-64yrs)
and older adults (65yrs +). See Appendix 2 Figure 15
Compared to Waitakere City:
Glen Eden East has higher than average older adults and less than average number of
preschool and school aged children.
Parrs Park has a considerably higher preschool and school population, and young adult
group, but below average adult and older adult populations.
Woodglen has a slightly higher than average preschool and school aged population with a
higher than average young adult/adult population.
Tangutu has a young population base with a higher than average primary school age group
and a large adult population but a considerably small senior citizens or older adult group.
Kaurilands has a less than average preschool population but higher than average primary
school population group. The secondary school and young adult population drops below
average numbers, while adults in their 40’s are well above average. The older adult
population drops to below average.
Ethnicity
Glen Eden is increasingly ethnically diverse. New migrant movement into the area, plus natural
population growth is likely to see an increase in this diversity.
Figure 4: Table of Ethnic Affiliation by CAU (Census 2006)
Ethnic Glen Eden Parrs Park Woodglen Tangutu Kaurilands Waitakere
Groups East (%) (%) (%) (%) (%) City (%)
European 59.4% 51.3% 59.8% 59.7% 79.4% 59.0%
Mäori 12.7% 16.2% 13.1% 14.0% 8.0% 13.1%
Pacific
Peoples' 15.6% 27.7% 19.4% 21.5% 5.9% 15.3%
Asian 17.0% 13.9% 12.3% 11.2% 6.8% 16.2%
MELAA and
Other 1.4% 1.6% 2.2% 2.0% 1.2% 1.5%
Total 106.1% 110.7% 106.8% 108.4% 101.3% 105%
The percentage of residents who identify as European in Glen Eden East, Woodglen and Tangutu is
similar to the Waitakere City average (59%). Kaurilands is outside of this trend with a significantly
larger number of residents identifying as European (79.4%) and Parrs Park has a significantly lower
number (51%) of the population identifying as European.
Pacific Peoples’ are the second largest ethnic grouping in the Parrs Park area with nearly 28% of the
population identifying as from one of the Pacific Island groups (well above the 15% average in
Waitakere). Tangutu (21.5%), Woodglen (19.4%) and Glen Eden East (15.6%) also reflect an above
average number of Pacific Peoples’ while Kaurilands has significantly low numbers of Pacific Peoples
(just on 6%).P a g e | 17
Parrs Park CAU (16.2%) has the most residents who identify as Maori, with Tangutu (14%) also
recording above the Waitakere City average for Maori (13.1%). Kaurilands has 8% identifying as
Maori which is the second largest ethnic group in that area after NZ European.
Asian ethnic groups are underrepresented compared to the Waitakere average (16.2%) in all but
Glen Eden East (17%). In Woodglen, Tangutu and Parrs Park on average 12.5% of the CAU identify as
Asian, less than those that identify as Pacific Peoples and/or Maori.
Middle East, Latin American, African (MELAA) plus other groups make up 1.5% of the ethnic
grouping in Waitakere. Woodglen has the highest number of MELAA identifying residents (2.2%),
with Tangutu (2%) and Parrs Park (1.6%) also above average. Glen Eden East and Kaurilands are not
significantly less than the Waitakere City average.
All CAUs (except Kaurilands) reflect a diversity of ethnicity amongst the population groups. This is
especially true in the Parrs Park area.
Usual Residence 5 years ago
High mobility is evident in all CAUs. In the 5 years (between 2001-2006 Census years) residents have
settled in the area by moving from elsewhere in New Zealand or from overseas. Glen Eden East
(12.3%) and Woodglen (11.2%) have the highest percent of overseas residents move into the area,
several percentage points more than Waitakere City (10.8%). Woodglen also has a significant
number of new residents who have moved to the area from elsewhere in New Zealand.
Figure 5: Place of usual residence 5 years ago (2006 Census)
60.0%
50.0%
40.0%
30.0%
Same as Usual Residence
20.0%
Elsewhere in New Zealand
10.0%
Not Born Five Years Ago
0.0%
Overseas
Birthplace
Plus or minus one third of Glen Eden East, Parrs Park, Woodglen and Tangutu residents were born
overseas.
52% of Woodglen resident born overseas arrived in the last 0-9years. That equates to 16.5% of the
Woodglen residents being relativity new migrants (in the last 0-9years in 2006). 51% Glen Eden East
resident born overseas arrived in the last 0-9years. That equates to 18% of the Glen Eden EastP a g e | 18
residents being new migrants (in the last 0-9years in 2006) All areas reflect a mix of old and new
communities. See Appendix 2 Figure 16.
Religion
In Glen Eden East close to 40% of residents identify as not belonging to any religion (higher than
average) while 50% identified as Christian (lower than average). Other religious affiliations include
Buddhist (2.5%), Hindu (4.5%) and Muslim (3.4%) populations. This is a higher than Waitakere
average and the highest of all the CAUs.
Parrs Park residents have the strongest religious identification as Christian (58.5%), 4% above the
Waitakere City average of 54.5%. All other religious affiliations are higher or even with Waitakere
averages except residents who identify with Spiritualism and New Age Religions (1%) which is above
average.
Woodglen and Parrs Park areas have a higher than average number of residents indentifying as
Maori Christian (1.9%). Just over half the Woodglen residents identify as Christian (53.8%).
Tangutu has a high number of residents who are non religious (40.6%) and only just over half who
identified as Christian (51.3%). Hindu and Buddhist affiliations are above average but other religious
affiliations are low.
Kaurilands has the highest number of residents who identify no religious affiliation (46.8%). Less
than half of residents identify as Christian (49.7%). Alternative religious affiliations are more popular
in Kaurilands including Spiritualism and New Age Religions. Hinduism, Buddhism and Islam are all
well below the City wide average.
Figure 6: Table of religious affiliation by CAU (2006)
Glen Eden Parrs Woodglen Tangutu Kaurilands Waitakere
Religion East (%) Park (%) (%) (%) (%) City (%)
No Religion 38.9% 32.5% 37.0% 40.6% 46.8% 37.3%
Buddhist 2.5% 2.1% 1.3% 2.4% 1.1% 2.2%
Christian 50.4% 58.5% 53.8% 51.3% 49.7% 54.5%
Hindu 4.5% 3.8% 3.8% 4.3% 1.9% 3.7%
Islam/Muslim 3.4% 2.6% 3.1% 1.5% 0.9% 2.3%
Mäori Christian 1.3% 1.7% 1.9% 0.9% 0.7% 1.3%
Spiritualism and
New Age Religions 0.9% 0.6% 1.0% 0.7% 0.8% 0.7%
Other Religions 1.2% 0.7% 1.1% 1.0% 0.9% 0.8%
Labour Force
Most residents participate in the paid workforce as employees. Self employment without staff is the
next highest type of work. Not many residents identify as employers, except in Kaurilands which has
a higher percent of employers than the Waitakere average. Unpaid Family Workers’ are represented
in minimal numbers. See Appendix 2 Figure 17.P a g e | 19
Conditions of employment have changed since the 2006 Census. The table below illustrates the
shifts in benefit levels over a 5 year period in the Waitakere Work and Income Service Area. Between
March 2009 and March 2010 the number Waitakere residents registered as unemployed has almost
doubled. These figures do not take into account those families that are reduced to one income or
younger people who do not qualify to register as unemployed. Unemployment levels are projected
to continue to rise.
Figure 7: Table of number resident benefits by benefit types
Benefit type
(aged 18–64 years) Mar-05 Mar-09 Mar-10
Unemployment Benefit recipients 786 735 1267
Domestic Purposes Benefit
recipients 2809 3015 3196
Sickness Benefit recipients 1181 1662 1813
Invalid’s Benefit recipients 1553 1907 1920
Sourced from the MSD website – Waitakere Office statistics
Voluntary work is often unacknowledged or unrecorded. The graph below reflects those who spent
“voluntary time in the last week” as an unpaid activity at Census 2006. The Glen Eden CAUs are
active sites of voluntary activity.
Figure 8: Helping or voluntary work for an organisation, group or Marae
13.6% 13.5%
13.4%
13.2%
13.0%
13.0%
12.7%
12.8%
12.5%
12.6%
12.3%
12.4%
12.2%
12.0%
11.8%
11.6%
Glen Eden East (%) Parrs Park (%) Woodglen (%) Tangutu (%) Kaurilands (%)
Education
Between 14-16% of residents over 15 years of age are either full time or part time students (across
all CAUs). It is predicted that with increased unemployment the number of 15years+ students
staying on at school or adults returning to study will increase. This is in a climate where Adult
Community Education has been reduced due to budget cuts to the sector.
The level of educational attainment is variable from no qualification to school leaving and post
graduate degrees. Kaurilands is considerably different to the other areas of Glen Eden with the least
number of residents with no qualification (16%) and the highest number with a university level
degree including post graduate degrees (21%).P a g e | 20
Other areas have high number of residents with no school leaving qualification – although the
numbers are not significantly more than the Waitakere average (24%). The next highest level of
qualification gained across the CAUs (bar Kaurilands) is NCEA Level One certificate gained at school.
See Appendix 2 Figure 18.
Figure 9: Percentage of resident population with no educational qualification
35.0%
29.5%
30.0% 26.9%
25.8%
24.7% 24.0%
25.0%
20.0%
16.2%
15.0%
10.0%
5.0%
0.0%
Glen Eden Parrs Park (%) Woodglen (%) Tangutu (%) Kaurilands (%) Waitakere (%)
East (%)
Health
Health demographics specific to the Glen Eden population are unavailable, aside from issues relating
to smoking which is captured in Census data. However, Waitemata District Health Board (WDHB) has
produced several documents of interest which reflect Waitakere wide health statistics.7
It is important to state that unequal access to health; socio-economic factors that enable good
health (employment, access to housing, etc) are reflected in the health statistics that show
inequitable outcomes across ethnic groups. Maori and Pacific people are over represented in poor
health outcome data. This issue is explored through literature and demographics in a WDHB report,
An ethnic Inequity Indicator Framework (2009). 8
Public health related initiatives are evident in Glen Eden and are specifically targeting the issues of
healthy diet and exercise. The Ministry of Education curriculum delivers a focus on health and
community safety through schools to young people.
Summary
Based on demographic profiles, Glen Eden CAUs have much in common – with the exception of
Kaurilands. Although the 2006 Census data is a valuable base from which to gain an understanding
of a community profile, it is important to note that recent economic and social changes may create
significant shifts to be captured in the upcoming 2011 Census. A brief summary presentation of each
CAU can be viewed as Appendix 3.
7
Documents available at www.waitematadhb.govt.nz
8
Document available at www.waitematadhb.govt.nz/PlanningConsulting/Inequalitiesindicatorreport.aspxP a g e | 21
Review of Previous Consultations
One of the tasks identified in the project planning was to report relevant outcomes of previous
consultation projects undertaken that relate to Glen Eden9.
Waitakere City Council (WCC)
Urban Renewal Project (2010)
Waitakere City Council opened a brief public consultation process on the framework for Urban
Renewal in Glen Eden around the same time as this project’s beginning10. LIFEWISE took this
opportunity to meet face to face with the Council team. The meeting established a mutual
understanding of the work of each others’ organisations in Glen Eden.
The final Framework Report was presented to Council in May and has been approved and signalled
in the final 10 year planning document created by the Waitakere City Council (with no budgetary
allocation). It is hoped that legislative changes to the structure and management of Auckland City
will not affect the priorities identified to resource the renewal plans.
Key findings of relevance:
The Urban Renewal Plans may have an impact on decision making regarding the premises.
The property lies just inside the renewal area and next door to the proposed public open
space development (see pg 15 summary pg 124 in depth of the Urban Renewal Project)
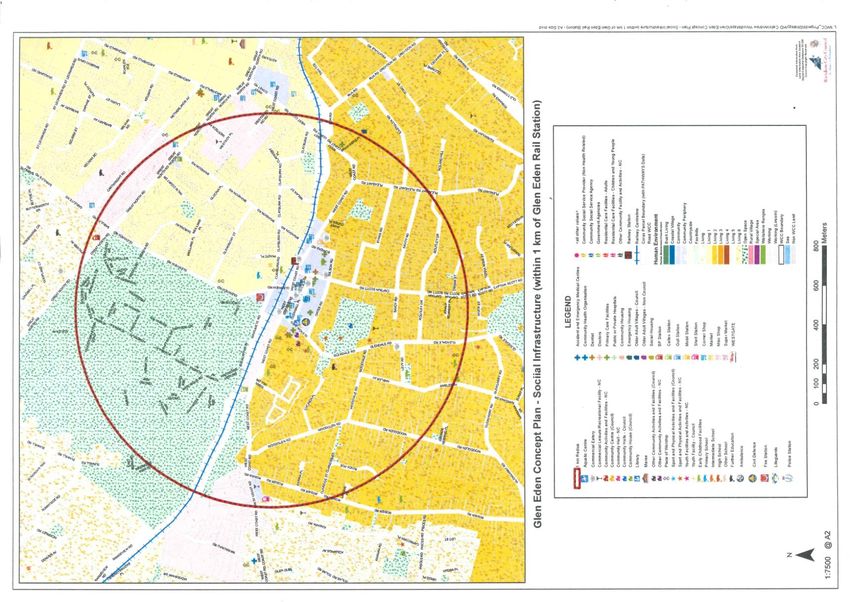
The town centre will become a more populated area for both business and residents. Focus
is particularly put on the 1km radius from the Glen Eden Rail Station. (see Social
Infrastructure map Appendix 4)
Partnerships and collaborations regarding Council access to land suitable for town centre
renewal and LIFEWISE service delivery visions may be open for negotiation.
A demographic analysis of Glen Eden (2010)
This unpublished report authored by Andrew Wood (social infrastructure planner WCC) is a
statistical analysis of 5 CAUs in ‘Glen Eden’. For the purpose of their exercise, WCC defined Glen
Eden CAUs as Glen Eden East, Woodglen, Kaurilands, Crum Park and Sunnyvale. Although our
definition of Glen Eden differed, the basis of the data analysis served as a useful resource on which
to draw a demographic profile for this project.
Kelston and Glendene: People, Places and Potential Communities (WCC 2010)
A needs assessment exercise was carried out in a neighbouring locality of Glendene and Kelston. This
report was a useful reference point to the project both in terms of resource expectations for
resident engagement and in building a community profile.
9
Hard copy and electronic files of these reports are available.
10
Waitakere City Council (October 2009) Glen Eden Urban Design Framework – Final Draft.P a g e | 22
A key outcome of this report is Waitakere City Council’s commitment to the provision of two new
Community houses to be purchased and established in the area. Residents of Glen Eden East,
especially those residents who live north of West Coast Rd, may well benefit from this development.
Shore/Whariki Massey University Report
Project Twin Streams: Sustainable Living, Sustainable Household Programme
Outcome Evaluation Report: Phase One (2009)
This report is an independent evaluation conducted for the Sustainable Living Sustainable Household
Programme. Pilot projects in Glen Eden, Swanson and Ranui were aimed at engaging residents at a
street level in sustainability education and practice – particularly for water, energy, waste and
transport use. EcoMatters Trust delivered the Glen Eden component of the project.
One key conclusion of the study is that employing participatory community development
approaches to engaging residents, helps to build communities at the same time as effecting change
in behaviour. This was most successfully modelled in the Ranui and Swanson area.
EcoMatters Trust
What’s happening in Glen Eden (2010)
This report physically maps the active resident engagement and consultation work being done by
EcoMatters Trust in the Glen Eden area. It describes the current activities and engagements with
residents and reflects on a collaborative project with the Glen Eden Community House (Green
Streets) attempted in 2008/09. It is a useful report for visually seeing clusters of houses engaged in
sustainable practice within targeted streets.
Titirangi Baptist
The Crossing (2009/10)
Titirangi Baptist church conducted a church community consultation and a limited needs assessment
exercise with the community immediately around the church, regarding plans to develop a site on
Kaurilands Rd as a community outreach facility. Documentation of the vision, consultation process,
findings and Q&A are available on the website www.tbc.org.nz
The bullet points below are copied from the Q&A section. Particular mention is made of a
conversation with LIFEWISE.
“What collaboration as been done to make sure our facility and courses are not duplicating what is
already happening?
There is no facility that is like the one we are proposing in the Titirangi area. LifeWise in Glen
Eden have a facility that they operate out of. They are excited at the thought that we are
potentially joining them in this area. There will be some programmes that are similar to what
other providers offer, but the marketplace of needs is far from saturated.
Who are we working with to show collaboration?
So far we have consulted with organisations like Glen Eden Baptist, LifeWise Ministries [sic],
Baptist Union NZ, Parents Inc., Alpha, Kaurilands Primary School, Glen Eden Intermediate,
Konini Primary School. Collaboration is limited at this stage because our facilities and missionP a g e | 23
base is still underdeveloped. We hope for partnerships to develop with these and others in
future.”
The Titirangi Baptist Church community has decided to go forward with this development and intend
to raise money to build this facility in the next three years.
Of key relevance to LIFEWISE is the development of a new facility in the area and the potential
partnership and collaboration that the Titirangi Baptist community may seek from LIFEWISE in
support of this project.
Glen Eden Community House
Info Fest Day May 8th (2010)
“Community Houses are small, locally based, facilities providing recreational and social
opportunities, community education and a place to meet for local residents. The Community
Houses are governed by a voluntary Management Committee, who employ a part-time co-
ordinator to carry out the day-to-day operations and activities of the House.” (Waitakere City
Council Website, June 2010).
Glen Eden Community House states that it is "a place that provides people with opportunities to
interact and participate in and experience a mix of social, educational, cultural or recreational
activities”. The mission statement aims to ensure that the Community House “maintains best
practice, in adult community, out of school care and services that meet the needs of the community
of Glen Eden”.
Services include; Out of school care programmes; Adult and Community Education Programmes;
Room hire; and telephone, fax, photocopying & laminating services.
In May this year, the Community House invited the community to participate and attend an INFO
FEST Day. LIFEWISE took the opportunity to participate, developing resources for encouraging
attending staff to engage in a low impact consultation with residents. Circumstance resulted in a
very low key engagement on the day with very little chance to connect with residents. Some
connection was made with Neighbourhood Support.
The Community House reported a successful event. Face to face visits and conversations, followed
up by email requests to learn more about the success of the event and the learning from the
Wishing Tree exercise conducted with residents have not produced any shared evidence.
The key relevance for LIFEWISE is that the Community House is located within a higher than average
socially deprived area of Glen Eden. Aside from Prospect School, it is the only non faith based
community facility in the area with the potential for resident engagement.P a g e | 24 Stakeholder Organisations in Glen Eden Overview Residents - children, parents, young, old, of all ethnic and religious persuasions and from all socio economic groups; those that live and work in Glen Eden, these are the stakeholders with whom LIFEWISE ultimately wants most to engage. It is their stories of what is happening in the neighbourhoods of Glen Eden, and their participation in creating what and how they would like to see things happening that would see the full potential of community–led engagement in Glen Eden. The investment in relationships and time are the key ingredients for the development of such a vision. The project determined that work towards this vision should begin with an exercise of mapping and then conversing with those already working with and for the community in Glen Eden. This was described in the project plan as a stocktake of stakeholders that, “indicate location, number, purposes of; NGOs, Government organisations, schools, churches, Marae any other service providers or organisations of interest”. In collaboration with the Social Wellbeing and Infrastructure staff at Waitakere City Council, a geographic map of the five CAU areas of Glen Eden was prepared to illustrate the current use of social space (see full sized wall map). Developing a comprehensive list and accurate data base relating to the map is an ongoing task. Although this tool gives some sense of the places and spaces, illustrated by photographs, it is the conversations and meeting of the people that occupy these spaces that give meaning and richness to understanding the stakeholder’s view of ‘What’s happening in Glen Eden”. Identifying stakeholder organisations in Glen Eden took several routes. Initially the team at LIFEWISE Family Services were asked to complete an exercise “Helping Sue find her way” which included a question on who they felt it was most important to talk with in Glen Eden. Further research including spending time within the community, networking with previous work connections, some chance and good fortune, and person to person or agency to agency referrals were the most commonly followed paths to stakeholder doors. At one stage a reflective exercise and discussion helped to affirm and steer priorities for stakeholder conversations.11 Although this report takes into account a range of stakeholder perspectives - individuals and agencies, of varying ethnicities, roles and approaches to work in Glen Eden- a significant gap remains. Input from tangata whenua, particularly the whanau of Hoani Waititi Marae and the Kura Kaupapa has not been successfully brokered. We are aware that there is constant pressure on local Maori organisations to add voice to project planning, and to be available for consultation on issues, ideas and the impact of development on their community. An understanding of the capacity and 11 This took place in the context of a project team meeting where a brainstorm of stakeholders were listed and ordered in priority.
P a g e | 25
process for tangata whenua to engage and the time and resources needed to enable relationships
will require further investment for future work in Glen Eden.
Senior management have focused on gaining understanding and creating stakeholder relationships
with agencies via Government initiatives such as Whanau Ora and The Community Response Model.
Waitakere City Wellbeing Plan and the Call to Actions which flow from the Plan are a strategic
opportunity for contributing to the agenda of family and community wellbeing at a local level. The
Call to Action groups includes Early Childhood Education, Housing, Neighbourhood Action, Violence
Free Waitakere, and Active Waitakere.
The stakeholder engagement has been in no way exhaustive. There are many conversations of
people and places to discover in Glen Eden. Documentation of what has been achieved takes the
following form:
A table of stakeholders which documents the nature of the contact (see Appendix 5).
Meeting notes of conversations that include quotes, photographs and contact details (sent
to participants for checking) filed for reference.
A database of contact addresses details.
A collection of relevant flyers, pamphlets, newsletters and notices.
A summary of Glen Eden today that describes who is doing what in Glen Eden
Inspiring Communities Seminar (2010)
Sign on West Coast Rd, Glen Eden (2010)
Project Twin Streams – Glen Eden Planting (2010)P a g e | 26
Communications
An analysis of the possible routes for communication with residents is an important learning for
future work. Of note are school newsletters, church and association newsletters, and public notice
boards and websites, all of which provide regular access to information for families in the area. Over
and above those communications, Glen Eden residents are supplied with the following publications.
Glen Eden Goss
This publication has had only one issue at the end of 2009. It is compiled by the Glen Eden Business
Association and reports on business and community events in Glen Eden. It has a focus within the 1
km radius of the Rail Station. Goss is also available to be picked up at shops in the Glenmall area.
The Business Association are anticipating Goss will become a more regular publication.
Tatler
Once better known as the Titirangi Tatler, but now simply called The Tatler, this community
newsletter “reaches as far west as Rosier Road and then, more or less, follows a straight line out to
Huia”. 12
“Every letterbox (apart from those with no junk mail on them) within the catchment area east of the
Rosier- Huia line and bordered by the Manukau and Waitemata harbours as far as Portage Road,
New Lynn, should get the Tatler delivered. Our delivery company will also not deliver to commercial
premises so we go to every business (and residential) post office box within these boundaries and put
bulk quantities in all the libraries and other retail and community outlets. In all, 20,000 copies are
distributed across the area”.
Tatler is full of community events, news and people. Although it claims to appeal to a bigger
catchment the focus and tone of the publication is still very much Titirangi based. There is little to no
use of te reo and only the rare inclusion of other languages or cultural stories. It does not represent
the diversity of interests in Glen Eden as much as it does the activity and people of Titirangi.
Western Leader
The Western Leader is delivered three times a week to most homes across Waitakere City and is also
available in libraries and local shops. The Leader features community stories and events across West
Auckland and is also available online via the Stuff website. www.stuff.co.nz
Notice Board at Glen Eden Community and Recreation Centre, Tatler Header, and Signage at Glenora Bears (2010)
12
Communication with editor Rene Bridges, also see, http://www.titirangitatler.co.nz/You can also read