2019 Community Health Needs Assessment - Kaiser Foundation Health Plan of Washington License number: HAC.FS.00000020 Approved by Kaiser Foundation ...
←
→
Page content transcription
If your browser does not render page correctly, please read the page content below
2019 Community Health Needs Assessment
                                  Kaiser Foundation Health Plan of Washington
                                            License number: HAC.FS.00000020
    Approved by Kaiser Foundation Health Plan of Washington Board of Directors
                                                                June 24, 2019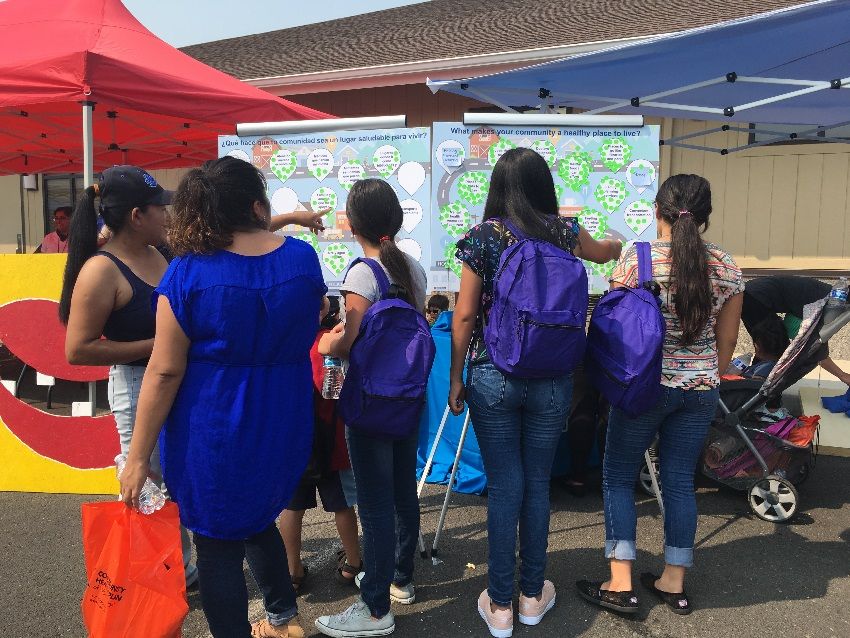
Kaiser Permanente Washington Region Community Benefit
CHNA Report

Contents
 I. Introduction/background ...................................................................................................... 1
    A. About Kaiser Permanente (KP)....................................................................................... 1
    B. About Kaiser Permanente Community Health................................................................. 1
    C. Purpose of the Community Health Needs Assessment (CHNA) Report .......................... 2
    D. Kaiser Permanente’s approach to Community Health Needs Assessment ..................... 2
 II. Community served.............................................................................................................. 3
    A. Kaiser Permanente’s definition of community served ...................................................... 3
    B. Map and description of community served ...................................................................... 4
    i. Map .................................................................................................................................. 4
    ii. Geographic description of the community served ............................................................ 4
    iii. Demographic profile of the community served ................................................................ 5
 III. Who was involved in the assessment? .............................................................................. 5
    A. Identity of hospitals and other partner organizations that collaborated on the assessment
    ........................................................................................................................................... 5
    B. Identity and qualifications of consultants used to conduct the assessment ..................... 5
 IV. Process and methods used to conduct the CHNA ............................................................. 6
    A. Secondary data .............................................................................................................. 6
    i. Sources and dates of secondary data used in the assessment ........................................ 6
    ii. Methodology for collection, interpretation, and analysis of secondary data ...................... 6
    B. Community input............................................................................................................. 6
    i. Description of who was consulted .................................................................................... 6
    ii. Methodology for collection and interpretation .................................................................. 7
    C. Written comments .......................................................................................................... 7
    D. Data limitations and information gaps ............................................................................. 8
 V. Identification and prioritization of the community’s health needs ........................................ 8
    A. Identifying community health needs ................................................................................ 8
    i. Definition of “health need” ................................................................................................ 8
    ii. Criteria and analytical methods used to identify the community health needs.................. 8
    B. Process and criteria used for prioritization of health needs ............................................. 8
    C. Description of prioritized community needs identified through the CHNA ......................10
    D. Community resources potentially available to respond to the identified health needs ....12
 VI. Kaiser Permanente Washington 2016-18 Implementation Strategy evaluation of impact .12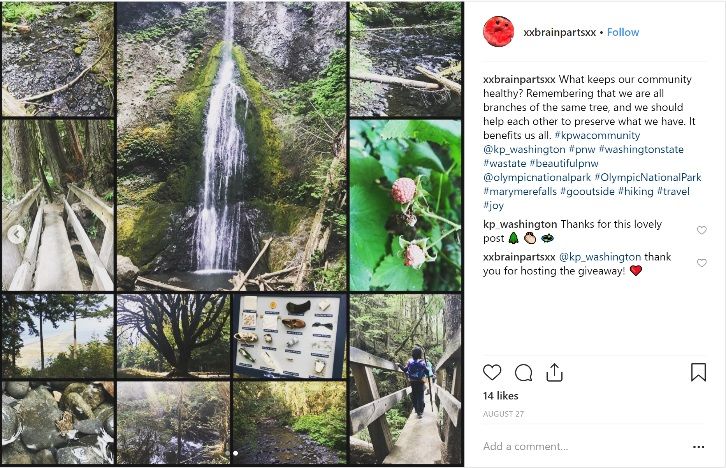
A. Purpose of 2016-18 Implementation Strategy evaluation of impact ...............................12
   B. 2016-18 Implementation Strategy evaluation of impact overview...................................13
   C. 2016-18 Implementation Strategy evaluation of impact by health need .........................16
VII. Appendix .........................................................................................................................19
Appendix A. Secondary data sources and dates ...................................................................20
   i. Secondary sources from the KP CHNA Data Platform ....................................................20
   ii. Additional sources ..........................................................................................................21
Appendix B. Community input tracking form ..........................................................................22
Appendix C. Health Need Profiles .........................................................................................23
Appendix D. Community resources .......................................................................................36
Appendix F. Primary data collection protocols .......................................................................39
Appendix G. Examples of images gathered from community input ........................................41
I. Introduction/background
   A. About Kaiser Permanente (KP)
   Founded in 1942 to serve employees of Kaiser Industries and opened to the public in 1945,
   Kaiser Permanente is recognized as one of America’s leading health care providers and
   nonprofit health plans. We were created to meet the challenge of providing American workers
   with medical care during the Great Depression and World War II, when most people could not
   afford to go to a doctor. Since our beginnings, we have been committed to helping shape the
   future of health care. Among the innovations Kaiser Permanente has brought to U.S. health
   care are:
      •   Prepaid health plans, which spread the cost to make it more affordable
      •   A focus on preventing illness and disease as much as on caring for the sick
      •   An organized, coordinated system that puts as many services as possible under one
          roof—all connected by an electronic medical record
   Kaiser Permanente is an integrated health care delivery system comprised of Kaiser Foundation
   Hospitals (KFH), Kaiser Foundation Health Plan (KFHP), and physicians in the Permanente
   Medical Groups. Today we serve more than 12 million members in nine states and the District
   of Columbia. Our mission is to provide high-quality, affordable health care services and to
   improve the health of our members and the communities we serve.
   Care for members and patients is focused on their Total Health and guided by their personal
   physicians, specialists, and team of caregivers. Our expert and caring medical teams are
   empowered and supported by industry-leading technology advances and tools for health
   promotion, disease prevention, state-of-the-art care delivery, and world-class chronic disease
   management. Kaiser Permanente is dedicated to care innovations, clinical research, health
   education, and the support of community health.
   B. About Kaiser Permanente Community Health
   For more than 70 years, Kaiser Permanente has been dedicated to providing high-quality,
   affordable health care services and to improving the health of our members and the
   communities we serve. We believe good health is a fundamental right shared by all and we
   recognize that good health extends beyond the doctor’s office and the hospital. It begins with
   healthy environments: fresh fruits and vegetables in neighborhood stores, successful schools,
   clean air, accessible parks, and safe playgrounds. Good health for the entire community
   requires equity and social and economic well-being. These are the vital signs of healthy
   communities.
   Better health outcomes begin where health starts, in our communities. Like our approach to
   medicine, our work in the community takes a prevention-focused, evidence-based approach.
   We go beyond traditional corporate philanthropy or grantmaking to pair financial resources with
   medical research, physician expertise, and clinical practices. Our community health strategy
   focuses on three areas:

                                                  1
•   Ensuring health access by providing individuals served at KP or by our safety net
       partners with integrated clinical and social services;
   •   Improving conditions for health and equity by engaging members, communities, and
       Kaiser Permanente’s workforce and assets; and
   •   Advancing the future of community health by innovating with technology and social
       solutions.
For many years, we’ve worked side-by-side with other organizations to address serious public
health issues such as obesity, access to care, and violence. And we’ve conducted Community
Health Needs Assessments to better understand each community’s unique needs and
resources. The CHNA process informs our community investments and helps us develop
strategies aimed at making long-term, sustainable change—and it allows us to deepen the
strong relationships we have with other organizations that are working to improve community
health.
C. Purpose of the Community Health Needs Assessment (CHNA) Report
The Patient Protection and Affordable Care Act (ACA), enacted on March 23, 2010, included
new requirements for nonprofit hospitals in order to maintain their tax-exempt status. The
provision was the subject of final regulations providing guidance on the requirements of section
501(r) of the Internal Revenue Code. Included in the new regulations is a requirement that all
nonprofit hospitals must conduct a community health needs assessment (CHNA) and develop
an implementation strategy (IS) every three years (http://www.gpo.gov/fdsys/pkg/FR-2014-12-
31/pdf/2014-30525.pdf). The required written IS plan is set forth in a separate written document.
Both the CHNA Report and the IS for each Kaiser Foundation Hospital facility and/or region are
available publicly at https://www.kp.org/chna.
D. Kaiser Permanente’s approach to Community Health Needs Assessment
Kaiser Permanente has conducted CHNAs for many years, often as part of long standing
community collaboratives. The new federal CHNA requirements have provided an opportunity to
revisit our needs assessment and strategic planning processes with an eye toward enhanced
compliance and transparency and leveraging emerging technologies. Our intention is to
develop and implement a transparent, rigorous, and whenever possible, collaborative approach
to understanding the needs and assets in our communities. From data collection and analysis
to the identification of prioritized needs and the development of an implementation strategy, the
intent was to develop a rigorous process that would yield meaningful results.
Kaiser Permanente’s innovative approach to CHNAs include the development of a free, web-
based CHNA data platform that is available to the public. The data platform provides access to
a core set of approximately 120 publicly available indicators to understand health through a
framework that includes social and economic factors, health behaviors, physical environment,
clinical care, and health outcomes.

                                                2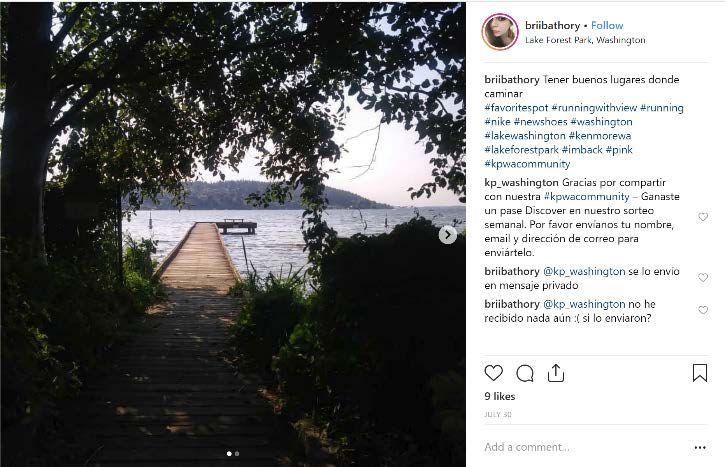
In addition to reviewing the secondary data available through the CHNA data platform, and in
  some cases other local sources, each KFH facility and/or region, individually or with a
  collaborative, collected primary data through key informant interviews, focus groups, and
  surveys. Primary data collection consisted of reaching out to local public health experts,
  community leaders, and residents to identify issues that most impacted the health of the
  community. The CHNA process also included an identification of existing community assets and
  resources to address the health needs.
  Each hospital/collaborative developed a set of criteria to determine what constitutes a health
  need in their community. Once all the community health needs were identified, they were
  prioritized, based on identified criteria. This process resulted in a complete list of prioritized
  community health needs. The process and the outcome of the CHNA are described in this
  report.
  In conjunction with this report, Kaiser Permanente Washington will develop an implementation
  strategy for the priority health needs the hospital will address. These strategies will build on
  Kaiser Permanente’s assets and resources, as well as evidence-based strategies, wherever
  possible. The Implementation Strategy will be filed with the Internal Revenue Service using
  Form 990 Schedule H. Both the CHNA and the Implementation Strategy, once they are
  finalized, will be posted publicly on our website, https://www.kp.org/chna.

II. Community served
  A. Kaiser Permanente’s definition of community served
  Kaiser Permanente defines the community served by a hospital as those individuals residing
  within its hospital service area and in the Kaiser Permanente Washington region, the counties
  where Kaiser Permanente members live. A hospital service area includes all residents in a
  defined geographic area surrounding the hospital and does not exclude low-income or
  underserved populations.

                                                    3
B. Map and description of community served
i. Map
Kaiser Permanente Washington region service areas and locations

ii. Geographic description of the community served
The Kaiser Permanente Washington region includes 19 of the state’s 39 counties in three
service areas:
   •     West service area: Island, King, Kitsap, Lewis, Mason, Pierce, San Juan, Skagit,
         Snohomish, Thurston, and Whatcom counties
   •     Central service area: Benton, Columbia, Franklin, Kittitas, Walla Walla, and Yakima
         counties
   •     East service area: Spokane and Whitman counties
With most counties lying along the I-5 corridor, the West service area is the most urban and
densely populated. The Central and East service areas are more rural, with several population
centers. Major cities are Seattle, Tacoma, Bellevue, Kent, and Everett in the West service area,
Yakima and the Tri-Cities (Kennewick, Pasco, and Richland) in the Central service area, and
Spokane, Spokane Valley, and Pullman in the East service area.
The total population of the KPWA region is 6,103,015, which is 86 percent of the state’s total
population. Around three-quarters of the region’s population is white. The Central service area
has proportionately the largest Hispanic population; it is also the youngest service area. The
East service area has the highest white population and is the oldest, and the West service area
is the most racially diverse.

                                                4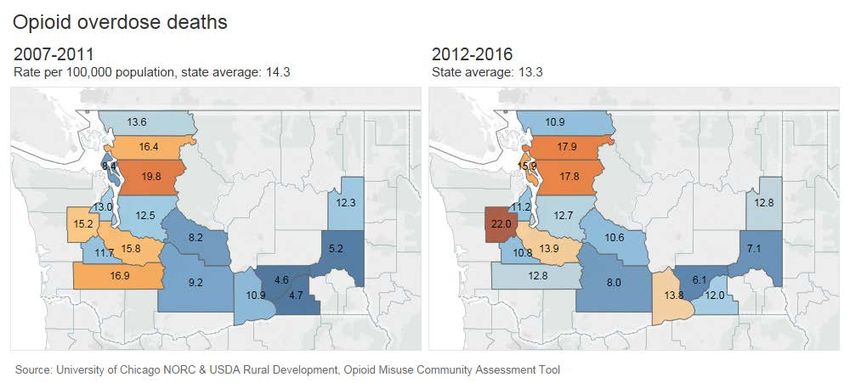
iii. Demographic profile of the community served
   Demographic profile: Kaiser Permanente Washington region
    Race/ethnicity                               Socioeconomic data
    Total Population                 6,103,015   Living in poverty (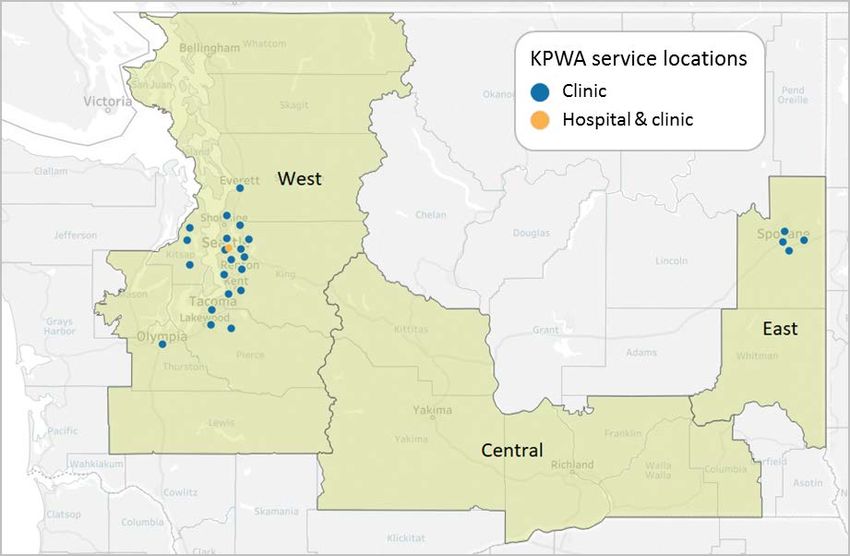
IV. Process and methods used to conduct the CHNA
  A. Secondary data
  i. Sources and dates of secondary data used in the assessment
  Kaiser Permanente Washington used the Kaiser Permanente CHNA Data Platform
  (http://www.chna.org/kp) to review 120 indicators from publicly available data sources.
  KPWA also used additional data sources beyond those included in the CHNA Data Platform.
  For details on specific sources and dates of the data used, please see Appendix A.
  ii. Methodology for collection, interpretation, and analysis of secondary data
  Kaiser Permanente’s CHNA Data Platform is a web-based resource provided to our
  communities as a way to support community health needs assessments and community
  collaboration. This platform includes a focused set of community health indicators that allow
  users to understand what is driving health outcomes in particular neighborhoods. The platform
  provides the capacity to view, map and analyze these indicators as well as understand
  racial/ethnic disparities and compare local indicators with state and national benchmarks. If
  individual KPWA region, service area, or county-level data were not available for any indicator,
  state level values were used.
  As described in section IV.A.i above, KPWA also leveraged additional data sources beyond
  those included in the CHNA Data Platform. These sources included death statistics from the
  Washington State Department of Health (DOH), as well as need profiles in the DOH State
  Health Assessment for 2018. Other sources on Washington state data include the Department
  of Commerce’s Point in Time Count of homeless individuals, Schoolhouse Washington’s profile
  of homeless students, the Washington State Violent Death Reporting System, and the
  Washington Tracking Network for data on climate and health. In addition, CCHE used Public
  Health–Seattle & King County’s Community Health Indicators for insights on geographic and
  racial/ethnic disparities in King County, Washington’s largest county. The federal Health
  Resources & Services Administration was the source for data on health professional shortage
  areas. We also used other national sources to provide perspective on local health needs and
  health indicators, including New York University’s City Health Dashboard, the Princeton
  University Eviction Lab, The Sentencing Project, and the NORC/USDA Opioid Misuse
  Community Assessment Tool.
  B. Community input
  i. Description of who was consulted
  Community input was provided by a broad range of community members using key informant
  interviews, focus groups, and community events. Individuals with the knowledge, information,
  and expertise relevant to the health needs of the community were consulted. These individuals
  included representatives from state, local, tribal, or other regional governmental public health
  departments (or equivalent department or agency) as well as leaders, representatives, or
  members of medically underserved, low-income, and minority populations. Additionally, where
  applicable, other individuals with expertise of local health needs were consulted. For a complete
  list of individuals who provided input, see Appendix B.

                                                  6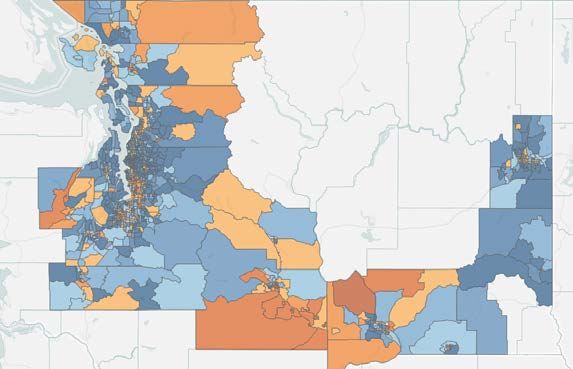
ii. Methodology for collection and interpretation
Key informant interviews: CCHE consulted with key individuals at the local, regional, and state
levels to understand the landscape of health needs in the KPWA service area. This included
stakeholders at public health departments, state agencies, and nonprofit organizations
representing a variety of interests. Conversations with key informants were guided by an
interview protocol (see Appendix F) and interview responses were categorized into themes. The
strength of each theme was characterized by the number of interviews that mentioned the topic.
Community Resource Specialist focus group: CCHE and KPWA convened a virtual focus group
of nine Kaiser Permanente Washington Community Resource Specialists (CRSs). CRSs
located in KPWA primary care clinics across the state support patients to reach their health
goals, in part through connections with community resources. The CRS focus group was guided
by a conversation protocol (see Appendix F) and responses were categorized into themes. The
strength of each theme was characterized by the number of participants that mentioned or
corroborated the issue.
Photo storytelling via Instagram: KPWA conducted a month-long online photo submission
campaign to solicit information on health needs and assets from the general public. Using the
Instagram social media platform, KPWA encouraged individuals to share photos and captions
identifying what makes their community healthy or highlighting a community health need
(https://www.kpwacommunity.org; see Appendix G for examples). Community members tagged
their photos with locations across the state. Photo posts were then categorized into themes and
the strength of each theme was characterized by the number of corresponding posts.
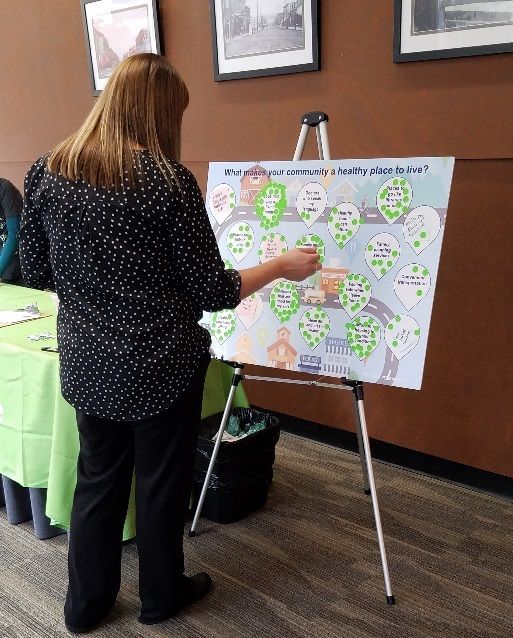
Community events: CCHE and KPWA designed a community engagement activity to garner
resident perspectives at local events where members of the public were welcome. The activity
included two posters (one each in English and Spanish) depicting a variety of health areas (see
Appendix G). Community residents were invited to place up to three sticky dots in each of the
areas they perceived made their community healthy. They were also encouraged to add health
areas they felt were missing. The sticky dots were then tallied within the various health need
areas.
Themes from each primary data collection method was then input into the KPWA health need
prioritization matrix (see Section V.B). Community input influenced this report by elevating the
importance of health need areas such as Economic Security and Mental Health.
C. Written comments
Kaiser Permanente Washington provided the public an opportunity to submit written comments
on the region’s previous CHNA report through communityhealth.wa@kp.org. Going forward, the
email address, CHNA-communications@kp.org will continue to allow for written community
input on the region’s most recently conducted CHNA report. As of the time of this CHNA report
development, KPWA had not received written comments about previous CHNA reports. KPWA
will continue to track any submitted written comments and ensure that relevant submissions will
be considered and addressed by the appropriate staff.

                                                7
D. Data limitations and information gaps
The KP CHNA data platform includes approximately 120 secondary indicators that provide
timely, comprehensive data to identify the broad health needs faced by a community. However,
there are some limitations with regard to these data, as is true with any secondary data. Some
data were only available at a county level, making assessment of health needs at a
neighborhood level challenging. Furthermore, disaggregated data around age, ethnicity, race,
and gender are not available for all data indicators, which limited the ability to examine
disparities of health within the community. Lastly, data are not always collected on a yearly
basis, meaning that some data are several years old, and some indicators may not accurately
measure a health factor or outcome. Also, because most of the state’s population lives in the
West service area, values for indicators are often similar to state averages, making it difficult for
needs to emerge at a service area level.
V. Identification and prioritization of the community’s health needs
A. Identifying community health needs
i. Definition of “health need”
For the purposes of the CHNA, Kaiser Permanente defines a “health need” as a health outcome
and/or the related conditions that contribute to a defined health need. Health needs are
identified by the comprehensive identification, interpretation, and analysis of a robust set of
primary and secondary data.
ii. Criteria and analytical methods used to identify the community health needs
To identify the community’s health needs, CCHE and KPWA Community Health analyzed
secondary data on 120 health indicators and gathered community input. (See Appendix A and
Appendix B for details.) Following data collection, CCHE and Community Health followed the
process below to identify which health needs were significant.
B. Process and criteria used for prioritization of health needs
Required criteria:
Before beginning the prioritization process, KPWA chose a set of criteria to use in prioritizing the
list of health needs. The criteria were:
• Severity of need: This refers to how severe the health need is (such as its potential to
cause death or disability) and its degree of poor performance against the relevant
benchmark.
• Magnitude/scale of the need: The magnitude refers to the number of people affected
by the health need.
• Clear disparities or inequities: This refers to differences in health outcomes by
subgroups. Subgroups may be based on geography, languages, ethnicity, culture,
citizenship status, economic status, sexual orientation, age, gender, or others.
• The community prioritizes the issue over other issues: Community priority refers to
the frequency with which the community expressed concern about certain health
outcomes over others during the CHNA primary data collection.
8Process:
1. Indicators in the CHNA Data Platform were clustered into 13 potential needs, such as
access to care, economic security, and mental health (an indicator could be included in
more than need category). In each of the three KPWA service areas, values for each
indicator were compared with the state benchmark and standardized. Scores were assigned
to each need category based on how many indicators for each need were performing
“worse” than the benchmark, with a minimum score of 1 and maximum of 5.
2. Each service area was assigned a scoring weight, based on population size and number of
KPWA facilities in the area (West: 10, Central: 1, East: 3). The weights were multiplied by
the need category scores to obtain a KPWA region weighted score for each need. These
were ranked—highest to lowest—and clustered and assigned a rating on a scale of 1-4 (4:
very high need, 3: high, 2: medium, 1: lower).
3. For primary data, need scores were determined for each community input method, based on
strengths of themes that emerged (see Section IV.b.ii). These were ranked—highest to
lowest—and clustered and assigned a need rating as above.
94. For each potential need, ratings for the secondary data and each community input method
were entered into a prioritization matrix.
5. To take into account disparities, a value of 1 was assigned for each need if there were clear
racial/ethnic disparities and a value of 1 if there were clear geographic disparities associated
with the need; these were entered in separate columns in the prioritization matrix.
6. Each data source was assigned a weight based on rigor of the method and other
considerations (1-4; least to most rigorous). For each potential need and method, the rating
was multiplied by the weight.
7. Weighted values for each potential need were summed and ranked—highest to lowest—to
determine the priority needs.
8. The prioritized list of health needs was sent to the KPWA Community Health Governance
Council to review and endorse.
C. Description of prioritized community needs identified through the CHNA
1: Economic security. Social and economic conditions are strongly associated with health,
including income, education, food security, and stable housing in good condition. In the KPWA
region there is a critical shortage of affordable rental housing, especially in the Puget Sound
area, and homelessness is on the rise, with more people unsheltered in 2018 than in 2017.
Homelessness among students is at an all-time high—nearly 41,000 statewide (the count
includes those “doubling up” with friends and relatives), and these students are more likely to
miss days of school and fail to graduate on time.
Persistent economic disparities are evident in certain communities and neighborhoods in all
three KPWA service areas, including poverty, low levels of education, and paying a high
percentage of income on housing. People of color in the KPWA region face the greatest
economic challenges, especially blacks, American Indians and Alaska Natives, Hispanics, and
Native Hawaiians and Pacific Islanders. Among those groups, as much as 35 percent of
children live in households with poverty-level incomes—three times the rate of Asians and
whites. Youth service providers in the region expressed a need to improve graduation rates
among nonwhite students, particularly black boys, who are disproportionately incarcerated.
Several key informants mentioned institutional and structural racism as a key factor that affects
the ability of all members of a community to lead a healthy life, describing it as “a catalyst for the
poverty that limits other opportunities related to health.” Federal home lending policies that
restricted mortgage access to people of color are reflected in health outcomes today in cities
like Seattle.
2: Mental health. Mental health affects all areas of life, including a person’s physical well-being,
ability to work and perform well in school, and ability to participate fully in family and community
activities. In Washington state, income and poverty are related to mental health—people with
higher incomes report better mental health and higher levels of social support. Statewide there
is a gap between need for mental health care and resources to meet that need. Except for King,
Pierce, and southwest Snohomish counties, the entire KPWA region has been designated a
Health Professional Shortage Area (HPSA) for mental health by the Health Resources and
10Services Administration, with the Central service area having the lowest per capita number of
mental health providers.
Suicide is the 8th leading cause of death in the KPWA region. Depression and other mental
health issues are leading suicide factors, and over a third of those who commit suicide in
Washington also have issues with unhealthy substance use. Suicide prevention is seen as a
severe need among youth and in tribal communities. Rates of “deaths of despair”—those
related to substance use or suicide—vary throughout the KPWA region and generally are higher
in rural counties. Most communities of color in Washington are more likely to report poor mental
health. In King County, all nonwhite groups report having less social support than whites.
3: Access to care. Access to comprehensive, quality health care services—including having
insurance, local care options, and a usual source of care—is important for ensuring quality of
life for everyone. In the KPWA region, 9.6 percent of the population is uninsured. The
uninsurance rate is highest in the Central service area—14.6 percent (percentages are for a
five-year period that includes years before the ACA was fully implemented). Native American,
Hispanic, Native Hawaiian/Pacific Islander, and black residents are more likely to lack coverage
than whites or Asians. Uninsurance rates are generally low among children, except for Native
American children.
Fears associated with immigration and documentation status are reported as barriers to
accessing health care. A lack of providers of color and of sensitivity in care delivery are also
seen as hindrances to getting connected to health services. All of the KPWA region has been
designated a primary care HPSA, except for the urban areas along the I-5 corridor in King,
Pierce, and Snohomish counties. The Central service area has much fewer primary care
physicians per capita than the West and East service areas. Transportation is another barrier to
access, especially as people seeking affordable housing move further away from services.
4: Healthy eating & active living. The physical environment of a community—such as
availability of affordable, fresh food and safe places to be physically active—affects residents’
ability to exercise, eat a healthy diet, and a maintain a healthy body weight. In the KPWA region,
approximately a quarter of adults are obese; obesity rates are lowest in the West service area
and approaching 30 percent in the Central service area, where rates of physical inactivity are
also high. In general, rural areas in the region, particularly in the Central service area, have
fewer walkable destinations or convenient parks and recreational facilities. People in these
areas also live further away from grocery stores and supermarkets that stock healthy foods.
Some urban neighborhoods lack convenient food access as well, especially where there are
more low-income residents and communities of color.
5: Unhealthy substance use. Substance abuse (including tobacco and alcohol) has a major
impact on individuals, families, and communities. People interviewed with experience in
substance abuse prevention note that alcohol continues to be the number one substance
misused in Washington, including by youth. Rates of excessive drinking are highest in the West
service area.
Opioid misuse is a major concern in the state—in 2016, two-thirds of drug overdose deaths in
Washington involved an opioid. The highest rates of opioid deaths are in Mason, Skagit, and
11Snohomish counties and in some KPWA counties may be associated with high rates of
unemployment, disability, and an economy based on jobs with potential for injury.
While smoking rates are relatively low—cigarette smoking has been steadily declining for over
25 years in Washington—there are increasing concerns about e-cigarette usage among
teenagers, especially boys. Smoking rates are lower than the state average in the West service
area and higher in the East and Central service areas.
6: Climate and health. Climate change and particulate air pollution from burning fossil fuels are
recognized as urgent threats to the health of the planet and its inhabitants. While energy
production is the primary source of particulate pollution, vehicle emissions contribute as well.
Currently around 72 percent of workers in the KPWA region drive alone to work (36 percent
driving alone long distances).
Air pollution levels are comparatively high in the East service area, including agriculture-related
pollution; farmworkers are particularly susceptible to pesticide exposure. One of the
consequences of climate change is longer and more deadly forest fire seasons in eastern and
central Washington, which create unhealthy air quality on both sides of the Cascade mountains.
Wildfires can disproportionately affect people with limited understanding of English who may not
understand evacuation warnings.
D. Community resources potentially available to respond to the identified health needs
The service area for Kaiser Permanente Washington contains community-based organizations,
government departments and agencies, hospital and clinic partners, and other community
members and organizations engaged in addressing many of the health needs identified by this
assessment.
Key resources available to respond to the identified health needs of the community are listed in
Appendix D Community Resources.
VI. Kaiser Permanente Washington 2016-18 Implementation Strategy evaluation of
impact
A. Purpose of 2016-18 Implementation Strategy evaluation of impact
Kaiser Permanente Washington’s 2016-18 Implementation Strategy Report was developed to
identify activities to address health needs identified in the 2016-18 CHNA. This section of the
CHNA Report describes and assesses the impact of these activities. For more information on
KPWA’s Implementation Strategy Report, including the health needs identified in the region’s
2016 service area, the health needs the region chose to address, and the process and criteria
used for developing Implementation Strategies, please visit
https://wa.kaiserpermanente.org/static/pdf/public/about/chna-2016-strategy.pdf. For reference,
the list below includes the 2016-18 CHNA health needs that were prioritized to be addressed by
KPWA in the 2016-18 Implementation Strategy Report.
1. Uninsured and unmet medical needs
2. Depression and mental illness
3. Obesity, physical inactivity, unhealthy diet, high blood pressure, high blood cholesterol
12KPWA has monitored and evaluated progress to date on its 2016-18 Implementation Strategies
for the purpose of tracking the implementation and documenting the impact of those strategies
in addressing selected CHNA health needs. Tracking metrics for each prioritized health need
include the number of grants made, the number of dollars spent, the number of people
reached/served, collaborations and partnerships, and KFH in-kind resources. In addition, KPWA
tracks outcomes, including behavior and health outcomes, as appropriate and where available.
The impacts detailed below are part of a comprehensive measurement strategy for Community
Health. KP’s measurement framework provides a way to 1) represent our collective work, 2)
monitor the health status of our communities and track the impact of our work, and 3) facilitate
shared accountability. We seek to empirically understand two questions 1) how healthy are
Kaiser Permanente communities, and 2) how does Kaiser Permanente contribute to community
health? The Community Health Needs Assessment can help inform our comprehensive
community health strategy and can help highlight areas where a particular focus is needed and
support discussions about strategies aimed at addressing those health needs.
For this CHNA Report, KPWA includes evaluation of impact information on activities from 2017
and 2018. These data help us monitor progress toward improving the health of the communities
we serve. KPWA will continue to monitor impact for strategies implemented in 2019.
B. 2016-18 Implementation Strategy evaluation of impact overview
In the 2016-18 IS process, all KFH hospital facilities and regions planned for and drew on a
broad array of resources and strategies to improve the health of our communities and
vulnerable populations, such as grantmaking, in-kind resources, collaborations and
partnerships, as well as several internal KFH and KPWA programs including, charitable health
coverage programs, future health professional training programs, and research. Based on years
2017 and 2018, an overall summary of these strategies is below, followed by tables highlighting
a subset of activities used to address each prioritized health need.
KFH and KPWA programs: From 2017-2018, KFH and KPWA supported several health care
and coverage, workforce training, and research programs to increase access to appropriate and
effective health care services and address a wide range of specific community health needs,
particularly impacting vulnerable populations. These programs included:
• Medicaid: Medicaid is a federal and state health coverage program for families and
individuals with low incomes and limited financial resources. KFH provided services for
Medicaid beneficiaries, both members and non-members.
• Medical Financial Assistance: The Medical Financial Assistance (MFA) program provides
financial assistance for emergency and medically necessary services, medications, and
supplies to patients with a demonstrated financial need. Eligibility is based on prescribed
levels of income and expenses.
• Workforce Training: Supporting a well-trained, culturally competent, and diverse health care
workforce helps ensure access to high-quality care. This activity is also essential to making
progress in the reduction of health care disparities that persist in most of our communities.
• Research: Deploying a wide range of research methods contributes to building general
knowledge for improving health and health care services, including clinical research, health
care services research, and epidemiological and translational studies on health care that are
13generalizable and broadly shared. Conducting high-quality health research and
disseminating its findings increases awareness of the changing health needs of diverse
communities, addresses health disparities, and improves effective health care delivery and
health outcomes
Grantmaking: For 70 years, Kaiser Permanente has shown its commitment to improving
community health through a variety of grants for charitable and community-based organizations.
Successful grant applicants fit within funding priorities with work that examines social
determinants of health and/or addresses the elimination of health disparities and inequities.
From 2017-2018, KPWA awarded 146 number of grants amounting to a total of $7,807,919.
In-kind resources: In addition to our significant community health investments, Kaiser
Permanente is aware of the significant impact that our organization has on the economic vitality
of our communities as a consequence of our business practices including hiring, purchasing,
building or improving facilities, and environmental stewardship. We will continue to explore
opportunities to align our hiring practices, our purchasing, our building design and services and
our environmental stewardship efforts with the goal of improving the conditions that contribute to
health in our communities. From 2017-2018, KPWA leveraged significant organizational assets,
including:
• KPWA is accelerating our investments to ensure 100 percent of our power statewide comes
from sustainable, carbon free sources by 2020 and to be carbon positive by 2025.
• As a partner in the Puget Sound Energy Green Direct program, KPWA has committed to
expand our portfolio of wind energy to achieve 97 percent renewable energy by 2021 and
100 percent in 2022.
• Ongoing efforts to promote environmental stewardship has:
o Recycled 34.2 tons of plastic from our Pharmacy Fulfillment Center
o Saved 806,322 pages of paper from being printed in 2017
o Built the Puyallup Medical Center as a certified LEED Gold building, the first in the
nation to be certified under the LEED for Healthcare rating system
• Susan Mullaney, KPWA’s President, is a member of Governor Jay Inslee’s Career
Connected Washington Task Force. The goal of this task force is to connect 100,000
Washington youth with career-connected learning opportunities that prepare them for high-
demand, high wage jobs. Under the umbrella of Career Connect WA, a broad group of
stakeholders led by KPWA started meeting in the Spring of 2018 to develop solutions
around:
o Improving the talent pipeline with a deeper and more diverse pool of local talent who
are work-ready and trained with relevant career skills.
o Addressing gaps in education and contributing towards the Governor’s goal of
Washington state students earning a postsecondary credential by age 26 from 31% to
70% by 2030.
o Tackling inequities and opportunity gaps for students of color and students living in
poverty.
o Impacting economic development by providing opportunities for residents to earn a
living wage who will then reinvest their earnings in their local economies.
14• Many KPWA leaders and staff serve on boards of directors of local community organizations
and sit on legislative committees and workgroups, including the Washington State
Telemedicine Collaborative, Washington State Health Insurance Pool, Medicare Evidence
Development & Coverage Advisory Committee, National Vaccine Committee, Washington
Health Alliance Board, and more.
• KPWA is joined by UW Medicine, MultiCare Health System, and Swedish along with SEIU
Healthcare 1199NW, OPEIU Local 8, and UFCW21 to develop a Healthcare Apprenticeship
Program with the State of Washington. Its goal is to strengthen the region’s healthcare
workforce while providing access to living-wage careers for low-income community
members, people of color, and first-generation college students. This apprenticeship
program will launch in 2019 with a Medical Assistant apprenticeship and will subsequently
expand to other identified critical roles. Apprentices will complete 2,000 hours of on-the-job
training at approved training sites which includes KPWA’s Renton laboratory.
Collaborations and partnerships: Kaiser Permanente has a long legacy of sharing its most
valuable resources: its knowledge and talented professionals. By working together with partners
(including nonprofit organizations, government entities, and academic institutions), these
collaborations and partnerships can make a difference in promoting thriving communities that
produce healthier, happier, more productive people. From 2017-2018, KPWA engaged in
several partnerships and collaborations, including:
• Our Educational Theatre Program focused on encouraging conflict resolution, examining the
consequences of bullying, and reducing stigma about depression and anxiety. The program
was offered in collaboration with Seattle Children’s Theatre and has reached more than
35,000 students and their teachers in six counties in the 2017-18 and 2018-19 school years.
• Mental health and wellness in K-12 schools in Washington state was the topic of an
environmental scan we commissioned in 2017 and have shared widely. The report is
helping us engage with communities and organizations on how to respond to the greatest
needs.
• We also collaborated on the Skykomish-Snohomish Rivers Trail development, which
encourages physical activity and connects communities. Facilitated by Forterra, the project
fosters a resilient environment and broad-based economic prosperity. It involves outreach
and engagement with Native American and Latino populations.
• The Little Brook Youth Corps is digging in to help restore open space and grow green-job
and leadership skills. We’re supporting their efforts through the Lake City Neighborhood
Alliance, which represents 26 local groups. This is a fresh approach to engaging a
community through their children and rallying neighbors around long-term restoration of their
surroundings. This area has many immigrant, low income, and traditionally marginalized
residents. We’re also working with other communities to explore how we can support
learning that helps residents seeking living-wage careers. We are partnering with technical
and community colleges, and apprenticeship programs, in these efforts.
• At YouthCare’s Orion Center in Seattle, we provided health care to homeless youth through
our family practice residency.
• We also helped fund a full-time resource at the Washington School-Based Health Alliance to
provide guidance for communities interested in bringing clinics into their schools.
15C. 2016-18 Implementation Strategy evaluation of impact by health need
Kaiser Permanente Washington Priority Health Needs
Need Summary of impact Top 3-5 Examples of most impactful efforts
Need #1: During 2017 and 2018, Reduce barriers to care: KPWA has provided over $1.27 million in grants and
Uninsured KPWA provided 56 sponsorships to organizations working to reduce barriers that impede
and unmet grants and individuals’ ability to seek and obtain health care. Through partnerships with
medical sponsorships, investing Project Access Northwest, YWCA of King-Snohomish Counties, the
needs $9,690,750 to address Washington School Based Health Alliance, and others, we are supporting
uninsured and unmet efforts to co-locate services, bringing health to shelters, schools, and
medical needs. community settings.
We’ve also leveraged Since 2016, we’ve partnered with Seattle Foundation to bring four days of free
our care delivery system healthcare to thousands of un- and underinsured individuals at the Seattle-
by approving 8,179 King County Clinic. Alongside a contribution of $219,869 in 2017 and
applications to our $250,000 in 2018, KPWA has provided lab services, over 200 staff
medical financial volunteers, and follow-up eye care.
assistance program,
amounting to KPWA’s Thriving Schools initiative has increased students’ access to health
$15,982,889 in medical services by investing $1,049,579 in school-based health centers (SBHCs)—
financial assistance eight of which are Teen Health Centers in the Seattle Public Schools, serving
across Washington 2,228 youth in 2017 and 2018—and an additional three centers in Walla
State. Walla, Tacoma, and Bethel school districts. SBHCs are open during the
school year, available to all students, and provide health care and mental
health counseling, regardless of a student’s insurance or ability to pay.
Improving capacity, readiness, and effectiveness of community-based
organizations, community leaders, and residents: In 2017 and 2018, KPWA
provided $7.84 million in capacity support to 31 organizations, recognizing the
key role of organizations like NW Healthcare Response Network, Somali
Health Board, and Lutheran Community Services Northwest in supporting the
safety net.
Bolster efforts in WA to expand and diversify the health care workforce:
KPWA works alongside education and industry partners to support and initiate
scholarship programs in the medical field for under-represented populations.
In 2017, we provided $112,500 for 10 students to receive a Washington State
Opportunity Scholarship and mentoring from KPWA health care professionals.
We also launched a three-year, $736,320 partnership with Seattle Colleges to
provide tuition, mentoring, and wraparound support services for 60 students
to attend the Medical Assisting program at Seattle Vocational Institute.
Leveraging Assets: The Medical Financial Assistance program supports un-
or underinsured patients when their family income is at or below 300% of the
Federal Poverty Guidelines and need help paying for their Kaiser Permanente
medical care. One patient wrote: “I am 7 months pregnant [with] my 3rd
child...single mother, sole provider without child support, bills stacking up...
not sure how I will be able to cover the hospital costs...please consider these
circumstances as you review my application.” Her application was approved,
and she received care at a KPWA clinic. In 2018, we approved more than
8,000 applications.
16Need Summary of impact Top 3-5 Examples of most impactful efforts
Need #2: During 2017 and 2018, KFH Mental health programs in schools: By contributing over $486,000 we
Depression WA provided over $3,1 million helped improve the capacity of community partners such as Center
and mental in support to address Mental for Human Services, Neighborhood House, Communities in Schools,
illness Health in the KFH WA service National Alliance on Mental Illness (NAMI), Educational Service
area. Districts 113 and 114, Renton Area Youth Services, and others to
support youth and their families in addressing mental health.
KFH WA takes a
comprehensive approach to KPWA supported two programs at Forefront ($50,000) to build the
improving mental health in capacity of schools to prevent suicide and provide outreach and
schools and in the community support to individuals who are newly bereaved after a suicide. We
by investing in activities at the also provided $90,000 to Educational Service District 101’s Harm
strategic and system-wide Prevention Model to train staff at 14 school districts to intervene
levels. when students become a threat to themselves or others, as well as
evaluate the project to share learnings with other ESDs in the state.
Additionally, we are maximizing
our organizational resources in Community and healthcare providers education and coordination: To
Washington to address this increase expertise of community providers to address mental health
need by working closely with and prevent suicide we offer a Suicide Prevention online continuing
Behavioral Health Services, medical education course free of charge to all healthcare providers.
Community Resource Over 9,300 healthcare providers completed the training from 2016 to
Specialists, Government 2018, totaling 55,992 credit hours.
Relations and the clinical
leadership and staff at our
Stigma reduction and mental health awareness: Kaiser Permanente
medical centers to support local
and Public Good Projects launched a multimedia campaign to reduce
initiatives to improve mental
stigma in mental health. The campaign expands on KP’s Find Your
health in our communities.
Words awareness campaign promoting conversations about
depression.
Partnerships: With over $2.4 million in grants and sponsorships,
KPWA provided support to organizations focusing on strengthening
upstream social, economic and environmental conditions to prevent
and mitigate adverse childhood experiences through the scaling of
effective peer, “lived-experience” models and increasing mental
health services. Community partners include Crisis Connections, the
Alliance for South Sound Behavioral Health, King County Sexual
Assault Resource Center, ChildStrive, Childhaven, New Beginnings,
Seattle Counseling Service, Yakima Neighborhood Health Services,
TeamChild, Center for Children and Youth Justice, and others.
17Need Summary of impact Top 3-5 Examples of most impactful efforts
Need #3: During 2017 and 2018, KPWA Park Enhancements & Policy: KPWA granted over $2.3 million to
Obesity, provided 25 grants totaling increase safe places to play and exercise. Through partnerships with
physical $2,873,068 to address obesity, the Trust for Public Land, Seattle Parks Foundation, Eastside
inactivity, physical inactivity, unhealthy Greenway Alliance, and several local municipalities KPWA is working
unhealthy diet, high blood pressure, and with community members to improve 13 parks and open spaces in
diet, high high blood cholesterol in the low-income neighborhoods in 5 cities. In 2017, fitness equipment
blood KPWA service area. was added to Georgetown Playfield, serving over 2,000 residents
pressure, and Trust for Public Land’s efforts raised $42 million to support the
high blood We’ve also leveraged our City of Lynnwood parks system, serving 37,000 residents.
cholesterol partnerships with KPWA
Government Relations, Healthy Eating: KPWA granted $378,100 to 12 community-led efforts
Community Engagement, and dedicated to increasing access to healthy eating within the KPWA
Care Delivery to provide service area. Collaborating with FEEST, a youth development
resources and advocate for program, resulted in a student-driven advocacy campaign around
healthy eating and physical water promotion and a new water filling station for 1,700 students at
activity. Seattle’s Chief Sealth High School. In Spokane, KPWA’s partnership
with Second Harvest is expanding the distribution of fresh fruits and
vegetables to ensure over 375,000 nutritious meals across nine
counties, in addition to funding community education and staff
training to encourage consumption of healthy food.
Physical Activity: In 2017 and 2018, KPWA committed $362,068 in
grant funding to support youth, adult and senior fitness programs at
BikeWorks, Cascade Bicycle Club, Sound Generations, and the Get
Moving Initiative, serving over 7,000 community members. With
Sound Generations, KPWA also supported program operations of the
evidence-based Enhance Fitness program in 52 sites and expanded
to 3 new sites in Washington.
Leveraging Assets: Departments across KPWA are contributing
toward Healthy Eating Active Living goals. For example:
• Care Delivery: Participated in the Fresh Bucks Rx Program
providing 51 vouchers to low-income families for fruits and
vegetables at participating farmers markets and
neighborhood grocers in King County.
• Community Engagement: Provided community activities at
Farmer’s Markets in 5 cities within the KPWA service area,
along with Healthy Cooking Classes in Tacoma serving
close to 120 participants in 2017 and 2018.
• Government Relations: Provided 3 Letters of Support for
funding applications dedicated to increasing safe places to
play and exercise.
18VII. Appendix
A. Secondary data sources and dates
i. KP CHNA Data Platform secondary data sources
ii. Other secondary data sources
B. Community Input Tracking Form
C. Health Need Profiles
D. Community resources [Optional if listed in body of report]
E. Leading causes of death
F. Primary data collection protocols
G. Examples of images gathered from community input
19Appendix A. Secondary data sources and dates
i. Secondary sources from the KP CHNA Data Platform
Source Dates
1. American Community Survey 2012-2016
2. American Housing Survey 2011-2013
3. Area Health Resource File 2006-2016
4. Behavioral Risk Factor Surveillance System 2006-2015
5. Bureau of Labor Statistics 2016
6. California Department of Education 2014-2017
7. California EpiCenter 2013-2014
8. California Health Interview Survey 2014-2016
9. Center for Applied Research and Environmental Systems 2012-2015
10. Centers for Medicare and Medicaid Services 2015
11. Climate Impact Lab 2016
12. County Business Patterns 2015
13. County Health Rankings 2012-2014
14. Dartmouth Atlas of Health Care 2012-2014
15. Decennial Census 2010
16. EPA National Air Toxics Assessment 2011
17. EPA Smart Location Database 2011-2013
18. Fatality Analysis Reporting System 2011-2015
19. FBI Uniform Crime Reports 2012-14
20. FCC Fixed Broadband Deployment Data 2016
21. Feeding America 2014
22. FITNESSGRAM® Physical Fitness Testing 2016-2017
23. Food Environment Atlas (USDA) & Map the Meal Gap (Feeding
2014
America)
24. Health Resources and Services Administration 2016
25. Institute for Health Metrics and Evaluation 2014
26. Interactive Atlas of Heart Disease and Stroke 2012-2014
27. Mapping Medicare Disparities Tool 2015
28. National Center for Chronic Disease Prevention and Health Promotion 2013
29. National Center for Education Statistics-Common Core of Data 2015-2016
30. National Center for Education Statistics-EDFacts 2014-2015
31. National Center for HIV/AIDS, Viral Hepatitis, STD, and TB Prevention 2013-2014
32. National Environmental Public Health Tracking Network 2014
33. National Flood Hazard Layer 2011
34. National Land Cover Database 2011 2011
35. National Survey of Children's Health 2016
36. National Vital Statistics System 2004-2015
37. Nielsen Demographic Data (PopFacts) 2014
38. North America Land Data Assimilation System 2006-2013
39. Opportunity Nation 2017
40. Safe Drinking Water Information System 2015
41. State Cancer Profiles 2010-2014
42. US Drought Monitor 2012-2014
43. USDA - Food Access Research Atlas 2014
20You can also read


