SOUTHEAST ASIAN AMERICAN JOURNEYS - A National Snapshot of Our Communities - searac
←
→
Page content transcription
If your browser does not render page correctly, please read the page content below

SOUTHEAST
 ASIAN
 AMERICAN
 JOURNEYS

A National Snapshot of Our Communities   2020
The Southeast Asia Resource Action Center (SEARAC) is a national civil
                   rights organization that empowers Cambodian, Laotian, and Vietnamese
                   American communities to create a socially just and equitable society. As
                   representatives of the largest refugee community ever resettled in the
                   United States, SEARAC stands together with other refugee communities,
                   communities of color, and social justice movements in pursuit of social
                   equity. Visit www.searac.org.

                   Founded in 1983 as the Asian Pacific American Legal Center, Asian
                   Americans Advancing Justice – Los Angeles (Advancing Justice – LA) is
                   the nation’s largest legal and civil rights organization for Asian Americans
                   as well as Native Hawaiians and Pacific Islanders (NHPI). Through direct
                   services, impact litigation, policy advocacy, leadership development, and
                   capacity building, Advancing Justice – LA focuses on the most vulnerable
                   members of Asian American and NHPI communities while also building a
                   strong voice for civil rights and social justice. Visit advancingjustice-la.org.

                   Our affiliates include Advancing Justice – AAJC (Washington, DC),
                   Advancing Justice – Atlanta, Advancing Justice – Asian Law Caucus
                   (San Francisco), and Advancing Justice – Chicago.

Please email any questions regarding the report to askdemographics@advancingjustice-la.org or searac@searac.org.

Photographs were taken by Berta Romero, Stephen Bobb Photography, and SEARAC, and contributed by many
community members (see acknowledgments). Cover design and layout were provided by Christina Vang.

SOUTHEAST ASIAN AMERICAN JOURNEYS                                           A NATIONAL SNAPSHOT OF OUR COMMUNITIES /   2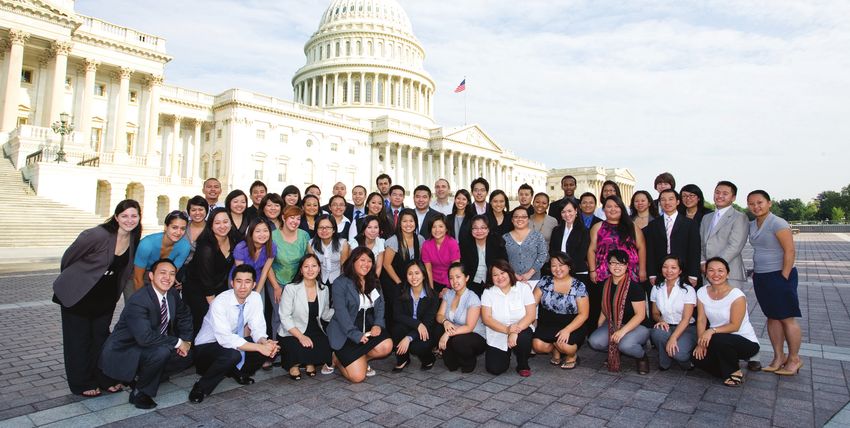
CONTENTS
                                    Introduction                                               4

                                    Executive Summary                                         10

                                    National Demographics                                     12

                                      Refugee Resettlement & Immigration                      13
                                      Education                                               23
                                      Health                                                  25
                                      Economic Justice & Housing                              27
                                      Civic Engagement                                        30

                                    California                                                31

                                    Massachusetts                                             44

                                    Minnesota                                                 55

                                    Texas			                                                  65

                                    Washington			                                             74

                                    Policy Recommendations                                    84

                                    Glossary                                                  88

                                    Notes                                                     89

                                    Appendix A: Population, Population Growth                 91

                                    Appendix B: Selected Population Characteristics           92

SOUTHEAST ASIAN AMERICAN JOURNEYS                  A NATIONAL SNAPSHOT OF OUR COMMUNITIES /    3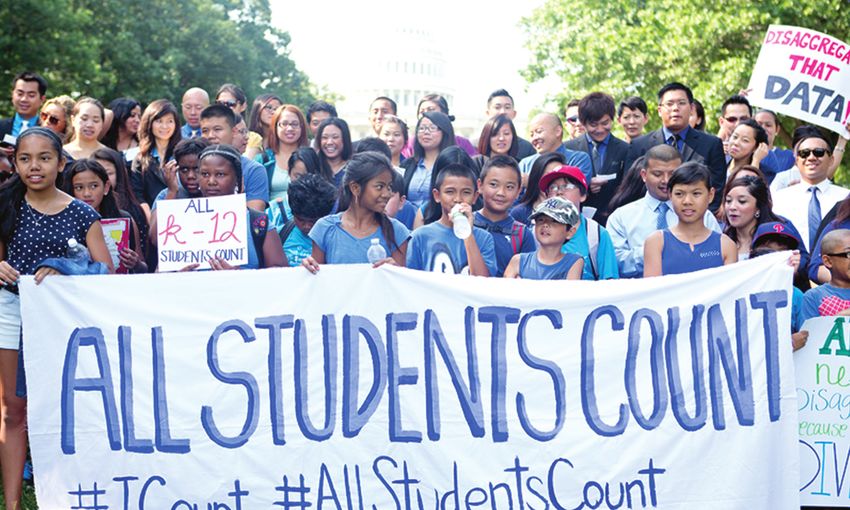
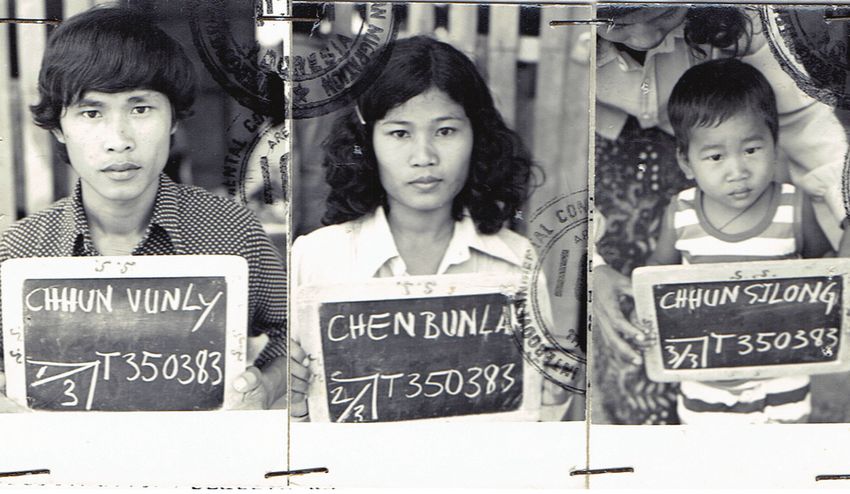
INTRODUCTION
SOUTHEAST ASIAN AMERICANS comprise one of the newest communities to be added to the American narrative,
and one of the newest communities to be added to the Asian American experience. While Chinese Americans can
date their ancestry back to the early 1800s, the story of mass migration of Southeast Asians to the United States
started in the 1970s in the aftermath of the U.S. occupation of Southeast Asia during the ruthless Khmer Rouge
genocide, bombings in Laos, and Vietnam War. Together these wars claimed millions of lives between 1955 and
1975, including innocent men, women, and children. Among those harmed were the 2 million victims of the
Khmer Rouge genocide, and the tens of thousands of people who were victims of the mass bombing of Laos—the
most heavily bombed country per capita in world history. Millions more were affected by Agent Orange, a herbicide
deployed in Southeast Asia that is now linked to certain cancers.

The relationship between the U.S. and the people of Cambodia, Laos, and Vietnam began decades before Southeast
Asians arrived in America, as the U.S. government had been heavily involved in these countries to combat the
spread of communism. Many Southeast Asians worked alongside the U.S. in these efforts to fight for democracy
within their own countries. For example, Vietnamese refugees worked with the U.S. government during the
Vietnam War as translators and civil servants; Khmer refugees assisted the U.S. military during its occupation
of Cambodia; and the U.S. Central Intelligence Agency recruited and trained Lao and Hmong soldiers to serve as
guerrilla fighters in the Secret War in Laos. When the U.S. withdrew and these countries fell to communist powers,

SOUTHEAST ASIAN AMERICAN JOURNEYS                                          A NATIONAL SNAPSHOT OF OUR COMMUNITIES /   4
the U.S. failed to implement promised contingency plans to protect those who had aided the U.S., leaving hundreds
of thousands of people to fend for themselves as targets of political persecution. Even after the wars ended,
violence and fear of persecution forced refugees to make treacherous escapes across borders and out onto the
open sea to refugee camps, where they awaited resettlement. This eventually led to the largest mass resettlement
of refugees in America’s history—over 1.1 million in a span of three decades.

THE EN MASSE RESETTLEMENT of Southeast Asian refugees started in 1975. Due to the lack of a unified national
system of refugee resettlement at the time, Southeast Asians were resettled ad hoc and scattered across isolated
areas in the U.S., where voluntary organizations—many sectarian ones—assisted the State Department with
refugee resettlement. The U.S. volunteer organizations charged with resettling refugees were not provided clear
instructions or expectations on how to assist Southeast Asian refugees, aside from greeting them upon arrival,
matching them with sponsors, and in some cases, providing one-time cash assistance. Without an understanding
of the unique needs and circumstances that these refugees had endured as a result of trauma from the war and its
aftermath, they were treated as voluntary migrants who were expected to achieve economic self-sufficiency and
independence very quickly.

To respond to these crises, founders of the Southeast Asia Resource Action Center (SEARAC) advocated for the
passage of the Refugee Resettlement Act of 1980 to increase refugee admissions from Southeast Asia; establish
the Office of Refugee Resettlement, the country’s first national resettlement infrastructure; and create “mutual
assistance associations,” or “MAAs.” MAAs were created to respond to the lack of understanding by many
mainstream organizations of the needs of refugees. These organizations—led by communities who came from

SOUTHEAST ASIAN AMERICAN JOURNEYS                                          A NATIONAL SNAPSHOT OF OUR COMMUNITIES /   5
these experiences—were provided federal funding to meet the cultural and language needs of their
own refugee community. However, many challenges persisted as refugees were met with not just
hostility and racism but also extreme blight. This left many refugees without long-term support in
poverty-stricken neighborhoods plagued by gang violence, racial tension, and failing schools.
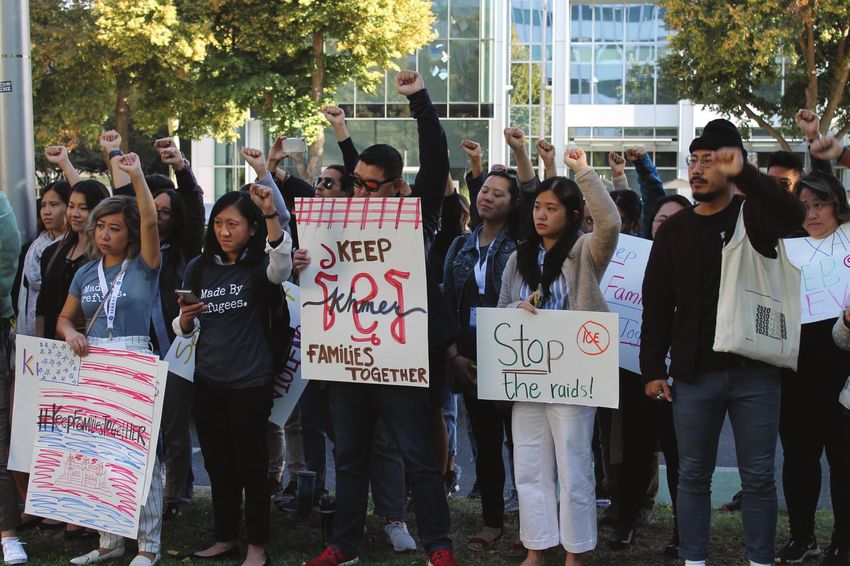
Growing from these traumatic experiences,
Southeast Asian Americans (SEAA) today comprise
“Initially because the war in one of the quickest-growing communities within
Vietnam was not popular in the the larger Asian American community. SEAA
are a vibrant, diverse, and growing community
U.S., when refugees came from
of refugees, the children of refugees, people
Vietnam, Cambodia, and Laos, sponsored by refugee families, and more recently
they were met with hostility. arrived immigrants who have come to the U.S. on
They were not welcome at all. family-based and employment visas. Yet, even
decades after initial resettlement, institutional
That was a big challenge for my
inequities still impact SEAA communities as
work at SEARAC—how to communities that have been sorely abandoned,
convince the public opinion. ignored, or misunderstood.
Our major job was public Sadly, the American narrative has quickly excluded
education and advocacy to the refugee legacy that created these unique
work with Congress and media challenges for SEAA. Instead of the U.S. upholding
American responsibility for the world’s largest
to educate them about the
refugee crisis created by American political
issues, and why the U.S. should forces, the SEAA community has instead been
receive us as former allies of the replaced, overlooked, and masked behind the
U.S. We fought together.” broader Asian American “model minority” myth
that all Asian Americans are thriving compared
DR. LE XUAN KHOA to other communities of color. As a result of this
SEARAC’s second executive director stereotype, tremendous socioeconomic challenges
that affect the SEAA community remain hidden.
This stereotype is also reinforced by data policies that lump, or aggregate, all SEAA under the broader
Asian American race category. Disaggregated data that allow us to see how specific ethnic groups
are doing within the larger Asian American umbrella are critical to revealing barriers and uplifting
necessary solutions to improve socioeconomic outcomes for this community.
The last three years under the Trump administration have resulted in some of the most blatant
and hateful attacks on immigrant and refugee families across the country. These include escalated
detention and deportation of community members who long ago served their sentences; limiting
the ability of low-income families to access critical government services to feed and nourish their
children; threatening health insurance coverage and health access to vulnerable community members;
undermining education programs and services that promote equitable outcomes, college access, and
SOUTHEAST ASIAN AMERICAN JOURNEYS A NATIONAL SNAPSHOT OF OUR COMMUNITIES / 6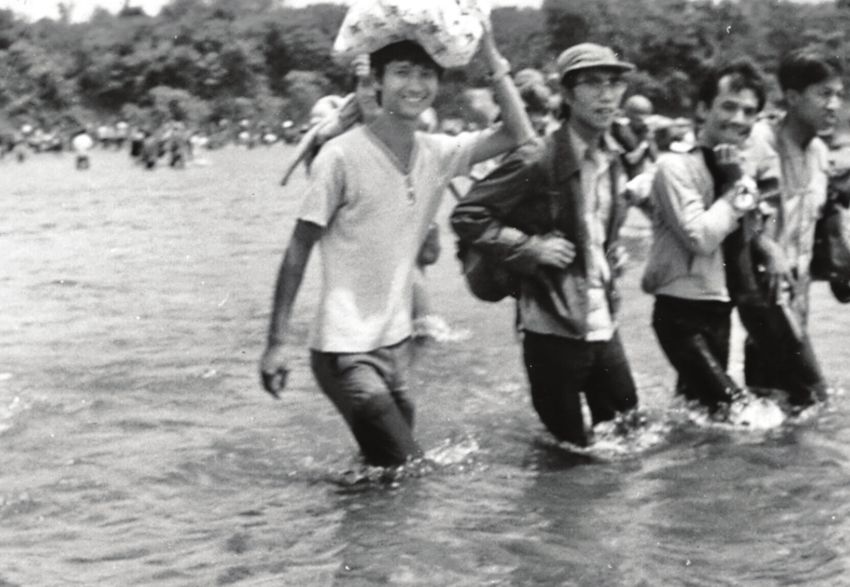
affordability; and attempting to weaken immigrant          for each of the different ethnic groups that make up
and refugee political power and access to resources        the AANHPI category. AANHPI are not a monolith.
by creating barriers to a complete count of entire         Together this community is made up of people of
communities through the census.                            nearly 50 ethnicities who speak more than a hundred
                                                           languages. However, when looking at data in aggregate,
We have also seen a rising movement opposing the
                                                           we are often labeled as the “model minority” and used
collection and reporting of disaggregated data led by
                                                           as a wedge to undermine policies that promote the civil
a small fraction of conservative Chinese communities
                                                           rights of other communities of color.
that are misinformed, misled, and used as tools by
affirmative action opponents in the U.S. This vocal        Given this context, Southeast Asian American Journeys:
minority has been at the forefront of attempting to        A National Snapshot of Our Communities is a resource to
dismantle state-level data disaggregation policies         amplify the SEAA story through disaggregated data
while seeking to influence the national debate on          to highlight the pressing issues and resilience of this
affirmative action by appropriating civil rights           community today. For SEARAC, SEAA is a political
messaging on education equity for unjust causes.           identity that comes from the shared experience
Using the Asian American, Native Hawaiian and              of people who came to the U.S. as refugees from
Pacific Islander (AANHPI) community as a wedge             Cambodia, Laos, and Vietnam in the aftermath of the
group to discredit equity-minded policies, such as         U.S. occupation in Southeast Asia. This report presents
data disaggregation and race conscious admissions          data that disaggregate Southeast Asian Americans
policies, hurts not only SEAA but all students of color.   from the Asian American category. However, due
Now is the time to combat fear and misinformation          to data availability, disaggregation of data in this
and highlight the incredible diversity of the AANHPI       report is limited to Cambodian, Hmong, Laotian,
community with accurate details on the needs and           and Vietnamese American as distinct ethnic groups,
assets in the SEAA community captured only through         and the combination of these four ethnic groups as a
the collection and reporting of disaggregated data.        distinct Southeast Asian American category. It seeks to
Only by seeing our needs and challenges through            dispel “model minority” myths by showing that many
accurate data can we advocate fully for not just our       in our communities have invisible needs and require
visibility but our community’s civil rights as the         access to culturally and linguistically sensitive and
largest community of refugees ever to be resettled         appropriate services.
in America. Armed with our community’s data, we
                                                           This report provides, in addition to general
will build our community’s self-determination from
                                                           demographic data, data highlighting some critical
our legacy of refugee resilience to shape a new,
                                                           issues facing SEAA, such as resettlement, immigration,
multicultural, equitable democracy and America.
                                                           education, health, economic justice/housing, and civic
SEARAC AND ADVANCING JUSTICE–LA were                       engagement. Although a large portion of the report
founded on a legacy of advancing the civil rights and      features national data, it also highlights a few states
human dignity of Asian American communities. In            with sizable populations of SEAA; therefore, California,
order to carry out our respective missions in ways         Massachusetts, Minnesota, Texas, and Washington are
that do justice for the communities we serve, our          covered in greater depth in this report. We recognize
advocacy must be informed by disaggregated data that       this as a limitation of this report, given that the SEAA
highlight the unique needs, disparities, and assets        community is a growing community in other states

SOUTHEAST ASIAN AMERICAN JOURNEYS                                         A NATIONAL SNAPSHOT OF OUR COMMUNITIES /    7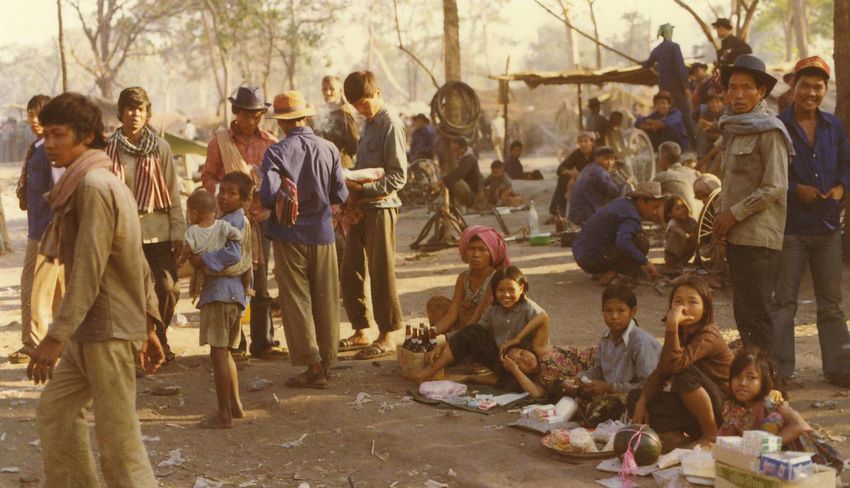
across the U.S., but it is our hope this preliminary information inspires further study in other states across the
country. Much of the data come from the U.S. Census Bureau, including the Decennial Census and the American
Community Survey. Because census data are limited, data from other sources are also used.

We hope that this report will serve as tool to empower communities to enact change—to call for policies
that protect our community’s rights, to invest in the needs and resilience of our community, and to deepen
partnerships across sectors to build equity for the SEAA community. While the topics covered here are not
meant to be an exhaustive list of all issues that matter to the SEAA community, we believe they are an important
first step to sharing the overall state of SEAA today with:

  • Policy makers, government officials, and government agencies—to inform the creation of culturally
    relevant policy interventions that lead to equitable outcomes for SEAA families.

  • Foundations and donors—to inform the need for long-term resources and investments to support a thriving
    SEAA community.

  • Service providers—to inform the development and application of culturally sensitive services as well
    as intentional investment in building a workforce pathway composed of members from impacted
    SEAA communities.

  • Community members and the general public—to inform community organizing, education, mobilization,
    and community building around a broader SEAA political identity.

SOUTHEAST ASIAN AMERICAN JOURNEYS                                          A NATIONAL SNAPSHOT OF OUR COMMUNITIES /   8
THANK YOU
WE WOULD LIKE TO THANK EVERYONE who contributed to this report, including coauthors SEARAC staff (Katrina
Dizon Mariategue and Quyen Dinh) and Asian Americans Advancing Justice–Los Angeles staff (June Lim and Shelly
Chen). This project is a result of countless hours of collaboration with many of our SEAA community partners,
leaders, advocates, and service providers across the country who shared their time, expertise, and experiences to
bring this report to life. We want to especially acknowledge our committee of stakeholders who helped to inform
our data collection process, policy recommendations, and contributed their voices: Sina Sam, Sovanna Pouv,
Phitsamay Uy, Channapha Khamvongsa, Vattana Peong, Susana Sngiem, Jannette Diep, Lily Liemthongsamout,
Tung Nguyen, Bao Vang, Quyen Vuong, Thu Quach, Pao Yang, and Ay Saechao. With deep gratitude, we also thank
community members who shared their stories and photos for this report: Maly Phommavong, Phi Nguyen, Thanh
Quach, Nghiep Ke Lam, Silong Chhun, the Hmong Cultural Center of Butte County, Sunny Chanthanouvuong,
KaYing Yang and countless others whose narratives in past SEARAC campaigns, reports, and training programs
helped to uplift the data presented. Thank you for bringing the stories from your communities to shape this
project. We also extend our gratitude to the Wallace H. Coulter Foundation for making this report possible.
The statements and recommendations expressed in this report are solely the responsibility of the authors.

SOUTHEAST ASIAN AMERICAN JOURNEYS                                          A NATIONAL SNAPSHOT OF OUR COMMUNITIES /   9
EXECUTIVE SUMMARY
Over 2.5 million Southeast                            Vietnamese and Hmong Americans have the highest
                                                      and lowest median ages among SEAA of 34.1 and 20.5,
Asian Americans (SEAA) live in
                                                      respectively.
the United States. Southeast
Asian American Journeys:                              SEAA STILL STRUGGLE WITH SOCIOECONOMIC
A National Snapshot of Our                            INSECURITY. ACROSS MULTIPLE MEASURES OF
                                                      INCOME, SEAA fare worse than average. Nationwide,
Communities serves as a
                                                      close to 1.1 million SEAA are low-income, including
resource for communities,                             about 460,000 who live in poverty. All SEAA ethnic
organizations, policy makers,                         groups have lower per capita incomes than average,
funders, corporations, and                            with Hmong Americans faring worse than all racial
                                                      groups across multiple measures of income. Nearly
others wanting to understand
                                                      60% of Hmong Americans are low-income, and more
and uplift the diverse and                            than one of every four live in poverty. Because of this,
growing SEAA community.                               SEAA also struggle with housing stability. Among
Some of the key findings                              SEAA ethnic groups, with the exception of Hmong
                                                      Americans, renters spend more than 30% of their
include those described below.
                                                      income on housing-related costs. Those with home
                                                      mortgages are also more likely to be housing cost-
                                                      burdened than average (32%). Vietnamese American
SEAA ARE A RELATIVELY YOUNG AND GROWING               mortgagors (45%) have the highest rate of being
COMMUNITY. At over 2.5 million, SEAA compose          housing cost-burdened than all racial groups.
14% of the entire Asian American population in
the country, growing by 38% between 2000 and          SEAA CONTINUE TO FACE CHALLENGES TO EQUITABLE
2010 (nearly four times the national average of       EDUCATION OUTCOMES. SEAA have glaringly lower
10%). More than half live in California, Texas, and   rates of educational attainment compared to Whites
Minnesota. California remains home to the largest     and Asian Americans as a whole across different
SEAA population with 36% of the community living      levels of education, including high school graduation,
there. Alaska, West Virginia, Nevada, Wyoming, and    college access, and college completion. Nearly 30% of
Arizona are the states with the fastest population    SEAA have not completed high school or passed the
growth for this community, ranging from 92% in        GED, a rate more than double the national average
Arizona to as high as 142% in Alaska. Additionally,   (13%). Among SEAA ethnic groups, Cambodian
SEAA are a generally young population. The median     Americans are the least likely to hold a high school
ages of all SEAA ethnic groups are lower than         diploma or GED. In addition, one-quarter of SEAA hold
the average U.S. population’s median age of 37.2.     a bachelor’s degree or higher, compared to the one-

SOUTHEAST ASIAN AMERICAN JOURNEYS                                     A NATIONAL SNAPSHOT OF OUR COMMUNITIES /   10
half of Asian Americans who do. Among SEAA ethnic 21,000 Southeast Asians immigrated to the U.S. in
groups, Vietnamese Americans (28%) have the highest 2017, 95% percent of whom arrived via family-based
rate of attaining a higher-education degree, whereas lawful permanent resident status.
Laotian Americans (14%) have the lowest rate—the SEAA IMMIGRANTS CONTINUE TO BE IMPACTED
same as Latinos. by mandatory detention and deportation policies
passed decades ago. The inadequate support of
SEAA GREATLY BENEFITED FROM THE PASSAGE OF SEAA refugees upon initial resettlement, coupled
THE AFFORDABLE CARE ACT (ACA) AND CONTINUE with the rise in mass incarceration and the growth
TO BE HIGHLY DEPENDENT ON PUBLIC HEALTH of immigration detention and deportation in the U.S.
INSURANCE FOR SURVIVAL. Prior to 2010, SEAA have made this community uniquely vulnerable to the
experienced high levels of uninsured rates. Although prison-to-deportation pathway. SEAA continue to feel
the rate of uninsured continues to be high, the ACA the impact of punitive, short-sighted, one-size-fits-all
considerably decreased the percentage of uninsured policies created in 1996 that ignored how individuals
SEAA. The greatest percentage decreases were seen have transformed their lives since serving their debt
in Cambodian Americans (20% to 15%) and Laotian to society. Instead, these laws expanded the definition
Americans (18% to 14%). Additionally, Hmong of deportable offenses such as “aggravated felonies”
and Cambodian Americans are more likely to have and made it mandatory for all immigrants, including
public health insurance than the average population. LPRs, to be detained by the immigration system and
Hmong Americans have public health insurance eventually deported. The number of SEAA deported
enrollment rates similar to African Americans (39% to Cambodia, Laos, and Vietnam more than doubled
and 38%, respectively). Cambodian Americans, with between 2015–16 and 2017–18, with over 95% of
31% enrolled in public health insurance, have a rate deportations in fiscal year (FY) 2018 accounting for
similar to that of Latinos (33%). Unfortunately, despite individuals repatriated to Cambodia and Vietnam.
growing access to health care, SEAA still battle with Additionally, nearly 75% of the deportations in FY
a significant number of physical health and mental 2018 were due to aggravated felony charges, many of
health disparities due to the lack of services that are which were for convictions from up to 20 years prior.
culturally and linguistically appropriate.
THE MIGRATION OF SEAA INTO THE UNITED STATES
HAS CHANGED largely from refugee admissions
to family and employment-based visas. Nearly
60% of SEAA were born outside of the U.S. (a rate
similar to that of Asian Americans as a whole), with
45% arriving before 1990, a rate higher than the
nationwide average (35%). Until 1998, the large
majority of applications for green cards among
SEAA were for status changes from refugee to lawful
permanent resident (LPR). Since the late 1990s the
main pathways to enter the U.S. as an LPR have been
through family and employment methods. Nearly
SOUTHEAST ASIAN AMERICAN JOURNEYS A NATIONAL SNAPSHOT OF OUR COMMUNITIES / 11NATIONAL DEMOGRAPHICS
U.S. Census Bureau, 2010 Census SF1, Table PCT7.
SEAA by County Note: Alaska and Hawai‘i are not to scale.
200,000–1,000,000
100,000–199,999
25,000–99,999
10,000–24,999
5,000–9,999
2,500–4,999
0–2,499
Over 2.5 million Southeast Asian Americans live in the United States.1
SOUTHEAST ASIAN AMERICANS [SEAA] compose age of 34.1, and Hmong Americans have the lowest
14% of the Asian American population.2 median age of 20.5.5
THE SEAA POPULATION IN THE U.S. GREW BY 38% OVER 40% OF HMONG AMERICANS are under the age
between 2000 and 2010, nearly four times the average of 18—the highest proportion of youth compared to
rate (10%). Vietnamese and Hmong Americans are the all racial groups and other SEAA ethnic groups. The
fastest-growing SEAA ethnic groups with growth rates proportion of Hmong American youth is double that
mirroring Native Hawaiians and Pacific Islanders, of Whites.6
Latino, and Asian Americans.3
HMONG AMERICANS have high proportions of
OVER 50% OF SEAA live in California, Texas, and college-aged young adults (ages 18–24) compared
Minnesota. California remains home to the largest to all racial groups and other SEAA ethnic groups.
population of SEAA; 36% of SEAA reside there.4 At 19% it is nearly double the average proportion and
that of Vietnamese Americans, both 10%. Laotian and
THE MEDIAN AGE OF SEAA is below that of the average Cambodian Americans also have higher-than-average
U.S. population of 37.2. Of the SEAA ethnic groups, proportions of college-aged youth at 12% and 14%,
Vietnamese Americans have the highest median respectively.7
SOUTHEAST
SOUTHEAST ASIAN
ASIAN AMERICAN
AMERICAN JOURNEYS
JOURNEYS A NATIONAL SNAPSHOT OF OUR COMMUNITIES / 12REFUGEE RESETTLEMENT
& IMMIGRATION
Population Growth
By Race, Hispanic Origin, and Ethnicity, 2000–2010
SEAA Groups Race and Hispanic Origin Total Population
Asian American 46%
Latino 43%
Vietnamese 42%
NHPI 40%
Hmong 40%
SEAA 38%
Cambodian 34%
AIAN 27%
Black / African American 15%
Laotian 15%
Total Population 10%
White 1%
U.S. Census Bureau, 2000 Census SF1, Tables P8, P9, and PCT007; 2010 Census SF1, Tables P5, P6, and PCT7. Note: Figures for each racial
group include both single race and multiracial people, except for White, which is single race, non-Latino. Figures do not sum to total.
AIAN: Native American(s) or Alaska Native(s) NHPI: Native Hawaiian(s) and Pacific Islander(s) SEAA: Southeast Asian American(s)
SOUTHEAST ASIAN AMERICAN JOURNEYS A NATIONAL SNAPSHOT OF OUR COMMUNITIES / 13States with Fastest-Growing STATE NUMBER % GROWTH
SEAA Population Alaska 7,429 142%
By Ethnic Group and by Top-Five States, 2010
West Virginia 1,246 138%
(Ranked by Population)
Nevada 16,831 122%
U.S. Census Bureau, 2010 Census SF1, Table PCT7. Wyoming 372 116%
Arizona 33,124 92%
States with Largest SEAA Populations
By Ethnic Group and by Top-Five States, 2010 (Ranked by Population)
Vietnamese American Hmong American
STATE NUMBER STATE NUMBER
California 647,589 California 91,224
Texas 227,968 Minnesota 66,181
Washington 75,843 Wisconsin 49,240
Florida 65,772 North Carolina 10,864
Virginia 59,984 Michigan 5,924
Cambodian American Laotian American
STATE NUMBER STATE NUMBER
California 102,317 California 69,303
Massachusetts 28,424 Texas 15,784
Washington 22,934 Minnesota 12,009
Texas 14,347 Washington 11,568
Pennsylvania 14,118 Tennessee 7,276
U.S. Census Bureau, 2010 Census SF1, Table PCT7.
SOUTHEAST ASIAN AMERICAN JOURNEYS A NATIONAL SNAPSHOT OF OUR COMMUNITIES / 14SEAA Refugee Arrivals Cambodia Laos Vietnam
By Country of Origin, United States 1975–2009
170,000
160,000
150,000
140,000
130,000
120,000
110,000
100,000
90,000
80,000
70,000
60,000
50,000
40,000
30,000
20,000
10,000
´75 ´76 ´77 ´78 ´79 ´80 ´81 ´82 ´83 ´84 ´85 ´86 ´87 ´88 ´89 ´90 ´91 ´92 ´93 ´94 ´95 ´96 ´97 ´98 ´99 ´00 ´01 ´02 ´03 ´04 ´05 ´06 ´07 ´08 ´09
Special and Humanitarian Refugee Act Closure of Wat Tham Krabok
Parole Programs of 1980
1975–1982 from U.S. Departments of State, Immigration and Naturalization Services, Health and Human Services, Office of Refugee
Resettlement, and the Indochina Refugee Assistance Program, as cited by L. W. Gordon, 1987; 1980–2009 from U.S. Department of Health
and Human Services, Administration for Children and Families, Office of Refugee Resettlement, Annual Report to Congress, 1981 to 2010.
THE PATHWAY OF SOUTHEAST ASIAN AMERICAN (SEAA) arrival to the United States has been shaped by U.S.
involvement in the political push factors in Vietnam, Laos, and Cambodia. It is a trajectory that has transitioned
from refugee resettlement to employment- and family-based immigration. Although there had been small numbers
of immigrants from these countries prior, it was not until 1975 when the governments of these countries fell to
communist powers that large waves of people arrived in the U.S. as refugees,8 or people who are unable or unwilling
to return to their country because of or in fear of persecution.9 The initial wave of refugees to resettle in the U.S.,
the majority of whom were from Vietnam, arrived between April and December of 1975 under the special and
humanitarian parole programs.
Upon enactment of the Refugee Act of 1980, the number of refugees from Southeast Asia increased exponentially.
Until the late 1980s Southeast Asian refugees composed more than half of all persons seeking refuge in the U.S.
The numbers of refugees from Southeast Asia entering under this status has decreased since the mid-1990s. The
closing of the final temporary shelter, the Buddhist monastery at Wat Tham Krabok in 2004, led to the final wave of
Hmong refugees to resettle in the U.S. in 2004 and 2005. The narrative of Southeast Asians’ arrival in the U.S. has
since shifted from one primarily of refugee resettlement to one of family- and employment-based immigration.
SOUTHEAST ASIAN AMERICAN JOURNEYS A NATIONAL SNAPSHOT OF OUR COMMUNITIES / 15SEAA STORIES OF RESETTLEMENT AND RESILIENCE SOUTHEAST ASIAN AMERICAN JOURNEYS A NATIONAL SNAPSHOT OF OUR COMMUNITIES / 16
SUNNY CHANTHANOUVUONG was born in Pakse,                  in an attempt to avoid the guards. Sunny said that
Laos. In 1981, he fled Laos and went to Thailand with     all of his life was defined by the camp—“We are like
his sister, younger brother, and niece just as Thailand   chickens in a box. They put a border around it, [and]
was in the process of closing the refugee camp they       you have to stay in the refugee camp. So we only know
were trying to reach. After a few months, they were       inside the camp.... When I heard we were going to
reunited with their parents and lived in Napho            America, I didn’t know what it was like—I just knew
Refugee Camp for the next few years.                      that we need[ed] to get away from this terrible place.”

As a teenager, Sunny remembers the crowded                Sunny’s family resettled in Minnesota in June 1984.
conditions, poor quality and sparse food rations,         Although in vast ways an improvement from Napho,
and grueling labor to run the camp. He would spend        Sunny still struggled to adjust. He had to attend high
hours in line retrieving water, getting wood for a        school with significantly limited English proficiency,
fire, standing outside in the middle of the night as a    and his family missed the Laos community, language,
guard, and studying English in hopes of making it         and businesses that they could lean on. In school,
to the United States. The food was whatever might         he remembers rereading the same text over and
be leftover from the market—heavily salted fish           over again. But over time, the community grew to
and poorly cooked rice. Women were at high risk of        support one another, and Sunny, years later, is hopeful
sexual assault from guards, so many young women,          for the next generation and the opportunities they
including Sunny’s sister, got married in the camps        might receive.

DAVID ROS was born in Phnom Penh, Cambodia, one
year before it fell to the Khmer Rouge. Because of his
family’s connection to the military—his grandfather
was a lieutenant colonel before the war—his father
was killed and his mother was tortured and beaten. In
1978, David and his family escaped to Thailand, where
they arrived at a refugee camp after surviving bombs,
fires, and dead bodies along their dangerous escape.
David and his family eventually resettled in the U.S.
Similar to many refugees, growing up in the U.S. was
not easy for David. He struggled with posttraumatic
stress disorder, poor education, and limited English
language proficiency in a community vulnerable to
poverty, crime, and violence. He felt isolated for much
of his childhood, moving often and growing up in
rural areas, but in Lowell he met other Cambodians
he could relate to. As a teenager, he and his friends
watched out for one other amidst neighborhood
violence and discrimination that targeted the growing
number of Southeast Asian Americans in the city.

SOUTHEAST ASIAN AMERICAN JOURNEYS                                       A NATIONAL SNAPSHOT OF OUR COMMUNITIES /    17
SEAA Lawful Permanent                                                                      Employment Based                         Refugees                            Family-Related Immigration

Resident Applicants
By Broad Class of Admission, United States 1976–2017

120,000

110,000

100,000

 90,000

 80,000

 70,000

 60,000

 50,000

 40,000

 30,000

 20,000

 10,000

          ´76 ´77 ´78 ´79 ´80 ´81 ´82 ´83 ´84 ´85 ´86 ´87 ´88 ´89 ´90 ´91 ´92 ´93 ´94 ´95 ´96   ´97   ´98   ´99   ´00   ´01   ´02   ´03   ´04   ´05   ´06   ´07   ´08   ´09   ´10   ´11   ´12   ´13   ´14   ´15   ´16   ´17

          Year

2002–2017 U.S. Department of Homeland Security, Office of Immigration Statistics, Yearbook of Immigration Statistics, 2003–2018;
1978–2001 U.S. Department of Justice, Immigration and Naturalization Service, Statistical Yearbook of the Immigration and Naturalization
Service, 1979–2001; 1976–1977 U.S. Department of Justice, Immigration and Naturalization Service, Annual Report of the Immigration
and Naturalization Service, 1977–1978.

• Refugees can apply for lawful permanent resident (LPR) status after residing in the U.S. for at least one year;
   however, they are able to remain in the U.S. indefinitely without changing their status to permanent resident.10

• Until 1998, the large majority of LPR applications among SEAA were for status changes from refugee to LPR.
   Since the late 1990s the main pathways to enter the U.S. as an LPR have been through family and employment
   methods.11

• Nearly 21,000 Southeast Asians immigrated to the U.S. in 2017, 95% percent of whom arrived via family-based
   LPR status. Employment-based immigration was not as large of an admissions class as it had been in the
   preceding 11 years.12

SOUTHEAST ASIAN AMERICAN JOURNEYS                                                                                                   A NATIONAL SNAPSHOT OF OUR COMMUNITIES /                                             18
“Since 1998, at least 16,000 Southeast Asian
Americans have received final orders of
deportation despite many arriving to the U.S.
with refugee status and obtaining a green card.
Due to stringent immigration policies enacted
in 1996, [those in] Southeast Asian American
communities are three to four times more likely
to be deported for old convictions compared
with other immigrant communities.”
Excerpt from Asian Americans & Pacific Islanders behind Bars: Exposing the School
to Prison to Deportation Pipeline
SOUTHEAST ASIAN AMERICAN JOURNEYS A NATIONAL SNAPSHOT OF OUR COMMUNITIES / 19Immigration and Customs Enforcement Removals
By Percentage of Removals Due to Aggravated Felonies and Country of Birth, 2014–2018
Cambodia El Salvador Guatemala Honduras Mexico Vietnam
100%
90%
80%
70%
60%
50%
40%
30%
20%
10%
0%
2014 2015 2016 2017 2018
Transactional Records Access Clearinghouse, Syracuse University, Immigration and Customs Enforcement Removals.
• The number of SEAA deported to Cambodia, Laos, and Vietnam more than doubled between 2015–16 and
2017–18.13 Over 95% of the 223 deportations to these countries in fiscal year (FY) 2018 were to Cambodia
and Vietnam.14
• Nearly 75% of the deportations in FY 2018 were due to aggravated felony charges,15 many of which were for
convictions from up to 20 years prior.
• Deportations due to aggravated felonies disproportionately affect Cambodian and Vietnamese immigrants in
comparison to those from Mexico, Guatemala, Honduras, or El Salvador—the top countries to which immigrants
are deported from the U.S.16
SOUTHEAST ASIAN AMERICAN JOURNEYS A NATIONAL SNAPSHOT OF OUR COMMUNITIES / 20“Access to language means access to justice.
We witness our community navigate health,
education, and social service institutions without
the necessary resources and support to thrive.
Governmental agencies have not prioritized our
community and failed to build the capacity within
our community to support Southeast Asians with
limited English proficiency.”
CHANDA WOMACK
Alliance of Rhode Island Southeast Asians for Education (ARISE)
SOUTHEAST ASIAN AMERICAN JOURNEYS A NATIONAL SNAPSHOT OF OUR COMMUNITIES / 21Foreign-Born SEAA Groups Race and Hispanic Origin Total Population
By Race, Hispanic Origin, and Ethnic Group,
United States 2011–2015 Vietnamese 62%
Asian American 59%
• Nearly 60% of SEAA were born outside of the U.S., a rate SEAA 58%
similar to that of Asian Americans as a whole.
Cambodian 52%
• Among SEAA, Vietnamese Americans have the largest
Laotian 49%
proportion of foreign-born and Hmong Americans have
the smallest. Hmong 38%
• Forty-five percent of foreign-born SEAA arrived before Latino 35%
1990, a higher rate than average (35%). NHPI 17%
• Nearly three-quarters of Hmong Americans arrived Total Population 13%
before 1990.17
Black / African American 9%
AIAN 5%
U.S. Census Bureau, 2011–2015 American Community Survey
5-Year Estimates, Table B05003. White 4%
Limited English Proficiency*
By Race, Hispanic Origin, and Ethnic Group, United States 2011–2015
• Nearly 90% of SEAA speak a language other than Vietnamese 49%
English at home, a rate higher than Asian Americans as
SEAA 45%
a whole and other racial groups.18
Cambodian 38%
• Among SEAA ethnic groups, Hmong Americans (95%)
are most likely and Laotian Americans (87%) are least Hmong 37%
likely to speak a language other than English. These
Laotian 34%
rates are more than four times the average (21%).19
Latino 32%
• Forty-five percent of SEAA are limited English proficient
(LEP), a rate higher than Asian Americans as a whole Asian American 31%
and other racial groups. NHPI 9%
• Among SEAA ethnic groups, Vietnamese Americans Total Population 9%
(49%) have the highest LEP rate and Laotian Americans
AIAN 6%
(34%) have the lowest. This rate is similar to, but still
higher than, that of Asian Americans as a whole (31%) White 6%
and Latinos (32%).
Black / African American 3%
*For the population 5 years and older
U.S. Census Bureau, 2011–2015 American Community Survey 5-Year Estimates, Table B16004.
SOUTHEAST ASIAN AMERICAN JOURNEYS A NATIONAL SNAPSHOT OF OUR COMMUNITIES / 22EDUCATION
Educational Attainment*
By Race, Hispanic Origin, and Ethnic Group, California 2011–2015 (Ranked by Percent Bachelor’s Degree and Higher)
% Less than High School % High School Degree % Bachelor’s Degree and Higher
Asian American 14% 36% 50%
White 11% 58% 31%
Total Population 13% 57% 30%
Vietnamese 28% 44% 28%
SEAA 29% 46% 25%
NHPI 12% 67% 21%
Black / African American 16% 64% 20%
AIAN 18% 64% 18%
Cambodian 34% 49% 17%
Hmong 30% 53% 17%
Laotian 30% 55% 14%
Latino 35% 51% 14%
*For the population 25 years and older
U.S. Census Bureau, 2011–2015 American Community Survey 5-Year Estimates, Table B15002.
The percentage of Cambodian Americans who hold a bachelor’s degree
or higher is half the percentage of Cambodian Americans who did not
complete high school.
SOUTHEAST ASIAN AMERICAN JOURNEYS A NATIONAL SNAPSHOT OF OUR COMMUNITIES / 23A larger proportion of Southeast Asian Americans have not completed
high school than have earned at least a bachelor’s degree.
• Nearly 30% of Southeast Asian Americans (SEAA) have • Ten percent of Hmong Americans hold an associate’s
not completed high school or passed the GED, a rate degree, a rate higher than all other SEAA ethnic groups
more than double the national average (13%). and other racial groups.21
• Among SEAA ethnic groups, Cambodian Americans are • One-quarter of SEAA hold a bachelor’s degree or higher,
the least likely to have completed high school. compared to the one-half of Asian Americans who do.
• There are gender disparities in educational attainment • Among SEAA ethnic groups, Vietnamese Americans
rates across the SEAA ethnic groups. A larger proportion (28%) have the highest rate of attaining a higher-
of females than males have not completed high school, education degree, whereas Laotian Americans (14%)
a difference that ranges from 6% among Laotian have the lowest—the same rate as Latinos.22
Americans to 11% among Cambodian Americans.
• There are 123 Asian American Native American Pacific
Although a slightly higher percentage of Vietnamese and
Islander–Serving Institutions across the U.S.23
Cambodian American males hold a higher-education
degree, the opposite is true among Laotian and Hmong
Americans, for whom females have a slightly higher
percentage of obtaining a higher-education degree.20
“I am the daughter of Cambodian refugees. Growing
up, five of us lived in a tiny apartment in Chinatown.
Gang violence was common. Poverty was evident.
And yet, I always had a sense of hope because I could
see what world was possible through my amazing
public schools and libraries. I knew that if I studied hard,
I could become whatever I wanted to be. And if many
of my peers studied hard, the circumstances of our
community could improve.”
JENNIFER TANG,
SEARAC LAT 2019 participant, Monterey Park, California
SOUTHEAST ASIAN AMERICAN JOURNEYS A NATIONAL SNAPSHOT OF OUR COMMUNITIES / 24HEALTH
Uninsured SEAA Groups Race and Hispanic Origin Total Population
By Race, Hispanic Origin, and Ethnic Group, United
States 2011–2015 Latino 26%
AIAN 20%
• Southeast Asian Americans (SEAA) are less likely to Vietnamese 16%
have health insurance than the average population
Cambodian 15%
and Asian Americans as a whole.24
SEAA 15%
• The percentage of uninsured has decreased
across all racial and SEAA ethnic groups since Black / African American 15%
the implementation of the Affordable Care Act. Laotian 14%
The largest percentage decreases were seen in
Hmong 13%
Cambodian Americans (20% to 15%) and Laotian
Americans (18% to 14%).25 Total Population 13%
NHPI 12%
U.S. Census Bureau, American Community Survey 5-Year
Estimates, Table B27001.
Asian American 12%
White 9%
Public Health Insurance Hmong 39%
By SEAA Ethnic Group, United States 2011–2015
Cambodian 31%
Hmong and Cambodian Americans are more likely
to have public health insurance than the average
population. Hmong Americans have public health Laotian 27%
insurance enrollment rates similar to African
Americans (39% and 38%, respectively). Cambodian
Vietnamese 25%
Americans, with 31% enrolled in public health
insurance, have rates similar to that of Latinos (33%).26
U.S. Census Bureau, American Community Survey 5-Year
Estimates, Table B27003.
SOUTHEAST ASIAN AMERICAN JOURNEYS A NATIONAL SNAPSHOT OF OUR COMMUNITIES / 25“Please protect access to
affordable health coverage.
The Medicaid expansion
helped my family take care
of my dad’s medical bills
when he was in and out
of the hospital after being
diagnosed with liver cancer.
The experience itself was
traumatizing enough, and
we are thankful that with
his Medi-Cal and Medicare
benefits, we did not have
to worry about having
enough money to see him
live the rest of his days with
dignity. My dad was able to
transition on comfortably.”
SEAA RESPONDENT
from Southeast Asian Americans Speak Out to Protect
the Affordable Care Act and Medicaid Expansion
SOUTHEAST ASIAN AMERICAN JOURNEYS A NATIONAL SNAPSHOT OF OUR COMMUNITIES / 26ECONOMIC JUSTICE
& HOUSING
Per Capita Income
By Race, Hispanic Origin, and Ethnic Group, United States 2011–2015
SEAA Groups Race and Hispanic Origin Total Population • Across multiple measures of income,
Southeast Asian Americans (SEAA)
fare worse than average.
White $34,391
A greater proportion of SEAA are
Asian American $30,943 low-income, and they have a lower
Total Population $28,930 per capita income.
Vietnamese $23,339 • Close to 1.1 million SEAA are
low-income, including about 460,000
SEAA $21,115
who live in poverty.27
NHPI $20,686
• All SEAA ethnic groups have lower
Black / African American $18,716
per capita incomes than average.
AIAN $18,581
• Hmong Americans fare worse than
Laotian $17,951
all racial groups across multiple
Cambodian $17,437 measures of income. Nearly 60%
of Hmong Americans are low-income
Latino $16,674
and more than one of every four live
Hmong $12,868 in poverty.
U.S. Census Bureau, 2011–2015 American Community Survey 5-Year Estimates, Tables B19313 and B01003.
Fifty-eight percent of Hmong Americans are low-income. That is more
than double the percentage of Asian Americans who are low-income.
This percentage is higher than all racial groups in the United States.
SOUTHEAST ASIAN AMERICAN JOURNEYS A NATIONAL SNAPSHOT OF OUR COMMUNITIES / 27Poverty & Low-Income
By Race, Hispanic Origin, and Ethnic Group, United States 2011–2015 (Ranked by Percent Low-Income)
% Low-income
% Poverty
Asian American 13% 15%
White 13% 17%
Total Population 15% 19%
Vietnamese 15% 21%
NHPI 18% 21%
SEAA 17% 23%
Laotian 17% 24%
Cambodian 20% 23%
AIAN 25% 24%
Black / African American 27% 24%
Latino 24% 28%
Hmong 26% 32%
U.S. Census Bureau, 2011–2015 American Community Survey 5-Year Estimates, C17002.
Average Household Size
By Housing Tenure & Ethnic Group, United States 2010
TOTAL
HOUSING TENURE HMONG CAMBODIAN LAOTIAN VIETNAMESE
POPULATION
Owner 5.8 4.8 4.5 4.0 2.7
Renter 4.4 3.7 3.5 3.0 2.5
U.S. Census Bureau, 2011–2015 American Community Survey 5-Year Estimates, DP04.
SOUTHEAST ASIAN AMERICAN JOURNEYS A NATIONAL SNAPSHOT OF OUR COMMUNITIES / 28Homeowners and Renters
By Race, Hispanic Origin, and Ethnic Group, United States 2010
Homeowner Renter
White 72% 28%
Total Population 65% 35%
Vietnamese 65% 35%
SEAA 62% 38%
Laotian 59% 41%
Asian American 57% 43%
AIAN 53% 47%
Cambodian 51% 49%
Latino 47% 53%
Hmong 47% 53%
NHPI 47% 53%
Black / African American 44% 56%
U.S. Census Bureau, 2010 Census SF2, Table HCT2.
• All SEAA ethnic groups have lower-than-average rates of homeownership, with the exception of Vietnamese
Americans (65%), who are at the average rate.
• Vietnamese (65%), Laotian (59%), and Cambodian Americans (51%) are more likely to own than rent
their homes.
• Among all SEAA ethnic groups, with the exception of Hmong Americans, renters spend more than 30%
of their income on housing.28
• SEAA mortgagors (43%) are more likely to be housing cost-burdened than average (32%). Vietnamese American
mortgagors (45%) have the highest rate of all racial groups of being housing cost-burdened.29
• Regardless of housing tenure, SEAA ethnic groups have larger mean household sizes than average.
SEAA household sizes are larger than Asian American households as a whole.30
SOUTHEAST ASIAN AMERICAN JOURNEYS A NATIONAL SNAPSHOT OF OUR COMMUNITIES / 29Citizen Voting-Age Population
By Race, Hispanic Origin, and Ethnic Group, United States 2011–2015
SEAA Groups Race and Hispanic Origin Total Population
White 98%
AIAN 96%
Black / African American 95%
Total Population 92%
NHPI 89%
Hmong 85%
Vietnamese 81%
SEAA 81%
Cambodian 79%
Laotian 78%
Asian American 70%
Latino 68%
U.S. Census Bureau, 2011–2015 American Community Survey 5-Year Estimates, Table B05003.
• Southeast Asian Americans (SEAA, 81%) have lower-than-average (92%) proportions of voting-age populations
who are citizens.
• All SEAA ethnic groups have higher rates of citizen voting-age populations than Asian Americans as
a whole and Latinos.
“But, for me, no matter what position or career I’m doing, I will
always make time for social justice work. I’m going to be there for
my community and fight back, and tell my story, and make people
aware of the problems in my community.”
STEPHANIE SIM
excerpt from Dreams Detained in Her Words: The Effects of Detention and Deportation on Women and Families.
SOUTHEAST ASIAN AMERICAN JOURNEYS A NATIONAL SNAPSHOT OF OUR COMMUNITIES / 30CALIFORNIA
SEAA Demographics by County U.S. Census Bureau, 2010 Census SF1, Table PCT7.
200,000–1,000,000 100,000–199,999 25,000–99,999 10,000–24,999 5,000–9,999 2,500–4,999 0–2,499
OVER 910,000 SOUTHEAST ASIAN AMERICANS (SEAA) LIVE IN CALIFORNIA. It is home to the largest population of
SEAA.31 Although Southeast Asian refugees settled in every U.S. state from 1983 to 2007, refugees from Vietnam,
Cambodia, and Laos initially resettled in California more than in any other state.32 Camp Pendleton in California was
one of the bases to process the first group of refugees in 1975. Additionally, over half of refugees who were initially
resettled elsewhere in the U.S. moved across state lines, often to California, for family, community, and climate.33 The
Cambodian community in Long Beach began in the 1950s and 1960s prior to SEAA resettlement, when Cambodian
students attended California State University, Long Beach, as part of an exchange program. It then continued to grow
as refugees resettled in California.34 A large Hmong community was established in the Central Valley in the early
1980s when Hmong leadership settled there to build a community and in hopes of agricultural opportunities.35
SOUTHEAST
SOUTHEAST ASIAN
ASIAN AMERICAN
AMERICAN JOURNEYS
JOURNEYS A NATIONAL SNAPSHOT OF OUR COMMUNITIES / 31CALIFORNIA DEMOGRAPHICS
Population Growth
By Race, Hispanic Origin, and Ethnic Group, United States 2000 to 2010
SEAA Groups Race and Hispanic Origin Total Population • The Southeast Asian American (SEAA)
population in California is growing more
than average. The rate of growth among
Vietnamese 34%
Laotian Americans is slightly slower
Asian American 34% than average at 7%—the same as Blacks
NHPI 29% or African Americans.
SEAA 29% • The median age of Californians is 35.2.
Latino 28% Among SEAA ethnic groups, Vietnamese
American is the only group with a
Hmong 27%
median age higher than average at 35.7.
Cambodian 21% Hmong Americans have the lowest
median age of 20.6.36
AIAN 15%
Total Population 10% • Nearly half of Hmong Americans in
California are under the age of 18—the
Black / African American 7%
highest proportion of youth compared to
Laotian 7% all racial groups and other SEAA ethnic
groups. The proportion of the Hmong
White -5%
American youth population is more than
double that of Whites.37
U.S. Census Bureau, 2000 Census SF1, Tables P8, P9, and PCT007; 2010
Census SF1, Tables P5, P6, and PCT7. • Hmong (19%), Cambodian (15%), and
Laotian Americans (14%) have the
highest proportions of college-aged
young adults (ages 18–24).38
AIAN: Native American(s) or Alaska Native(s) NHPI: Native Hawaiian(s) and Pacific Islander(s) SEAA: Southeast Asian American(s)
SOUTHEAST ASIAN AMERICAN JOURNEYS A NATIONAL SNAPSHOT OF OUR COMMUNITIES / 32CALIFORNIA DEMOGRAPHICS
Foreign-Born
By Race, Hispanic Origin, and Ethnic Group, United States 2011–2015
SEAA Groups Race and Hispanic Origin Total Population
• The percentage of foreign-
born SEAA in California is
Vietnamese 63% larger than average.
SEAA 58% • The proportion of Vietnamese,
Asian American 58% Cambodian, Laotian, and
Hmong Americans born
Cambodian 52%
outside the United States is
Laotian 47% higher than that of Latinos.
Hmong 37% • Sixty-three percent of
Latino 36% Vietnamese Americans in
California are foreign-born
Total Population 27%
—a rate higher than all racial
NHPI 22% groups and other SEAA.
AIAN 11%
White 9%
Black / African American 7%
U.S. Census Bureau, 2011–2015 American Community
Survey 5-Year Estimates, Table B05003.
SOUTHEAST ASIAN AMERICAN JOURNEYS A NATIONAL SNAPSHOT OF OUR COMMUNITIES / 33CALIFORNIA EDUCATION
Educational Attainment*
By Race, Hispanic Origin, and Ethnic Group, California 2011–2015 (Ranked by Percent Bachelor’s Degree and Higher)
% Less than High School % High School Degree % Bachelor’s Degree and Higher
Asian American 13% 38% 49%
White 16% 52% 32%
Total Population 18% 50% 31%
Vietnamese 26% 43% 30%
SEAA 28% 45% 27%
Black / African American 11% 65% 23%
NHPI 14% 64% 22%
AIAN 20% 61% 19%
Cambodian 36% 47% 17%
Hmong 33% 51% 16%
Laotian 34% 53% 13%
Latino 40% 49% 13%
*For the population 25 years and older
U.S. Census Bureau, 2011–2015 American Community Survey 5-Year Estimates, Table B15002.
• Nearly 30% of Southeast Asian Americans (SEAA) in • Slightly higher proportions of Cambodian, Hmong, and
California have not completed high school or passed Laotian American females than males have obtained a
the GED, a rate more than double that of Asian higher-education degree.40
Americans as a whole.
• Twenty-seven percent of SEAA hold a higher-education
• Of SEAA ethnic groups, Cambodian Americans are degree compared to 49% of Asian Americans as a whole.
least likely to hold a high school diploma.
• Hmong SEAA ethnic groups, Vietnamese Americans
• There are gender disparities in educational (30%) have the largest proportion of higher-education
attainment across SEAA ethnic groups. Females are degree holders, and Laotian Americans (13%) have the
less likely to have completed high school than males, smallest.
a difference that ranges from 5% among Laotian
• Fifty-two of the 132 Asian American Native American
Americans to 10% among Hmong Americans.39
Pacific Islander–Serving Institutions are in California.41
SOUTHEAST ASIAN AMERICAN JOURNEYS A NATIONAL SNAPSHOT OF OUR COMMUNITIES / 34CALIFORNIA EDUCATION
UC Six-Year Graduation Rates*
By Race, Hispanic Origin, and Ethnic Group, 2016 (Ranked by Percent Non-Pell Graduation Rates)
Non-Pell Student Pell Grant Recipient • The number of SEAA enrolled in the
University of California system has
89% increased by 16% from 2013 to 2018.
Vietnamese
88%
• Eighty-eight percent of SEAA who enter
the University of California (UC) system as
89%
Asian American freshmen graduate within six years.42
87%
• Whereas 30% of UC students are Pell Grant
89%
SEAA recipients, over 50% of SEAA are. Four in
86%
five Hmong American students in the UC
89% system receive Pell Grants.
NHPI
74%
• Cambodian and Laotian American Pell Grant
recipients are more likely to graduate from a
87%
Total Population UC University than non–Pell Grant students.
82%
87%
White
82% “If nobody before you
graduated, they can’t
83%
AIAN
77%
give you that support
to graduate.”
82%
Cambodian
86%
CAMBODIAN YOUNG MAN
from Can You See Me? School Culture
Latino 80% and Climate for California’s AAPI Youth
76%
Black / African American 77%
74%
Laotian 71%
79% *Undergraduate students who entered the University of
California as freshmen in 2010 and graduated by 2016
**Hmong 67% **Non-Pell Student data are not available
SOUTHEAST ASIAN AMERICAN JOURNEYS A NATIONAL SNAPSHOT OF OUR COMMUNITIES / 35CALIFORNIA HEALTH
Uninsured
By Race, Hispanic Origin, and Ethnic Group, California 2011–2015
SEAA Groups Race and Hispanic Origin Total Population • Southeast Asian Americans (SEAA) in
California are less likely to be insured
Latino 23% than average and Asian Americans as
a whole.
Cambodian 17%
• The percentage of uninsured has
Hmong 15%
decreased since the implementation
Laotian 15% of the Affordable Care Act. The largest
Total Population 15% decreases among SEAA were among
Cambodian Americans (21% to 15%)
AIAN 14%
and Laotian Americans (18% to 14%).43
SEAA 13%
• SEAA (33%) are more likely to
NHPI 13%
have public health insurance than
Black / African American 12% average (29%). Almost half of Hmong
Americans are enrolled in public health
Vietnamese 12%
insurance—a rate higher than all racial
Asian American 11% groups and other SEAA ethnic groups.44
White 8%
U.S. Census Bureau, 2011–2015 American Community Survey 5-Year Estimates, Table B27001.
“I am a survivor of Cambodian genocide. I have mental [health]
problems, diabetes, heart disease, high blood pressure, asthma,
and stomach problems. My overall health is not great because of
these health problems, but I am thankful to have health coverage.
If not, I wouldn’t be alive now.”
SEAA RESPONDENT
from Southeast Asian Americans Speak Out to Protect the Affordable Care Act and Medicaid Expansion
SOUTHEAST ASIAN AMERICAN JOURNEYS A NATIONAL SNAPSHOT OF OUR COMMUNITIES / 36CALIFORNIA HEALTH
Leading Causes of Death
By Ethnic Group, California 2017
ETHNIC GROUP NUMBER 1 CAUSE NUMBER 2 CAUSE NUMBER 3 CAUSE
Cambodian Cancer 22% Heart disease 19% Other 19%
Hmong Other 22% Heart disease 17% Cancer 15%
Laotian Cancer 23% Other 20% Heart disease 18%
Vietnamese Cancer 28% Heart disease 18% Other 17%
California Department of Public Health, Tabulated California Vital Records Data, 2017.
• Heart disease, cancer, and stroke are the top three causes of death in California.45
• Cancer and heart disease are the leading causes of death for SEAA in California. Agent Orange, a toxic herbicide
deployed in Southeast Asia during the Vietnam War, is a potential contributing factor to these cancer health
concerns for SEAAs today.
• One-quarter of deaths among SEAA are due to cancer. Eighteen percent of deaths among SEAA are from heart disease.
• Strokes are the fourth-leading cause of death across all SEAA ethnic groups.46
Community Spotlight
All of Maly’s family suffered from Post-Traumatic Stress Disorder (PTSD), and their sponsor didn’t
have the capacity to help and support them. Her father never talked about his work as a prominent
government official or the extent of his involvement with the CIA back home in Laos. Her father felt
alienated and struggled with severe PTSD after many years at a reeducation camp. He would patrol the
house with guns at night and put deadbolts on the door so that they couldn’t get in or out. He exhibited
aggressive behaviors and was verbally abusive, especially when he was intoxicated. Maly recounts that
her family became dysfunctional and incohesive, where every member was trying to figure out in their
own ways how to live in the United States.
MALY PHOMMAVONG
Sacramento, CA
SOUTHEAST ASIAN AMERICAN JOURNEYS A NATIONAL SNAPSHOT OF OUR COMMUNITIES / 37You can also read