TECHNICAL SPECIFICATIONS - MGP Ingredients
←
→
Page content transcription
If your browser does not render page correctly, please read the page content below

T EC H NIC AL
                         SPE CIFICATION S
WHEAT PROTEIN ISOLATES
TEC HNIC AL
 WHEAT PROTEIN ISOLATES
                            SPE CIFICATIONS

LET’S START SOMETHING
Call 866.547.2122 to learn more
about the many ways MGP can help
turn your ideas into reality.

MGP
100 Commercial Street
PO Box 130
Atchison, KS 66002-0130
sales@mgpingredients.com

MGPINGREDIENTS.COM

© 2020
TEC HNIC AL
WHEAT PROTEIN ISOLATES
                               SPE CIFICATIONS

TABLE OF CONTENTS

       ABOUT MGP                                                2
       PROTEIN TRENDS AND MARKET SIZE                           3
       WHEAT GLUTEN PROTEINS                                 3, 4
       WHEAT PROTEIN ISOLATES                                 4-6
       ARISE   ®
                   FAMILY OF WHEAT PROTEIN ISOLATES          6-10
       WHEAT PROTEIN/PULSE PROTEIN BLENDS                   11-12
       FUNCTIONALITY IN DOUGH SYSTEMS                       12-23
          – MIXOG RAPH                                      12-14
           – FARINOGRAPH                                    15-17
           – EXTENSOGRAPH                                   17-19
           – ALVEOGRAPH                                     19-21
           – KIEFFER EXTENSIBILITY TEST                     22-23
       PERFORMANCE IN BAKERY AND OTHER FOOD PRODUCTS        23-28
          – WHITE PAN BREADS                                23-24
           – WHOLE GRAIN BREADS                               24
           – HIGH-PROTEIN, HIGH-FIBER BREADS                25-26
           – FLOUR TORTILLA                                    26
           – LAYER CAKE                                        27
           – OTHER BREAD PRODUCTS                              28
        CASE STUDIES IN COMMERCIAL BAKERIES                 28-30
       		– SO URDOUGH BREAD                                    28
           – HAMBURGER BUNS                                   29
                   – ITALIAN BREAD                            29
                   – NATURAL SOURDOUGH BREAD                  29
                   – ENGLISH MUFFINS                        29-30
                   – HOT DOG BUNS                              30
           PASTA AND NOODLES                                30-33
              – PASTA                                       30-31
                   – NOODLES                                31-33
           PREDUST IN COATED FOODS                          33-35
       TABLES                                          APPENDIX A
       FIGURES                                         APPENDIX B
       BIBLIOGRAPHY                                    APPENDIX C
TEC HNIC AL
 WHEAT PROTEIN ISOLATES
                              SPE CIFICATIONS

AB O U T M G P

    Founded in 1941 in Atchison, Kansas, under the            functions and benefits for bakery and prepared foods,
original name of Midwest Solvents Company, but now            including processing improvements, moisture management,
MGP Ingredients Inc., the company has been serving            shelf-life extension, fiber fortification, calorie reduction, fat
the food and alcohol industry for nearly eight decades.       reduction and texture enhancement. The company sells its
Today, MGP, together with its subsidiaries, is a leading      products directly or through distributors to manufacturers
producer and supplier of premium distilled spirits and        and processors of finished packaged goods or to bakeries
specialty wheat proteins and starch food ingredients.         around the world.
It operates in two segments, Distillery Products and               MGP’s applications scientists work closely with our
Ingredient Solutions. The Distillery Products segment         sales team to provide technical support to customers by
provides food grade alcohol for beverage applications that    addressing specific needs and/or helping define the value
include bourbon and rye whiskeys, as well as grain neutral    and performance of our ingredients for targeted uses.
spirits, including vodka and gin; and food grade industrial   They are available to work directly with customers at their
alcohol, which is used as an ingredient in foods, personal    facilities or at our fully equipped, state-of-the-art Technical
care products, cleaning solutions, pharmaceuticals, and       Innovation Center to assist in the development of product
various other products. This segment also provides fuel       formulations. Meanwhile, our research scientists direct
grade alcohol for blending with gasoline and distillery       their expertise and resources toward the development and
co-products, such as distillers feed and corn oil.            refinement of new and innovative ingredients for the future.
     The Ingredient Solutions segment provides                     In short, we recognize that our customers want a
specialty wheat proteins and starch food ingredients          reliable partner who can effectively support their objectives
for use in a diverse range of food products. Through the      and boost product success. With our specialty ingredient
years, MGP has pioneered the development of these             solutions, decades of experience and technical know-how,
specialty food ingredients, resulting in a wide range of      we at MGP are equipped to meet customers’ needs.
superior ingredient solutions for a host of food product
applications. These solutions provide a multitude of

  2
P RO T E I N T R EN D S A ND MA R KET SI ZE

    In a 2017 consumer survey on the healthfulness of            The global protein ingredients market including
nutrients by the International Food Information Council      both animal and plant proteins is forecasted to grow
(IFIC) Foundation, protein from plant sources ranked         from $41.9 billion in 2017 to $65.3 billion by the end
4th as the most healthful nutrient behind whole grains,      of 2024, which is a compounded annual growth rate
fiber and vitamin D while animal protein ranked 9th.         (CAGR) of 6.54% (https://www.researchandmarkets.com/
The same survey in 2018 gave almost the same results         publication/m1l8n3l/4745820). The wheat protein market
except that animal protein was now ranked the 8th most       size is predicted to exceed $2.7 billion by 2024 according
healthful nutrient. In the 2019 IFIC survey, protein from    to Global Insights, Inc., which is a CAGR of 3% over the
plant sources jumped to the 3rd most healthful nutrient      period of 2017-2023 (https://www.researchandmarkets.
behind whole grains and fiber whereas animal protein         com/publication/m3wsrwa/4447288). The wheat-protein
lagged behind in 10th place. Predictably and riding on its   market is segmented into wheat gluten, wheat protein
perceived health halo, plant proteins (3rd) continued to     isolate, textured wheat protein and wheat protein
rank higher in healthfulness than animal proteins (9th) in   hydrolysate.
the 2020 food and health survey by IFIC.

WH E AT G L U T EN PR OTEI NS

     Proteins are diverse polymeric molecules that are       the assembling of primary metabolites. The amino acids
assembled fundamentally from 20 different “blocks”           that cannot be biosynthesized in an animal from primary
termed amino acids. Living organisms rely on proteins        metabolites must be present in the animal’s diet in
to carry out metabolic processes and to construct body       sufficient quantity to satisfy its metabolic needs. Those
parts. The primary structure of a protein at the molecular   amino acids are termed essential amino acids for that
level is a long chain of amino acids, usually numbering in   animal. On the other hand, non-essential amino acids
the hundreds, connected together in a unique sequence        are those which can be biosynthesized in an animal from
by peptide bonds. Protein chains can exhibit secondary       primary metabolites. The primary metabolites used by an
structure caused by weak but repetitive attractive forces    animal to biosynthesize non-essential amino acids arise
within or between chains leading to a helical chain or to    from ingested protein. For that reason, animals require
a collection of chains in a pleated-sheet arrangement.       a sufficient intake of protein to satisfy both its essential
Tertiary molecular structure of a protein occurs when a      and non-essential protein needs.
protein chain folds into a unique three-dimensional shape         Wheat is a major source of ingested protein for
in response to a multitude of weak attractive or repulsive   humans but, like rye and barley, it is deficient in two
forces, or to strong interconnecting bonds between chains.   essential amino acids when used as food. They contain
Finally, quaternary structure occurs when two or more        low levels of lysine (the first limiting amino acid) and
protein molecules associate together through physical        to a lesser extent, threonine (the second limiting amino
attraction to form a complex. The primary to quaternary      acid) when compared to World Health Organization
structural features of proteins explains how they are able   requirements of essential amino acids for humans.
to perform their diverse functions.
                                                                  In 1745, Giacomo Beccari, Professor of Chemistry at
    The proteins present in animals are assembled by         the University of Bologna, first reported the preparations
metabolic processes that begin with the ingestion of         of a water-insoluble protein fraction from wheat flour,
dietary protein in a food or feed. The ingested protein is   which he called “glutinis”. More than a century later,
digested to release amino acids, which are incorporated      Thomas Burr Osborne, a biochemist at the Connecticut
either directly by the animal into its body’s proteins, or   Agricultural Experiment Station, systematically classified
which are further broken down to give primary metabolites    proteins into groups on the basis of their solubility after
that are subsequently assembled into amino acids or          sequential extraction: albumins (water), globulins (dilute
other life-essential molecules. Animals are incapable of     salt), prolamins (alcohol-water mixtures), and glutelins
producing all 20 amino acids needed in their bodies by       (dilute acid or alkali).

                                                                                                                      3
TEC HNIC AL
 WHEAT PROTEIN ISOLATES
                               SPE CIFICATIONS

WH E AT G L U T EN PR OTEI NS 4 Co nt inue d

    To the current day, vital wheat gluten is still isolated        Wheat flour typically contains 8-18% protein
from wheat flour by a dough washing procedure in which          depending upon whether the class of wheat is soft, hard
the gluten agglomerates into low-density particles in           or durum. The majority of protein occurring in wheat
an aqueous slurry of wheat starch. In rheology terms,           kernels is storage protein that forms a continuous matrix
hydrated wheat gluten is termed a viscoelastic substance,       surrounding wheat starch granules. The strength of
where elasticity is the property of a solid that deforms        association between the matrix protein in a wheat kernel
instantly upon application of stress and returns to its         and its starch granules is correlated with grain hardness.
original shape instantly upon removal of that stress, and       Of the total protein in wheat flour, 75-80% represent
where viscosity is the property of a fluid which flows          gluten-forming proteins consisting of about one-half
instantly upon application of a stress and which does not       of gliadins (monomeric proteins) and the other half of
return to its original shape upon removal of the stress. A      glutenins (polymeric proteins) as shown by size-exclusion
precise balance between these two properties in a wheat         chromatography (Fig. 1).
dough is necessary in the production of quality yeast-               The gliadin fraction is not a singular protein but
leavened bakery products. The viscoelastic property             comprised of structurally different groups called α-, β-,
of wheat gluten allows the forming of a continuous              γ-and ω-gliadins with molecular weights ranging from
dispersed network of protein in a dough that retains gas        30,000-74,000 daltons (Fig. 1). The glutenin fraction is
bubbles and rises, giving volume to bread, and which            comprised of individual polypeptides or subunits that
provides after baking a soft crumb texture that is unique       are linked together by inter-molecular disulfide bonds to
and cannot be duplicated by other animal- or plant-based        form a macro-protein molecule of extraordinarily high
proteins.                                                       molecular weight. When treated with a suitable reducing
    Wheat gluten is classically divided into two                agent to cleave the disulfide bonds, the glutenin proteins
functionally significant fractions: glutenin, insoluble in      can be separated into low-molecular weight glutenin
alcohol-water mixtures, and gliadin, soluble in alcohol-        subunits (80%) with molecular weights of 30,000-55,000
water mixtures. The elastic property of wheat gluten is         daltons and high-molecular weight glutenin subunits
due to the glutenin fraction, while the viscous property        (20%) with molecular weights of 80,000-160,000 daltons.
(plasticity and extensibility) of dough is due to the gliadin   The low-molecular weight glutenin subunits can be
fraction. The relative proportions of gliadin and glutenin      classified further according to composition, size and
found in gluten affect dough properties; an increased           isoelectric points into B-, C-, and D-type subunits.
proportion of glutenin imparts increased dough strength.        The high-molecular weight glutenin subunits form a
Highly elastic doughs are crucial for bread making,             distinct group and are classified into two types; a higher
especially hearth breads, whereas extensible doughs are         molecular weight (83,000-88,000 daltons) x-type and a
essential for making crackers and cookies. The strength/        lower molecular weight (67,000-74,000 daltons) y-type.
extensibility requirements of doughs for tortillas, flat
breads, and wheat-salt noodles fall between those
extremes.

WH E AT P R O T EI N I SOLATES

     Wheat is an economical source of nutritionally                 The U.S. Food and Drug Administration’s (FDA) Code
important macronutrients including protein and                  of Federal Regulations defines wheat gluten (CAS Reg. No.
carbohydrate (dietary fiber and food energy) as well            8002-80-0) as the principal protein component of wheat
as several micronutrients and bioactive substances.             and consisting mainly of gliadin and glutenin (21 CFR
Although frequently regarded as a source of calories,           184.1322). Wheat gluten is obtained by hydrating wheat
wheat also provides significant amounts of protein to           flour and mechanically processing the sticky mass to
the diet. The three principal amino acids of wheat gluten       separate the wheat gluten from the starch and other flour
are glutamine, proline and leucine (Table 1, Appendix           components.
A). Isolated wheat starch and gluten (protein) and their           By comparison, wheat gluten is defined in the Food
modified or specialty versions are standard ingredients in      Chemicals Codex as the water-insoluble protein complex
the food industry today.

  4
Molecular Weight Distribution of Wheat Gluten Proteins
Figure 1. Molecular weight distribution of wheat gluten proteins by SEC-HPLC and composition of the protein fractions.
                                       (by SEC-HPLC and composition of the protein fractions)
mAU

                                                                           8.338

                                                                              .2
                                                                           78
                                                                         40
                                                                       :5
1400

                                                                     ea
                                                                                        Glutenins

                                                                   Ar
                                                                                        Low-molecular weight glutenin subunits, 30-55 kDa
1200                                                                                       B-type subunit
                                                                                           C-type subunit
                                                                                           D-type subunit
1000                                                                                    High-molecular weight glutenin subunits, 80-160 kDa
                                                                                           x-type, 83-88 kDa
 800                                                                                       y-type, 67-74 kDa
                                                            3.2
                                               5.430

                                                        54
                                                       48

                                                                                        Gliadins
                                                       a:

 600
                                                    e
                                                 Ar

                                                                                           α - gliadins, 30-45 kDa
                                                                                           β - gliadins, 30-45 kDa
 400                                                                                       γ - gliadins, 30-45 kDa
                                                                                           ω - gliadins, 46-74 kDa
 200

     0

                       2             4                 6          8            10            12             14           16        18         min
              Left side: Polymeric Proteins (Glutenins) | Right side: Monomeric Proteins (Gliadins)

obtained by water extraction of wheat or wheat flour. It                               A product derived from wheat gluten is wheat protein
is described as a cream to light-tan, free-flowing powder,                         isolate that has dual descriptions in the Food Chemicals
and is considered to be soluble in alkalies and partly                             Codex. First, it is produced by acidic deamidation of
soluble in alcohol and dilute acids. Its protein content                           gluten that converts glutamine and asparagine in the
is not less than 71%, calculated on dry basis. Vital                               protein to their nonaminated derivatives, glutamic
wheat gluten, the term commonly used in the baking                                 acid and aspartic acid, followed by several purification
industry, is characterized by high viscoelasticity when                            measures. Second, it is produced by solubilization of
hydrated, whereas devitalized wheat gluten has lost this                           gluten in an acidic or alkaline medium, and the dissolved
characteristic due to denaturation by heat or treatment                            protein is then separated and purified by filtration or
with a solvent.                                                                    centrifugation. The protein content is not less than
     Vital wheat gluten is also described under Codex                              75%, calculated on dry basis and using a nitrogen-to-
standards for Wheat Protein Products (CODEX STAN 163-                              protein conversion factor of 5.7. The patent literature
1987, Rev. 1-2001). Vital wheat gluten is characterized                            shows some methods and processes for the production
by its property of high viscoelasticity in a hydrated state,                       of wheat protein isolate as described in U.S. Patent
whereas devitalized wheat gluten is characterized by its                           8309152, U.S. Patent 8551544, and U.S. Patent 8758845.
reduced property of viscoelasticity when hydrated due to                           Other inventive processes are described in U.S. Patent
denaturation. The protein content of each is reported to                           Application Publication Numbers US20140142285A1,
be 80% or higher on a dry weight basis using a factor of N                         US20150250204A1, US20190142049A1, and
x 6.25.                                                                            US20190142029A1.

                                                                                                                                                    5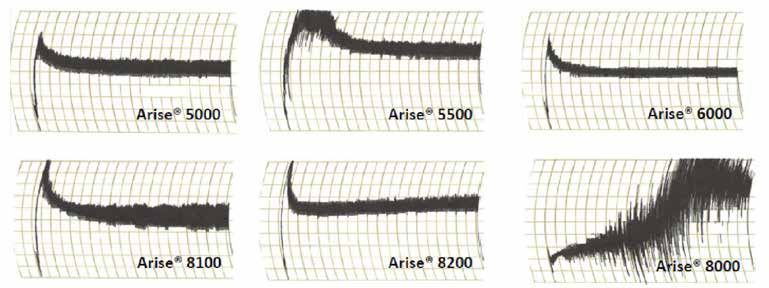
TEC HNIC AL
 WHEAT PROTEIN ISOLATES
                               SPE CIFICATIONS

WH E AT P R O T EI N I SOLATES

    The properties and functionality of wheat gluten           potassium bromate, potassium iodate, ascorbic acid, and
(protein) can be altered to suit its intended end-use          azodicarbonamide or glucose oxidase results in oxidation
applications. Relevant methods of protein modification         of sulfhydryl groups in wheat protein to form disulfide
applicable to wheat proteins and other protein sources         cross-links. Cross-linking/oxidation of a wheat dough
include partial and progressive protease hydrolysis, acid      produces a strengthening effect, whereas reduction
modification (deamidation), cross-linking, and oxidation/      of disulfide cross-links in gluten protein decreases the
reduction reactions.                                           strength of a dough. The reduction of disulfide cross-
    Partial protease hydrolysis of gluten results in an        links by addition of L-cysteine, glutathione, yeast, yeast
increase of water solubility, improvement of moisture          extract or sodium bisulfite not only breaks disulfide cross-
absorption and water binding, improvement of                   linkages but also releases free sulfhydryl groups that
emulsifying properties, and an increase in foam stability.     can further weaken a dough through disulfide-sulfhydryl
On the other hand, progressive protease hydrolysis             interchange reactions on gluten proteins.
leads to the formation of an increasing level of bitter        The reduction reaction on gluten proteins leads to
peptides as a result of the exposure of hydrophobic            increased dough extensibility.
amino acid residues near the carboxyl terminal in the               As an aside, the “L” in L-cysteine specifies the exact
polypeptide products. Complete acid hydrolysis of              3-dimensional shape of its molecule. A cysteine molecule
proteins to amino acids is accomplished by treatment           exists in two shapes that are mirror images of each other,
with a high concentration of hydrochloric acid at high         like one’s left and right hands. Naturally-occurring amino
temperature. Also at a high temperature, but with a            acids are almost universally the L-form. Un-natural
relatively low concentration of hydrochloric acid, gluten      D-amino acids are misshaped biologically and fail to
protein undergoes deamidation, a modification reaction         perform almost all biological functions.
which converts glutamine and asparagine residues in                The sulfhydryl groups and disulfide bonds in wheat
the polypeptide chain to glutamic acid and aspartic acid,      flour proteins are involved in oxidation-reduction
respectively.                                                  reactions and in interchange reactions that have
    The transglutaminase enzyme catalyzes the                  significant effects on the structure of gluten proteins.
cross-linking of proteins through the formation of             Thus, they play an important role in dough rheology and
intra- and inter-molecular bonds between glutamine             breadmaking. The baking industry traditionally relies
and lysine residues. Treatment with oxidants like

ARI SE ® FA M I LY OF WH EAT PR OTEI N I SOL AT E S

on chemical-based dough strengtheners (oxidants) and           L-cysteine is used in baking operations especially in high-
relaxers (reducing agents). Examples of these oxidants are     speed baking to adjust for flour variation, reduce mixing
ascorbic acid (vitamin C), potassium bromate, potassium        time, lower energy input, improve machinability, enhance
iodate, and azodicarbonamide, whereas the reducing             loaf volume, and to increase throughput.
agents are sodium bisulfite, L-cysteine, glutathione,              Due to the clean label trend, consumers are
yeast, yeast extracts, sorbic acid and fumaric acid among      expressing aversion to chemical additives and are
others. Dough relaxers (or reducing agents), which break       preferring “natural” ingredients. The Arise® family
disulfide bonds, are added to wheat-based doughs to            of wheat protein isolates were developed to function
improve its extensibility, sheeting properties and overall     as protein-based dough relaxers (and sometimes as
machinability.                                                 strengtheners) with similar functionalities as L-cysteine,
      L-cysteine is a unique amino acid because it has a       glutathione, yeast, and yeast extracts (non-leavening
sulfhydryl group at the end of the molecule. Currently,        yeast). MGP Ingredients Inc. produces six types of wheat
it is available commercially from a vegan, non-GMO             protein isolates, namely Arise® 5000, Arise® 5500,
source. It is a reducing agent (i.e. cleaves disulfide bonds   Arise® 6000, Arise® 8000, Arise® 8100, and Arise®
in proteins) and belongs to a type of dough conditioner        8200. They are all certified non-GMO Project Verified
used to reduce mixing time and improve extensibility.

  6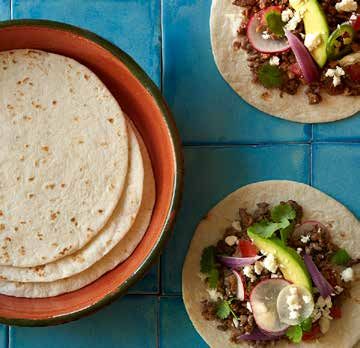
and their contrasting properties are shown in Table                                 The appearance of hydrated Arise® 5000 is shown in Fig.
2. Their nutritional contributions per 100 grams are                                3 depicting its sticky, cohesive and extensible properties.
displayed in Table 3 (Appendix A). These wheat protein                              Due to its low pH (4.0-4.5) when hydrated in excess water,
isolates can be used in conventional or high-protein                                Arise® 5000 becomes dispersible/soluble in water. It is
dough formulations to obtain desirable relaxation or                                sulfite-treated and its protein content is equal to or more
strengthening properties. All are available as a light                              than 90% (N x 6.25, dry basis). Similar to wheat gluten,
tan powder with 85-90% or more protein content and                                  the major amino acids of Arise® 5000 are glutamine,
with neutral or slightly acidic pH. When viewed under a                             proline and leucine (Table 4).
scanning electron microscope, Arise® 5000 and Arise®                                    Arise® 5500 is similar in its production process and
6000 demonstrate irregular shapes of their particles with                           functional properties as Arise® 5000 except the drying
a wide distribution of sizes whereas Arise® 5500 appears                            step in Arise® 5500 leads to a heavier bulk density of its
to also have a distribution of sizes, but with a dense                              dried powder. Its pH, protein content and extensibility
3-dimensional shape (Fig. 2).                                                       properties when hydrated are comparable to Arise® 5000
    Arise® 5000, when hydrated, displays the most                                   (Fig. 3).
extensible and the least elastic properties (Table 2).

Figure 2. Appearance of Arise® 5000, Arise® 5500 and Arise® 6000 when viewed under a scanning electron microscope at 2000X magnification.

Table 2. Comparison of properties of the different Arise® wheat protein isolate products.

     Wheat Protein Isolate              Treatment            Protein, % (N x 6.25, d.b.)        pH                           Hydrated Properties
     Arise 5000
         ®
                                          Sulfite                      ≥90%                   4.0-4.5                            Most extensible
     Arise® 5500*                         Sulfite                      ≥90%                   4.0-4.5                            Most extensible
     Arise 6000
         ®
                                          Sulfite                      ≥85%                    6.2-7.0          Less extensible than Arise® 5000 and Arise® 5500
     Arise® 8000                           None                        ≥90%                   6.0-7.0                              Most elastic
     Arise® 8100                         L-Cysteine                    ≥90%                   4.0-4.5          Similar extensibility as Arise® 5000 and Arise® 5500
     Arise® 8200                         L-Cysteine                    ≥85%                    6.2-7.0                  Less extensible than Arise® 8100

*The production of Arise® 5500 is similar to Arise® 5000 except for the different drying conditions of the former resulting in higher particle density.

                                                                                                                                                                 7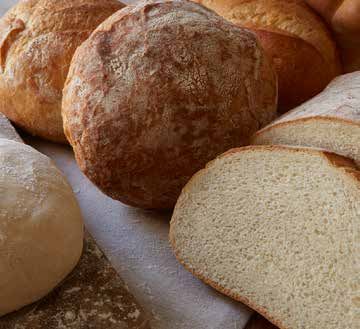
TEC HNIC AL
 WHEAT PROTEIN ISOLATES
                                  SPE CIFICATIONS

ARI SE ® FA M I LY OF WH EAT PR OTEI N I SOL AT E S 4 Con tin u ed

                                                                of wheat protein is accomplished with a non-GMO
                                                                L-cysteine that is derived by fermentation of a vegan
      Key Points of Arise® 5000:
                                                                substrate. L-cysteine-treated Arise® 8100 is the clean
      • Decreases dough mix time                                label equivalent of sulfite-treated Arise® 5000. It has
                                                                similar pH, protein content and extensibility properties
      • Causes slackening effect on the dough out of            compared to that of Arise® 5000 and Arise® 5500 (Fig. 3).
        the mixer, but dough recovers to optimum at the
        make-up stage                                               L-cysteine-treated Arise® 8200 is the clean label
                                                                equivalent of sulfite-treated Arise® 6000. Its protein
      • Increases dough extensibility                           content is equal to or more than 85% (N x 6.25, dry basis)
                                                                with pH near neutral. It has extensibility and elasticity
      • Increases dough machinability                           properties comparable to Arise® 6000 (Fig. 4).
      • Increases bread volume                                       The extensibility and elasticity properties of hydrated
                                                                Arise® 5000, Arise® 5500, Arise® 6000, Arise® 8000,
      • Produces internal structure (grain) and crumb           Arise® 8100 and Arise® 8200 are compared to vital
        firmness comparable to the control bread
                                                                wheat gluten schematically in Fig. 6. The curves in
      • Reduces microwave-induced toughness of pup              Fig. 7 depict some significant and subtle differences in
        loaf bread                                              mixing characteristics of these six Arise® wheat protein
                                                                isolates. Except for Arise® 8000, the other five Arise®
      • Results in donut size and cell structure                protein isolates show rapid hydration attaining a peak
        comparable to the control donut
                                                                (i.e. point of minimum mobility) in about a minute or
      • Reduces pastiness of buttermilk bisquits without        less. The hydrated properties of Arise® wheat protein
        adding toughness                                        isolates as determined on several dough-rheology testing
                                                                instruments are reported in this booklet under the
      • Increases flour tortilla diameter and rollability       section on Functionality in Dough Systems.
        scores

      • Improves shelf-life of flour tortillas

      •	Improves overall bread score and crumb softness            Key Points of Arise® 6000:
         of frozen doughs
                                                                    • Increases dough extensibility
      • Non-GMO Project Verified
                                                                    • Increases water absorption

    When hydrated, Arise® 6000 demonstrates less                    • Decreases dough mixing time
extensible and medium elastic properties (Fig. 4) than              • Increases loaf volume of bread
Arise® 5000 and Arise® 5500. It is sulfite-treated and its
protein content is a minimum of 85% (N x 6.25, dry basis).          • Causes slackening effect on the dough out of
Upon hydration, the pH of Arise® 6000 is about neutral.               the mixer, but dough recovers to optimum at the
                                                                      make-up stage
     Arise® 8000 is a high-purity wheat protein isolate
with no intentionally incorporated additives and                    • Produces internal structure (grain) and crumb
containing a minimum of 90% protein (N x 6.25, dry                    firmness comparable to the control bread
basis). It is the most elastic protein (Fig. 5) of the Arise®
                                                                    • Increases firmness of pasta
series, acts as a dough strengthener, and is suitable for
clean label applications. The hydrated pH of Arise® 8000            • Replaces egg whites in pasta formulations
is approximately neutral.
                                                                    • Increases flour tortilla diameter and rollability
    Clean label versions of Arise® 5000 and Arise® 6000               scores
were developed by eliminating the sulfite treatment and
instead treating with L-cysteine from a vegan, non-GMO              • Improves shelf-life of flour tortillas
source. The safe use of L-cysteine in foods is described
in 21 CFR 172.320. Modification of the properties                   • Non-GMO Project Verified

  8
Figure 3. Appearance of hydrated Arise® 5000, Arise® 5500 and Arise® 8100
showing its sticky, cohesive and extensible properties (1 part Arise® to 2 parts water).
Figure 4. Appearance of hydrated Arise® 6000 and Arise® 8200 showing less Figure 5. Appearance of hydrated Arise® 8000 showing its elastic
extensible, medium elastic properties (1 part Arise® to 2 parts water). properties (1 part Arise® 8000 to 2 parts water).
Table 4. Amino acid composition of Arise® 5000.
Amino Acid %
Aspartic Acid 2.55 Key Points of Arise® 5500:
Threonine 1.92 • Highest particle density of all Arise® wheat
Serine 3.53 protein isolates
Glutamic Acid 31.78 • Ease of handling and less prone to dustiness
Proline 10.39
• Increases dough extensibility
Glycine 2.67
Alanine 2.03 • Decreases dough mix time
Valine 3.01 • Comparable baking performance as Arise® 5000
Isoleucine 3.02
• Non-GMO Project Verified
Leucine 5.55
Tyrosine 2.73
Figure 6. Comparative ranking of the extent of extensibility and elasticity
Phenylalanine 4.13 of six Arise® wheat protein isolates and vital wheat gluten.
Lysine 1.90
Arise® 5000 Arise® 6000 Vital Wheat Gluten Arise® 8000
Histidine 1.71 Arise® 5500 Arise® 8200
Arise® 8100
Arginine 2.62
Elasticity
Cysteine 1.97
Methionine 1.31
Extensibility
Tryptophan 0.16
9TEC HNIC AL
WHEAT PROTEIN ISOLATES
SPE CIFICATIONS
ARI SE ® FA M I LY OF WH EAT PR OTEI N I SOL AT E S 4 Con tin u ed
Figure 7. Mixing curves* of the different Arise® wheat protein isolate products.
*Wheat Protein Isolate : Wheat Starch : Water ratio during the mixograph test:
Arise® 5000 – 5:5:5
Arise® 5500 – 5:5:5
Arise® 6000 – 5:5:6.7
Arise® 8100 – 5:5:5
Arise® 8200 – 5:5:6.7
Arise® 8000 – 2.9:7.1:8.6
Typical molecular weight distributions of wheat Figure 8. Molecular weight distribution profile by SEC-HPLC of vital wheat
protein isolates compared to vital wheat gluten are gluten and wheat protein isolates.
displayed in the SEC-HPLC curves in Fig. 8. Compared to Arise® 5000
vital wheat gluten, Arise® 5000 demonstrates a reduction 500 Wheat Protein Isolate
(Experimental Sample)
of the polymeric glutenin proteins and an increase of low
Vital Wheat Gluten
molecular weight glutenin proteins.
400 Vital
MGP’s vital wheat gluten and all six Arise® wheat
Absorbance, 214mm
Wheat
protein isolates are certified as Non-GMO Project Verified. Gluten
GMO stands for genetically modified organism. The Non- 300 Wheat
GMO Project, a non-profit organization, offers North Protein
Isolate
America’s only third- party verification and labeling for (Experimental Sample)
non-GMO food and food ingredients. This organization 200 Arise®
verifies products with the goal of preserving and building 5000
the non-GMO food supply and educating consumers on
100
their non-GMO choices.
Wheat (gluten) protein is unique as it is the only
plant-based protein capable of forming a viscoelastic 0
dough upon hydration capable of trapping leavening
gases, supporting gas cells, giving volume to bread 0 5 10 15 20 25 30
and providing a soft spongy texture. Pulse grains from Retention Time (minutes)
pea, lentil, bean and chickpea contain high amounts of
protein, and a pulse protein gives benefits when mixed
10WH E AT P R O T EI N/ PULSE PR OTEI N BLENDS
with wheat protein even though pulse protein is devoid combination of wheat and pea proteins may possibly
of strong elastic properties. Pulses provide a sustainable have some synergies that exhibits special functional
source of gluten-free protein that contains a balanced properties.
amino acid composition. A mixture of pulse and wheat A mixture of wheat protein and pea protein
proteins gives a product with improved nutritional value isolates from four commercial sources showed mixing
compared to either protein alone. The amino acids deficient characteristics (Fig. 9) quite different compared to those
in gluten for humans are bolstered by those in pulse protein of Arise® wheat protein isolates alone (Fig. 7). This
and vice versa, which is described as the complementary protein blend free of processing aids exhibits a rapid rise
effect of blending. In one particular mixture, wheat and in its mixing curve to reach a peak followed thereafter by
pea differ in composition and functional properties a stable curve. Subtle differences in the appearance of the
of their proteins and their protein fractions. Based on mixing curve were observed depending on which of the
Osborne’s solubility fractionation, wheat protein is four sources of the pea protein isolate was being tested.
primarily comprised of 45% glutelins (glutenins) and 40% A similar trend in mixing characteristics was observed
prolamins (gliadins) with minor amounts of albumins with a mixture of specialty wheat protein and pea protein
(5%) and globulins (10%). By contrast, pea protein’s major isolate (Fig. 10). These curves appear smoother with less
components are 49-70% globulins (legumin and vicilin) and wild swings compared to protein blends shown in Fig. 9.
15-25% albumins with lower amounts of glutelins (11%) Such interesting functional properties of a wheat/pea
and prolamins (5%). Due to these compositional differences protein blend are in addition to the enhanced nutritional
that lead to nutritional benefits, it is interesting that a
Figure 9. Mixing curves* of wheat protein/pea protein isolate mixtures. Figure 10. Mixing curves* of specialty wheat protein/pea protein
isolate mixtures.
*Sample : Wheat Starch : Water ratio for mixograph test is 5:5:6.7
*Sample : Wheat Starch : Water ratio for mixograph test is 5:5:6.7
Table 5. Mixing characteristics of wheat protein/pulse protein blends and specialty wheat protein/pulse protein blends.
Blend Mixing Time, min. Mixing Resistance at the Peak, M.U. Mixing Resistance after 10 min., M.U.
Wheat Protein/Pea Protein Isolate 1.0* 7.8* 5.8*
Wheat Protein/Lentil Protein 0.5 9.0 6.8
Wheat Protein/Faba Bean Protein 0.8 8.0 6.7
Wheat Protein/Pea Protein Concentrate 1.5 7.2 6.0
Specialty Wheat Protein/Pea Protein Isolate 0.9* 7.5* 6.3*
Specialty Wheat Protein/Lentil Protein 1.0 6.2 6.2
Specialty Wheat Protein/Faba Bean Protein 0.8 6.5 5.5
Specialty Wheat Protein/Pea Protein Concentrate 1.0 6.5 5.6
*Average data from four sources of pea protein isolates
11TEC HNIC AL
WHEAT PROTEIN ISOLATES
SPE CIFICATIONS
WH E AT P R O T EI N/ PULSE PR OTEI N BLENDS 4 Con tin u ed
value resulting from improved amino acid composition of Due to its lower protein content, the blend of pea protein
the blend. concentrate exhibited a weaker mixing curve compared to
Four pulse proteins were each blended with that of pea protein isolate as indexed by mixing resistance
wheat protein or specialty wheat protein to determine at the peak. Faba bean protein has a strong mixing
their effects on dough mixing characteristics using a resistance at the peak when blended with wheat protein
mixograph (Table 5). In general, pea protein isolates in than when it is blended with specialty wheat protein.
admixture with wheat protein or specialty wheat protein The most stable mixing curve was displayed by a blend of
generated a strong, stable mixing curve. A rapid rise to specialty wheat protein and lentil protein exhibiting no
reach the peak was observed among the samples with the change in mixing resistance from the peak to the end of
wheat protein/lentil protein blend exhibiting the fastest mixing after 10 min.
rise and also the highest mixing resistance at the peak.
F U N C T I O N A L I T Y I N DOUGH SY STEMS
Protein quality is one of the most important thixotropic behavior, which is a consequence of
characteristics of a flour, which in turn depends on its complex structure wherein starch granules are
protein quantity and composition. Protein quality, for surrounded by a three-dimensional protein network.
example, in a flour used in a yeast-leavened product is Wheat gluten is the viscoelastic protein responsible for
responsible for the formation of the crumb’s framework dough structure formation.
structure. When the term “protein quality” is used in Protein quality of a wheat flour and the influence
conjunction with bakery flour, it actually means “gluten of additives on dough behavior are oftentimes
quality.” Strong gluten-quality is normally associated estimated using rheological instruments. Examples
with hard wheat flours used in bread and roll production, of these instruments are the mixograph, farinograph,
whereas weak gluten quality is displayed by soft wheat extensograph, alveograph, and texture analyzer, which are
flours used in cakes and pastries. Flour or protein quality commonly used in flour and dough testing laboratories
is best defined in terms of its intended end-use and the of many universities and bakeries. They measure
bake test remains the “gold standard” for determining mixing time (peak time), resistance to mixing (dough
flour quality, or the effect of an additive. strength), tolerance to over mixing, water absorption,
The science of rheology studies the deformation stability, mixing tolerance index, resistance to extension,
and flow of matter in response to an applied stress. extensibility, and deformation energy.
A viscoelastic dough exhibits shear-thinning and
MIX O G R A P H
The mixograph is an instrument that measures and The addition of 1%, 3%, and 5% Arise® 5000 to
records the resistance of a dough to mixing. The mixing wheat flour progressively decreased dough mixing time
curve indicates optimum water absorption of a flour as illustrated in Fig. 12. Arise® 6000 exhibited the same
to produce a bread dough, optimum development or mixing time reduction (Fig. 13, Appendix B), whereas
mixing time of the dough, and resistance to mixing, an vital wheat gluten gave no reduction in dough mixing
indicator of dough strength. The mixograph is often used time (Fig. 14, Appendix B). Arise® 5500 with heavier
on a mixture of flour and water, but it has been used to bulk density than Arise® 5000 displayed a similar trend in
study the effects of added ingredients on dough mixing reduction in mixing time, but the reducing effect is less
properties. A typical mixing curve called a mixogram pronounced (Fig. 15, Appendix B)
is depicted in Fig. 11 (Appendix B) for a bread flour
sample.
12Resistance to mixing appears to be unaffected by the The mixograph results presented in Table 7
addition of Arise® 8000 to wheat flour. However, it tends (Appendix A) were from a published university study that
to increase mixing time by 0.5-1.0 min especially at higher used three wheat flour samples: a pastry flour (unbleached
levels of incorporation (3-5%) (Fig. 16). L-cysteine-treated flour), a tortilla flour (bleached, enriched, and malted
Arise® 8100 decreased mixing time by 1-2 minutes at higher flour), and a bread flour (bleached bakers-enriched flour
levels of incorporation (3-5%) with insignificant effect on containing malted barley flour, niacin, iron, thiamin
resistance to mixing (Fig. 17). A smaller decrease in mixing mononitrate, riboflavin, and folic acid). Compared to
time (1.0-1.5 min) was observed when Arise® 8200, also just flour itself, the addition of 3% Arise® 5000 or Arise®
L-cysteine treated, was added at 1-5% level (Fig. 18). 6000 consistently decreased mixing time, whereas 3%
Arise® 5000 and Arise® 5500, with similar properties vital wheat gluten increased mixing time for the bread
except for the heavier particle-density of the latter, were flour but decreased mixing time for the pastry and tortilla
added to wheat flour at 1.0-2.0% level to test their effect on flours. All three protein additives increased the resistance
mixing time (Table 6). Both Arise® wheat protein isolates to mixing (height of the mixing curve) of the pastry and
reduced mixing time by 1.0-1.5 minutes compared to the tortilla flours, but the effect on bread flour was generally
control wheat flour with no added wheat protein isolate. inconsistent.
Figure 12. Effect on mixograph curve of wheat flour after adding 1%, 3% or Figure 16. Effect on mixograph curve of wheat flour after adding 1%, 3% or
5% of Arise 8000. 5% of Arise 8000.
13TEC HNIC AL
WHEAT PROTEIN ISOLATES
SPE CIFICATIONS
F U N C T I O N A L I T Y I N DOUGH SY STEMS 4 Con tin u ed
Figure 17. Effect on mixograph curve of wheat flour after incorporating 1%, Figure 18. Effect on mixograph curve of wheat flour after incorporating
3% or 5% of Arise® 8100. 1%, 3% or 5% of Arise® 8200.
Table 6. Effect on mixing time of adding 1.0%, 1.5% or 2.0% of Arise® 5000
Key Points of Arise® 8000: or Arise® 5500 in wheat flour.
• Clean label (no added processing aids) Protein Source Mixing Time, min.
• Highly concentrated source of protein, Control Wheat Flour (No Additive) 4.5
averaging ~94% (d.b.) Arise 5000
®
1.0% 3.2
• High viscoelasticity when hydrated
1.5% 3.5
• Strengthens dough 2.0% 3.0
• Increases resistance to mixing Arise 5000
®
1.0% 3.2
• Increases resistance to dough extension
1.5% 3.2
• Non-GMO Project Verified 2.0% 3.2
14FA RI NO G R A P H
A farinograph measures and records the mechanical mixing time accompanied by lower Stability and increased
resistance of a dough during mixing and kneading. The MTI when compared to control wheat flour with no added
parameters measured in a farinograph curve (farinogram) Arise® wheat protein isolate (Table 9).
are the following: Water Absorption (ml) – the amount of Farinograph curves were run on wheat flour with
water necessary to center the farinograph curve on the 1.0%, 1.5% and 2.0% of Arise® 5000 or Arise® 6000 added
500 B.U. line; Dough Development Time or Mixing Time to the flour. The results indicated that as the level of
(min) – time duration to the nearest half minute initiated addition increased, dough absorption increased (Table
by the addition of water to a flour and terminated by the 10), while farinograph Stability value decreased and
development of the maximum consistency of a dough; MTI value increased with the addition of either of those
Mixing Tolerance Index or MTI (B.U.) – the difference two Arise® ingredients. While the peak time tended
in B.U. from the top of the curve at the peak to the top to decrease with the addition of either Arise® 5000 or
of the curve measured 5 min after the peak is reached; Arise® 6000, the decrease was not directly correlated
Stability (min) – difference in time to the nearest half to the level of Arise® added. These farinograph results
minute between the time where the top of the curve first are indicative generally of a reducing action on dough
intercepts the 500 B.U. line and the time where the curve protein.
leaves the 500 B.U. line. Farinograph Stability indicates
the tolerance of the dough to mixing. MTI also relates The dough properties of another wheat flour with 1.0-
to tolerance to mixing and can be related to Stability. A 2.0% added Arise® wheat protein isolate or wheat gluten
dough with a good tolerance to mixing will have a high were examined using the mixograph and farinograph
Stability value in minutes, but a low MTI value in BU units. instruments (Table 11). Mixing time (peak time) in both
A typical farinogram for wheat flour is illustrated in Fig. instruments was reduced by Arise® 5000, Arise® 5500 and
19 (Appendix B). Arise® 6000 compared to the control flour. Farinograph
Stability value was generally decreased while water
Four different production samples of Arise® 5000 absorption and MTI were generally increased by addition
at a 1.5% level of addition were compared for their of the three previously-mentioned wheat protein isolates.
effects on farinograph parameters of a wheat flour. The Wheat gluten and Arise® 8000 tended to have comparable
data presented in Table 8 (Appendix A) shows that mixograph and farinograph mixing properties at 1.0-2.0%
Arise® 5000 has the general effects of increasing dough incorporation level. Compared to the control flour, both
absorption, decreasing dough development time (i.e. of those protein products produced higher farinograph
mixing time), increasing the value reported for Mixing water absorption and Stability values, but tended to have
Tolerance Index (MTI), and decreasing the Stability value. a decreased MTI value.
At the same level of incorporation (1.0-2.0%) in wheat
flour, Arise® 5000 and Arise® 5500 exhibited a shorter
Table 9. Impact of adding 1.0%, 1.5% or 2.0% of Arise® 5000 or Arise® 5500 on farinograph quality of wheat flour.
Protein Source Peak Time, min. Stability, min. Mixing Tolerance Index, B.U.
Control Wheat Flour (No Additive) 5.9 13.0 29
Arise 5000
®
1.0% 4.8 9.2 39
1.5% 5.3 10.1 35
2.0% 4.8 9.6 34
Arise® 5500
1.0% 5.0 9.2 34
1.5% 4.6 8.0 36
2.0% 4.4 6.2 46
15TEC HNIC AL
WHEAT PROTEIN ISOLATES
SPE CIFICATIONS
F U N C T I O N A L I T Y I N DOUGH SY STEMS 4 Con tin u ed
FARI N O G R A P H 4 Co ntinue d
Table 10. Effects of level of addition of Arise® 5000 or Arise® 6000 on farinograph quality of wheat flour.
Ingredients Absorption, % Peak Time, min. Stability, min. MTI, B.U.a
Control 61.0 6.5 14.75 30
1.0% Arise 5000
®
63.0 5.5 10.00 40
1.5% Arise® 5000 64.0 5.0 8.50 50
2.0% Arise 5000
®
65.0 5.5 6.75 55
1.0% Arise 6000
®
63.0 5.5 10.00 35
1.5% Arise® 6000 64.0 6.5 7.75 50
2.0% Arise® 6000 64.5 6.0 7.25 60
MTI, B.U. = Mixing Tolerance Index, Brabender Units
a
16Table 11. Comparison of mixograph and farinograph quality of wheat flour at different levels of addition of wheat gluten or Arise® wheat protein isolates.
Mixograph Farinograph
Protein Source Level Peak Time min. Water Abs. % Peak Time min. Stability min. MTI* BU
Control Wheat Flour (No Additive) 0 4.50 57.3 5.9 13.0 29
Wheat Gluten 1.0 4.25 58.4 5.0 17.3 30
1.5 4.00 58.5 5.3 14.9 19
2.0 5.00 59.8 7.4 24.4 15
Arise 5000
®
1.0 3.20 58.9 4.8 9.2 39
1.5 3.50 59.6 5.3 10.1 35
2.0 3.00 59.6 4.8 9.6 34
Arise 5500
®
1.0 3.10 59.7 5.0 9.2 34
1.5 3.10 58.1 4.6 8.0 36
2.0 3.20 60.3 4.4 6.2 46
Arise 6000
®
1.0 3.50 58.2 5.2 10.1 44
1.5 3.50 59.0 4.7 10.4 38
2.0 3.00 59.9 6.0 23.5 15
Arise 8000
®
1.0 4.00 58.2 5.0 13.5 20
1.5 4.00 58.3 7.0 16.1 15
2.0 4.00 59.9 7.7 26.4 16
*MTI = Mixing Tolerance Index
E X TE NSO G R A P H
The extensograph provides information about dough It took a higher percentage addition (up to 1.0-1.5%)
resistance to stretching and extensibility by measuring the for Arise® 6000 to elicit the same increase (153-178
force to pull a hook through a cylindrically-shaped piece mm) in extensibility at 45 minutes as Arise® 5000. The
of dough until it breaks. Extensibility is reported as the dough at a 90-minute rest period had lesser extensibility
length or distance (in mm) of stretching of the dough piece (111 mm) compared to 45 minutes, and both levels of
at the time of rupture, whereas resistance to extension is Arise® 6000 exhibited similar extensibility values. At a
measured by the stretching force and is recorded by the 135-minute rest period, the addition of 1.0% Arise® 6000
height of the extensograph curve. showed comparable extensibility to the control (81 mm
The appearance of a force-time curve (extensogram) vs 83 mm). However, the dough with 1.5% Arise® 6000 at
is seen on a wheat flour dough in Fig. 20 (Appendix B). 135 minutes gave a more extensible dough (extensibility
Compared to the control flour dough (no additive) with an of 94 mm). Overall, the general trend of the data in Table
extensibility of 144 mm after a 45-minute rest period, the 12 indicates a larger effect on extensibility by Arise®
extensibility of the dough containing 0.5% or 1.0% Arise® 5000 compared to Arise® 6000. In contrast to the above
5000 increased to 155-173 mm (Table 12). Compared to observations on extensibility, the resistance to extension
the data at a 45-minute rest period, extensibility tended to of the dough tended to decrease with the addition of 0.5%
decrease after 90 minutes (97-101 mm) then appeared to to 1.0% Arise® 5000 or 1.0% to 1.5% Arise® 6000.
level off after a rest period of 135 minutes (95-102 mm). In a separate experiment, Arise® 6000 was tested
in the extensograph at 1%, 2% and 3% levels in a wheat
17TEC HNIC AL
WHEAT PROTEIN ISOLATES
SPE CIFICATIONS
F U N C T I O N A L I T Y I N DOUGH SY STEMS 4 Con tin u ed
Table 12. Extensibility and resistance to extension at three resting periods of wheat flour with varying levels (0.5-1.5%) of Arise® 5000 or Arise® 6000 as
determined in an extensograph.
45 min. 90 min. 135 min.
Protein Source Level % Res* Ext* Res* Ext* Res* Ext*
Control Wheat Flour (No Additive) 0 625 144 770 93 880 81
Arise 5000
®
0.5 625 155 830 97 780 95
1.0 560 173 745 101 700 102
Arise® 6000 1.0 590 153 780 111 760 83
1.5 580 178 770 111 810 94
*Res = Resistance to Extension (EU); Ext = Extensibility (mm)
flour. The results show the general trend previously that is proportional to the level of added Arise® 5500 at all
observed on the increase in dough extensibility (Table three rest periods. The increased extensibility tended to be
13, Appendix A), but a decrease in resistance to dough unaffected by the level of added Arise® 5500 at any of the
extension. three rest periods. Wheat gluten displayed an increased
Another extensograph study was a comparison of 1%, resistance to extension that is proportional to the level
3% or 5% added wheat gluten, Arise® 5000, Arise® 5500 of added wheat gluten at the three rest periods; however,
or Arise® 8000 to wheat flour. Consistent with earlier there is no clear trend of its effect on extensibility. At the
results, Arise® 5000 exhibited a reduction in resistance 90- and 135-min rest periods but not at the 45-min rest
to extension at the three rest periods, which appeared to period, the increase in resistance to extension of Arise®
be proportional to the level added (1-5%) at 45-min rest 8000 tended to be proportional to the level of added Arise®
period, but not with the other two rest periods (Table 14). 8000. The results on extensibility as affected by added
The increase in extensibility tended to be proportional to Arise® 8000 are inconsistent tending to be diminished at a
the level of Arise® 5000 at the 45-min rest period, but not higher level of addition (3-5%).
at the 90- and 135-min rest periods. By contrast, Arise® Extensograph characteristics of wheat gluten and four
5500 demonstrated a reduction in resistance to extension wheat protein isolates as flour additives at 1.0%, 1.5% or
Table 14. Extensibility and resistance to extension at three resting periods of wheat flour with varying levels (1.0-5.0%) of vital wheat gluten or Arise® wheat
protein isolates as determined in an extensograph.
45 min. 90 min. 135 min.
Protein Source Level % Res* Ext* Res* Ext* Res* Ext*
Control Wheat Flour (No Additive) 0 625 144 770 93 880 81
Wheat Gluten 1.0 695 166 775 139 765 117
3.0 780 141 >1000 103 960 81
5.0 860 142 1060 89 990 77
Arise 5000
®
1.0 580 162 680 162 620 130
3.0 470 172 700 140 650 126
5.0 440 203 530 152 495 136
Arise 5500
®
1.0 610 169 880 117 860 99
3.0 520 161 590 137 610 113
5.0 450 144 440 134 450 113
Arise® 8000 1.0 810 134 1000 105 930 88
3.0 765 137 1015 90 970 82
5.0 775 133 1030 87 1040 81
*Res = Resistance to Extension (EU); Ext = Extensibility (mm)
18E X TE NSO G R A P H 4 Co nt inue d
2.0% were measured using a different protocol of rest The internal pressure in the bubble is graphically recorded.
periods: 30, 60 or 90 min. At the 30-min rest period, The parameters measured in an alveogram are P (measure
Arise® 5000, Arise® 5500, and Arise® 6000 showed a of dough tenacity; resistance to extension/deformation;
decrease in resistance-to-extension and an increase maximum pressure reached blowing the dough piece to
in extensibility, but those changes do not appear to be rupture), L (measure of dough extensibility; maximum
proportional to the level of added Arise® wheat protein volume of air that the bubble is able to contain), W (measure
isolate (Table 15). The same general trend in increased of deformation energy; area under the curve; energy needed
extensibility and decreased resistance-to-extension to make the bubble as big as it could go before it burst) and
was observed after the 60-min and 90-min rest periods. P/L ratio (a measure of how high or how low the pressure is
Wheat gluten and Arise® 8000 behaved differently with that developed during the test). The alveograph curve for
no clear general trend on resistance-to-extension, but wheat flour is graphically recorded as shown in Fig. 21 (see
extensibility tended to generally increase over the three Appendix B).
rest periods. When evaluated using an alveograph, Arise® 5000
has a larger effect on increasing dough extensibility (L)
compared to Arise® 6000 (Table 16). For example, 0.5%
ALV E O G R A P H Arise® 5000 tended to cause higher extensibility than
the addition of 1.0% to 1.5% Arise® 6000. In a separate
In an alveograph, a sheet of dough of defined experiment, high levels of 3% and 5% of Arise® 5000 were
thickness is expanded by air pressure into a bubble until evaluated for their effects on alveograph parameters.
it is ruptured, and the resistance to extension (deformation) Table 17 (Appendix A) shows that dough extensibility
and the extent to which it can be stretched is measured. (L) generally increased and resistance to extension (P)
Table 15. Extensibility and resistance to extension at three resting periods of wheat flour with varying levels (1.0-2.0%) of vital wheat gluten or Arise® wheat
protein isolates as determined in an extensograph.
30 min. 60 min. 90 min.
Protein Source Level % Res* Ext* Res* Ext* Res* Ext*
Control Wheat Flour (No Additive) 0 406 154 612 144 720 142
Wheat Gluten 1.0 314 198 490 184 591 164
1.5 422 180 616 150 690 143
2.0 326 197 610 170 647 155
Arise 5000
®
1.0 290 189 452 153 492 152
1.5 279 203 434 175 475 170
2.0 292 188 480 163 497 154
Arise® 5500 1.0 262 193 474 166 499 161
1.5 316 193 484 160 538 158
2.0 295 186 482 169 526 162
Arise® 6000 1.0 350 190 556 161 548 170
1.5 286 200 428 173 472 170
2.0 286 198 433 177 476 169
Arise® 8000 1.0 338 174 594 173 623 163
1.5 377 194 628 164 640 142
2.0 370 199 576 168 729 141
*Res = Resistance to Extension (EU); Ext = Extensibility (mm)
19TEC HNIC AL
WHEAT PROTEIN ISOLATES
SPE CIFICATIONS
F U N C T I O N A L I T Y I N DOUGH SY STEMS 4 Con tin u ed
ALV E O G R A P H 4 Co ntinue d
decreased, respectively, as the level of protein additive strength, tended to decrease with Arise® 5000 and Arise®
rose. By comparison, Arise® 5500 added to wheat flour at 6000, but generally increased with wheat gluten.
1-5% level tended to have higher extensibility and lower In another alveograph measurement, Arise® 5000
resistance to extension when matched against the control or Arise® 5500 added at 1.0%, 3.0% or 5.0% in wheat
(Table 18, Appendix A). flour exhibited a general trend of decreased resistance-
With respect to Arise® 8000, the resistance to dough to-extension and increased extensibility (Table 21).
extension (P) was increased compared to the control (no The deformation energy (W) also tended to decrease.
additive), and the increase was apparently directly related Conversely, wheat gluten and Arise® 8000 increased the
to the level of Arise® 8000 (Table 19). Dough extensibility resistance-to-extension (P) and tended to have decreased
(L) tended to decrease with the incorporation of Arise® extensibility (L) with Arise® 8000. However, wheat gluten
8000. tended to increase extensibility at 1.0-3.0% but tended
to decrease it at a level of 5.0%. Deformation energy (W)
Resistance to extension (P) of dough tended to generally increased with the addition of wheat gluten and
increase for both wheat gluten and Arise® 8000 compared Arise® 8000.
to the control (Table 20). By contrast, Arise® 5000 (1.5-
2.0%) and Arise® 6000 (1.0-2.0%) tended to have reduced
Table 19. Alveograph data of wheat flour containing 1%, 3% or 5% of
resistance to extension. Dough extensibility tended to Arise® 8000.
increase for Arise® 5000 (2.0%), Arise® 5500 (1.5-2.0%)
and Arise® 6000 (1.5-2.0%). In general, the P/L ratio Resistance to Extension,
Additive Extensibility, mm
tended to decrease with the addition of Arise® 5000, mm
Arise® 5500 and Arise® 6000, but generally increased with No additive 79 121
wheat gluten and Arise® 8000 compared to the control.
1% Arise® 8000 68 129
The W value, a measure of deformation energy or dough
3% Arise® 8000 76 142
Table 16. Alveograph data of wheat flour with varying levels (0.5-1.5%) of 5% Arise 8000
®
79 167
Arise® 5000 or Arise® 6000.
Resistance to Extension,
Additive Extensibility, mm
mm
No additive 79 121
0.5% Arise 5000
®
90 116
1.0% Arise 5000
®
97 114
1.0% Arise® 6000 88 117
1.5% Arise 6000
®
87 119
20Table 20. Alveograph data of wheat flour with varying levels (1.0-2.0%) of wheat gluten or Arise® wheat protein isolates.
Protein Source Level % P* (mm H2O) L* (mm) W* (10-4 J) P/L*
Control Wheat Flour (No Additive) 0 79 87 249 0.91
Wheat Gluten 1.0 88 78 261 1.13
1.5 95 84 296 1.13
2.0 89 90 296 0.99
Arise® 5000 1.0 80 75 216 1.07
1.5 76 86 224 0.88
2.0 74 95 235 0.78
Arise® 5500 1.0 86 87 257 1.02
1.5 81 97 254 0.84
2.0 80 95 242 0.84
Arise 6000
®
1.0 78 86 232 0.91
1.5 73 124 261 0.59
2.0 75 107 244 0.70
Arise 8000
®
1.0 87 69 236 1.26
1.5 92 69 247 1.33
2.0 91 88 297 1.03
*P = Dough tenacity or resistance to extension; L = Extensibility; W = Deformation energy; P/L = Ratio of resistance to extension to extensibility
Table 21. Alveograph data of wheat flour with varying levels (1.0-5.0%) of wheat gluten or Arise® wheat protein isolates.
Protein Source Level % P* (mm H2O) L* (mm) W* (10-4 J)
Control Wheat Flour (No Additive) 0 121 79 349
Wheat Gluten 1.0 124 93 420
3.0 134 87 445
5.0 152 75 464
Arise® 5000 1.0 112 93 351
3.0 92 121 300
5.0 87 115 253
Arise® 5500 1.0 114 84 335
3.0 116 80 325
5.0 126 74 338
Arise® 8000 1.0 129 68 345
3.0 142 76 427
5.0 167 79 540
*P = Dough tenacity or resistance to extension; L = Extensibility; W = Deformation energy
21You can also read