Drug-resistant enteric fever worldwide, 1990 to 2018: a systematic review and meta-analysis - Simon I Hay
←
→
Page content transcription
If your browser does not render page correctly, please read the page content below
Browne et al. BMC Medicine       (2020) 18:1
https://doi.org/10.1186/s12916-019-1443-1

 RESEARCH ARTICLE                                                                                                                                Open Access

Drug-resistant enteric fever worldwide,
1990 to 2018: a systematic review and
meta-analysis
Annie J. Browne1, Bahar H. Kashef Hamadani1, Emmanuelle A. P. Kumaran1, Puja Rao2, Joshua Longbottom1,
Eli Harriss3, Catrin E. Moore1, Susanna Dunachie4,5, Buddha Basnyat4,6, Stephen Baker4,7, Alan D. Lopez1,8,
Nicholas P. J. Day4,5, Simon I. Hay2,9 and Christiane Dolecek4,5*

  Abstract
  Background: Antimicrobial resistance (AMR) is an increasing threat to global health. There are > 14 million cases of
  enteric fever every year and > 135,000 deaths. The disease is primarily controlled by antimicrobial treatment, but
  this is becoming increasingly difficult due to AMR. Our objectives were to assess the prevalence and geographic
  distribution of AMR in Salmonella enterica serovars Typhi and Paratyphi A infections globally, to evaluate the extent
  of the problem, and to facilitate the creation of geospatial maps of AMR prevalence to help targeted public health
  intervention.
  Methods: We performed a systematic review of the literature by searching seven databases for studies published
  between 1990 and 2018. We recategorised isolates to allow the analysis of fluoroquinolone resistance trends over
  the study period. The prevalence of multidrug resistance (MDR) and fluoroquinolone non-susceptibility (FQNS) in
  individual studies was illustrated by forest plots, and a random effects meta-analysis was performed, stratified by
  Global Burden of Disease (GBD) region and 5-year time period. Heterogeneity was assessed using the I2 statistics.
  We present a descriptive analysis of ceftriaxone and azithromycin resistance.
  Findings: We identified 4557 articles, of which 384, comprising 124,347 isolates (94,616 S. Typhi and 29,731 S.
  Paratyphi A) met the pre-specified inclusion criteria. The majority (276/384; 72%) of studies were from South Asia;
  40 (10%) articles were identified from Sub-Saharan Africa. With the exception of MDR S. Typhi in South Asia, which
  declined between 1990 and 2018, and MDR S. Paratyphi A, which remained at low levels, resistance trends worsened
  for all antimicrobials in all regions. We identified several data gaps in Africa and the Middle East. Incomplete reporting
  of antimicrobial susceptibility testing (AST) and lack of quality assurance were identified.
  Interpretation: Drug-resistant enteric fever is widespread in low- and middle-income countries, and the situation is
  worsening. It is essential that public health and clinical measures, which include improvements in water quality and
  sanitation, the deployment of S. Typhi vaccination, and an informed choice of treatment are implemented. However,
  there is no licenced vaccine for S. Paratyphi A. The standardised reporting of AST data and rollout of external quality
  control assessment are urgently needed to facilitate evidence-based policy and practice.
  Trial registration: PROSPERO CRD42018029432.
  (Continued on next page)

* Correspondence: christiane.dolecek@ndm.ox.ac.uk
4
 Centre for Tropical Medicine and Global Health, Nuffield Department of
Medicine, University of Oxford, Oxford, UK
5
 Mahidol-Oxford Tropical Medicine Research Unit, Faculty of Tropical
Medicine, Mahidol University, Bangkok, Thailand
Full list of author information is available at the end of the article

                                        © The Author(s). 2020 Open Access This article is distributed under the terms of the Creative Commons Attribution 4.0
                                        International License (http://creativecommons.org/licenses/by/4.0/), which permits unrestricted use, distribution, and
                                        reproduction in any medium, provided you give appropriate credit to the original author(s) and the source, provide a link to
                                        the Creative Commons license, and indicate if changes were made. The Creative Commons Public Domain Dedication waiver
                                        (http://creativecommons.org/publicdomain/zero/1.0/) applies to the data made available in this article, unless otherwise stated.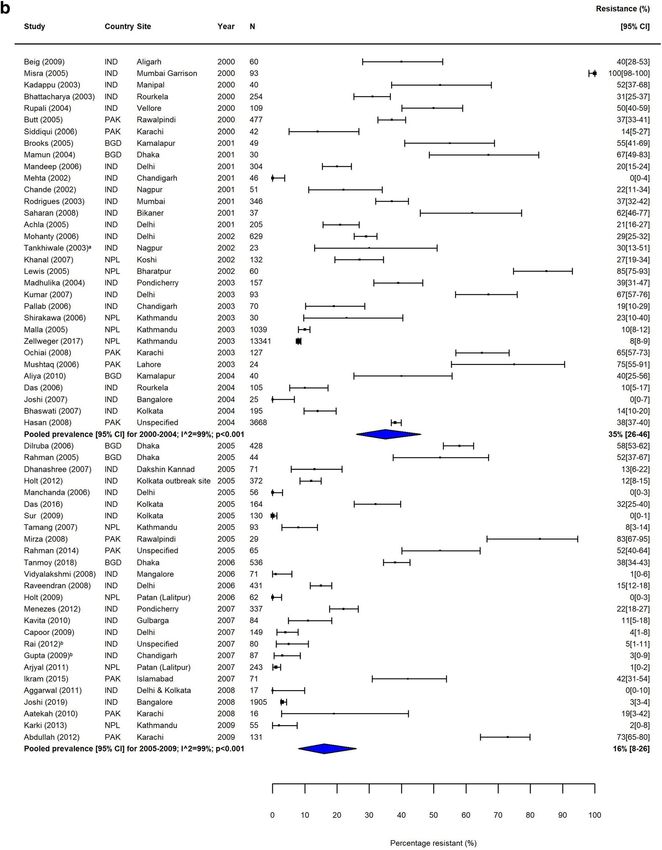
Browne et al. BMC Medicine        (2020) 18:1                                                                      Page 2 of 22

 (Continued from previous page)
 Keywords: Enteric fever, Typhoid fever, Paratyphoid fever, Salmonella Typhi, Salmonella Paratyphi A, Antimicrobial drug
 resistance, Harmonisation of breakpoints, Prevalence of resistance, Meta-analysis, Drug-resistant infections, Multidrug
 resistance, Fluoroquinolone resistance, Ceftriaxone resistance, ESBL-producing, Azithromycin resistance

Background                                                       empirical treatment [14]. Antimicrobial susceptibility test-
Enteric fever, a serious bloodstream infection caused by         ing (AST) and surveillance play a critical role in capturing
the human-restricted bacterial pathogens Salmonella              local susceptibility patterns and guiding empirical treat-
enterica serovars Typhi (S. Typhi) and Paratyphi A, is an        ment; however, microbiological facilities and the relevant
important cause of morbidity and mortality in the devel-         expert knowledge are lacking in many low- and middle-
oping world. Transmission occurs faeco-orally through            income countries (LMICs) [15–17]. Significantly, S. Typhi
contaminated water and food. An estimated 14.3 million           and S. Paratyphi are WHO priority pathogens for AMR
infections and more than 135,000 deaths are caused by en-        surveillance [17].
teric fever worldwide each year [1], mostly affecting chil-        The WHO currently recommends chloramphenicol,
dren and young adults.                                           ampicillin and cotrimoxazole (trimethoprim-sulfameth-
   S. Typhi is the aetiological agent of almost 30% of           oxazole), fluoroquinolones, third-generation cephalos-
community-acquired bacterial bloodstream infections in           porines (ceftriaxone, cefixime) and azithromycin for the
Asia [2] and 10% in Africa [3], whilst S. Paratyphi A is an      treatment of enteric fever [11]. Unfortunately, AMR is
emerging pathogen in Asia, that causes up to 35% of all          widespread, and patients treated with ineffective antimi-
enteric fever episodes in India and Nepal and more than          crobials show a poor clinical response and a higher rate
60% in China [4, 5]. Notably, paratyphoid fever is clinically    of complications and deaths, as well as prolonged faecal
indistinguishable from typhoid fever [4]. Enteric fever is       shedding, which sustains transmission and induces sec-
an important cause of acute undifferentiated febrile illness     ondary cases [18–20].
[6]. There is heterogeneity in the aetiologies of febrile ill-     Here, we performed a systematic review and meta-
ness according to geographic location, age group, diagnos-       analysis of the literature to evaluate the prevalence of
tic testing panel and seasonality [6–8]. A study in India        AMR in S. Typhi and S. Paratyphi A and to determine
identified enteric fever in 4% of > 1200 adult patients as       the spatial and temporal distribution of drug-resistant
the cause of febrile illness (the testing panel included den-    enteric fever at the regional level, grouped by Global
gue fever, scrub typhus, leptospirosis, enteric fever and        Burden of Disease (GBD) study region from 1990 to
malaria) [9], whilst a study in Nepal that tested for bacter-    2018. The ultimate aim of our work is to create fine-
ial pathogens, dengue and HIV reported enteric fever in          scaled geospatial maps of the distribution of AMR to aid
36% (117/323) of febrile illnesses with confirmed bacterial      targeted public health interventions for this preventable
aetiology [10], highlighting this variation.                     disease [21].
   Enteric fever has been eliminated in industrialised coun-
tries by improving drinking water and sanitation; vaccin-        Methods
ation can also be deployed to reduce the burden of               Search strategy and selection criteria
typhoid fever (there is no vaccine against S. Paratyphi A),      We conducted a systematic review of published litera-
but effective treatment is critical to reduce morbidity and      ture between 1990 and 2018 following the PRISMA
mortality. However, the development and spread of anti-          guidelines (Additional file 1: Table S1) [22]. The proto-
microbial drug resistance (AMR) threatens the effective-         col was registered with the international prospective
ness of antimicrobials and may lead to a resurgence of           register of systematic reviews (CRD42018029432). The
enteric fever in many parts of the world. As is true for         search strategy was devised by an academic librarian
many bacterial infections, there is no simple and reliable       (EH). MEDLINE, Ovid Embase, Global Health, Cochrane
point-of-care test that can diagnose enteric fever, define       Library, Scopus, Web of Science-Core Collection and LI-
the antimicrobial susceptibility profile and inform patient      LACS were searched using a syntax that combined
management. The gold standard diagnostic, microbio-              Medical Subject Headings (MeSH) and free text terms
logical blood culture, is expensive and slow (it usually         for the pathogens of interest (e.g. S. Typhi, S. Paratyphi
takes 3–4 days to get the blood culture and susceptibility       A, enteric fever) with terms for antimicrobial resistance
testing result) and has a low sensitivity of approximately       (e.g. resistan*, suscept*, surveil*) (Additional file 1: Table
50% [11, 12], due to the low-grade bacteraemia [13]. Prior       S2). The extended search was conducted in October
to the first antimicrobials, case fatality rates were approxi-   2017 and updated in March 2019. The search was lim-
mately 30%; this has been reduced to less than 1%, de-           ited to publications from 1990 onwards; no restrictions
pending on the timely initiation of the appropriate              on language or filters (e.g. humans) were implemented.
Browne et al. BMC Medicine     (2020) 18:1                                                                            Page 3 of 22

   Included studies were required to report quantifiable            quality assessment. No study was excluded based on this as-
in vitro antimicrobial susceptibility data for S. Typhi             sessment, due to the lack of standardised reporting guidelines
and/or S. Paratyphi A isolated from blood culture, exam-            for microbiological studies.
ining at least 10 representative organisms and indicating
the study location. Reports from travellers being diag-
nosed in high-income countries were excluded. Studies               Data analysis
with pooled S. Typhi and S. Paratyphi A susceptibility              Each study was assigned to a year based on the midyear
data, studies reporting on isolates from stool culture and          of the study. Studies were grouped based on the GBD
duplicate isolates were also excluded.                              region and 5-year time period (1990–1994; 1995–1999;
   Prospective and retrospective hospital-, laboratory- and         2000–2004; 2005–2009; 2010–2014; 2015–2018). If
community-based studies were included, if they met the spe-         study dates were not provided, these were imputed as
cified inclusion criteria. Review articles were scanned for rele-   the publication date minus the median difference be-
vant references. Studies were screened at title, abstract and       tween the publication date and the mid-year for the
full-text stage by one author (CD) and reviewed by a second         remaining studies in the dataset.
author (AB). Data were extracted into a predefined database            Typhoid-specific lower breakpoints against fluoroqui-
by AB and reviewed by BKH and JL. Additionally, 20% of the          nolones (FQ) came into effect during our study period
extracted studies were checked by a third reviewer (CD).            [24]. To allow the analysis of resistance trends over time,
Disagreements were resolved by discussion. Susceptibility           we classified ciprofloxacin intermediate (minimum in-
data for antimicrobials recommended for the treatment of            hibitory concentration (MIC) 0.12–0.5 μg/mL) and re-
enteric fever by WHO, i.e. ampicillin/amoxicillin, chloram-         sistant S. Typhi and S. Paratyphi (MIC ≥ 1 μg/mL)
phenicol, trimethoprim-sulphamethoxazole (co-trimoxazole),          according to the updated breakpoints (CLSI, 2012), as
fluoroquinolones (e.g. ciprofloxacin and ofloxacin), third-         well as isolates with ‘decreased ciprofloxacin (or FQ)
generation cephalosporins (e.g. ceftriaxone and cefixime) and       susceptibility’ (ciprofloxacin MIC 0.125–1.0 μg/mL) and
azithromycin, were extracted [11]. Furthermore, multidrug           nalidixic acid-resistant isolates (as proxy marker for ‘de-
resistance (MDR; defined as resistance to ampicillin/amoxi-         creased ciprofloxacin (or fluoroquinolone) susceptibil-
cillin, chloramphenicol and co-trimoxazole) and nalidixic           ity’), as fluoroquinolone non-susceptible (FQNS). The
acid resistance, as a proxy marker for reduced ciprofloxacin        term ‘decreased ciprofloxacin (or FQ) susceptibility’ de-
susceptibility, were recorded [18].                                 scribed organisms with raised ciprofloxacin MICs that
   Variables extracted included the study start and end dates,      technically were not resistant due to the higher historical
patients’ characteristics (age range, mean age, percentage of       FQ breakpoints before 2012. If ciprofloxacin data were
males, inpatients or outpatients), study design, number of pa-      not available or it was not clear which breakpoints were
tients screened, number of patients with positive blood cul-        used, nalidixic acid resistance data were used instead.
ture, antimicrobial susceptibility testing (AST) method and            For all other antimicrobials, we classified intermediate
the number (or percentage) of resistant, intermediate and           susceptible organisms as resistant. We determined the
susceptible isolates out of the total number of isolates tested     percentage of patients with resistant S. Typhi or S. Para-
against each antimicrobial. We also recorded case fatalities        typhi A isolates and used forest plots to illustrate the
and clinical outcomes when available. Additionally, the test-       proportion of MDR and FQNS for each individual study;
ing standard (e.g. Clinical and Laboratory Standards Institute      95% confidence intervals (CI) were calculated using the
(CLSI)) and interpretive criteria (including version or year)       Agresti-Coull method [25].
used to determine resistance, use of internal quality controls         We combined individual studies using random effect
and participation in external quality assessments schemes           meta-analysis to arrive at pooled prevalence rates of
were recorded. The study setting, precise study location,           MDR and FQNS for each region, time period and sero-
country and GBD study region were recorded for each study.          var. Heterogeneity was assessed visually using forest
Data were disaggregated by serovar and study location.              plots and quantitatively using the I2 statistic and its asso-
   We aimed to control for bias and allow for comparison            ciated p value [26]. In addition to the categorical data on
across studies by adhering to the predefined inclusion and          the proportion of FQNS, we present quantitative cipro-
exclusion criteria. We expected that there would be differ-         floxacin MIC data for S. Typhi from large studies with >
ences in the quality of the AST and interpretation of results,      90 isolates in Delhi, India. Stacked bar plots were used
reflecting the reality in many LMICs. We adapted a descrip-         to illustrate changes in the distribution of ciprofloxacin
tive tool for quality assessment used by Arndt, based on sam-       MICs over the study period.
ple size and microbiological testing methodology [23]. We              Ceftriaxone and azithromycin are recommended for
reviewed the complete description of susceptibility testing         the treatment of MDR and FQ-resistant enteric fever
methods, which included testing standard, version and/or            [11]. We also provide a descriptive analysis of ceftriax-
year (i.e. breakpoints), internal quality controls and external     one and azithromycin resistance as part of this review.
Browne et al. BMC Medicine (2020) 18:1 Page 4 of 22
We used double arcsine transformation to stabilise the (86%) studies and were primarily Kirby-Bauer disc dif-
variance of proportions and performed random effects fusion; testing standards (e.g. CLSI) were reported in
meta-analysis using the REML heterogeneity variance esti- 218 (57%) studies; interpretive criteria (version or
mator [27]. Pooled prevalence was calculated for sub- year; i.e. breakpoints) were reported in 168 (44%)
groups that included at least three studies. All statistical studies and use of internal quality controls in 122
analyses were conducted at a 5% significance level using the (32%) studies. Five studies reported participation in
statistical software package ‘metafor’ in R (version 3.4.2). international and two studies in national EQA
schemes, whilst 23 studies reported confirmation of
AST results by national or international reference
Results laboratories (Table 2). Clinical outcomes including
Our online database searches identified 4557 articles, with case fatalities were presented by 91 studies (Tables 1
an additional 22 obtained through reference tracking. A and 2).
total of 3112 studies were excluded at abstract review and Heterogeneity was high (I2 > 80%) within most sub-
1445 at full-text review; the main reasons for exclusion groups (Figs. 2, 3, 4 and 5, Additional file 1: Figures
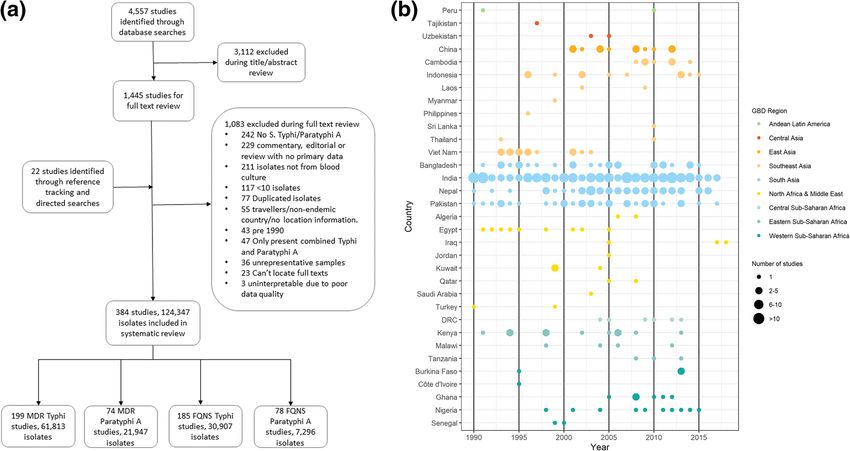
are shown in Fig. 1a. Ultimately, data were extracted from S3-S12). Results of our sensitivity analysis (Additional
384 articles yielding information for 124,347 isolates: 94, file 1: Tables S4a & b, Figure S2a & b) showed that
616 S. Typhi and 29,731 S. Paratyphi A. There were 199 removing studies deemed as having a risk of bias due
data points for MDR S. Typhi, 185 for FQNS S. Typhi, 73 to incomplete reporting of AST methodology had no
data points for MDR S. Paratyphi A and 78 for FQNS S. effect on either the heterogeneity within subgroups,
Paratyphi A (Fig. 1a, Additional file 1: Table S3). (One or on the pooled prevalence of resistance. This fur-
study could contribute several data points due to report- ther supported our decision not to exclude studies
ing on multiple antimicrobials, serovars and locations.) based on the risk of bias assessment.
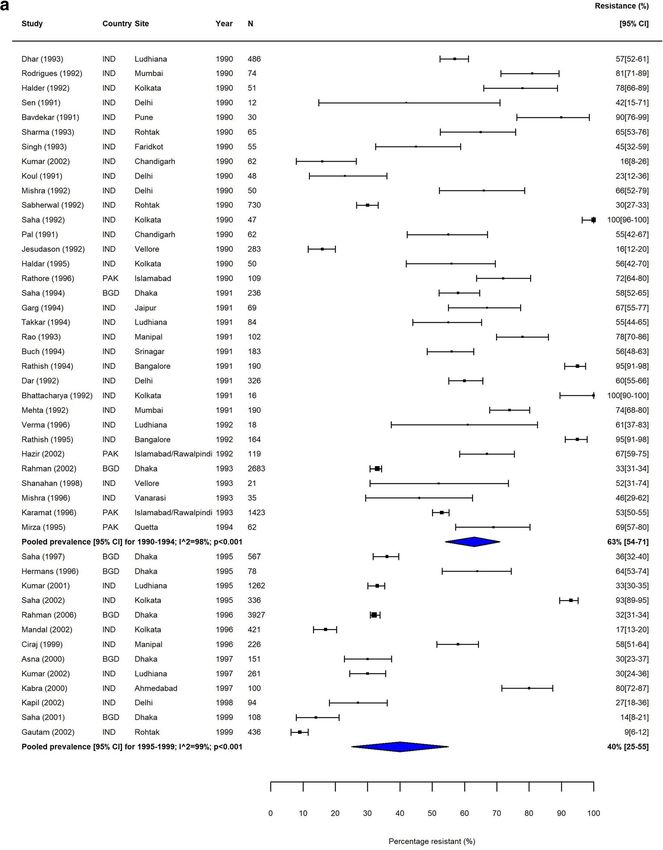
The majority of data were from South Asia, with the high- The proportion of MDR S. Typhi isolates showed a high
est number of reports (173/384; 45%) from India. No data degree of variation in the seven GBD regions over our study
were identified from Oceania (Fig. 1b). Table 1 shows the period. In South Asia, which includes the high-burden coun-
study characteristics. tries India, Nepal, Pakistan and Bangladesh, despite high het-
The majority (230/384; 60%) of reports were retro- erogeneity, there was a clear downward trend in MDR over
spective studies. AST methods were reported in 329 the study period (Table 3, Fig. 2). In contrast, the proportions
Fig. 1 Study selection. a PRISMA flow chart depicting study screening and selection; approximately 150 studies were received from the Bodleian
Library/British National Library. b Data availability plotted by year (x-axis) and country (y‐axis), grouped by region. The number of studies for each
country‐year is depicted by the size of the point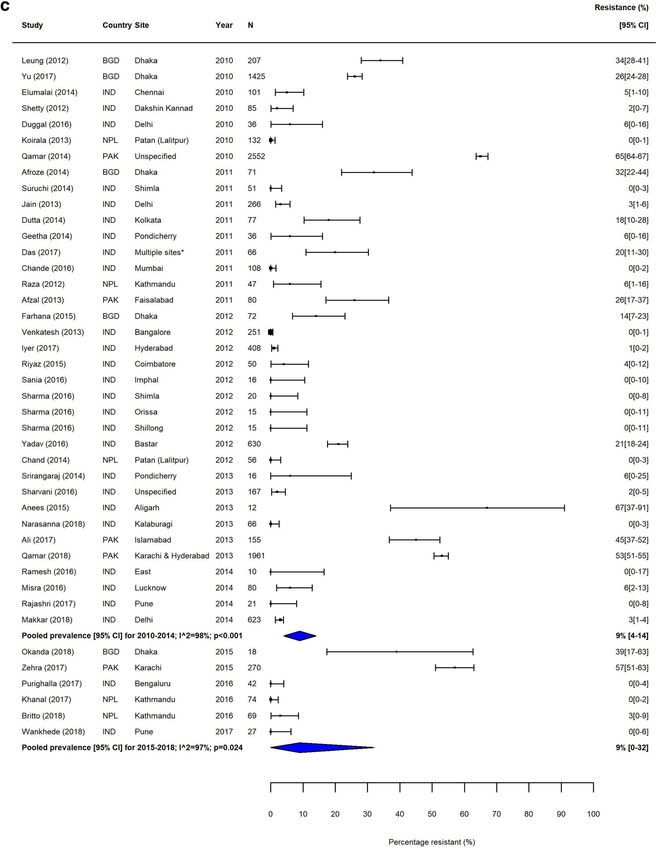
Browne et al. BMC Medicine              (2020) 18:1                                                                                  Page 5 of 22

Table 1 Study characteristics – population characteristics                         of MDR S. Typhi isolates in Southeast Asia remained high,
Study characteristics                                   Number of studies (%)      with pooled prevalence > 60% for most time periods (Table
Region of studya                                                                   3). The variability in resistance within this region was high;
    Andean Latin America                                2 (0.5)                    some countries, including the island nations of Indonesia
    Central Asia                                        3 (0.8)                    and the Philippines, as well as Laos, reported low levels of
    East Asia                                           12 (3.1)
                                                                                   MDR, whilst studies from neighbouring Vietnam and
                                                                                   Cambodia reported considerably higher resistance levels
    North Africa & Middle East                          17 (4.4)
                                                                                   (Fig. 3).
    South Asia                                          276 (71)
                                                                                     For sub-Saharan Africa, data were sparse, with only 21
    Southeast Asia                                      38 (9.8)
                                                                                   (5%) studies examining the prevalence of MDR S. Typhi
    Sub-Saharan Africa, Central                         6 (1.5)                    identified. For the Central sub-Saharan region, five stud-
    Sub-Saharan Africa, Eastern                         14 (3.6)                   ies were identified, all of which were conducted in DR
    Sub-Saharan Africa, Western                         21 (5.4)                   Congo. Two studies were available for 2005–2009: one
Number of blood cultures screened                                                  reported 30% MDR resistance (201 patients) [28] and a
    0-99                                                13 (3.4)                   smaller study (11 patients), performed during a typhoid
    100-499                                             43 (11.2)                  outbreak characterised by high rates of peritonitis and
    500-999                                             30 (7.8)
                                                                                   perforation, reported 100% MDR resistance [29]. For the
                                                                                   period from 2010 to 2014, three studies were available
    1000-4999                                           49 (12.8)
                                                                                   which showed a pooled MDR prevalence of 36% (95%
    5000+                                               59 (15.4)
                                                                                   CI, 29–43%) for MDR S. Typhi (Table 3, Additional file
    Not stated                                          190 (49.5)
                                                                                   1: Figure S3a).
Specific age groups                                                                  In Eastern sub-Saharan Africa, despite few data points,
    Adults only                                         5 (1.3)                    an increase in the proportion of MDR S. Typhi isolates
    Children only                                       68 (17.7)                  was detectable during the study period (Additional file 1:
    No specified age restrictions/Adults and children   311 (81)                   Figure S3b). During 1990–1994, two studies from Kenya
Reported pre-admission antibiotic use (proportion of patients in the study)b       reported 0% (24 isolates) [30] and 13% (38 isolates) [31]
    0                                                   19 (4.9)                   MDR resistance, respectively, whilst in the following 5-
    1-25%                                               15 (3.8)
                                                                                   year time periods this prevalence ranged from 60 to 82%
                                                                                   in the Kenyan Isolates. In Malawi, no MDR was reported
    26-50%                                              13 (3.3)
                                                                                   in 12 isolates during 1995–1999 [32], whilst in 2005–
    51-75%                                              7 (1.8)
                                                                                   2009, 88% of 2054 isolates were MDR [33].
    76-100%                                             7 (1.8)
                                                                                     In Western sub-Saharan Africa, only six studies (seven
    Not stated                                          329 (84.4)                 data points) were available, with a large variability in re-
Reported case fatality rate                                                        sults. No resistance was reported from Burkina Faso
    0                                                   61 (15.9)                  [34–36], whilst considerably higher levels of MDR were
    1-5%                                                24 (6.3)                   reported in Nigeria (37% (68 isolates)) in 1998 [37], in-
    6-10%                                               2 (0.5)                    creasing to 100% (58 isolates) in 2014 [38]) and Ghana
    11-15%                                              1 (0.3)                    with 63% (30 isolates) and 66% (89 isolates) [36, 39]
    16-20%                                              2 (0.5)
                                                                                   (Additional file 1: Figure S3c).
                                                                                     A large variability of MDR in S. Typhi was also observed
    21-25%                                              1 (0.3)
                                                                                   in North Africa and the Middle East (NAME), with studies
    Not stated                                          293 (76.3)
                                                                                   from Egypt in 1998 [40], Saudi Arabia in 2003 [41] and
Patient typec
                                                                                   Iraq in 2005 [42] showing particularly high levels of MDR
    Inpatients                                          73 (19)                    with 67% (45 isolates), 100% (12 isolates) and 83% (59 iso-
    Outpatients                                         14 (3.6)                   lates), respectively (Additional file 1: Figure S4). The
    Outpatients & Emergency department                  6 (1.6)                    pooled prevalence of MDR S. Typhi decreased from 44%
    Inpatients & Outpatients                            44 (11.4)                  (95% CI, 5–88%) during 2000–2004 to 8% (95%CI, 1–
    Community                                           7 (1.8)                    20%) during 2005–2009, due to a multi-centre study [42],
    Not specified                                       241 (62.6)                 which showed relatively low levels of MDR (Table 3). In
a
  Three studies reported isolates from multiple regions
                                                                                   East Asia, MDR S. Typhi was not reported in any of the
b
  Six studies reported the proportion of participants using antibiotics prior to   four publications (Additional file 1: Figure S5).
testing separately for different sites or for persons infected with S. Typhi and
S. Paratyphi A separately
                                                                                     Trends in FQNS amongst S. Typhi isolates differed from
c
  One study consisted of two separate parts, one was community based and           those of MDR across all regions, most likely reflecting
the other in outpatients                                                           changes in prescribing patterns and antimicrobial use that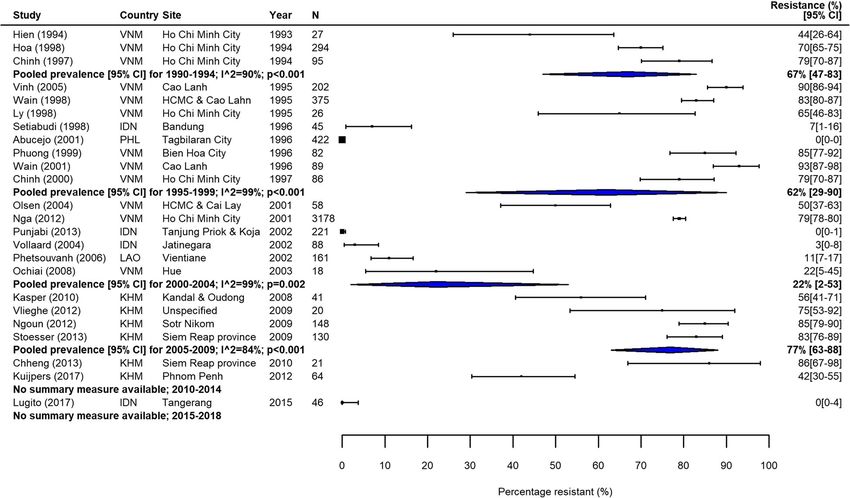
Browne et al. BMC Medicine (2020) 18:1 Page 6 of 22
Table 2 Study characteristics – quality assessment Similarly to South Asia, the proportions of FQNS S. Typhi
Study quality characteristics Number of increased steadily during our study period (Table 3, Fig. 5).
studies (%) Heterogeneity was extremely high in this region, and as
Study designa with MDR, lower proportions of FQNS were reported in
Clinical trial 16 (4.0) Indonesia.
Prospective 155 (38.7) In sub-Saharan Africa, few studies were available and
results were highly variable (Additional file 1: Figure S6).
Retrospective 230 (57.4)
The prevalence of FQNS S. Typhi was lower than in
Sample size
South and Southeast Asia, but comparatively high levels
10-29 63 (16.4) were reported in DR Congo in 2010 (41% of 17 isolates)
30-99 137 (35.7) [50] and in 2013 (37% of 164 isolates) [51], in Tanzania
>100 184 (47.9) in 2010 (36% of 45 isolates) [52] and in Kenya (≥ 20%) in
Method of antimicrobial susceptibility testing 2002 [53], 2005 [54] and 2013 [36]. In Western sub-
Saharan Africa, no FQNS S. Typhi were reported in Bur-
Disk-diffusion 183 (47.7)
kina Faso [35, 36] and Ghana [39]; low levels (between 0
Disk-diffusion & MIC determination 98 (25.5)
and 13%) in Senegal [55], south and central Nigeria
Microdilution 26 (6.8) (Lagos and Abuja) [37, 38, 56]; whilst comparatively
E-test 9 (2.3) higher proportions of FQNS (41% and 82%) were re-
Automated methodsb 7 (1.8) ported in northern Nigeria (Zaria and Kano) [57, 58].
Multiple MIC determination methods 6 (1.6) In NAME, few reports were available. A multicentre
study undertaken in Egypt, Iraq, Jordan and Qatar re-
Not stated 55 (14.3)
ported that the proportion of FQNS S. Typhi ranged be-
Guidelines for antimicrobial susceptibility testingc
tween 17% in one location in Egypt and 81% in Iraq
BSAC/EUCAST 11 (2.8) (Table 3, Additional file 1: Figure S7) [42]. Other studies
CLSI/NCCLS 200 (51.4) reported no FQNS in Algeria [59] and only low levels of
Other 12 (3.1) FQNS in Iraq in 2017 and 2018 [60, 61]. In East Asia,
Not stated 166 (42.7) data were also limited but FQNS S. Typhi increased over
time from 0% (15 isolates) reported by one study in
Version of antimicrobial susceptibility testing guidelines stated
2002 [62] to 63% (139 isolates) in 2009 [63] (Additional
Stated 168 (43.8)
file 1: Figure S8).
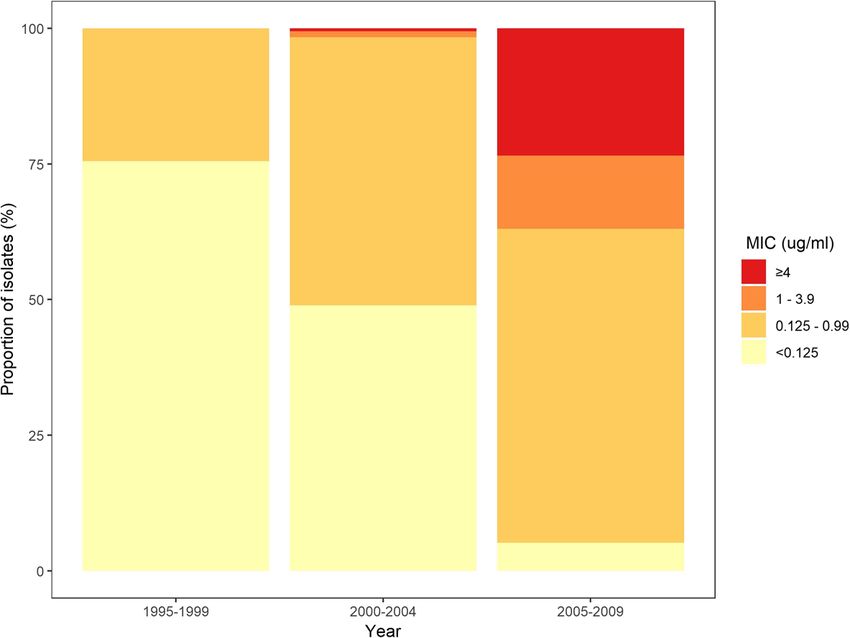
Not stated 216 (56.3) In addition to our analysis of resistance frequencies,
Internal quality control reported using data from three large studies in Delhi, India, we
Yes 122 (31.8) investigated changes in ciprofloxacin MIC distributions
No 262 (68.2) for S. Typhi over our study period [64–66]. Between
1995 and 2009, there was a large increase in the propor-
External quality assessment (EQA) participation reported
tion of isolates with intermediate resistance (MIC
International EQA 5 (1.3)
0.125–0.9 μg/mL), resistance (MIC 1–3.9 μg/mL), and
National EQA 2 (0.5) high-level resistance (MIC ≥ 4 μg/mL), whilst the pro-
Results confirmed by national or international 23 (6) portion of susceptible isolates decreased from 76% in
surveillance laboratory 1995–1999 [64] to 23% in 2005–2009 [66] (Fig. 6). These
Not stated 354 (92.2) data highlight increases in both the proportion and de-
a
b
One article combined the report of a retrospective and a prospective study gree of resistance to ciprofloxacin in India during our
Automated systems include VITEK 2, Phoenix 100 and Rapid ATB tests
c
Six studies used the CLSI/NCCS and the BSAC/EUCAST guidelines for different
study period.
antibiotics so contributed to the numbers twice The resistance pattern for S. Paratyphi A differed con-
siderably to that of S. Typhi. In South Asia, the majority of
occurred during the study period. Despite high variability studies reported either no or low levels of MDR; just six of
between and within countries, FQNS S. Typhi in South 67 studies reported more than 20% MDR [46, 67–71]; five
Asia increased steadily for each time period (Table 3, of these studies were from Pakistan. All five studies identi-
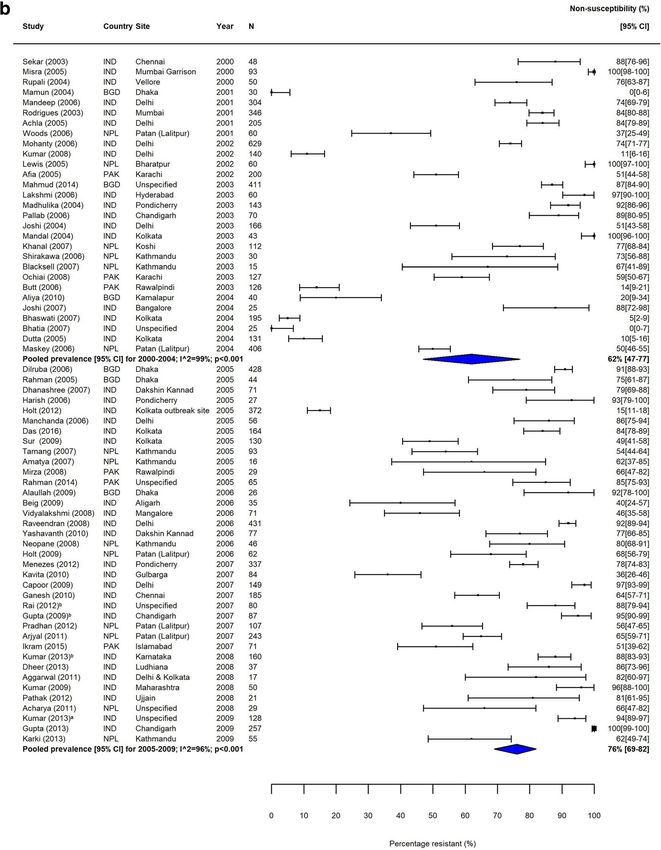
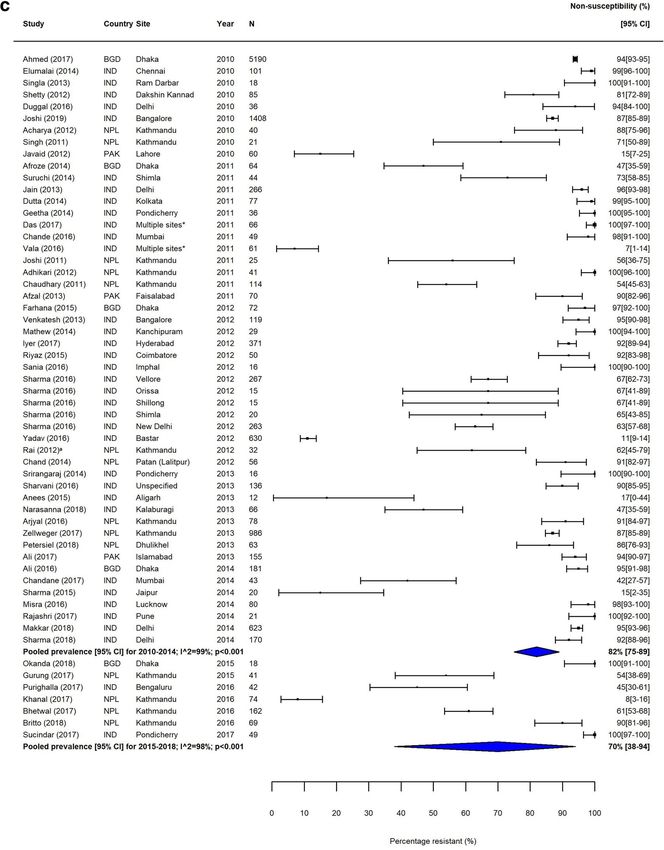
Fig. 4), from 2% (95%CI; 0–14%) in 1990–1994 to 81% fied from Southeast Asia and the four from East Asia
(95%CI; 72%–89%) in 2010–2014 and 70% (95%CI; 38%– found 0% MDR in S. Paratyphi A (Additional file 1:
94%) in 2015–2018. Between 2010 and 2014, only seven of Figures S9-S11). Contrary to this, FQNS was high amongst
the 46 identified studies reported less than 50% of S. Typhi S. Paratyphi A in South Asia, with a pooled prevalence
isolates as FQNS [43–49], highlighting the severity of this above 90% for 2000–2004, 2005–2009 and 2010–2014
issue. Fewer studies were available from Southeast Asia. (only one study available prior to 2000; Table 3, Additional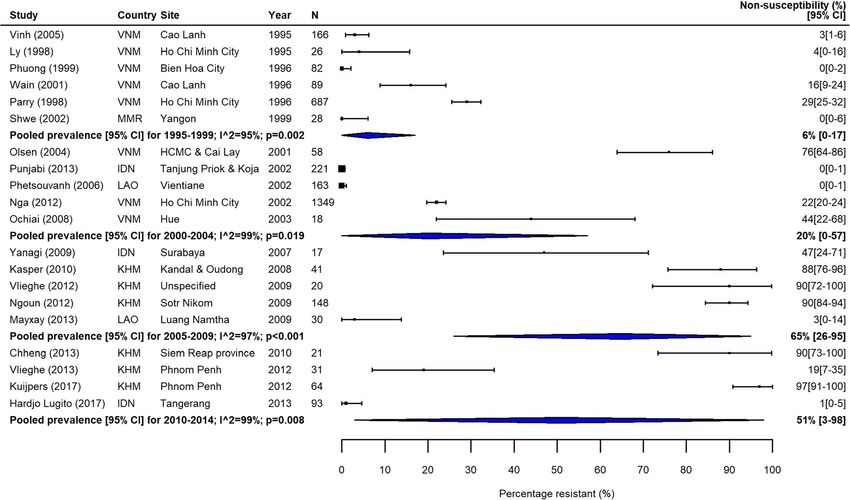
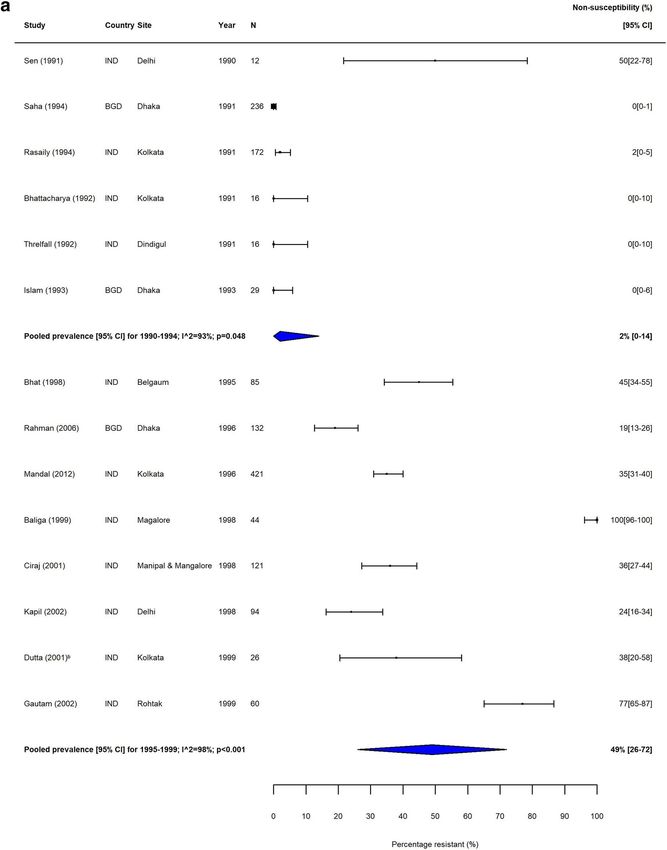
Browne et al. BMC Medicine        (2020) 18:1                                                                                           Page 7 of 22

 Fig. 2 MDR S. Typhi in South Asia. Forest plots illustrating the prevalence of MDR amongst S. Typhi strains isolates in South Asia, grouped by 5‐
 year time periods. Individual study results are displayed with 95% confidence intervals; the pooled prevalence [95%CI] for each subgroup is
 represented by the blue diamond: a 1990–1999, b 2000–2009, and c 2010–2018. Multidrug resistance is defined as concurrent resistance against
 ampicillin, chloramphenicol and co‐trimoxazole
Browne et al. BMC Medicine        (2020) 18:1                                                                                           Page 8 of 22

 Fig. 2 MDR S. Typhi in South Asia. Forest plots illustrating the prevalence of MDR amongst S. Typhi strains isolates in South Asia, grouped by 5‐
 year time periods. Individual study results are displayed with 95% confidence intervals; the pooled prevalence [95%CI] for each subgroup is
 represented by the blue diamond: a 1990–1999, b 2000–2009, and c 2010–2018. Multidrug resistance is defined as concurrent resistance against
 ampicillin, chloramphenicol and co‐trimoxazole
Browne et al. BMC Medicine        (2020) 18:1                                                                                           Page 9 of 22

 Fig. 2 MDR S. Typhi in South Asia. Forest plots illustrating the prevalence of MDR amongst S. Typhi strains isolates in South Asia, grouped by 5‐
 year time periods. Individual study results are displayed with 95% confidence intervals; the pooled prevalence [95%CI] for each subgroup is
 represented by the blue diamond: a 1990–1999, b 2000–2009, and c 2010–2018. Multidrug resistance is defined as concurrent resistance against
 ampicillin, chloramphenicol and co‐trimoxazole
Browne et al. BMC Medicine        (2020) 18:1                                                                                          Page 10 of 22

 Fig. 3 MDR S. Typhi in Southeast Asia. Forest plots illustrating the prevalence of MDR amongst S. Typhi strains isolates in Southeast Asia, grouped
 by 5‐year time periods. Individual study results are displayed with 95% confidence intervals; the pooled prevalence [95%CI] for each subgroup is
 represented by the blue diamond. Multidrug resistance is defined as concurrent resistance against ampicillin, chloramphenicol and co‐trimoxazole

file 1: Figure S12). Only three studies from Southeast Asia                 study [76]. Only two studies tested for extended-
were identified; two from Indonesia [72, 73] found no                       spectrum beta-lactamase (ESBL) production [65, 76];
FQNS and one from Cambodia [74] found 11% (183 iso-                         both reported negative results.
lates) FQNS S. Paratyphi A (Additional file 1: Figure S13).                    Of the 31 studies reporting more than 5% ceftriax-
All six studies from East Asia were from 2004 onwards and                   one resistance (range 6–45%), six failed to report sus-
found very high levels of FQNS in S. Paratyphi A (Add-                      ceptibility testing methods [79–84]. Three studies
itional file 1: Figure S14).                                                used automated testing methods; two of those used
   There were few reports of S. Paratyphi A in Africa and                   VITEK2 testing and reported 25% (220 isolates) [85]
the Middle East where the burden of disease is not well                     and 33% (30 isolates) resistance [61], and one study
described [23]. Two studies reported MDR S. Paratyphi A,                    deployed the BD Phoenix 100 system and reported
with 24% in Nigeria [37] and 15% in Kuwait [75]. Three                      12% (42 isolates) resistance. One study reported 6%
studies reported FQNS S. Paratyphi A, with 18% [37] and                     (16 isolates) ceftriaxone resistance using microdilution
47% [57] in Nigeria and 70% in Kuwait [75]. Kuwait has a                    testing [86]. The remaining 21 studies performed
large migrant worker population from South Asia, and al-                    Kirby-Bauer disc diffusion testing; of those, only three
though we tried to exclude imported cases, this may have                    studies, one with 43% (80 isolates) [87], one with 15%
affected the level of resistance observed here.                             (630 isolates) [46] and one with 11% (300 isolates) re-
   S. Typhi ceftriaxone susceptibility data were extracted                  sistance [88], determined ceftriaxone MICs. However, cef-
from 198 studies (221 data points; Additional file 2: Data                  triaxone resistance was not confirmed by MIC testing
file S3). Of these, 59 (27%) studies reported at least one                  (agar dilution) in the two latter studies [46, 88]. Only two
resistant isolate; the majority of these studies originated                 of the 21 studies [87, 89] tested for ESBL-production, with
from South Asia. For the 34 studies that reported at least                  Afzal et al. reporting negative results [87].
one organism, but ≤ 5% ceftriaxone-resistant isolates,                         Twenty-three studies, mostly from South Asia, re-
disc diffusion was the standard testing method. Only five                   ported at least one ceftriaxone-resistant S. Paratyphi A
studies additionally determined MICs: two by agar dilu-                     isolate (Additional file 2: Data file S3). Sixteen studies re-
tion [45, 65] and three by E-test [76–78]. However, cef-                    ported at least one organism, but ≤ 5% ceftriaxone resist-
triaxone resistance was not confirmed by E-test in one                      ant isolates; of these, four used automated systems
Browne et al. BMC Medicine         (2020) 18:1                                                                                               Page 11 of 22

 Fig. 4 FQNS S. Typhi in South Asia. Forest plots illustrating the prevalence of FQNS amongst S. Typhi in South Asia, grouped by 5‐year time
 periods. Individual study results are displayed with 95% confidence intervals; the pooled prevalence [95%CI] for each subgroup is represented by
 the blue diamonds: a 1990–1999, b 2000–2009, and c 2010–2018. To allow the analysis of resistance trends over time despite typhoid‐specific
 breakpoint changes for ciprofloxacin (CLSI, 2012) coming into effect during our study (1990–2018), we categorised intermediate (ciprofloxacin
 MIC 0.12–0.5 μg/ml) and resistant strains isolates (≥ 1 μg/ml) according to the updated breakpoints, as well as isolates with ‘decreased
 ciprofloxacin (or fluoroquinolone) susceptibility’ (ciprofloxacin MIC 0.125–1.0 μg/ml) and nalidixic acid-resistant strains isolates (as proxy marker for
 ‘decreased ciprofloxacin (or fluoroquinolone) susceptibility’) as fluoroquinolone non‐susceptible (FQNS)
Browne et al. BMC Medicine         (2020) 18:1                                                                                               Page 12 of 22

 Fig. 4 FQNS S. Typhi in South Asia. Forest plots illustrating the prevalence of FQNS amongst S. Typhi in South Asia, grouped by 5‐year time
 periods. Individual study results are displayed with 95% confidence intervals; the pooled prevalence [95%CI] for each subgroup is represented by
 the blue diamonds: a 1990–1999, b 2000–2009, and c 2010–2018. To allow the analysis of resistance trends over time despite typhoid‐specific
 breakpoint changes for ciprofloxacin (CLSI, 2012) coming into effect during our study (1990–2018), we categorised intermediate (ciprofloxacin
 MIC 0.12–0.5 μg/ml) and resistant strains isolates (≥ 1 μg/ml) according to the updated breakpoints, as well as isolates with ‘decreased
 ciprofloxacin (or fluoroquinolone) susceptibility’ (ciprofloxacin MIC 0.125–1.0 μg/ml) and nalidixic acid-resistant strains isolates (as proxy marker for
 ‘decreased ciprofloxacin (or fluoroquinolone) susceptibility’) as fluoroquinolone non‐susceptible (FQNS)
Browne et al. BMC Medicine         (2020) 18:1                                                                                               Page 13 of 22

 Fig. 4 FQNS S. Typhi in South Asia. Forest plots illustrating the prevalence of FQNS amongst S. Typhi in South Asia, grouped by 5‐year time
 periods. Individual study results are displayed with 95% confidence intervals; the pooled prevalence [95%CI] for each subgroup is represented by
 the blue diamonds: a 1990–1999, b 2000–2009, and c 2010–2018. To allow the analysis of resistance trends over time despite typhoid‐specific
 breakpoint changes for ciprofloxacin (CLSI, 2012) coming into effect during our study (1990–2018), we categorised intermediate (ciprofloxacin
 MIC 0.12–0.5 μg/ml) and resistant strains isolates (≥ 1 μg/ml) according to the updated breakpoints, as well as isolates with ‘decreased
 ciprofloxacin (or fluoroquinolone) susceptibility’ (ciprofloxacin MIC 0.125–1.0 μg/ml) and nalidixic acid-resistant strains isolates (as proxy marker for
 ‘decreased ciprofloxacin (or fluoroquinolone) susceptibility’) as fluoroquinolone non‐susceptible (FQNS)
Browne et al. BMC Medicine        (2020) 18:1                                                                                        Page 14 of 22

 Fig. 5 FQNS S. Typhi in Southeast Asia. Forest plots illustrating the prevalence of FQNS amongst S. Typhi in South Asia, grouped by 5‐year time
 periods. Individual study results are displayed with 95% confidence intervals; the pooled prevalence [95%CI] for each subgroup is represented by
 the blue diamonds

(VITEK 2, RapidATB) or microdilution. The remaining                        isolates) and 85% (71 isolates) in S. Typhi was reported
studies performed disc diffusion, but none of these de-                    by studies conducted in India and Pakistan [95–97]. The
termined MICs. Only one study with 3% resistance de-                       first two studies performed Kirby-Bauer disc diffusion
scribed ESBL-testing, but did not report the results [90].                 testing and MIC determination by E-test, whilst the lat-
Seven studies reported > 5% ceftriaxone resistance. Of                     ter study deployed disc diffusion testing only.
these, one study reported 17% (157 strains) resistance
using VITEK2 [91], and one study performed agar dilu-                      Discussion
tion for all the isolates and reported intermediate resist-                Our systematic review and meta-analysis, encompassing
ance (MIC < 2 μg/mL) for 100% (27/27) of the isolates,                     384 articles equating to 94,616 S. Typhi and 29,731 S.
but ESBL-testing was not performed [92]. The remaining                     Paratyphi A isolates (124,347 isolates in total), provides
five studies (resistance between 6 and 13%) used Kirby-                    comprehensive evidence of the magnitude and geo-
Bauer disc diffusion testing, and in addition, three of the                graphic extent of the AMR problem in enteric fever. We
studies performed MIC testing by agar dilution [46, 88,                    described and analysed the consecutive emergence of re-
93]. However, ceftriaxone resistance was confirmed by                      sistance to different antimicrobial classes, reflecting the
MIC testing in only one study [93].                                        potential selection pressure imposed by the use of differ-
   Due to the lack of CLSI interpretive criteria for azi-                  ing antimicrobials to treat enteric fever [98].
thromycin and S. Typhi before 2015, fewer studies (59/                       The start of our study coincided with the height of the
384; 15%) reported azithromycin susceptibility testing.                    MDR S. Typhi epidemic in South and Southeast Asia in
Data from 22 studies could be standardised according to                    the early 1990s [14, 99]. The subsequent change to the
the BSAC guidelines [94]. Resistant isolates were those                    FQs, which have excellent pharmacological properties and
with an MIC > 16 μg/ml [epidemiological cut-off value;                     are recommended as the treatment of choice [11], led to
corresponding to EUCAST 2014 guidelines] or by disc                        the emergence of FQNS isolates, characterised by muta-
diffusion, a zone diameter ≤ 18 mm (Additional file 1:                     tions in the FQ target genes which determine nalidixic
Table S5). Fourteen studies reported no resistance                         acid resistance and higher FQ MICs. These organisms
against azithromycin and five identified < 10% resistance.                 were associated with poor clinical outcomes and higher
Azithromycin resistance of 13% (16 isolates), 34% (80                      rates of complications [18, 20]. The rise in FQNS
Browne et al. BMC Medicine    (2020) 18:1                                                                            Page 15 of 22

Table 3 Pooled percentage prevalence [95% confidence intervals] of multidrug resistance and fluoroquinolone non-susceptibility
amongst S. Typhi and S. Paratyphi A, grouped by region and five-year time-period

necessitated a switch to parenteral ceftriaxone, which re-        FQNS is posing a new treatment problem, with alternative
quires hospitalisation, cefixime, which has been demon-           antimicrobials like azithromycin and ceftriaxone either
strated to be clinically less effective [100], or azithromycin.   not routinely available or unaffordable in resource-limited
However, resistance to these antimicrobials is also on the        settings. Our study emphasises the contribution of S. Para-
increase, exemplified by the worrying recent emergence of         typhi A to the AMR problem. Although the prevalence of
extensively drug-resistant (XDR) S. Typhi organisms in            MDR S. Paratyphi A was low, we found high prevalence of
Pakistan [101], exhibiting MDR, FQR and ceftriaxone-              FQNS S. Paratyphi A in China, India, Nepal and
resistance. In Africa, MDR S. Typhi is widespread and             Bangladesh, often with FQ MICs exceeding those of S.
Browne et al. BMC Medicine        (2020) 18:1                                                                                          Page 16 of 22

 Fig. 6 Stacked bar chart of S. Typhi ciprofloxacin MIC distributions. Data are from three selected studies [64–66] with sample sizes of more than
 90 strains isolates performed in Delhi, India

Typhi [102]. Apart from a trend of decreasing MDR S.                        and data on antimicrobial consumption, and also to in-
Typhi in South Asia (with the exception of Pakistan) and                    vestigate fine-scale geographic variation in resistance
NAME, resistance to the first-line antimicrobials and the                   levels using a geostatistical modelling framework [21].
FQs has increased in enteric fever and is widely distrib-                   Despite estimates of typhoid fever incidence at almost
uted, with ceftriaxone and azithromycin resistance [103,                    500 infections per 100,000 persons per year in India [62]
104] becoming evident.                                                      and high incidences in both rural and urban locations
  We aimed to perform an exhaustive search and pro-                         in Africa [36], the majority of studies had relatively
vide a comprehensive synthesis of all relevant articles                     small sample sizes, reflecting treatment seeking be-
examining AMR enteric fever. This yielded a large num-                      haviour, antimicrobial pretreatment and the low sensi-
ber of studies, with differences in patient selection and                   tivity of blood culture [11, 12, 110]. In LMICs,
blood culture sampling criteria, as well as such with in-                   patients may not have access to or are prevented
complete description of microbiological methods. How-                       from attending health facilities due to high out-of-
ever, the AMR trends shown in our analysis are                              pocket costs, therefore seeking treatment over the
corroborated by longitudinal studies performed by single                    counter from community pharmacies or in the infor-
centres according to standard clinical protocols, utilising                 mal sector. Even if blood culture is available, it is
microbiology laboratories with international EQA                            often not performed, as each test incurs further costs
schemes or ISO accreditation (C. Dolecek, personal ob-                      for the patient [111]. These factors contribute to the
servations) [18, 33, 53, 77, 102, 105–108].                                 underrepresentation of culture confirmed enteric fever
  Apart from highlighting temporal trends in the seven                      and bacterial infections in more general.
GBD regions, our study also points at the variability of                      Our systematic review highlights many data gaps. For
resistance between countries and even within a single                       example, the majority of studies were performed on the
country (e.g. India, Vietnam). The variability between                      Indian Subcontinent, where the burden of enteric fever
neighbouring countries is particularly notable in South-                    is the highest [1, 62]. In Africa, despite a considerable
east Asia, with low levels of MDR and FQNS resistance                       disease burden [36], AST data were only available in ten
in Laos and Indonesia. This is likely due to a mixture of                   countries, where they tended to be reported by a small
factors, which include the scarcity of microbiological                      number of institutions. Data were particularly sparse in
facilities which might not allow a complete picture, dif-                   West and Central Africa. Yet, routine surveillance of
fering patterns of economic development, medical infra-                     AMR is critical to assess the effectiveness of antimicro-
structure and antimicrobial consumption, differences in                     bial regimens and to guide local and national treatment
transmission and circulating organism genotypes [42,                        policies [17]. The paucity of microbiology facilities and
109]. We plan to explore these potential sources of het-                    the consequent lack of AST data to inform empirical
erogeneity in-depth, using individual patient datasets                      antimicrobial treatment have ramifications beyond
Browne et al. BMC Medicine   (2020) 18:1                                                                     Page 17 of 22

enteric fever [3, 112, 113]. Although there is no defined     MIC) [46, 76, 88], raising doubt about the reliability of
AMR threshold for enteric fever, there is agreement that      some of these results. For example, one study reported
20% AMR prevalence should trigger a change in empir-          100% intermediate ceftriaxone resistance but did not in-
ical treatment policy for uncomplicated bacterial infec-      vestigate ESBL-production or discuss these alarming re-
tions, with a lower threshold for life-threatening            sults [92].
infections and outpatients [114]. Our forest plots do not       High-quality AST testing is an important public health
include a vertical bar to indicate this clinical threshold,   tool; identifying AMR will guide practitioners towards
but once resistance is 20% and above, this specific anti-     effective antimicrobial regimens and enable updated
microbial regimen is considered ineffective and unsafe        local treatment guidelines, whilst at the same time it also
and should no longer be used for empirical treatment in       prevents practitioners being steered away from effective
this setting. Conversely, the lack of data from South         antimicrobials due to unsubstantiated results. These is-
America and South Africa is consistent with a low inci-       sues are very important as our antimicrobial armament-
dence of enteric fever as consequence of economic pro-        arium is limited.
gress and improvements in water safety over the last
decades [115, 116], therefore not currently fitting the       Limitations
definition of an endemic region [117].                        Our study has several limitations. First, there was high
   Another key finding of our systematic review is the        statistical heterogeneity (I2 > 80%) within each subgroup,
difference in the quality and reporting of public health      raising issues about performing random meta-analysis of
AST data. Conforming to previous systematic reviews [3,       MDR and FQNS S. Typhi and S. Paratyphi A. We con-
113, 118–120], we identified incomplete AST reporting         ducted a sensitivity analysis aimed at explaining some of
in many studies. The absence of robust AST data may           this heterogeneity. We removed studies with characteris-
reflect weaknesses, varying testing methodology and per-      tics that were most likely to contribute to the heterogen-
formance across laboratories in LMICs, but partially also     eity, i.e. studies with less robust methodological detail
reflects the lack of clear and coherent reporting guide-      and small sample sizes. However, we still identified high
lines for microbiology data, comparable to STROBE             heterogeneity and the pooled prevalence estimates
[121]. There is ambiguity whether the statement, ‘AST         remained very similar. We conducted these sensitivity
was performed according to CLSI 2008’, encompasses all        analyses on data from South Asia; there were insufficient
recommended steps, including control organisms and            studies for other geographical regions. Furthermore, we
confirmatory testing of possible ESBL-producing organ-        performed a comparison of the pooled prevalence of the
isms. Less than a third of studies in our dataset de-         meta-analysis with the median prevalence of resistance,
scribed internal quality controls; this concurs with data     as a more conservative summary estimate [112, 113],
from Tadesse (48%; 69/144) [119] and Leopold (47%;            and found an excellent correlation for all subgroups.
120/256) [113]. In addition, several laboratories failed to   One caveat of our study is that the pooled prevalence
state their participation in EQA schemes. This included       for some regions and 5-year time periods had wide con-
well-resourced and established laboratories where EQA         fidence intervals; this was especially true in Africa, due
participation is known to take place but the authors did      to few studies with relatively small sample sizes and het-
not specify this. Recently, reporting guidelines for micro-   erogeneity in the size of the effect. Second, it is likely
biology data (Microbiology Investigation Criteria for         that policies of taking blood cultures, which include pa-
Reporting Objectively; MICRO) were published [122];           tient selection and blood volumes, will differ across hos-
compliance with MICRO guidelines will be greatly bene-        pitals in LMICs, and often, these policies may not be
ficial for future AMR surveillance and research.              consistently implemented. Therefore, the included stud-
   We identified several studies that reported higher pro-    ies might have suffered from selection and sampling
portions of ceftriaxone- and azithromycin-resistant S.        bias. Only a few studies were conducted as multicentre
Typhi organisms than a recently published smaller sys-        studies and used the same protocol at all sites [36, 42,
tematic review on resistance determinants of S. Typhi         124] or provided data over long periods of time using
[123]; this discrepancy may reflect methodological weak-      the same patient selection criteria for blood culture (e.g.
nesses. The majority of studies with a high proportion of     [33, 77, 102, 107]); these studies support our findings.
ceftriaxone-resistant isolates performed disc susceptibil-    The majority of studies were performed by routine hos-
ity testing only, without further MIC and ESBL-testing.       pital microbiology departments and did not report clin-
Whilst these comply with current CLSI guidelines (the         ical information, numbers of annual blood cultures
recommendations to perform confirmatory tests were            screened (as recommended by WHO GLASS [17]) or
removed in 2010), we identified several studies that re-      the denominator population. It might be that only very
ported conflicting results between disc susceptibility        sick patients had blood cultures performed, and there-
testing and MIC testing (i.e. resistance not confirmed by     fore, the proportion of resistance could possibly be
Browne et al. BMC Medicine   (2020) 18:1                                                                                           Page 18 of 22

overestimated [125]. Additionally, most studies were           future. However, there remains no licenced vaccine for S.
performed in urban centres, which have a higher avail-         Paratyphi A. In addition, better surveillance of AMR, in-
ability of antimicrobial drugs, and AMR patterns in            cluding standardised reporting of AST data and rollout of
rural areas may be different. However, due to the emer-        external quality control assessment, is urgently needed to
gence and expansion of certain very successful lineages,       facilitate evidence-based treatment policy and practice.
especially the MDR and FQNS H58 haplotype [126], we
would predict these organisms to be well distributed.          Supplementary information
   Notably, despite searching seven databases, we will         Supplementary information accompanies this paper at https://doi.org/10.
                                                               1186/s12916-019-1443-1.
have missed papers, including non-English language
papers that were not indexed in any of these
                                                                Additional file 1. Supplementary Materials.
databases.
                                                                Additional file 2. Data file S1: Individual study results for multidrug
   Fourth, the analysis of resistance could have been im-       resistance. Data file S2: Individual study results for fluoroquinolone non-
peded by interpretive breakpoint changes for two classes        susceptibility. Data file S3: Indivual study results for ceftriaxone non-
of antimicrobials. Third-generation cephalosporin break-        susceptibility.

points for Enterobacteriaceae were lowered in 2010
[127]. Ceftriaxone-resistant enteric fever was rare at this    Abbreviations
                                                               AMR: Antimicrobial drug resistance, antimicrobial drug resistant;
time; therefore, we did not expect significant changes to      AST: Antimicrobial susceptibility testing; CLSI: Clinical and Laboratory
the resistant proportions. Of more significance, however,      Standards Institute; CI: Confidence interval; ESBL: Extended spectrum beta-
were the lower FQ breakpoints for enteric fever that           lactamases; EQA: External quality assurance; FQ: Fluoroquinolone; GAVI: The
                                                               Vaccine Alliance (formerly the Global Alliance for Vaccines and
came into effect in 2012 [24]. We recategorised isolates       Immunisation); GBD: Global Burden of Disease Study; HIV: Human
to allow the analysis of FQNS S. Typhi and S. Paratyphi        Immunodeficiency Virus; GLASS: Global Antimicrobial Resistance Surveillance
A over the study period. However, this approach is likely      System; LMIC: Low- and middle-income country; MIC: Minimum inhibitory
                                                               concentration; MICRO: Microbiology Investigation Criteria for Reporting
to be an underestimation, as nalidixic acid testing does       Objectively; MDR: Multidrug resistance; NAME: North Africa and the Middle
not capture all mechanisms of decreased FQ susceptibil-        East; PRISMA: Preferred Reporting Items for Systematic Reviews and Meta-
ity [18]. Furthermore, none of the studies used pefloxa-       Analysis; S. Typhi: Salmonella enterica serovar Typhi; S. Paratyphi: Salmonella
                                                               enterica serovar Paratyphi; STROBE: Strengthening the Reporting of
cin (instead of ciprofloxacin) discs for the detection of      Observational Studies in Epidemiology; WHO: World Health Organization
low-level ciprofloxacin resistance [128]. Again, this
might have led to a slight underestimation of the FQNS         Acknowledgements
                                                               We would like to thank Professor Catherine Moyes for scientific expertise and
proportions. Additionally, the relatively wide range of        guidance in the early part of the study and Miss Maria Devine for excellent
MICs, the FQNS isolates will cover, has to be noted.           assistance with retrieving and scanning articles.
The forest plots present categorical data (resistant/inter-
mediate), with ciprofloxacin MICs ranging from above           Authors’ contributions
                                                               CD, BB, SB and SIH conceptualised the study. CD and EH developed the
0.06 to beyond 32 μg/mL. For isolates with lower MICs,         search terms; EH conducted the searches. AJB, BHH, JL, EAPK and CD
the fluoroquinolones, especially if given at higher doses,     screened, extracted and/or checked the data. AJB and CD analysed the data;
might still achieve cure, albeit delayed [18]. However, as     AJB performed the random effects meta-analysis and prepared the tables
                                                               and figures. All authors were involved in the interpretation of the data. AJB
documented, not only the proportions but also the de-          and CD wrote the draft manuscript. All authors revised, commented and ap-
gree of resistance (expressed by the MICs) have in-            proved the final version of the manuscript.
creased during the study period and high-level FQ
                                                               Funding
resistance is now prevalent in South Asia; therefore, FQ       This work was supported by the UK Department of Health and Social Care,
treatment is inappropriate.                                    Fleming Fund, the Wellcome Trust (209142/Z/17/Z), the Bill and Melinda
                                                               Gates Foundation (OPP1176062) and the Li Ka Shing – Oxford Global Health
                                                               Programme. The funder of this study had no role in the study design, data
Conclusions                                                    collection, data analysis, data interpretation or writing of the report. The
Despite these limitations, our report gives conclusive evi-    corresponding author had full access to all the data in the study and had
dence that AMR amongst S. Typhi and S. Paratyphi A is          final responsibility for the decision to submit for publication.
worsening. Antimicrobial treatment of a primarily prevent-
                                                               Availability of data and materials
able infection fuels antimicrobial use [129] and contributes   All data generated or analysed during this study are included in this
to the resistance problem by exposing bystander organisms      published article and its supplementary information files.
to antimicrobials [130]. Interventions that reduce the num-
                                                               Ethics approval and consent to participate
ber of enteric fever infections are urgently needed [131];     Not applicable.
improvements of sanitation and water quality must be
prioritised to reduce the burden of this and other water-      Consent for publication
                                                               Not applicable.
borne infections. In the meantime, the GAVI endorsement
and deployment of conjugate typhoid vaccines offer hope        Competing interests
that the burden of typhoid fever will reduce in the near       The authors declare that they have no competing interests.
Browne et al. BMC Medicine (2020) 18:1 Page 19 of 22
Author details 17. World Health Organisation. Global antimicrobial resistance surveillance
1
Big Data Institute, Li Ka Shing Centre for Health Information and Discovery, system; manual for early implementation. 2015. https://apps.who.int/iris/
University of Oxford, Oxford, UK. 2Institute for Health Metrics and Evaluation, bitstream/handle/10665/188783/9789241549400_eng.pdf?sequence=1.
University of Washington, Seattle, WA, USA. 3Bodleian Health Care Libraries, Accessed 18 Apr 2019.
University of Oxford, Oxford, UK. 4Centre for Tropical Medicine and Global 18. Parry CM, Vinh H, Chinh NT, Wain J, Campbell JI, Hien TT, et al. The
Health, Nuffield Department of Medicine, University of Oxford, Oxford, UK. influence of reduced susceptibility to fluoroquinolones in Salmonella
5
Mahidol-Oxford Tropical Medicine Research Unit, Faculty of Tropical enterica serovar Typhi on the clinical response to ofloxacin therapy. PLoS
Medicine, Mahidol University, Bangkok, Thailand. 6Oxford University Clinical Negl Trop Dis. 2011;5(6):e1163.
Research Unit Nepal, Patan Academy of Health Sciences, Kathmandu, Nepal. 19. Parry CM, Ho VA, Phuong le T, Bay PV, Lanh MN, Tung le T, et al.
7
Oxford University Clinical Research Unit Vietnam, The Hospital for Tropical Randomized controlled comparison of ofloxacin, azithromycin, and an
Diseases, Wellcome Trust Major Overseas Programme, Ho Chi Minh City, ofloxacin-azithromycin combination for treatment of multidrug-resistant
Vietnam. 8Melbourne School of Population and Global Health, University of and nalidixic acid-resistant typhoid fever. Antimicrobial Agents
Melbourne, Melbourne, Australia. 9Department of Health Metrics Sciences, Chemotherapy 2007;51(3):819–825.
School of Medicine, University of Washington, Seattle, USA. 20. Mandeep W, Rajni G, Rajesh M, Premila P, Pushpa A, Mani K. Current
perspectives of enteric fever: a hospital-based study from India. Ann Trop
Received: 9 July 2019 Accepted: 2 October 2019 Paediatr. 2005;25(3):161–74.
21. Hay SI, Rao PC, Dolecek C, Day NPJ, Stergachis A, Lopez AD, et al. Measuring
and mapping the global burden of antimicrobial resistance. BMC Med.
2018;16(1):78.
References 22. Moher D, Liberati A, Tetzlaff J, Altman DG, The PG. Preferred Reporting
1. GBD Typhoid and Paratyphoid Collaborators. The global burden of typhoid Items for Systematic Reviews and Meta-Analyses: The PRISMA statement.
and paratyphoid fevers: a systematic analysis for the Global Burden of PLoS Med. 2009;6(7):e1000097.
Disease Study 2017. Lancet Infect Dis. 2019;19(4):369–81. 23. Arndt MB, Mosites EM, Tian M, Forouzanfar MH, Mokhdad AH, Meller M,
2. Deen J, von Seidlein L, Andersen F, Elle N, White NJ, Lubell Y. Community- et al. Estimating the burden of Paratyphoid A in Asia and Africa. PLoS Negl
acquired bacterial bloodstream infections in developing countries in South Trop Dis. 2014;8(6):e2925.
and Southeast Asia: a systematic review. Lancet Infect Dis. 2012;12(6):480–7. 24. Clinical and Laboratory Standards Institute. Performance standards for
3. Reddy EA, Shaw AV, Crump JA. Community-acquired bloodstream infections antimicrobial susceptibility testing; twenty-second informational
in Africa: a systematic review and meta-analysis. Lancet Infect Dis. 2010; supplement. CLSI document M100-S22. Wayne: Clinical and Laboratory
10(6):417–32. Standards Institute; 2012.
4. Maskey AP, Day JN, Phung QT, Thwaites GE, Campbell JI, Zimmerman M, 25. Agresti A, Coull BA. Approximate is better than “Exact” for interval
et al. Salmonella enterica serovar Paratyphi A and S. enterica serovar Typhi estimation of binomial proportions. Am Stat. 1998;52(2):119–26.
cause indistinguishable clinical syndromes in Kathmandu, Nepal. Clin Infect 26. Higgins JP, Thompson SG, Deeks JJ, Altman DG. Measuring inconsistency in
Dis. 2006;42(9):1247–53. meta-analyses. Bmj. 2003;327(7414):557–60.
5. Ochiai RL, Wang X, von Seidlein L, Yang J, Bhutta ZA, Bhattacharya SK, et al. 27. Barendregt JJ, Doi SA, Lee YY, Norman RE, Vos T. Meta-analysis of
Salmonella paratyphi A rates. Asia Emerg Infect Dis. 2005;11(11):1764–6. prevalence. J Epidemiol Community Health. 2013;67(11):974–8.
6. Crump JA. Typhoid fever and the challenge of nonmalaria febrile illness in 28. Lunguya O, Lejon V, Phoba MF, Bertrand S, Vanhoof R, Verhaegen J, et al.
sub-saharan Africa. Clin Infect Dis. 2012;54(8):1107–9. Salmonella Typhi in the Democratic Republic of the Congo:
7. D'Acremont V, Kilowoko M, Kyungu E, Philipina S, Sangu W, Kahama-Maro J, Fluoroquinolone decreased susceptibility on the rise. PLoS Negl Trop Dis.
et al. Beyond malaria--causes of fever in outpatient Tanzanian children. N 2012;6(11):e1921.
Engl J Med. 2014;370(9):809–17. 29. Muyembe-Tamfum JJ, Veyi J, Kaswa M, Lunguya O, Verhaegen J, Boelaert M.
8. Guerin P, Hopkins H, Thomas N, Elven J, Das D, Eyers J, et al. Mapping the An outbreak of peritonitis caused by multidrug-resistant Salmonella Typhi in
aetiology of non-malarial febrile illness globally in malaria-endemic regions: Kinshasa, Democratic Republic of Congo. Travel Med Infect Dis. 2009;7(1):40–3.
a systematic review. PROSPERO 2016 CRD42016049281. 2016; https://www. 30. Dougle M, Hendriks E, Sanders E, Dorigo-Zetsma JW. Laboratory
crd.york.ac.uk/prospero/display_record.php?ID=CRD42016049 281. investigations in the diagnosis of septicaemia and malaria. East Afr Med J.
9. Abhilash KP, Jeevan JA, Mitra S, Paul N, Murugan TP, Rangaraj A, et al. Acute 1997;74(6):353–6.
undifferentiated febrile illness in patients presenting to a tertiary care 31. Kariuki S, Gilks C, Revathi G, Hart CA. Genotypic analysis of multidrug-
hospital in South India: clinical spectrum and outcome. J Glob Infect Dis. resistant Salmonella enterica Serovar Typhi, Kenya. Emerg Infect Dis. 2000;
2016;8(4):147–54. 6(6):649–51.
10. Murdoch DR, Woods CW, Zimmerman MD, Dull PM, Belbase RH, Keenan AJ, 32. Gordon MA, Walsh AL, Chaponda M, Soko D, Mbvwinji M, Molyneux ME,
et al. The etiology of febrile illness in adults presenting to Patan Hospital in et al. Bacteraemia and mortality among adult medical admissions in Malawi
Kathmandu, Nepal. Am J Trop Med Hyg. 2004;70(6):670–5. - predominance of non-Typhi Salmonellae and Streptococcus pneumoniae.
11. World Health Organisation. Vaccines and Biologicals. Background document: J Infect. 2001;42(1):44–9.
The diagnosis, treatment and prevention of typhoid fever. Geneva: 2003. 33. Feasey NA, Gaskell K, Wong V, Msefula C, Selemani G, Kumwenda S, Allain
https://www.glowm.com/pdf/WHO-diagnosis%20treatment%2 TJ, Mallewa J, Kennedy N, Bennett A, Nyirongo JO, Nyondo PA, Zulu MD,
0prevention%20of%20typhoid%20fever-2003-CustomLicense.pdf. Assessed Parkhill J, Dougan G, Gordon MA, Heyderman RS. Rapid emergence of
18 Apr 2019. multidrug resistant, H58-lineage Salmonella typhi in Blantyre, Malawi. PLoS
12. Arjyal A, Basnyat B, Koirala S, Karkey A, Dongol S, Agrawaal KK, et al. Negl Trop Dis. 2015;9(4):e0003748.
Gatifloxacin versus chloramphenicol for uncomplicated enteric fever: an 34. Ki-Zerbo GA, Sawadogo AB, Kyelem N, Zoubga A, Thiombiano R, Durand G.
open-label, randomised, controlled trial. Lancet Infect Dis. 2011;11(6):445–54. Enterobacteriaceae bacteriemia in human deficiency virus seropositive in
13. Wain J, Diep TS, Ho VA, Walsh AM, Nguyen TT, Parry CM, et al. Quantitation patients at Bobo-Dioulasso hospital (Burkina Faso): study of 26 cases.
of bacteria in blood of typhoid fever patients and relationship between Medecine et Maladies Infectieuses. 2000;30(12):753–6.
counts and clinical features, transmissibility, and antibiotic resistance. J Clin 35. Maltha J, Guiraud I, Kaboré B, Lompo P, Ley B, Bottieau E, Van Geet C, Tinto
Microbiol. 1998;36(6):1683–7. H, Jacobs J. Frequency of severe malaria and invasive bacterial infections
14. Parry CM, Hein TT, Dougan G, White NJ, Farrar JJ. Typhoid fever. N Engl J among children admitted to a rural hospital in Burkina Faso. PLoS One.
Med. 2002;347(22):1770–82. 2014;9(2):e89103.
15. World Health Organisation. Global strategy for containment of antimicrobial 36. Marks F, Kalckreuth V, Aaby P, Adu-Sarkodie Y, Tayeb M, Ali M, et al. Incidence
resistance. https://www.who.int/drugresistance/WHO_Global_Strategy_ of invasive Salmonella disease in sub-Saharan Africa: a multicentre population-
English.pdf?ua=1. Accessed 22 Nov 2018. 2001. based surveillance study. Lancet Glob Health. 2017;5(3):e310–e23.
16. World Health Organisation. Antimicrobial resistance: global report on 37. Akinyemi KO, Coker AO, Olukoya DK, Oyefolu AO, Amorighoye EP,
surveillance 2014. http://apps.who.int/iris/bitstream/handle/10665/112642/ Omonigbehin EO. Prevalence of multi-drug resistant Salmonella Typhi
9789241564748_eng.pdf?sequence=1. Accessed 22 Nov 2018. among clinically diagnosed typhoid fever patients in Lagos, Nigeria.You can also read


