A human model of Batten disease shows role of CLN3 in phagocytosis at the photoreceptor-RPE interface - Nature
←
→
Page content transcription
If your browser does not render page correctly, please read the page content below
ARTICLE
                  https://doi.org/10.1038/s42003-021-01682-5                 OPEN

                  A human model of Batten disease shows role of
                  CLN3 in phagocytosis at the photoreceptor–RPE
                  interface
1234567890():,;

                  Cynthia Tang1,8, Jimin Han1,8, Sonal Dalvi1, Kannan Manian1, Lauren Winschel1, Stefanie Volland2,
                  Celia A. Soto 1, Chad A. Galloway 1, Whitney Spencer1, Michael Roll1, Caroline Milliner3, Vera L. Bonilha3,
                  Tyler B. Johnson4, Lisa Latchney1, Jill M. Weimer4, Erika F. Augustine5, Jonathan W. Mink5, Vamsi K. Gullapalli1,
                  Mina Chung1,6, David S. Williams 2 & Ruchira Singh 1,6,7 ✉

                  Mutations in CLN3 lead to photoreceptor cell loss in CLN3 disease, a lysosomal storage
                  disorder characterized by childhood-onset vision loss, neurological impairment, and pre-
                  mature death. However, how CLN3 mutations cause photoreceptor cell death is not known.
                  Here, we show that CLN3 is required for phagocytosis of photoreceptor outer segment (POS)
                  by retinal pigment epithelium (RPE) cells, a cellular process essential for photoreceptor
                  survival. Specifically, a proportion of CLN3 in human, mouse, and iPSC-RPE cells localized to
                  RPE microvilli, the site of POS phagocytosis. Furthermore, patient-derived CLN3 disease
                  iPSC-RPE cells showed decreased RPE microvilli density and reduced POS binding and
                  ingestion. Notably, POS phagocytosis defect in CLN3 disease iPSC-RPE cells could be rescued
                  by wild-type CLN3 gene supplementation. Altogether, these results illustrate a novel role of
                  CLN3 in regulating POS phagocytosis and suggest a contribution of primary RPE dysfunction
                  for photoreceptor cell loss in CLN3 disease that can be targeted by gene therapy.

                  1 Department of Ophthalmology and Biomedical Genetics, University of Rochester, Rochester, NY, USA. 2 Department of Ophthalmology, Stein Eye Institute,

                  Department of Neurobiology, David Geffen School of Medicine, Molecular Biology Institute, Brain Research Institute, University of California, Los Angeles, CA,
                  USA. 3 Department of Ophthalmic Research, Cleveland Clinic, Cleveland, OH, USA. 4 Sanford Research, Sioux Falls, SD, USA. 5 Department of Neurology,
                  University of Rochester, Rochester, NY, USA. 6 Center for Visual Science, University of Rochester, Rochester, NY, USA. 7 UR Stem Cell and Regenerative
                  Medicine Center, University of Rochester, Rochester, NY, USA. 8These authors contributed equally: Cynthia Tang, Jimin Han. ✉email: ruchira_singh@urmc.
                  rochester.edu

                  COMMUNICATIONS BIOLOGY | (2021)4:161 | https://doi.org/10.1038/s42003-021-01682-5 | www.nature.com/commsbio                                                 1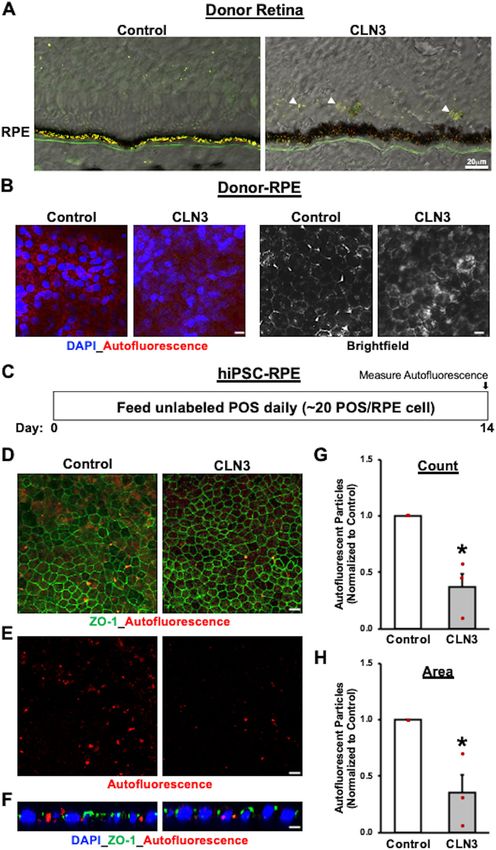
ARTICLE                                                               COMMUNICATIONS BIOLOGY | https://doi.org/10.1038/s42003-021-01682-5

N
         euronal ceroid lipofuscinoses (NCLs) describes a group of             In this study, using primary mouse and human RPE, CLN3
         genetically distinct neurodegenerative lysosomal storage           overexpression, and hiPSC-based disease modeling experiments,
         diseases that involve excessive accumulation of lipofuscin.        we show that a proportion of CLN3 in RPE cells is localized to the
Juvenile NCL (JNCL) can be caused by mutations in CLN3                      RPE apical microvilli. Notably, cell-autonomous CLN3 dysfunc-
(CLN3-Batten, CLN3 disease). CLN3 disease, the most common                  tion in RPE cells is sufficient to affect RPE microvillar density and
form of NCL, presents in early childhood with vision loss as the            POS binding and consequently POS uptake by the CLN3 disease
first clinical feature, followed some years later by progressive             hiPSC-RPE cells, leading to decreased accumulation of auto-
neurological dysfunction and ultimately premature death1–7.                 fluorescent POS-digestion products in the CLN3 disease hiPSC-
Although it is well established that retinal damage is responsible          RPE cells. This result, together with longitudinal multimodal
for vision loss in CLN3 disease, the primary cellular and                   imaging of the retina in a CLN3 disease patient, suggests that
molecular mechanisms leading to retinal degeneration in CLN3                autofluorescent changes in the photoreceptor–RPE complex that
disease are not known. This is partly due to limited and                    are concordant with POS phagocytosis defect may precede pho-
conflicting data on CLN3 localization and function in the                    toreceptor cell loss in CLN3 disease. Importantly, lentivirus-
retina2,8–11, and lack of a suitable model system that recapi-              mediated overexpression of wild-type CLN3 can rescue POS
tulates the human disease phenotype. Furthermore, clinical and              phagocytosis defect in the CLN3 disease hiPSC-RPE cells. Alto-
histopathologic studies have shown the involvement of multiple              gether, our data define a previously unidentified role of CLN3 at
retinal cell layers in CLN3 pathology, suggesting a potentially             the photoreceptor–RPE interface and suggest a contribution of
complex etiology12–14. Specifically, the accumulation of auto-               primary RPE dysfunction in instigating reduced RPE lipofuscin
fluorescent lipopigment (lipofuscin) in retinal neurons and                  that can be therapeutically targeted by gene augmentation.
degeneration of multiple retinal cell layers has been docu-
mented in CLN3 disease13,14.
   High levels of lipofuscin are a characteristic of the retinal            Results
pigment epithelium (RPE) in many macular dystrophies15–17.                  Chronic POS feeding leads to reduced autofluorescent material
Increased lipofuscin has also been shown experimentally to                  accumulation in CLN3 disease hiPSC-RPE compared to par-
accumulate in mouse models of defective photoreceptor outer                 allel cultures of control hiPSC-RPE. Histopathological studies
segment (POS) phagosome degradation18,19. However, the RPE                  on human cadaver eyes from donors with CLN3 disease have
in CLN3 disease has notably low levels of lipofuscin13,14, even             shown reduced lipofuscin compared to unaffected control
though it still undergoes atrophy13. One explanation for this               individuals1,13,14. However, the mechanism underlying reduced
apparent paradox is that loss of vision in CLN3 disease patients            lipofuscin accumulation in CLN3 disease RPE cells is not known.
starts at a young age (5–10 years old5), with reduced rod and cone          In an attempt to recapitulate this characteristic RPE phenotype
responses2,20,21 and photoreceptor cell loss2,21,22, and that the low       and isolate the plausible contribution of RPE dysfunction in
levels of lipofuscin in the RPE result from the presence of fewer           CLN3 disease, hiPSCs from control (unaffected heterozygote
photoreceptors. Each mammalian RPE cell ingests and degrades                family member, unrelated healthy subject) and 2 distinct CLN3
10% of the distal POS disks on a daily basis23, and lipofuscin              patients harboring the common 966 bp homozygous deletion in
accumulates normally with age as a result of POS degradation                CLN341 were differentiated to RPE cells in culture and analyzed.
products24. Fewer photoreceptors mean fewer POS phagosomes,                 Control and CLN3 disease hiPSC-RPE display several typical RPE
resulting in reduced lipofuscin accumulation14,25,26. Because of            characteristics including expected localization of RPE-signature
the early onset of disease, it is not clear whether the photo-              proteins: Zonula Occludens-1 (ZO-1: tight junctions, Fig. 1A),
receptor cell loss precedes any changes in the RPE, as would be             Ezrin (EZR; apical, Fig. 1B) and Bestrophin-1 (BEST1: basolateral,
predicted by this explanation. An alternative explanation for               Fig. 1C), expression of several RPE-signature genes/proteins:
reduced RPE lipofuscin is that there is another defect associated           BEST1, Cellular Retinaldehyde-Binding Protein (CRALBP), EZR,
with the RPE, besides lysosomal dysfunction. For example, it is             MER proto-oncogene, Tyrosine Kinase (MERTK), Melanocyte
plausible that RPE cells fail to take up POS in CLN3 disease. This          Inducing Transcription Factor (MITF), Occludin (OCLN),
hypothesis could also explain the increased autofluorescence                 Pigment Epithelium-Derived Factor (PEDF), and Retinoid Iso-
accumulation observed in the photoreceptor layer (presence of               merohydrolase (RPE65) (Fig. 1D, E); and formation of functional
POS debris) and photoreceptor loss in CLN3 disease1,21,27,28.               tight junctions with transepithelial resistance (TER) comparable
Indeed, decreased uptake of POS by RPE cells in a form of reti-             to human RPE cells in vivo (Fig. 1F)42,43. Furthermore, consistent
nitis pigmentosa caused by mutations in the MERTK gene29,30                 with a polarized RPE monolayer, control and CLN3 hiPSC-RPE
leads to a similar pathology as CLN3 disease. However, apart                formed fluid domes when cultured on non-permeable plastic
from one published study in a mouse model31, the role of RPE                support (Supplementary Fig. 1). Overall, control and CLN3
cell dysfunction in CLN3 disease retinal pathology has not been             hiPSC-RPE showed several baseline characteristics akin to in vivo
investigated.                                                               human RPE monolayer.
   The human induced pluripotent stem cell (hiPSC) technology                  Given that autofluorescent material accumulation in RPE cells
allows the investigation of pathological and molecular changes in           is a consequence of POS uptake and digestion, we next evaluated
an individual cell type, using cells derived from patients. With            if daily feeding of a physiological dose of POS for a prolonged
regard to human retinal diseases, the use of hiPSCs is specifically          duration would be sufficient to mimic the patterns of RPE
pertinent to RPE-based disorders32–35. Despite the fact that                autofluorescence accumulation seen in control versus CLN3
hiPSC-RPE monocultures lack the complexity of functional                    disease donor eyes (Fig. 2A)1,13,14. Of note, autofluorescence
and structural interactions with photoreceptors, they have been             accumulation was analyzed in the spectral range that is consistent
successfully used to investigate the pathological mechanisms                with lipofuscin accumulation in human retina/RPE cells24,44.
of both early onset retinal diseases, such as Best disease36 and late       Specifically, confocal microscopy analyses of retina sections and
onset disease, such as age-related macular degeneration37,38.               RPE wholemounts showed increased autofluorescence material/
In fact, several studies have now shown that feeding a physiolo-            debris accumulation in the photoreceptor layer and reduced
gical amount of POS to hiPSC-RPE cells can be utilized to                   autofluorescence in RPE cells from CLN3 disease donor eyes
investigate POS phagocytosis regulation in normal versus dis-               compared to RPE autofluorescence in non-CLN3 donor eyes, an
eased cells36,39,40.                                                        age-matched donor eye with Charcot Marie Tooth Disease and

2                         COMMUNICATIONS BIOLOGY | (2021)4:161 | https://doi.org/10.1038/s42003-021-01682-5 | www.nature.com/commsbio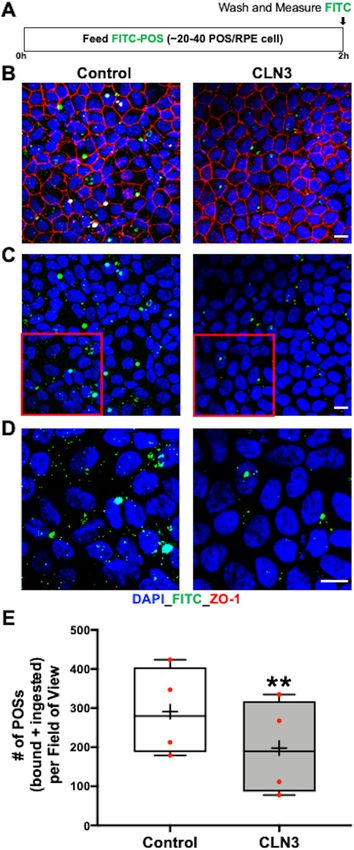
COMMUNICATIONS BIOLOGY | https://doi.org/10.1038/s42003-021-01682-5                                                             ARTICLE

adult healthy control donor eye (Fig. 2A, B; Supplementary                     RPE, the amount of autofluorescence was decreased in CLN3
Fig. 2). Importantly, the reduced RPE autofluorescence in the                   disease hiPSC-RPE cells compared to parallel cultures of control
CLN3 disease donor eye was not a consequence of RPE atrophy/                   hiPSC-RPE cells (Fig. 2D–H). Note that control and CLN3
cell death, as decreased RPE autofluorescence was also observed                 disease hiPSC-RPE display similar localization of tight junction
in areas with intact RPE monolayer (Fig. 2B). Next, a previously               marker, ZO-1 (Fig. 2D). In contrast, the amount of autofluor-
established protocol36,45 was utilized to evaluate the abundance of            escence was decreased in CLN3 disease hiPSC-RPE cells
POS-digestion products or autofluorescence accumulation in                      (Fig. 2D–H). Furthermore, orthogonal view of hiPSC-RPE
control versus CLN3 disease hiPSC-RPE cells (Fig. 2C). Analysis                sections confirmed that autofluorescence accumulation post-
of autofluorescence material post-chronic POS feeding (Fig. 2C),                chronic POS feeding was within the control and CLN3 disease
showed that consistent with pathology of human CLN3 disease                    hiPSC-RPE cells (Fig. 2F). Of note, parallel cultures of control

COMMUNICATIONS BIOLOGY | (2021)4:161 | https://doi.org/10.1038/s42003-021-01682-5 | www.nature.com/commsbio                                  3
ARTICLE COMMUNICATIONS BIOLOGY | https://doi.org/10.1038/s42003-021-01682-5
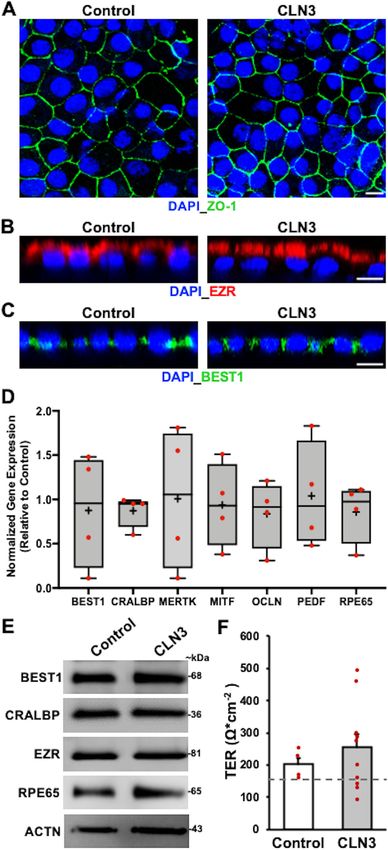
Fig. 1 Baseline RPE characteristics are similar in control and CLN3 disease hiPSC-RPE cells. A–C Representative confocal microscopy images showing
similar and expected localization of tight junction marker, Zonula Occludens-1 (ZO-1) (A), apically localized RPE protein, Ezrin (EZR) (B), and basolaterally
expressed RPE protein, Bestrophin-1 (BEST1) (C), in control and CLN3 disease hiPSC-RPE cells. Of note, cell nuclei are stained with DAPI (Scale bar = 10
µm) (n ≥ 3). D Quantitative real-time PCR analyses showing similar expression of RPE-signature genes in CLN3 disease hiPSC-RPE cells relative to control
hiPSC-RPE cells: BEST1 (p = 0.76), Cellular Retinaldehyde-Binding Protein (CRALBP; p = 0.30), MER proto-oncogene (MERTK; p = 0.98), Microphthalmia-
associated Transcription Factor (MITF; p = 0.83), Occludin (OCLN; p = 0.50), Pigment Epithelium-Derived Factor (PEDF; p = 0.91), Retinoid
Isomerohydrolase RPE65 (p = 0.51). GAPDH served as loading control. (Control: n = 3, CLN3: n = 4). Of note, in the boxplots, + represents mean, center
line represents median, box represents interquartile range between first and third quartiles, and whiskers represent 1.5* interquartile range.
E Representative Western blot images showing similar expression of RPE-signature proteins (n = 3): BEST1 (68 kDa), CRALBP (36 kDa), EZR (81 kDa),
RPE65 (65 kDa), and Actin (ACTN, 43 kDa). F Transepithelial resistance (TER) measurements showing the presence of functional tight junctions with TER
similar to the reported in vivo threshold of ~150 Ω cm−242,43 (dotted line) in both control and CLN3 disease hiPSC-RPE cells grown as a monolayer on
Transwell inserts (Control: n = 4, CLN3: n = 10; p = 0.27). For all graphs in Fig. 1, statistical significance was determined using two-tailed unpaired
Student’s t-test.
and CLN3 disease hiPSC-RPE at a similar age (~60–90 days in fed control and CLN3 disease hiPSC-RPE wholemounts, immu-
culture) displayed no autofluorescence in the absence of POS nostained for cell nuclei (DAPI) and tight junction protein (ZO-
feeding (Supplementary Fig. 3). 1), showed a reduced number of FITC-POS both apically and
Altogether, these results show that decreased autofluorescence basally relative to ZO-1 localization (Supplementary Fig. 4).
accumulation, a known pathological characteristic of CLN3 Using a previously published protocol46, analyses of FITC-POS
disease RPE in vivo, can be mimicked in patient-derived localized apically (bound) versus basally (internalized) relative to
hiPSC-RPE cells. Furthermore, the ability to recapitulate the ZO-1, showed reduced numbers of both bound and internalized
difference in autofluorescence material accumulation between POS in CLN3 disease hiPSC-RPE cells compared to control
control and CLN3 disease hiPSC-RPE cells after prolonged hiPSC-RPE cells (Supplementary Fig. 4). In contrast, the number
exposure to unaffected (no CLN3 mutation) POS, suggests that of internalized FITC-POS normalized to number of bound FITC-
RPE autonomous CLN3 dysfunction is sufficient to instigate the POS was not different in control versus CLN3 disease hiPSC-RPE
reduced RPE autofluorescence observed in CLN3 disease eyes. cells (Supplementary Fig. 4). Overall, these results suggest a POS-
binding defect in CLN3 disease hiPSC-RPE cells. To further
confirm a POS-binding defect in CLN3 disease hiPSC-RPE cells,
Decreased POS phagocytosis by CLN3 disease hiPSC-RPE we next evaluated the amount of bound-POS in control versus
compared to control hiPSC-RPE cells. Decreased auto- CLN3 disease hiPSC-RPE cells 30 min post-POS feeding
fluorescent material accumulation in CLN3 disease hiPSC-RPE (Fig. 5A–E). Specifically, control and CLN3 disease hiPSC-RPE
after chronic POS-feeding (Fig. 2) implicated impaired POS cells were fed ~20–40 FITC-POS/RPE cell for 30 min at 17 °C
uptake by CLN3 disease hiPSC-RPE cells. Therefore, to confirm a (Fig. 5A), a temperature conducive to POS binding but not POS
POS phagocytosis defect, we next performed acute experiments to internalization47. Next, the number of FITC-POS (bound) was
compare POS uptake34,36,45 by control versus CLN3 disease compared between control and CLN3 disease hiPSC-RPE cells
hiPSC-RPE cells. Briefly, FITC-labeled or unlabeled POS (~20–40 (Fig. 5B–E). Quantification of FITC-POS after immunocyto-
POS/RPE cell) were fed to parallel cultures of control and CLN3 chemical analyses revealed a lower number of bound-FITC-POS
disease hiPSC-RPE for 2 h and POS uptake was quantified by in CLN3 disease hiPSC-RPE cells compared to control hiPSC-
measuring the levels of FITC or rhodopsin (RHO) (a POS-specific RPE cells (Fig. 5B–E). Of note, consistent with preferential POS-
protein) within the hiPSC-RPE cells (Fig. 3A) (see Methods binding and limited POS uptake at 17 °C, orthogonal view of
section for further details). Confocal microscopy analyses of FITC hiPSC-RPE fed FITC-POS for 30 min at 17 °C, and immunos-
fluorescence in control and CLN3 disease hiPSC-RPE cells after tained for cell nuclei (DAPI), and tight junction protein (ZO-1),
POS feeding showed a reduced number of total FITC-POS showed FITC-POS expression predominantly apically to ZO-1
(bound+ingested) in CLN3 disease hiPSC-RPE cells compared to staining in both control and CLN3 disease hiPSC-RPE cells
control hiPSC-RPE cells (Fig. 3B–E). Furthermore, Western blot (Supplementary Fig. 5). Interestingly, quantitative Western blot
analyses of unlabeled POS uptake (bound+ingested) through analyses showed no difference in the levels of POS engulfment
quantification of RHO, a POS-specific protein (Fig. 4A), showed receptor (MERTK) and POS binding receptor (Integrin Subunit
reduced RHO levels post-POS feeding in CLN3 disease hiPSC- Alpha V (ITGAV), Integrin Subunit Beta 5 (ITGB5)) between
RPE cells compared to control hiPSC-RPE cells (Fig. 4B–G). control and CLN3 disease hiPSC-RPE cells (Supplementary
Notably, reduced RHO/POS uptake by CLN3 disease hiPSC-RPE Fig. 6). With a recent study showing abnormal F-actin cytoske-
cells was seen when comparing parallel cultures of both (i) young leton reduces the POS binding in stem cell-derived cultures46 and
control and CLN3 hiPSC-RPE cells that were cultured for the previously reported finding that CLN3 deficiency has been
~20–40 days (~D20-40) (Fig. 4B–D) and (ii) aged control and shown to cause abnormally organized actin and cytoskeleton
CLN3 hiPSC-RPE cells (~D60-D150; Fig. 4E–G). Overall, the architecture in other cell type(s)48, we next evaluated F-actin
decreased amount of both FITC-POS and RHO in CLN3 hiPSC- morphology in control versus CLN3 disease hiPSC-RPE cultures
RPE cells compared to control hiPSC-RPE cells post-POS feeding (Fig. 6A, B). Localization of F-actin using phalloidin staining
suggests that CLN3 is required for efficient POS phagocytosis by showed the expected and similar localization of F-actin in control
hiPSC-RPE cells. versus CLN3 disease hiPSC-RPE cultures (Fig. 6A). Furthermore,
orthogonal view of RPE cultures revealed apically localized F-
CLN3 regulates POS binding by hiPSC-RPE cells. Having actin in both control and CLN3 disease hiPSC-RPE cultures
established a POS phagocytosis defect in CLN3 disease hiPSC- (Fig. 6B). Although no overt defects in F-actin localization were
RPE cells, we next evaluated whether disease-causing mutations seen in CLN3 disease hiPSC-RPE cells, transmission electron
in CLN3 preferentially affect POS binding versus POS inter- microscopy (TEM) analyses of control and CLN3 disease hiPSC-
nalization by hiPSC-RPE cells. Orthogonal views of FITC-POS RPE cells showed reduced density of apical microvilli in CLN3
4 COMMUNICATIONS BIOLOGY | (2021)4:161 | https://doi.org/10.1038/s42003-021-01682-5 | www.nature.com/commsbio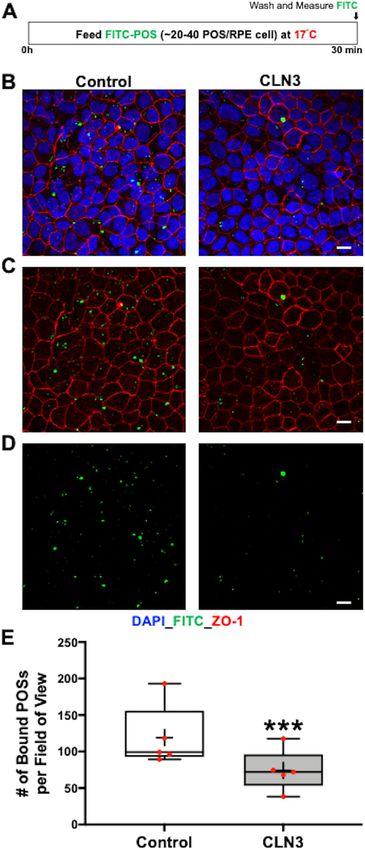
COMMUNICATIONS BIOLOGY | https://doi.org/10.1038/s42003-021-01682-5                                                               ARTICLE

disease hiPSC-RPE cells compared to control hiPSC-RPE cells                    A proportion of CLN3 is localized in the RPE microvilli in
(Fig. 6C, D). In contrast, no difference in microvilli width                   both native human and mouse tissue and hiPSC-RPE cells.
(Fig. 6C, E) and length (Fig. 6C, F) was seen between control and              Given the data demonstrating a role of CLN3 in RPE apical
CLN3 disease hiPSC-RPE cells.                                                  microvilli homeostasis and POS binding by hiPSC-RPE cells
   Altogether, these results suggest that CLN3 is required for RPE             (Figs. 5, 6), we investigated the localization of CLN3 within RPE
apical microvilli homeostasis and POS binding by human RPE                     cells. Of note, although CLN3 has never been reported to reside in
cells. Furthermore, because RPE apical microvilli density affects              RPE microvilli, CLN3 was shown to be present in the microvilli of
POS binding by RPE cells46, it is plausible that the loss of apical            the Malpighian tubules in a Drosophila model49. Immunocyto-
microvilli contributes to reduced POS binding by CLN3 disease                  chemical analyses showed apical localization of CLN3 in control
hiPSC-RPE cells.                                                               hiPSC-RPE cells and co-localization of CLN3 with an RPE

COMMUNICATIONS BIOLOGY | (2021)4:161 | https://doi.org/10.1038/s42003-021-01682-5 | www.nature.com/commsbio                                    5
ARTICLE                                                                 COMMUNICATIONS BIOLOGY | https://doi.org/10.1038/s42003-021-01682-5

Fig. 2 Decreased accumulation of autofluorescent material after chronic POS-feeding in CLN3 disease hiPSC-RPE cells mimics reduced presence of
autofluorescent POS-digestion products in CLN3 disease donor RPE monolayer. A Autofluorescence overlying brightfield images in cryosections of mid-
periphery fragments of retina-RPE-choroids obtained from a CLN3 disease donor and age-matched control eye showed decreased accumulation of
autofluorescent material in the RPE layer of CLN3 disease donor eyes in spectral wavelength consistent with lipofuscin (red and green channels).
Additionally, increased accumulation of autofluorescent debris is seen in the photoreceptor layer (indicated by white arrowheads) in the CLN3 disease
donor retina compared to control retina. (Scale bar = 20 µm) (n = 1). B Confocal microscopy analyses of RPE wholemounts obtained from the same CLN3
disease and control donor eyes (as were shown in panel A) showed decreased autofluorescence (measured in red channel) in areas with intact RPE
monolayer. Of note, light microscopy images (right panel) are from the same area of view as autofluorescence images (left panel) (scale bar = 10 µm)
(n = 1). Furthermore, to use age-matched control, control cadaver RPE used in panels A, B was from a donor with Charcot Marie Tooth Disease.
C Schematic showing the experimental design used to assess autofluorescence material accumulation in hiPSC-RPE cells with chronic POS-feeding. As
shown, hiPSC-RPE were fed a physiological dose of unlabeled POS (~20 POS/RPE cell) daily for 14 days. Subsequently, the cells were fixed, immunostained
and imaged for autofluorescent material accumulation (red channel) using confocal microscopy. D–F Consistent with CLN3 disease donor RPE data (A, B),
confocal microscopy analyses after 2 weeks of daily POS feeding showed decreased autofluorescent material (ex: 546 nm, em: 560–615 nm) in CLN3
disease hiPSC-RPE monolayer compared to control hiPSC-RPE monolayer. In contrast, similar localization of tight junction protein (ZO-1) was seen in both
control and CLN3 hiPSC-RPE monolayers. Of note, panel (E) shows the same image region of control and CLN3 disease hiPSC-RPE as panel D but displays
autofluorescence material accumulation without ZO-1 staining (scale bar = 10 µm) (n = 3). F Representative orthogonal view of confocal z-stack images
showing that autofluorescent material localizes basal to the tight junction marker, ZO-1, and is within the control and CLN3 disease hiPSC-RPE cells. Cell
nuclei is stained with DAPI (scale bar = 10 µm) (n = 3). G, H Quantitative analyses showing both decreased count (G, p = 0.011) and area (H, p = 0.026)
of accumulated autofluorescent material (ex: 546 nm, em: 560–615 nm) after 14 days of consecutive POS feeding in parallel cultures of control versus
CLN3 disease hiPSC-RPE cells (n = 3). Statistical significance was determined using two-tailed unpaired Student’s t-test. *p < 0.05.

microvilli marker, EZR (Fig. 7A). To further confirm CLN3                         To validate the CLN3 localization data in hiPSC-RPE cells
localization to hiPSC-RPE microvilli, we next analyzed control                (Fig. 7A–D, Supplementary Fig. 9), we next examined primary
hiPSC-RPE cells using subcellular fractionation. We isolated RPE              human RPE and mouse RPE cells. Similar to hiPSC-RPE,
microvilli from control hiPSC-RPE cells using a published                     wholemounts and sections of primary adult human RPE and
protocol that utilized lectin-agarose beads50. Consistent with                mouse RPE displayed co-localization of EZR and CLN3 (Fig. 7E,
our immunocytochemical data showing EZR and CLN3                              F and Supplementary Fig. 10). Of note, for immunocytochemical
co-localization (Fig. 7A), confocal microscopy analyses of the                analyses, due to the debated specificity of previously used CLN3
microvilli fraction adhering to the lectin-agarose beads showed               antibodies11, we utilized (i) CLN3 blocking peptide (Supplemen-
the presence and co-localization of EZR and CLN3 (Fig. 7B).                   tary Fig. 10), (ii) tissue from CLN3 knockout mice56 (Fig. 7E) and
Furthermore, consistent with previous proteomics data of RPE                  (iii) no primary antibody control (Fig. 7E). Of note, because we
microvilli50 no expression of laminin (LAM) was seen on                       used a mouse-CLN3 antibody in our experiments, we also utilized
microvilli-containing lectin-agarose beads (Supplementary                     a commercial kit (mouse on mouse or MOM kit, Vector Lab Inc.
Fig. 7).                                                                      FMK-2201) to overcome the non-specific background due to
   To further validate CLN3 localization in RPE microvilli, we                endogenous IgG staining57. Furthermore, the utility of retinal/
also utilized in vitro lentivirus-mediated overexpression of human            RPE tissue from the CLN3 knockout mice56 in the current study
CLN3 using pHIV-MYC-CLN3-IRES-EGFP and pHIV-FLAG-                             was limited to antibody verification for immunolocalization
CLN3-IRES-EGFP vectors (Supplementary Fig. 8). Consistent                     experiments.
with robust CLN3 overexpression, transduction of 293FT and                       Western blot analyses of endogenous CLN3 in RPE cells
control hiPSC-RPE cells with lentiviral vectors (i) pHIV-MYC-                 showed a distinct pattern of CLN3 in mouse versus human RPE
CLN3-IRES-EGFP and (ii) pHIV-FLAG-CLN3-IRES-EGFP                              cells (Fig. 7G). Specifically, when protein lysate from native
resulted in prominent EGFP expression in both 293FT and                       mouse RPE (~15–20 µg total protein) was run on SDS-PAGE, we
hiPSC-RPE cells (Fig. 7C, D; Supplementary Fig. 8). Of note,                  observed multiple bands (possibly due to non-specific back-
diffusion across and accumulation of EGFP in the nucleus after                ground due to use of the mouse CLN3 antibody). However, the
lentiviral transduction (Fig. 7C, Supplementary Fig. 8) is because            expected broad band between ~50–60 kDa58 was also seen
the bi-cistronic vector pHIV-MYC-CLN3-IRES-EGFP and pHIV-                     (Fig. 7G). In contrast, when protein lysates from human RPE
FLAG-CLN3-IRES-EGFP containing CLN3 and EGFP are                              (primary, hiPSC) were analyzed by Western blotting with the
translated separately within the single mRNA at the internal                  same CLN3 antibody, we observed a strong band ~50 kDa (when
ribosome entry site (IRES)51,52. Furthermore, the presence of                 15–20 µg total protein was loaded on gels) (Fig. 7G). However, in
EGFP in the nucleus is due to its low molecular weight (~27 kDa)              some experiments when a higher amount of total protein (30 µg)
and the nuclear and kinetic entrapment of EGFP homomulti-                     was loaded in gels, we did see an additional band consistent with
mers53. Western blot analyses of untransduced versus transduced               CLN3 glycosylation (Supplementary Fig. 10). Of note, mouse and
293FT cells showed selective expression of MYC and FLAG in                    human CLN3 have previously been shown to run differently on
transduced cells (Supplementary Fig. 8). Also, consistent with                Western blots58,59 and differential glycosylation has been seen
anti-CLN3 antibody data, immunocytochemical analyses of                       based on species as well as the tissue source58,60. Furthermore,
MYC-CLN3 (Supplementary Fig. 9) and FLAG-CLN3 (Fig. 7D)                       incubation of CLN3 primary antibody with CLN3 blocking
in transduced cells using (i) anti-MYC and anti-EZR antibody                  peptide in Western blotting experiments inhibited CLN3
(Supplementary Fig. 9) and (ii) anti-FLAG and anti-EZR                        reactivity in primary human RPE and hiPSC-RPE samples
antibody (Fig. 7D) showed co-localization of EZR and MYC-                     (Supplementary Fig. 10). However, to further confirm that the
CLN3 (Supplementary Fig. 9) and EZR and FLAG-CLN3                             mouse CLN3 antibody used in our experiments recognizes CLN3,
(Fig. 7D). Also consistent with prior studies54,55, co-localization           we evaluated recognition of overexpressed CLN3 protein by the
of FLAG-CLN3 and lysosomal marker, LAMP1, was seen in                         CLN3 antibody via Western blotting (Supplementary Fig. 10).
control hiPSC-RPE cells transduced with pHIV-FLAG-CLN3-                       Specifically, Western blot analyses of hiPSC-RPE cells transduced
IRES-EGFP vector (Supplementary Fig. 9).                                      with pHIV-MYC-CLN3-IRES-EGFP lentiviral vector for ~5 days

6                           COMMUNICATIONS BIOLOGY | (2021)4:161 | https://doi.org/10.1038/s42003-021-01682-5 | www.nature.com/commsbio
COMMUNICATIONS BIOLOGY | https://doi.org/10.1038/s42003-021-01682-5 ARTICLE
Fig. 3 Decreased phagocytosis of FITC-POS by CLN3 disease hiPSC-RPE
cells. A Schematic showing the protocol used to evaluate POS phagocytosis
by hiPSC-RPE cells. Specifically, hiPSC-RPE cells were fed ~20–40 FITC-
labeled POS/RPE cell for 2 h at 37 °C. Subsequently, any FITC-POS
remaining on hiPSC-RPE cell surface was removed by washing with 1X PBS
and the cells were fixed, immunostained with ZO-1 (red channel) and DAPI
(blue channel) and the amount of POS phagocytosed by hiPSC-RPE cells
was determined by measuring FITC fluorescence (green channel) using
confocal microscopy. B–D Representative confocal microscopy images
showing a similar pattern of ZO-1 (B) and DAPI localization (B–D), but
decreased number of FITC-POS in CLN3 disease hiPSC-RPE cultures
compared to control hiPSC-RPE cultures 2 h post-FITC-POS feeding (scale
bar = 10 µm) (n = 4). Of note, panel D is the enlarged view of the
highlighted area (red box) in panel C. E Quantitative analyses of FITC-
fluorescence-labeled POS particles (particles < 5 µm, threshold set to
exclude POS aggregates), 2 h post-POS-feeding, showing decreased
number of phagocytosed (bound+ingested) FITC-POS per field of view in
parallel cultures of CLN3 disease hiPSC-RPE cells compared to control
hiPSC-RPE cells (n = 4, p = 0.003, two-tailed unpaired Student’s t-test).
For the boxplot, + represents mean, center line represents median, box
represents interquartile range between first and third quartiles, and
whiskers represent 1.5* interquartile range. **p < 0.005.
Fig. 10) and (ii) majority of EZR, an RPE microvilli protein, in
the microvilli fraction (Supplementary Fig. 10). Altogether,
using immunocytochemical analyses, subcellular fractionation
assays, and gene-overexpression studies, our data suggest that a
proportion of CLN3 in RPE cells localizes to the RPE apical
microvilli.
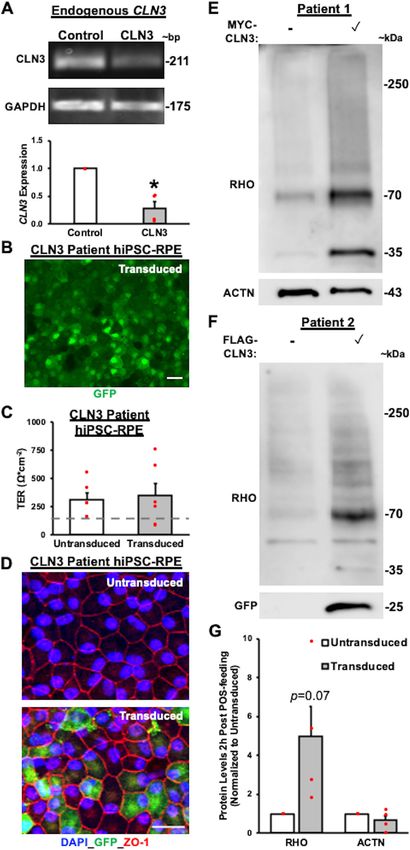
Overexpression of wild-type CLN3 in CLN3 disease hiPSC-RPE
rescues the POS phagocytosis defect. Previous studies on the
impact of CLN3 disease-causing mutations, including the
homozygous 966 bp deletion spanning exon 7 and exon 8 that
we used in the current study are contradictory, suggesting both
loss of protein function61 and functionally viable CLN362.
Consistent with previously published studies61,63, quantitative
real-time PCR analyses showed reduced expression of the
endogenous CLN3 gene transcript in control versus CLN3
disease hiPSC-RPE cultures (Fig. 8A). Remarkably, lentivirus-
mediated overexpression of wild-type (WT)-CLN3 (pHIV-
MYC-CLN3-IRES-EGFP or pHIV-FLAG-CLN3-IRES-EGFP)
in CLN3 disease hiPSC-RPE cells for ~5–6 days (Fig. 8B–D)
had no negative effect on cell viability. Similar to all other POS
phagocytosis experiments in this study (Figs. 3–5, Supple-
mentary Fig. 4, 5), untransduced CLN3 disease and WT-CLN3
transduced CLN3 disease hiPSC-RPE cultures displayed TER >
150 Ω.cm−2 (Fig. 8C) with the expected and proper localization
of tight junction protein, ZO-1 (Fig. 8D). Importantly, WT-
CLN3 expression via lentiviral-mediated transduction was
sufficient to increase the amount of POS phagocytosis by CLN3
disease hiPSC-RPE cultures (Fig. 8E–G). Specifically, with
regard to POS phagocytosis, hiPSC-RPE cells from both CLN3
showed ~6.43-fold higher amount of CLN3 in the transduced disease patient hiPSC lines used in the current study with the
hiPSC-RPE cells (Supplementary Fig. 10). Of note, we did not common 966 bp deletion spanning exon 7 and 8 when trans-
observe a difference in the size of endogenous versus over- duced with either pHIV-MYC-CLN3-IRES-EGFP or pHIV-
expressed CLN3 protein by Western blot analyses as in hiPSC- FLAG-CLN3-IRES-EGFP for 5 days displayed increased POS
RPE cells transduced cells with bi-cistronic pHIV-MYC-CLN3- uptake, as measured by RHO levels post 2 h POS feeding,
IRES-EGFP vector, the CLN3 and EGFP are translated separately compared to parallel cultures of untransduced CLN3 disease
within the single mRNA at the IRES. hiPSC RPE cells (Fig. 8E–G). Furthermore, probing Western
Consistent with our immunocytochemical data (Fig. 7A, B), blots with anti-GFP antibody (Fig. 8F) showed the expected
Western blot analyses of the RPE microvilli versus cell band (~27 kDa) in transduced CLN3 disease hiPSC-RPE cells.
pellet fraction showed the presence of (i) CLN3 in both the Of note, lentiviral-mediated transduction of WT-MYC-CLN3
RPE microvilli and the cell pellet fraction (Supplementary or WT-FLAG-CLN3 had no impact on ACTN levels in CLN3
COMMUNICATIONS BIOLOGY | (2021)4:161 | https://doi.org/10.1038/s42003-021-01682-5 | www.nature.com/commsbio 7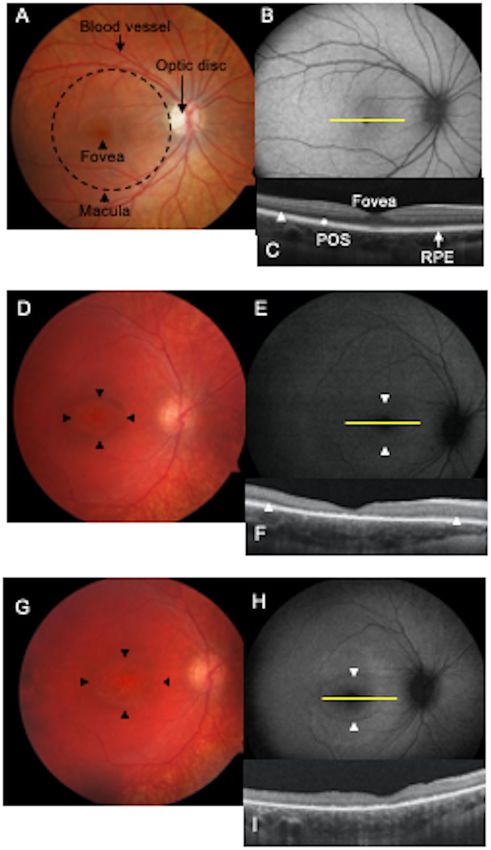
ARTICLE                                                            COMMUNICATIONS BIOLOGY | https://doi.org/10.1038/s42003-021-01682-5

                                                                         Fig. 4 Reduced phagocytosis of unlabeled POS by CLN3 disease hiPSC-
                                                                         RPE cells. A Schematic showing the protocol used to measure
                                                                         phagocytosis of unlabeled POS by hiPSC-RPE cells. Specifically, hiPSC-RPE
                                                                         cultures were fed ~20–40 POS/RPE cell for 2 h at 37 °C. Subsequently, any
                                                                         remaining POS on the surface of RPE cells was removed by washing with 1X
                                                                         PBS and the amount of phagocytosed (bound+ingested) POS was
                                                                         quantified by measuring the amount of Rhodopsin (RHO), a POS-specific
                                                                         protein, within the hiPSC-RPE cells. Of note, the total protein in the hiPSC-
                                                                         RPE cell lysate served as the normalization control in these experiments.
                                                                         B–G Representative Western blot images (B, E) and quantitative Western
                                                                         blot analyses (C, F) post 2 h POS-feeding showing reduced amount of RHO
                                                                         (monomer band 35 kDa, dimer band 70 kDa, and aggregate/multimer
                                                                         bands >70 kDa that are normally seen in RHO Western analyses36,45)
                                                                         relative to total protein in parallel cultures of both young (D20-50 in
                                                                         culture) (B, C; p = 0.014) and old (D60-150) (E, F; p = 0.0019) CLN3
                                                                         disease hiPSC-RPE cells compared to control hiPSC-RPE cells. Of note,
                                                                         unlike RHO, no differences in Actin (ACTN) levels relative to total protein
                                                                         were seen between parallel cultures of both young (B, D; p = 0.41) and old
                                                                         (E, G; p = 0.75) control versus CLN3 disease hiPSC-RPE cells in these
                                                                         experiments. (Control: n = 5, CLN3: n = 7). For all graphs in Fig. 4,
                                                                         statistical significance was determined using two-tailed unpaired Student’s
                                                                         t-test. *p < 0.05; **p < 0.005.

                                                                         autofluorescent material in the photoreceptor layer and con-
                                                                         versely lack of autofluorescent POS digestion products, lipofuscin,
                                                                         in RPE cells (Fig. 2A)2. The currently accepted theory for
                                                                         decreased lipofuscin in CLN3 disease cadaver RPE cells is that
                                                                         photoreceptor loss and therefore POS loss no longer obligates
                                                                         RPE cells to uptake POS2,13. Notably, in this scenario, auto-
                                                                         fluorescence changes in the photoreceptor–RPE layer would
                                                                         occur after photoreceptor cell loss. However, our data showing
                                                                         reduced POS binding and thereby decreased POS uptake (Figs. 3–5)
                                                                         and consequently decreased accumulation of autofluorescent POS-
                                                                         digestion products (Fig. 2) provides an alternate explanation for the
                                                                         lack of lipofuscin in the RPE layer in the CLN3 disease post-mor-
                                                                         tem; namely, reduced uptake of POS by RPE cells in the CLN3
                                                                         disease retina. The decreased uptake of POS by CLN3 disease
                                                                         RPE cells can also explain the build-up of excess autofluorescence in
                                                                         the photoreceptor layer and subsequent photoreceptor cell death
                                                                         due to accumulation of POS debris in the CLN3 disease retina. This
                                                                         theory is consistent with electroretinography (ERG) recordings
                                                                         in CLN3 disease patients at the early stage of the disease that
                                                                         clearly document reduced rod-cone response prior to inner retina
                                                                         dysfunction2,20,21.
                                                                            A clinical correlate of these findings is shown by longitudinal
                                                                         multimodal imaging of a young CLN3 disease patient that is
                                                                         consistent with autofluorescent changes preceding POS loss (Fig. 9).
                                                                         A hallmark of CLN3 disease is bull’s eye maculopathy (BEM),
                                                                         which describes a central area of atrophy, surrounded by
                                                                         concentric circles of diseased retina and then healthier retina
                                                                         peripherally. The margin of the BEM lesion, or junctional zone,
                                                                         represents the leading edge of disease progression along the retina.
                                                                         In contrast to retinal imaging analyses of a normal human retina
disease hiPSC-RPE cells (Fig. 8E, G). Overall, these experi-             (Fig. 9A–C), in a CLN3 disease patient eye at age 7, fundus
ments suggest CLN3 loss of function in CLN3 disease hiPSC-               photograph shows a BEM (Fig. 9D). In addition, at this timepoint,
RPE cells and demonstrate a rescue of POS phagocytosis defect            fundus autofluorescence (FAF) imaging displayed a hyperauto-
by lentiviral-mediated expression of WT-CLN3 in CLN3 dis-                fluorescent annulus at the margin of BEM (Fig. 9E) and optical
ease hiPSC-RPE cells.                                                    coherence tomography (OCT) revealed central loss of the POS
                                                                         layer with POS preservation peripherally, corresponding to the
Structural and functional alterations in CLN3 disease retina             location of the hyperautofluorescent annulus (Fig. 9F). Subse-
in vivo are concordant with impaired POS phagocytosis and                quently, at age 8 years, fundus photograph showed that the BEM
primary outer retina dysfunction. Post-mortem histopathologic            has enlarged (Fig. 9G). Furthermore, FAF and OCT analysis at this
specimens from a CLN3 disease donor show accumulation of                 time point showed that hyperautofluorescent annulus had also

8                      COMMUNICATIONS BIOLOGY | (2021)4:161 | https://doi.org/10.1038/s42003-021-01682-5 | www.nature.com/commsbio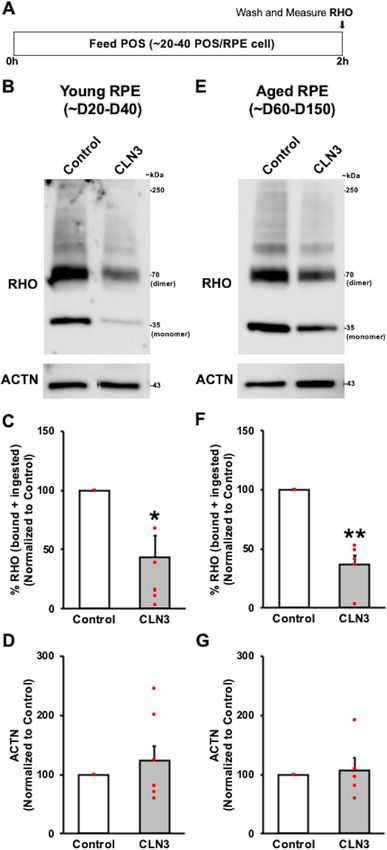
COMMUNICATIONS BIOLOGY | https://doi.org/10.1038/s42003-021-01682-5 ARTICLE
Fig. 5 CLN3 disease hiPSC-RPE display a POS-binding defect.
A Schematic showing the protocol used to evaluate POS binding by hiPSC
cells. Specifically, hiPSC-RPE cells were fed FITC-POS (~20–40 POS/RPE
cell) at 17 °C for 30 min, a temperature favorable to POS binding but not
POS internalization47. Subsequently, POS-fed hiPSC-RPE cells were washed
with 1X PBS to remove any POS remaining on the hiPSC-RPE cell surface.
Next, the hiPSC-RPE cells were fixed, immunostained with ZO-1 (red
channel) and DAPI (blue channel) and the amount of POS phagocytosed by
hiPSC-RPE cells was determined by measuring FITC-fluorescence (green
channel) using confocal microscopy. B–D Representative confocal
microscopy images showing DAPI (B) ZO-1 (B, C), and FITC fluorescence
(B–D) in parallel cultures of control versus CLN3 disease hiPSC-RPE
cultures. Notably, reduced amount of FITC-fluorescence (bound-POS) post
30 min FITC-POS feeding at 17 °C is seen in CLN3 disease hiPSC-RPE cells
compared to control hiPSC-RPE cells (scale bar = 10 µm) (n = 5).
E Quantitative analyses showed reduced number of bound FITC-POS
particles (particles < 5 µm, threshold set to exclude POS aggregates) in
CLN3 disease hiPSC-RPE cells compared to control cells (n = 5, p =
0.00006, two-tailed unpaired Student’s t-test). For the boxplot, +
represents mean, center line represents median, box represents
interquartile range between first and third quartiles, whiskers represent 1.5*
interquartile range, and dots represent outliers. ***p < 0.0005.
Discussion
In this study, we propose that CLN3 is localized to apical
microvilli of RPE and is essential for crucial structure (RPE
microvilli) and function (POS phagocytosis) of RPE cells that are
vital for photoreceptor survival and therefore vision. Using
hiPSC-RPE from patients harboring a homozygous 966 bp dele-
tion spanning exon 7 and 8, the most common mutation in CLN3
disease, we show that disease-causing CLN3 mutations in CLN3
disease affect both RPE cell structure and function in a cell
autonomous manner. Specifically, a proportion of CLN3 in
human, mouse and hiPSC-RPE cells localized to the RPE
microvilli, the RPE structure necessary for POS phagocytosis.
Furthermore, disease-causing mutations in CLN3 led to loss of
CLN3 function which subsequently decreased apical RPE
microvilli density and reduced POS binding that resulted in lower
uptake of POS by CLN3 disease hiPSC-RPE cells. Of note, con-
sistent with the requirement of CLN3 for POS phagocytosis,
lower uptake of POS could be rescued by lentivirus-mediated
WT-CLN3 overexpression in CLN3 disease hiPSC-RPE cells.
Also, consistent with reduced POS uptake, CLN3 disease hiPSC-
RPE displayed decreased autofluorescent POS-breakdown pro-
ducts. Notably, these results are in alignment with reduced
lipofuscin (autofluorescent POS-breakdown product) observed in
CLN3 disease donor eyes13 (Fig. 2A, B and Supplementary Fig. 2),
ERG recordings20,21 and the retinal imaging pattern64, (Fig. 9) in
early stage CLN3 disease in vivo. Altogether, these results illus-
trate a role of CLN3 in regulating POS phagocytosis in human
RPE cells and (i) suggest a role of primary RPE dysfunction in
CLN3-associated retinal degeneration and (ii) indicate gene-
therapy targeting RPE cells as a potential treatment option to
enlarged (Fig. 9H) and POS loss was observed in the area suppress photoreceptor cell loss in CLN3 disease caused due to
corresponding to previously documented hyperautofluorescent the common 966 bp deletion.
annulus (Fig. 9I). Altogether, longitudinal multimodal imaging on The photoreceptor–RPE interface plays a crucial role in retinal
a CLN3 disease patient and previously documented ERG changes homeostasis and is the primary site of disease pathology in several
in CLN3 disease patients before the loss of vision20,21 are retinal degenerative diseases (e.g. Best disease36, retinitis pig-
concordant with POS phagocytosis defect causing photoreceptor mentosa29). In fact, both structural pathology affecting the RPE
cell loss and reduced RPE lipofuscin in CLN3 disease retina. This is microvilli and functional alterations impacting POS phagocytosis
critical for therapeutic intervention in CLN3 disease especially can notably affect the ability of RPE cells to support photo-
when taken in conjunction with our previous data (Fig. 8) showing receptor cell health. For instance, loss of RPE apical microvilli
rescue of POS phagocytosis defect by overexpression of WT CLN3 arising from mutations in EZR and SOD2 has been linked to the
in CLN3 disease hiPSC-RPE cells. development of retinal degeneration65–67. Similarly, defective
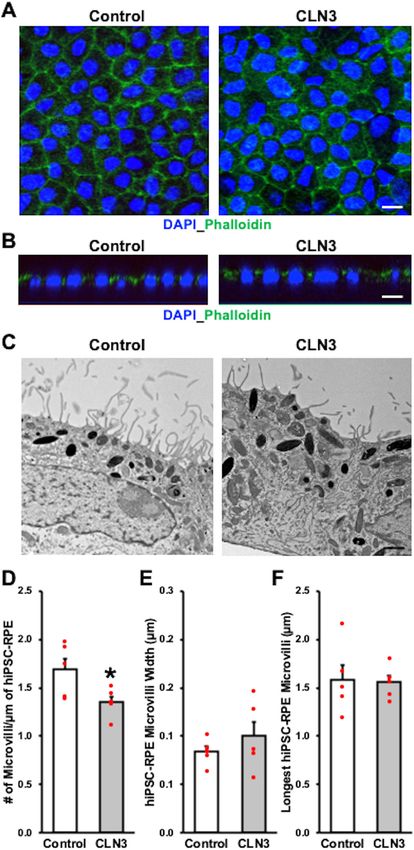
COMMUNICATIONS BIOLOGY | (2021)4:161 | https://doi.org/10.1038/s42003-021-01682-5 | www.nature.com/commsbio 9ARTICLE COMMUNICATIONS BIOLOGY | https://doi.org/10.1038/s42003-021-01682-5 Fig. 6 Decreased apical RPE microvilli density in CLN3 disease hiPSC-RPE cultures. A, B Representative confocal microscopy images after immunocytochemical analyses showing similar localization of F-actin as visualized by phalloidin staining in control and CLN3 disease hiPSC-RPE cells (scale bar = 10 µm) (n = 3). Of note in panel B, orthogonal view of hiPSC-RPE monolayer shows expected apical localization of phalloidin relative to cell nuclei (DAPI) in control and CLN3 disease hiPSC-RPE. C–F Representative transmission electron microscopy (TEM) images (C, scale bar = 1 µm) and corresponding quantitative analyses showing decreased apical RPE microvilli density (D, p = 0.042), but similar apical-RPE microvilli width (E, p = 0.38), and length (F, p = 0.88) in control versus CLN3 disease hiPSC-RPE cells (n = 5). Two-tailed unpaired Student’s t-test performed for all statistical analysis. *p < 0.05. POS phagocytosis caused by mutations in MERTK leads to receptor, avß5 integrin (Supplementary Fig. 6), the POS engulf- photoreceptor cell loss and retinal degeneration29,68. It is note- ment receptor, MERTK (Supplementary Fig. 6), and RPE apical worthy that despite reduced POS phagocytosis by CLN3 disease microvilli regulator, EZR (Fig. 1E), were unchanged between hiPSC-RPE cells, the protein expression of the POS binding control and CLN3 disease hiPSC-RPE cells. CLN3 has been 10 COMMUNICATIONS BIOLOGY | (2021)4:161 | https://doi.org/10.1038/s42003-021-01682-5 | www.nature.com/commsbio
COMMUNICATIONS BIOLOGY | https://doi.org/10.1038/s42003-021-01682-5                                                               ARTICLE

shown to regulate cytoskeletal architecture in other cell types69,70.          filaments and other cytoskeleton components, including EZR and
In conjunction with CLN3 (Fig. 7), other proteins involved in                  Ezrin-Radixin-Moesin-Binding Phosphoprotein 50 (EBP50)72,73.
cytoskeletal organization, including F-ACTN, are major con-                    Notably, lack of F-ACTN and/or EZR can impact microvilli
stituents of apical RPE microvilli50,71. However, immunocyto-                  formation67,74 and thereby impact RPE cell’s phagocytic ability by
chemical localization revealed a similar expression pattern of F-              impacting POS binding46. Furthermore, cytoskeletal rearrange-
ACTN in control versus CLN3 disease hiPSC-RPE cells (Fig. 6A,                  ment is crucial for POS ingestion by RPE cells75. Given that CLN3
B). It is still plausible that reduced apical microvilli density               has been shown to (i) interact with non-muscle myosin IIB (NM-
(Fig. 6C, D) directly contributes to decreased POS binding and                 IIB), an F-ACTN binding motor protein that has been suggested to
uptake by CLN3 disease hiPSC-RPE cells. Of note, although there                play a role in POS phagocytosis69 and (ii) impact cytoskeletal re-
is currently limited information on RPE microvilli formation/                  organization in other cell type(s)76, it is plausible that CLN3
turnover, the RPE microvilli comprises of densely packed actin                 could impact microvilli formation and turnover as well as POS

COMMUNICATIONS BIOLOGY | (2021)4:161 | https://doi.org/10.1038/s42003-021-01682-5 | www.nature.com/commsbio                                   11
ARTICLE COMMUNICATIONS BIOLOGY | https://doi.org/10.1038/s42003-021-01682-5
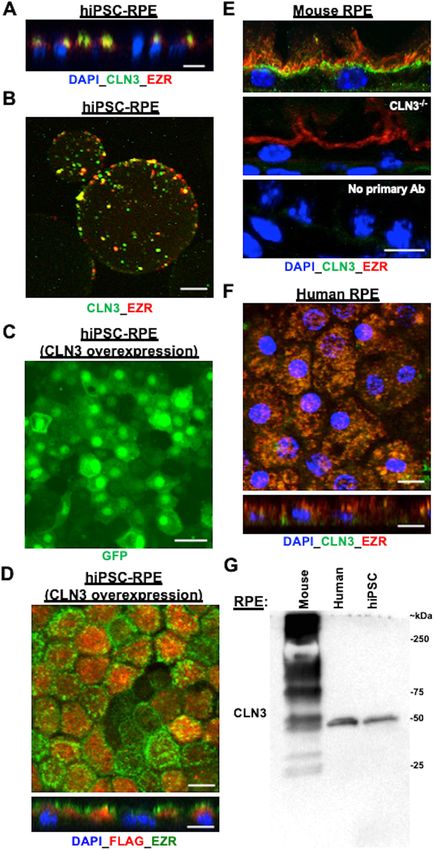
Fig. 7 A proportion of CLN3 protein localizes to RPE microvilli in both (i) control hiPSC-RPE cells with and without CLN3 overexpression and
(ii) primary human and mouse RPE cells. A Representative confocal microscopy image of the orthogonal view of control hiPSC-RPE monolayer post
immunocytochemical analyses with antibodies against CLN3 and EZR (an RPE microvilli protein) showing apical presence of endogenous CLN3 and co-
localization of endogenous CLN3 and EZR (scale bar = 10 µm) (n ≥ 3). B Representative confocal microscopy image post microvilli isolation with lectin-
agarose beads and immunocytochemical analyses with CLN3 and EZR antibody showing co-localization of endogenous CLN3 and EZR in the control hiPSC-
RPE microvilli-bound to lectin-agarose beads (scale bar = 10 µm) (n = 3). C Representative confocal microscopy images post immunostaining with a GFP
antibody showing robust expression of EGFP in control CLN3 hiPSC-RPE cells transduced with pHIV-FLAG-IRES-EGFP lentiviral vector (scale bar = 10 µm)
(n ≥ 3). Of note, the observed EGFP localization in the nucleus is due to the nuclear and kinetic entrapment of EGFP homomultimers, and has been
previously reported53. D Representative confocal microscopy images post immunocytochemical analyses with FLAG and CLN3 antibodies showing co-
localization of FLAG-CLN3 in control hiPSC-RPE cells transduced with pHIV-FLAG-CLN3-IRES-EGFP lentiviral vector (scale bar = 10 µm) (n ≥ 3). Of note,
nuclei were stained with DAPI and are excluded in the top panel showing the D image to better visualize the CLN3-EZR co-localization. In the bottom panel
showing the orthogonal view, DAPI is included to illustrate the apical localization of both FLAG-CLN3 and EZR. E Confocal microscopy analyses of mouse
retina sections after immunocytochemical analyses with CLN3 and EZR antibody showed co-localization of endogenous CLN3 with EZR (top panel).
Notably, CLN3 antibody fails to detect CLN3 expression but EZR can be visualized in the RPE cells of CLN3−/− mice (E, middle panel). Furthermore, no
specific CLN3 staining was seen in WT mouse retina sections in the no primary controls that excluded incubation with primary antibody (E, bottom panel).
Of note, because the host of CLN3 antibody is mouse, we utilized mouse on mouse (M.O.M ®) kit in these experiments (scale bar = 10 µm) (n ≥ 1).
F Confocal microscopy images post immunocytochemical analyses showed co-localization of endogenous CLN3 and EZR in primary human RPE
wholemounts and orthogonal view (scale bar = 10 µm) (n ≥ 1). G Representative western blot image showing presence of endogenous CLN3 protein (50
kDa) using CLN3 specific antibody in WT mouse, primary human and hiPSC-RPE samples (n ≥ 1). Also note a distinct pattern of CLN3 in mouse versus
human RPE cells. Specifically, multiple bands for CLN3 were seen in native mouse RPE (~15–20 µg total protein) compared to human RPE (primary, hiPSC)
possibly due to non-specific background due to the use of mouse CLN3 antibody.
phagocytosis in RPE cells through its interactions with cytos- CLN3 disease pathology31. This hypothesis is particularly
keletal proteins, such as NM-IIB and F-ACTN. Furthermore, attractive because CLN3 has been postulated to play a critical role
primary dysfunction within RPE microvilli and lack of microvilli in lysosomal homeostasis in multiple cell types2,54,85,86. Fur-
has been shown to impact photoreceptor–RPE interaction and thermore, impaired lysosomal degradation of POS membranes by
lead to vision loss in mice lacking EZR protein67 and in a canine RPE cells has been experimentally linked to loss of photo-
model of inherited retinal degeneration, Best disease77. Another receptors in mouse models18,87. Consistent with a role of CLN3 in
possibility is that the impaired RPE phagocytosis of POS by lysosomal function, a proportion of CLN3 in hiPSC-RPE cells co-
CLN3 disease is a consequence of impaired endocytosis. For localized with lysosomal marker, LAMP1 (Supplementary Fig. 9).
instance, several studies have suggested a crucial role of CLN3 in However, we did not pursue the role of CLN3 in POS degradation
the endosomal-lysosomal pathway78–80 and the endolysosomal in the current study as impaired lysosomal degradation of POS by
system is involved in regulation and recycling of plasma mem- CLN3 disease hiPSC-RPE cells, while plausible, is in direct con-
brane components required for POS phagocytosis (e.g. αVβ5 trast to the decreased accumulation of POS digestion products
integrin81) and microvilli formation82. It is also possible that observed in CLN3 disease hiPSC-RPE cells2 (Fig. 2). In contrast,
some of the molecular defects in CLN3 disease hiPSC-RPE cells POS binding and uptake defect by CLN3 disease hiPSC-RPE cells
were masked in our study as we compared CLN3 disease hiPSC- is consistent with both reduced accumulation of lipofuscin in the
RPE cells to control hiPSC-RPE cells constituting of hetero- RPE and increased autofluorescence in photoreceptor cell
zygote carriers (family members) and unrelated healthy subjects. layer1,13,14 that could plausibly be POS debris. In fact, as shown
However, we did confirm no difference in POS phagocytic here (Fig. 9), a paracentral hyperautofluorescent annulus is seen
capability and microvilli density between CLN3 heterozygote in CLN3 disease21 and in other retinal degenerations88, which
carriers and healthy subjects with no CLN3 defect. Furthermore, may be representative of increased accumulation of POS debris at
though gene-corrected lines were not included in this study, as the transition zone between healthy and unhealthy photo-
the CLN3 mutation investigated here leads to homozygous 966 receptors. Ultimately, if RPE dysfunction and POS phagocytosis
bp deletion spanning exon 7 and 883, making it challenging for defect are central to photoreceptor cell loss and retinal degen-
genome editing/CRISPR correction, we utilized WT-CLN3 eration in CLN3 disease and CLN3-associated non-syndromic
overexpression in CLN3 disease hiPSC-RPE cells to investigate retinal degeneration, RPE cells may be a crucial gene therapy
the role of CLN3 in POS phagocytosis. The correction of CLN3 target for these blinding disorders.
mutation in CLN3 disease hiPSCs and introduction of CLN3
mutation in control hiPSC-RPE cells will be valuable tools to
further investigate CLN3 function and CLN3 disease patho- Methods
physiology. Similarly, a comparison of molecular and structural hiPSC generation. Fibroblasts from CLN3 disease patients harboring the homo-
defects between CLN3 disease hiPSC-RPE cells and hiPSC-RPE zygous 966 bp deletion spanning exon 7 and exon 883 and unaffected controls,
heterozygote family members, and unrelated healthy subjects with no known
derived from patients with CLN3-associated non-syndromic history of retinal disease, were reprogrammed to hiPSCs using non-integrating
retinal degeneration would be instrumental in further elucidat- episomal plasmid vectors in accordance with a previously published protocol37.
ing the role of RPE dysfunction in instigating photoreceptor Specifically, using the nucleofection kit for primary fibroblast (Lonza), fibroblasts
degeneration in CLN3 disease versus non-syndromic CLN3- (~60,000) were electroporated with 1 µg each of pCXLE-hOCT4-shP53, pCXLE-
hSK, pCXLE-hUL plasmids (Addgene plasmid #27077, 27078, 27080) in a
associated retinal degeneration. Notably and consistent with an
nucleofector 2b device (Lonza, Program T-016). Following electroporation, fibro-
important role of CLN3 in outer retina homeostasis, in the non- blasts were cultured in high glucose DMEM containing 10% FBS for 6 days.
syndromic form of retinal degeneration caused by other muta- Subsequently, 1 × 10⁵ cells were plated onto irradiated mouse embryonic fibroblast
tions in CLN3, the initial defects in the retina are restricted to (MEF) feeder layer. The next day the medium was switched to hiPSC basal medium
the photoreceptor–RPE complex21,84. (DMEM/F12 with 20% knockout serum replacement or KSR, 1% MEM-NEAA, 1%
glutamax and 100 ng/ml FGF2). hiPSC colonies on MEF feeder layer began to
A recent study using CLN3 disease rodent model has impli- appear 17–30 days post-transfection and individual hiPSC colonies were manually
cated impaired lysosomal degradation of POS by RPE cells in dissected and expanded for characterization.
12 COMMUNICATIONS BIOLOGY | (2021)4:161 | https://doi.org/10.1038/s42003-021-01682-5 | www.nature.com/commsbioCOMMUNICATIONS BIOLOGY | https://doi.org/10.1038/s42003-021-01682-5 ARTICLE
hiPSC characterization. Immunocytochemical analyses were performed to con- medium (DMEM/F12 with 20% knockout serum replacement or KSR, 1% MEM-
firm the expression of known pluripotency markers, OCT4 and NANOG, in all NEAA, 1% GlutaMAX, and 100 ng/ml FGF2 (Pepro Tech) or in feeder-free culture
control and CLN3 disease hiPSC lines (Supplementary Fig. 11). Furthermore, both on dishes coated with Matrigel (Corning) in mTeSR1 or mTesR Plus (STEMCELL
PCR analyses and gel electrophoresis (Supplementary Fig. 11) and DNA sequen- Technologies). Differentiation to retinal cell fate to RPE was conducted using
cing (Supplementary Fig. 12) using previously published primers (Forward: 5′- previously published protocols37,90. Summarized here, colonies of hiPSCs culti-
CATTCTGTCACCCTTAGAAGCC-3′; Reverse: 5′-GGCTATCAGAGTCCA- vated on MEF or mTESR were lifted and cultured in either hiPSC basal medium
GATTCCG-3′)89 were utilized to confirm the absence and presence of the 966 bp without FGF or mTESR or mTESR+ to generate embryoid bodies (EBs). Six days
homozygous gene deletion spanning exon 7 and 8 in control versus CLN3 disease post-EB generation, EBs were plated onto laminin-coated tissue culture plates and
hiPSCs respectively. Standard karyotyping analysis was also carried out to confirm fed with neural induction medium or NIM (DMEM/F12 containing 1% MEM-
chromosomal integrity of all hiPSC lines (Supplementary Fig. 11). NEAA, 1% N2 supplement) and 2 µg/ml heparin. On day 14 post-EB generation,
the cell culture medium was switched from NIM to retinal differentiation medium
(RDM) containing 70% DMEM/30% F12 and B27 supplement without retinoic
hiPSC culture and differentiation. hiPSCs were cultured on either irradiated acid (RPE differentiation). OV-like structures were either collected on ~day 20 by
mouse embryonic fibroblast (Thermo Fisher Scientific) feeder layer in hiPSC basal lifting or dissection and remaining cells were grown as adherent cultures. RPE cells
COMMUNICATIONS BIOLOGY | (2021)4:161 | https://doi.org/10.1038/s42003-021-01682-5 | www.nature.com/commsbio 13You can also read