Design of biologically active binary protein 2D materials
←
→
Page content transcription
If your browser does not render page correctly, please read the page content below
Article

Design of biologically active binary protein
2D materials

https://doi.org/10.1038/s41586-020-03120-8                     Ariel J. Ben-Sasson1,2, Joseph L. Watson3, William Sheffler1,2, Matthew Camp Johnson1,
                                                               Alice Bittleston3, Logeshwaran Somasundaram4, Justin Decarreau1,2, Fang Jiao5, Jiajun Chen5,6,
Received: 19 April 2019
                                                               Ioanna Mela7, Andrew A. Drabek8, Sanchez M. Jarrett8, Stephen C. Blacklow8,9,
Accepted: 6 November 2020                                      Clemens F. Kaminski7, Greg L. Hura10, James J. De Yoreo5,6, Justin M. Kollman1,
                                                               Hannele Ruohola-Baker1,4, Emmanuel Derivery3 & David Baker1,2,11
Published online: xx xx xxxx

    Check for updates
                                                               Ordered two-dimensional arrays such as S-layers1,2 and designed analogues3–5 have
                                                               intrigued bioengineers6,7, but with the exception of a single lattice formed with
                                                               flexible linkers8, they are constituted from just one protein component. Materials
                                                               composed of two components have considerable potential advantages for
                                                               modulating assembly dynamics and incorporating more complex functionality9–12.
                                                               Here we describe a computational method to generate co-assembling binary layers by
                                                               designing rigid interfaces between pairs of dihedral protein building blocks, and use it
                                                               to design a p6m lattice. The designed array components are soluble at millimolar
                                                               concentrations, but when combined at nanomolar concentrations, they rapidly
                                                               assemble into nearly crystalline micrometre-scale arrays nearly identical to the
                                                               computational design model in vitro and in cells without the need for a two-
                                                               dimensional support. Because the material is designed from the ground up, the
                                                               components can be readily functionalized and their symmetry reconfigured, enabling
                                                               formation of ligand arrays with distinguishable surfaces, which we demonstrate can
                                                               drive extensive receptor clustering, downstream protein recruitment and signalling.
                                                               Using atomic force microscopy on supported bilayers and quantitative microscopy
                                                               on living cells, we show that arrays assembled on membranes have component
                                                               stoichiometry and structure similar to arrays formed in vitro, and that our material
                                                               can therefore impose order onto fundamentally disordered substrates such as cell
                                                               membranes. In contrast to previously characterized cell surface receptor binding
                                                               assemblies such as antibodies and nanocages, which are rapidly endocytosed, we find
                                                               that large arrays assembled at the cell surface suppress endocytosis in a tunable
                                                               manner, with potential therapeutic relevance for extending receptor engagement and
                                                               immune evasion. Our work provides a foundation for a synthetic cell biology in which
                                                               multi-protein macroscale materials are designed to modulate cell responses and
                                                               reshape synthetic and living systems.

Genetically programmable materials that spontaneously co-assemble                              repurposing for specific tasks3,16–21. A two-component array has been
into ordered structures following mixture of two or more components                            generated by flexibly linking a Strep-tag to one homo-oligomer and
are far more controllable than materials that constitutively form from                         mixing with the tetrameric dihedral streptavidin8, but owing to its flex-
one component. They offer control over assembly onset in ambient con-                          ibility, the structure of the designed material was not fully specifiable in
ditions, thereby enabling rigorous characterization and manipulation of                        advance, and because both building-blocks have dihedral symmetry, the
components, which lend the system to a wide variety of applications9,13.                       array has identical upper and lower surfaces. A de novo interface design
Most previously described 2D protein materials, such as S-layers14,15 and                      between rigid domains that is stabilized by extensive non-covalent
de novo-designed arrays, primarily involve single protein components                           interactions would provide more control over atomic structure and a
which spontaneously self-assemble, complicating characterization and                           robust starting point for further structural and functional modulation.

1
 Department of Biochemistry, University of Washington, Seattle, WA, USA. 2Institute for Protein Design, University of Washington, Seattle, WA, USA. 3MRC Laboratory of Molecular Biology,
Cambridge, UK. 4Institute for Stem Cell and Regenerative Medicine, University of Washington, School of Medicine, Seattle, WA, USA. 5Department of Materials Science and Engineering,
University of Washington, Seattle, WA, USA. 6Physical Sciences Division, Pacific Northwest National Laboratory, Richland, WA, USA. 7Department of Chemical Engineering and Biotechnology,
University of Cambridge, Cambridge, UK. 8Department of Biological Chemistry and Molecular Pharmacology, Harvard Medical School, Boston, MA, USA. 9Department of Cancer Biology,
Dana-Farber Cancer Institute, Boston, MA, USA. 10Molecular Biophysics and Integrated Bioimaging, Lawrence Berkeley National Laboratory, Berkeley, CA, USA. 11Howard Hughes Medical
Institute, University of Washington, Seattle, WA, USA. e-mail: derivery@mrc-lmb.cam.ac.uk; dabaker@uw.edu

                                                                                                                                                   Nature | www.nature.com | 1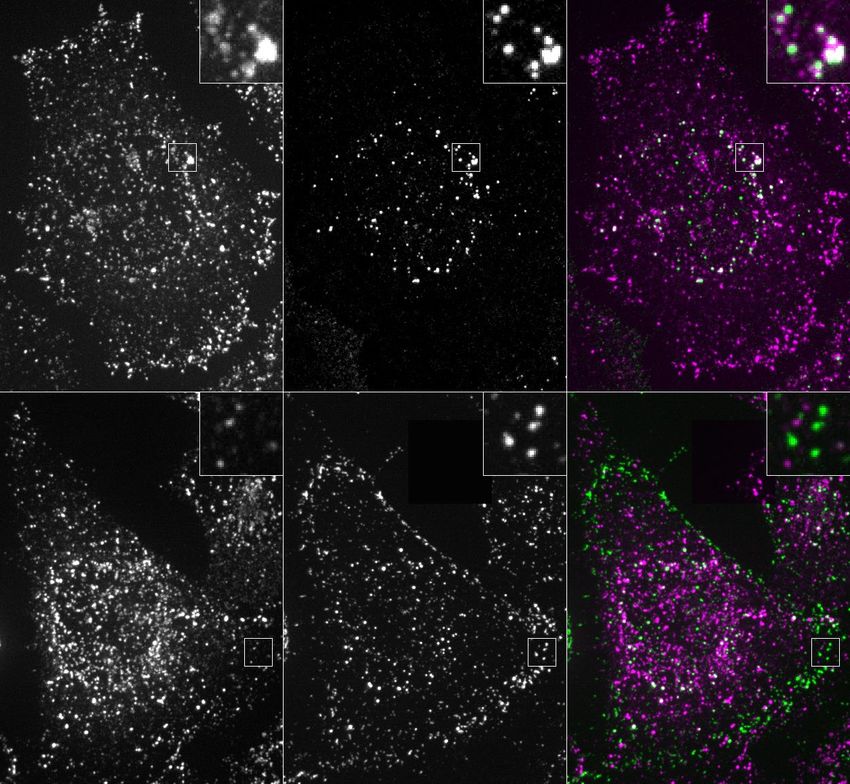
Article
a                                                                                   in-plane C2 axes coincide (see Supplementary Video 1 for an illustration
                                           p6m (*632)
D3                                                                                  of the docking process). We sampled 2D arrays in the p3m1[D3–D3], p4m
               1           2                            D3                          [D4–D4, D4–D2] and p6m[D6–D3, D6–D2, D3–D2] symmetry groups built
                                              d         D2
                                                                                    from 965 dihedral building blocks available in the Protein Data Bank23
                                                                   d
D2                                                                                  with D2, D3, D4 and D6 symmetry and X-ray resolution better than 2.5 Å.
                                                                                    For each group, all pairs of dihedral building blocks were placed with
          1        2       3                                                        their symmetry axes aligned to those of the group, and the lattice
                                                                                    spacing (Fig. 1a, middle) and the discrete rotations (Fig. 1a, left) were
b          A
                                                                                    sampled to identify arrangements with contact regions larger than
                                                             90°                    400 Å2 and composed primarily of aligned helices. The amino acid
                       B                                                            sequences at the resulting interfaces between the two building blocks
                                                                                    were optimized using Rosetta combinatorial sequence design24 to
           d                                                                        generate low-energy interfaces with a hydrophobic centre surrounded
c                              d                                          31 nm     by polar residues25.
           A–GFP
                                                                                       We selected 45 of the lowest-energy designs (2 in group p3m1, 10 in
                                                                                    group p4m and 33 in group p6m) with high shape complementarity
                               A+B

                       B
                                                                                    and few buried polar groups not making hydrogen bonds (Fig. 1b), and
                                                                                    co-expressed the proteins in Escherichia coli after mRNA optimiza-
e                                                                                   tion26–28 (Methods, Supplementary Figs. 1, 2, Supplementary Tables 1, 2).
     A–GFP + B     A–GFP
                                                                                    Cells were lysed, and soluble and insoluble fractions were separated.
                                                                                    Insoluble fractions containing both proteins, as determined by SDS–
                               A–GFP + B

                                                                                    PAGE, were examined by negative-stain electron microscopy. Design 13
                                                                                    displayed the clearest hexagonal lattice (Fig. 1d, top left; other design
                                                                                    shown in Supplementary Fig. 3, Supplementary Table 3). Design 13
                                                                                    belongs to the p6m symmetry group and is composed of D3 and D2
Fig. 1 | Design strategy and characterization of in vivo assembly. a, Left,
                                                                                    homo-oligomers (hereafter referred to as A and B components, respec-
orientations of D3 and D2 building blocks for generating p6m lattice. One           tively). The computational design model and the averaged electron
two-fold symmetry axis of each building block must coincide with each other         microscopy density match closely (Fig. 1d, top right), suggesting that
and with a plane reflection axis (dashed line). Middle, top view of the p6m         the designed interface drives assembly of the intended array geometry.
symmetry operators and the lattice spacing DOF (dashed line, d). Right, a              To determine whether co-assembly occurs in cells or after lysis, we
possible p6m array configuration using D3 and D2 building blocks. Dashed lines      genetically fused superfolder green fluorescent protein (sfGFP, hereaf-
indicate the direction along which building blocks slide into contact; outlined     ter GFP) to the N terminus of the A component, forming A–GFP (Fig. 1c).
shapes indicate the symmetry group to which the building blocks belong.             GFP fusion did not affect array assembly (Fig. 1d), and consistent with
b, Left, top view of building-block configurations. In-plane close-up view of the   the design model, the added GFP resulted in the appearance of addi-
configuration of residues at the hetero-interface (middle) and view rotated         tional density near the trimeric hubs. In cells expressing both A–GFP
90°, perpendicular to the plane (right). c, Model of A–GFP, with A in magenta
                                                                                    and B, but not in those expressing A–GFP alone, GFP fluorescence was
and GFP in light green. d, Negative-stain TEM images of 2D arrays formed
                                                                                    concentrated in patches, suggesting that the arrays can assemble in
in E. coli coexpressing A and B (top left) or A–GFP and B (bottom left). Right,
                                                                                    cells (Fig. 1e).
corresponding averaged images superimposed with the design model
                                                                                       An advantage of two-component materials is that if the isolated
(A, magenta; B, green; GFP is omitted). e, Confocal microscopy imaging of cells
expressing A–GFP (right) or A–GFP and B (left). Scale bars, 100 nm (d), 5 µm (e).   components are soluble, co-assembly can in principle be initiated by
                                                                                    mixing9. This is important for unbounded crystalline materials, which
                                                                                    typically undergo phase separation as they crystallize, complicating
   We set out to generate two-component 2D arrays by designing                      their usage in solution. A measure of binary-system quality is the ratio
interfaces between two different dihedral protein building blocks10,22.             of the maximum concentration at which both components are individu-
There are 17 distinct plane symmetry groups that define 2D repeti-                  ally soluble to the minimum concentration at which they co-assemble
tive patterns (a broader set of unique geometries is available using 3D             when mixed; the higher this ratio, the easier it is to prepare, functional-
objects; 33 distinct planar geometries can be generated by combining                ize and store the components in ambient conditions. To evaluate the
two objects)15. The building blocks can be either cyclic or dihedral                components’ self-assembly and the system co-assembly ratio (SACAr),
homo-oligomers oriented in space such that their highest-order rota-                we separately expressed and purified the A and B components. After
tion symmetry (Cx: xÎ{2,3,4,6}) is perpendicular to the plane. We chose             stabilization of both components by evolution-guided design29, we
a subset of the 17 plane symmetry groups (p3m1, p4m and p6m) that                   found that both components could be stored individually at concentra-
can be generated by designing a single additional interface between                 tions higher than 2 mM at room temperature and for durations longer
building blocks with dihedral symmetry11,12. We chose to use objects                than 3 months without aggregation (see Methods, and Supplementary
with dihedral rather than cyclic symmetry because their additional                  Figs. 4, 5, Supplementary Tables 5, 6 for circular dichroism results), but
in-plane two-fold rotation axes (Fig. 1a, dashed lines) intrinsically cor-          rapidly assembled into the 2D array when mixed at concentrations as
rect for any deviation from the design model that might otherwise                   low as approximately 10 nM. Thus for this system, SACAr > 105; a value
result in out-of-plane curvature (further discussion in Extended Data               at which, upon assembly from stock solutions at millimolar concen-
Fig. 1). This higher symmetry comes at a cost in the number of degrees              trations, the distance between each component increases (within the
of freedom (DOFs) available for a pair of objects to associate: whereas             plane) to about twice the estimated mean nearest-neighbour distance30
cyclic components are constrained in a plane to four DOFs, for dihe-                (further discussed in Extended Data Fig. 2) and the solution instantane-
drals the only DOFs are the lattice spacing and discrete rotations of the           ously forms a gel (Supplementary Video 2).
building blocks (a two-fold rotation axis of the two dihedral compo-                   Upon mixing the two purified proteins in vitro at equimolar concen-
nents must be aligned). For example, Fig. 1a shows a two-component                  trations, even larger and more regular hexagonal arrays were formed
2D lattice generated by placing D3 and D2 building blocks on the C3 and             compared with in vivo assembly in bacteria (comparing Fig. 2a, c with
C2 rotation centres of the p6m(*632) symmetry group, such that their                Fig. 1d). The arrays survive transferring to the transmission electron

2 | Nature | www.nature.com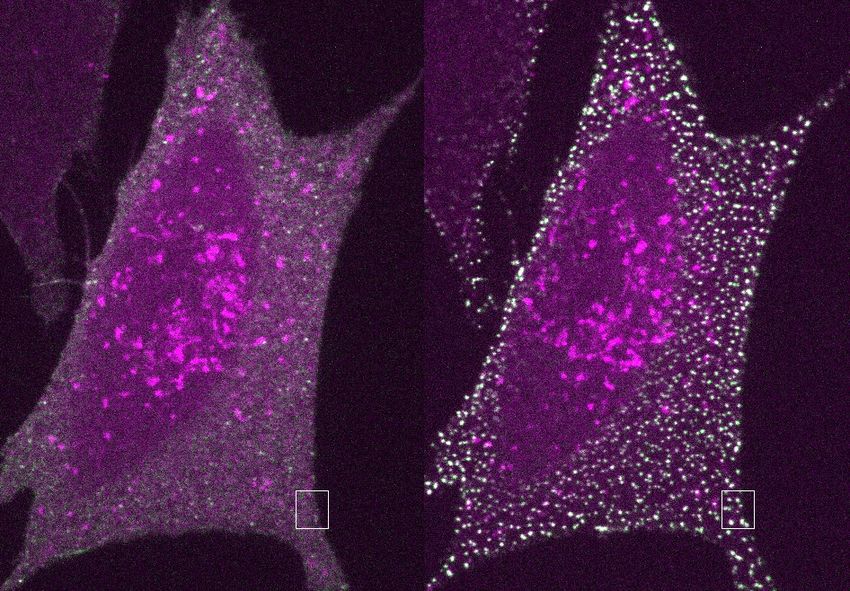
a b 3D-stacked arrangement (Fig. 2d, inset, Extended Data Fig. 5c). The
agreement between the experimental SAXS profiles and theoretical
profiles computed from the design model increases with increasing
numbers of subunits (Extended Data Fig. 5c–e), suggesting that arrays
in solution are at least 1.8 µm in diameter. Some array stacking with a
discrete number of symmetry-preserving packing arrangements was
observed by electron microscopy (Fig. 2c). On the basis of the SAXS
results in solution and further structural analysis, we attribute these
observations to sample preparation processing conditions for electron
microscopy (addressed further in Extended Data Fig. 4).
We then investigated the kinetics and assembly mechanism in vitro
c d by mixing the two components and monitoring growth in solution by
Sample 2D
Norm. log X-ray intensity (DU)
3D light scattering and SAXS, and on a substrate by AFM (Fig. 2f, Extended
2.0 Data Figs. 3, 5). Upon mixing the two components at micromolar con-
centrations, lattice assembly in solution occurred in minutes, with
concentration-dependent kinetics (Extended Data Fig. 3a). SAXS
1.0 analysis indicated rapid growth of the arrays to 0.4 µm in diameter
within the first 2 min after mixing the components (at 10 µM) and to
Sample 40 ASUs
0.6 190 ASUs 10 ASUs 0.7 µm within 6 min (Extended Data Fig. 5f, g, Methods). The hexagonal
0.02 0.04 0.06 0.08 lattice could be readily visualized by AFM, and the pathway of assem-
q (Å–1)
bly could be assessed by in situ AFM imaging at different time points
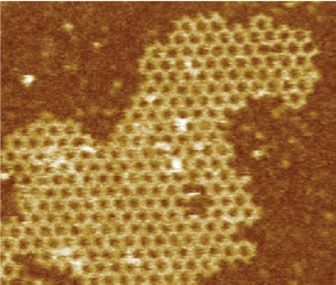
f 11 min 60 min (Fig. 2e, Extended Data Fig. 3b, c). The designed 2D material exhibited
self-healing: cracked edges reformed (Fig. 2e, upper right corner) and
point defects and vacancies in the interior of the lattice that were evi-
dent at early time points were filled at later time points (Fig. 2f, Extended
Data Fig. 3c). To determine whether the rate-limiting step for growth is
initiation or completion of hexagonal units, we counted the numbers of
each of the possible edge states in a set of AFM images. A units bound to
e
10 nm
0 min 11 min two B units (designated A-II sites) comprised the most stable edge sites,
while A units with only one neighbouring B unit (designated A-I sites)
were the least stable, occurring far less frequently than exposed B units
with only one neighbouring A unit (B-I sites) (Extended Data Fig. 3h).
The results imply that attachment of a B unit to an A-I site to create a
(most) stable A-II site is rate-limiting during assembly (quantitative
analysis in Extended Data Fig. 3d, f, g).
0 nm
We next investigated whether preformed arrays could cluster trans-
membrane receptors on living cells (Fig. 3). In contrast to antibodies,
Fig. 2 | Structure of in vitro-assembled arrays. a, Negative-stain TEM of a
which are extensively used to crosslink cell surface proteins, arrays
monolayer A–GFP + B array. b, Computational model (A, magenta; B, blue)
provide an extremely high density of attachment sites in a regular 2D
overlaid on averaged density from a (grey); GFP density is evident near A.
geometry. To quantitatively measure clustering, we stably expressed
c, Negative-stain electron microscopy of micrometre-scale arrays. d, SAXS
profile of overnight assembly of A and B (black) compared to profiles
a model receptor composed of a transmembrane segment (TM) fused
calculated from atomic models of arrays of different dimensions; computed to an extracellular GFP nanobody (GBP)31 and an intracellular mScarlet
and experimental profiles have nearly identical peak positions and spacing. (GBP–TM–mScarlet) in fibroblasts (Fig. 3a). In the absence of arrays, the
Inset, SAXS profiles (momentum transfer in Å−1 (q) versus relative X-ray mScarlet signal was diffuse, but when a preformed A–GFP + B array was
intensity in X-ray detector units (DU)) for the measured sample (black), 2D (red) placed on the cells, mScarlet clustered under the array in about 20 min
and 3D (magenta) models. ASUs, asymmetric units. e, AFM imaging of array (Fig. 3b, c, Supplementary Video 3; 3D reconstructions and electron
growth on mica showing assembly (black box) spanning a number of unit cells. microscopy validation that purified arrays retain hexagonal order are
f, Close up of e, showing healing of lattice vacancy defects (black outline). presented in Fig. 3d, Extended Data Fig. 6, Supplementary Video 4).
Elapsed time is indicated. Scale bars: 200 nm (a, e, f), 20 nm (b) and 500 nm (c). Fluorescence recovery after photobleaching (FRAP) showed that clus-
tered receptors remain stably associated with the arrays (Extended Data
Fig. 6e, f, Supplementary Video 5). To determine whether the patterned
microscopy (TEM) grid and incubation with negative stain despite and highly multivalent interactions between arrays and cell surface
being only about 4 nm thick (design model and atomic force micros- receptors can induce a downstream biological signal, we targeted the
copy (AFM) cross-section in Extended Data Fig. 3b), suggesting that angiopoietin-1 receptor TIE2. Using the spyCatcher–spyTag (SC–ST)
they have considerable in-plane strength. No assembly was observed conjugation system26, we fused a ligand for the TIE2 receptor, the F
with either component alone (see Extended Data Figs. 3a and 5a for domain32 of the angiogenesis promoting factor ANG1, to a modified A
light scattering and SAXS, respectively, and Supplementary Fig. 6 for component with spyCatcher genetically fused to its N terminus (the
TEM). The array density is closely superimposable on the design model, resulting fusion is designated AfD). Pre-assembled arrays displaying
with the outlines of both components evident (Fig. 2b), suggesting ANG1 and GFP (AfD + A–GFP + B) induced clustering of endogenous TIE2
that the structure of the material is very close to that of the model. To receptors on human umbilical vein endothelial cells (HUVECs) (Fig. 3e;
probe the array structure in solution (Fig. 2d, Extended Data Fig. 5), further examples, controls and TEM characterization in Extended Data
we used SAXS. Scattering rings appear in SAXS spectra at Bragg peaks Fig. 7). Clustering kinetics were similar to GBP–TM–mScarlet (Fig. 3h).
consistent with P6 symmetry, and unit cell spacing of 303 Å (Supple- Because the amount of arrays was adjusted to ensure that there was a
mentary Table 7), in close agreement with the designed 2D array model small number (0–2) of labelled arrays per cell, the effects of large-scale
(310 Å) and AFM data (315 Å) (Extended Data Fig. 3f, g), but not with a receptor clustering on downstream effectors could be investigated in
Nature | www.nature.com | 3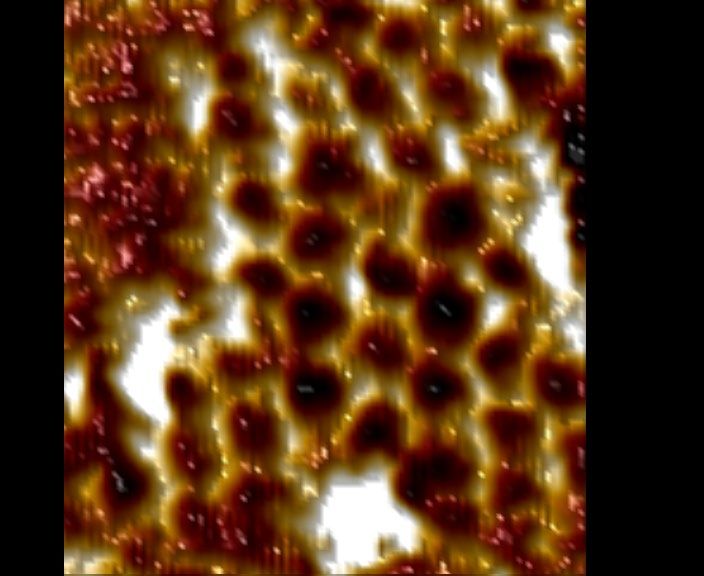
Article
a Ax By
Video 6). These diffraction-limited arrays eventually stopped grow-
Arrays functionalized to
bind to cell receptors ing, probably owing to the lack of available transmembrane-anchored
+ B(c)–GFP. Instead, they slowly diffused (diffusion coefficient
(D) = 0.0005 µm2 s−1, Extended Data Fig. 10c), and some eventually
merged into larger arrays (Fig. 4b, arrows, c, Supplementary Video 6).
Clustered receptors
Receptor clustering by array assembly on cells was faster than with
preformed arrays (Figs. 3c, 4c), synchronized (Fig. 4b, c), homogene-
b External anti-GFP nanobody Transmembrane Internal mScarlet
ous (all arrays have similar size (Extended Data Fig. 10b)) and elicited
A–GFP + B array / GBP–TM–mScarlet c d 3D rendering
downstream signalling (Extended Data Fig. 7e). On-cell assembly mark-
mScarlet enrichment (AU)
–1,430 0 390 1,040 2,210 20
Event 1
15 edly improved clustering synchronization compared with preformed
10 arrays: all clusters in Fig. 4b, c appeared within about 15 s, compared
–780 –130 0 130 1,040
with 980 ± 252 s (mean ± s.e.m.) in Fig. 3c. As expected, the concentra-
Event 2
5
0 500 1,000 1,500 2,000
n = 13
tion of A affected both the nucleation rate and the growth rate of arrays:
e AfD + A–GFP + B array / TIE2
Time since landing event (s)
higher concentrations of A increased nucleation and initial growth rate,
g h Activation
5 min 15 min AKT activity
kinetics but growth rate decayed more rapidly over time, probably owing to the
TIE2-expressing cells
(30 in)
)
saturation of all available B components (Extended Data Fig. 10d, e).
min
AfD B (1 in)
17.8 nM AfD
53.4 nM AfD
17.8 nM AfD
53.4 nM AfD
+B 5m
m
89 nM AfD
89 nM AfD
AfD B (5
Each diffraction-limited array contained on average 125 ± 3 GFP
Control
AfD rol
+
+
nt
and 77 ± 2 mScarlet molecules (median ± error (Methods)) (Fig. 4d,
Co
p-AKT 70 kDa
Actin 35 kDa
Extended Data Fig. 10f–i, Supplementary Methods). The GFP:mScarlet
ratio per array was highly consistent within the same cell and between
f TIE2 / Actin AfD + A–GFP + B array / TIE2 / Actin cells, suggesting that all arrays are almost identical within the cell popu-
Control 60 min
lation and that the number of clustered receptors scales with array
3D rendering
size (Fig. 4d, Extended Data Fig. 10j–l). The median GFP:mScarlet ratio
(1.63 ± 0.06) was within the expected range, corresponding to either
1 or 2 GBP–TM–mScarlet bound per B(c)–GFP dimer (Extended Data
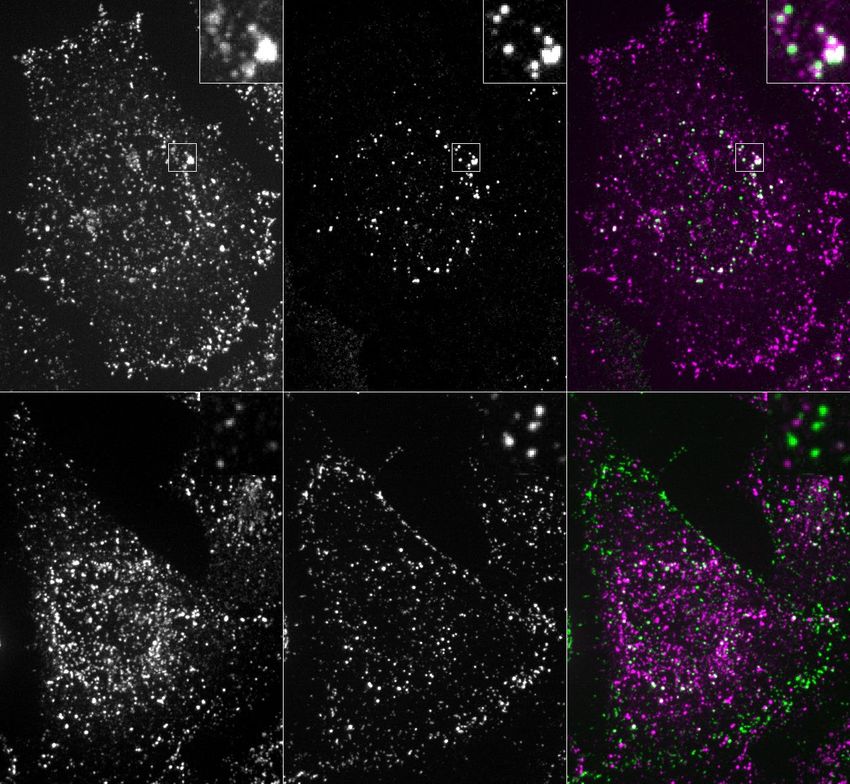
Fig. 3 | Dynamics of array-induced receptor clustering and biological Fig. 10k). Array size could be tuned by varying the concentration of A at
activation. a, Array functionalization by genetic or post-translational fusions. a given receptor density (Extended Data Fig. 10e) and/or by varying the
b, Confocal microscopy of mScarlet clustering in 3T3 cells expressing GBP– cell surface density of GBP–TM–mScarlet via a doxycycline-inducible
TM–mScarlet that were incubated with preformed arrays of A–GFP + B for the promoter (Extended Data Fig. 11b, c; varying the cell surface density
indicated time (in seconds). c, Quantification of the effects seen in b. d, 3D of GBP–TM–mScarlet did not alter receptor clustering efficiency).
rendering of an array binding event. e–h, TIE2 receptor clustering induced by We next investigated whether arrays assembled on membranes and
preformed AfD + A–GFP + B arrays. e, TIE2 receptors were imaged 5 or 15 min
on cells retained the lattice order. Fast AFM revealed that arrays assem-
after binding of arrays to cells. Insets show a higher magnification of the
bled on supported bilayers are similar to those formed in solution:
outlined area, omitting the array signal. f, Three-dimensional reconstruction in
2D, single layered and ordered (Fig. 4f, Extended Data Fig. 9c, d). The
the absence of arrays (left) or 60 min after introducing arrays (right), showing
the alignment between arrays and clustered TIE2. g, Effect of array-induced
mScarlet:GFP fluorescence ratio of B(c)–GFP/A–mScarlet arrays was
TIE2 clustering on AKT phosphorylation. Control, PBS only. h, Dynamics of similar between arrays assembled in vitro or onto cells, suggesting a
TIE2 activation. Scale bars: 3 µm (b) and 2.5 µm (e). similar degree of order (1.45 ± 0.07 for in vitro versus 1.48 ± 0.06 for
cells (median ± error); Fig. 4e and Supplementary Methods; electron
microscopy verification of the order of preformed B(c)–GFP/A–mScar-
detail. Super-resolution microscopy revealed extensive remodelling let arrays in Extended Data Fig. 8d and further controls of the fluo-
of the actin cytoskeleton underneath the TIE2 clusters after 60 min rescence ratio analysis in Extended Data Fig. 10m). Similarly, direct
(Fig. 3f), which could reflect adherens junction formation (Extended measurement of the A:B ratio of arrays assembled on cells revealed
Data Fig. 7c). The ANG1 arrays, but not the individual functionalized a ratio of 0.99 ± 0.04 (median ± error), consistent with the designed
array component, induce AKT signalling (Fig. 3g, h), showing that the structure (Extended Data Fig. 10n, Supplementary Methods).
arrays can have biological activities beyond those of their components. Following ligand-induced oligomerization, numerous receptors,
Taking advantage of the two-component nature of the material, we such as the epidermal growth factor receptor (EGFR), are internalized
sought to speed up assembly kinetics and homogeneity of clustering by endocytosis and degraded in lysosomes as a means to downregulate
by first saturating membrane receptors with one component, then signalling. Similarly, EGFR oligomerization by antibodies and nanobod-
triggering assembly with the second (Fig. 4a). Dihedral building blocks ies targeting different epitopes27,28 induce rapid EGFR endocytosis and
were not suited for this task, probably because cell membranes can lysosomal degradation. This uptake is not specific to small oligomers,
wrap around their symmetrical two sides displaying an equal number as large 3D clusters, such as those induced with our 60-mer nanocages33
of binding sites, thereby blocking assembly (Extended Data Fig. 8, functionalized with EGFR binders, were also rapidly internalized and
Supplementary Fig. 7). We therefore devised cyclic pseudo-dihedral routed to lysosomes (Extended Data Fig. 11f, g). This phenomenon has
versions of each component (referred to as A(c) and B(c) as opposed been proposed to lower the efficiency of immunotherapy in in vivo
to A and B, which are dihedral) (Extended Data Fig. 8, Supplementary models34. We therefore investigated whether the 2D geometry and
Fig. 7, Supplementary Tables 8, 9). AFM characterization revealed that large size of our material relative to clathrin-coated vesicles could
arrays grown on supported lipid bilayers by first tethering one cyclic modulate endocytosis. Functionalizing array components with EGFR
component then adding the other led to formation of 2D hexagonal binders enabled EGFR clustering in HeLa cells with similar fast kinetics
arrays nearly identical to those formed in solution (Fig. 4f, Extended to those of GBP–TM–mScarlet (Extended Data Fig. 11h–j). However,
Data Fig. 9, Methods). This two-step procedure using cyclic compo- whereas endogenous EGFR bound to dimeric B(c)–GFP was rapidly
nents led to array formation on cells expressing GBP–TM–mScarlet internalized and routed to lysosomes, clustering EGFR by addition of
(Fig. 4a–d, Extended Data Fig. 8h). A quantitatively inhibited this effect (Fig. 4g, h, Extended Data Fig. 11k).
Array formation on cells was rapid (about 20 s) and colocalizing Similarly, functionalizing arrays with the Notch ligand DLL4 enabled
mScarlet patches appeared synchronously with GFP-positive patches, Notch clustering on U2OS cells with a similar endocytic block (Supple-
indicating simultaneous receptor clustering (Fig. 4b, c, Supplementary mentary Figs. 8, 9). The extent of this inhibition of endocytosis could
4 | Nature | www.nature.com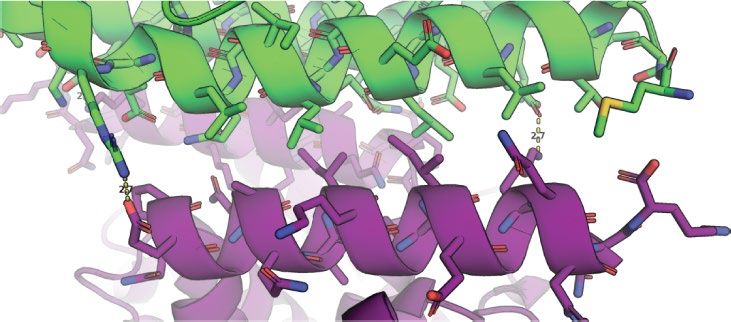
a External
Transmembrane
Internal
anti-GFP nanobody mScarlet
(1) Add B(c)–GFP
(2) Wash
(3) Add A
b B(c)–GFP/GBP–TM–mScarlet B(c)–GFP/GBP–TM–mScarlet
0 200 40 60 80 100 120
147 151 156 175 188
c d Median GFP per spot: 125 ± 3 e Arrays formed in vitro (n = 440) f Arrays formed on
Median mScarlet per spot: 77 ± 2 Arrays formed on cells (n = 1,058) supported bilayers
1,400 90 mScarlet molecules per spot 300 0.20
80
No. of spots detected
1,200 250 0.16
Colocalization (%)
70 200
Probability
1,000 0.12
60 150
800
0.08
50 100
600
40 50 0.04
B–GFP
400 GBP–TM–mScarlet
30 0 0
0 50 100 150 200 0 50 100 150 200 250 300 –2 0 2
Time (s) GFP molecules per spot ln(mScarlet/GFP fluorescence)
g h B(c)–GFP + GBP–EGFR–DARPin i B(c)–GFP
GBP–EGFR–DARPin + B(c)–GFP GBP–EGFR–DARPin + B(c)–GFP + A
B(c)–GFP + GBP–EGFR–DARPin + A B(c)-GFP + A
B(c)–GFP colocalizing with LAMP1 (%)
P < 0.001 NS P < 0.001 P < 0.05 NS
Internalized B(c)GFP (% of total)
45 90
LAMP1 / B–GFP / 40 min chase
40 80
35 70
30 60
25 50
20 40
15 30
n = 50
n = 48
n = 50
10 20
n = 15
n = 16
n = 15
n = 19
n = 15
n = 22
n = 36
n = 48
n = 70
n = 43
n = 68
5 10
0 0
0 20 40 60 0.1 0.5 2.0
Chase time (min) Doxycycline (μg ml–1)
Initial array size
Fig. 4 | Large arrays assembled on cells block endocytosis. a, GBP–TM– added to cells without or with A to drive the formation of EGFR engaging
mScarlet-expressing 3T3 cells were incubated with B(c)–GFP and then A and arrays. After 40 min, cells were processed for LAMP1 immunofluorescence and
imaged by confocal microscopy. b, Upon addition of A, foci positive for B(c)– imaged by confocal microscopy (maximum-intensity z-projections; insets
GFP or mScarlet appear, which eventually fuse (arrows). c, Quantification of show single planes). h, Quantification of the colocalization in g (n refers to the
effects seen in b. d, Number of GFP and mScarlet molecules per array plotted number of cells). P values by one-way analysis of variance followed by Tukey
per cell (mean ± s.e.m.; n = 8,972 arrays in N = 50 cells). Dashed red lines indicate test (P value of each comparison test indicated in panel). i, 3T3 cells expressing
boundary ratios for 1:1 or 2:1 ratios of B(c)–GFP:GBP–TM–mScarlet. e, mScarlet/ GBP–TM–mScarlet under doxycycline control were treated with increasing
GFP fluorescence intensity ratio histograms for B(c)–GFP + A–mScarlet arrays, doses of doxycycline to control the initial size of arrays, then treated as in a and
either preformed or assembled on cells (n = 1,058 arrays in N = 12 cells, n = 440 internalization was quantified after 60 min. P values by one-way analysis of
preformed arrays). f, AFM imaging of arrays assembled as in a, but on variance (P < 0.001) followed by Tukey’s test (P value of each comparison test
supported bilayers (see Methods). g, EGFR clustering on HeLa cells. B(c)–GFP indicated in panel). Scale bars: 10 µm (b, left, g), 1 µm (b, right, g inset) and
and a fusion protein binding both GFP and EGFR (GBP–EGFR DARPIN) were 50 nm (f).
be tuned by modulating array size using our inducible system (Fig. 4i, 2D-array geometry and subunit stoichiometry are preserved when
Extended Data Fig. 11d). the arrays assemble on a cell membrane, it will be useful to measure
Several lines of evidence suggest that our designed material assem- the array defect frequency when the technology for determination of
bles in a similar way on cells as it does in vitro. First, AFM showed structures on cells allows this. Nevertheless, these results highlight the
that assembly of the two components on supported lipid bilayers— power of quantitative light microscopy to translate structural informa-
using a protocol very similar to the one used for on-cell assembly— tion from defined in vitro reconstituted systems to the much more
generates single-layer arrays with the hexagonal lattice structure nearly complex cellular membrane environment.
identical to those formed in solution (compare Fig. 4f with Fig. 2a and Our studies of the interactions of the designed protein material
Extended Data Figs. 3, 9). Second, the remarkable homogeneity in with mammalian cells provides insights into cell biology of membrane
the growth rate and size distribution of the arrays assembled on cells dynamics and trafficking. We observe a strong dependence of endo-
resembles ordered crystal growth more than random aggregation. cytosis on array size and on the geometry of receptor binding-domain
Third, the distribution of the ratio of fluorescence intensities of the presentation: arrays roughly the size of clathrin-coated pits almost
two fluorescently labelled array components on cells is the same for completely shut down endocytosis, whereas smaller arrays or nan-
preformed arrays: disorganized aggregates would be expected to have oparticles displaying large numbers of receptor binding domains
a wide range of subunit ratios. Fourth, the A:B ratio of arrays generated were readily endocytosed (Extended Data Fig. 11e). Mechanistically,
on cells is close to 1, consistent with the array structure and not with this endocytic block probably relates to the increased curvature free
a disorganized aggregate. While these results suggest that the overall energy and/or membrane tension and further investigations of this
Nature | www.nature.com | 5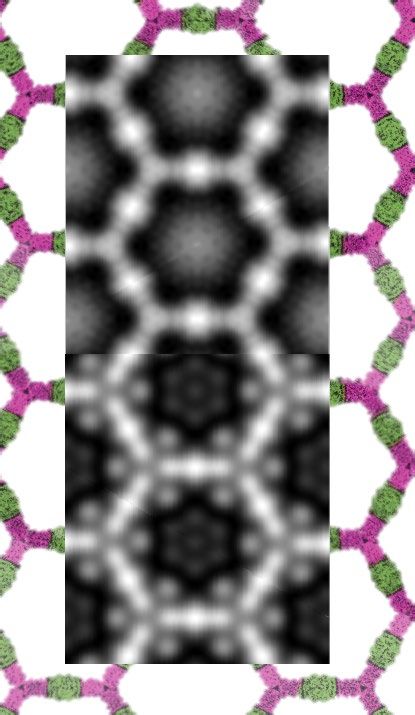
Article
phenomenon may shed light on the mechanisms of cellular uptake.                                      7.    Comerci, C. J. et al. Topologically-guided continuous protein crystallization controls
                                                                                                           bacterial surface layer self-assembly. Nat. Commun. 10, 1–10 (2019).
From a therapeutic perspective, the ability to shut down endocytosis                                 8.    Sinclair, J. C., Davies, K. M., Vénien-Bryan, C. & Noble, M. E. M. Generation of protein
without inducing signalling, as in our EGFR-binding arrays, could help                                     lattices by fusing proteins with matching rotational symmetry. Nat. Nanotechnol. 6,
extend the efficacy of signalling-pathway antagonists, which can be                                        558–562 (2011).
                                                                                                     9.    Vantomme, G. & Meijer, E. W. The construction of supramolecular systems. Science 363,
limited by turnover owing to endocytosis. Furthermore, the ability to                                      1396–1397 (2019).
assemble designed proteins around cells opens up new approaches                                      10.   Bale, J. B. et al. Accurate design of megadalton-scale two-component icosahedral
for reducing immune responses to introduced cells, for example in                                          protein complexes. Science 353, 389–394 (2016).
                                                                                                     11.   Butterfield, G. L. et al. Evolution of a designed protein assembly encapsulating its own
therapy for type 1 diabetes.                                                                               RNA genome. Nature 552, 415–420 (2017).
   The long-range almost-crystalline order, tight control over the tim-                              12.   Marcandalli, J. et al. Induction of potent neutralizing antibody responses by a designed
ing of assembly and the ability to generate complexity by functional-                                      protein nanoparticle vaccine for respiratory syncytial virus. Cell 176, 1420–1431.e17
                                                                                                           (2019).
izing array components differentiate this designed 2D material from                                  13.   Tan, R., Zhu, H., Cao, C. & Chen, O. Multi-component superstructures self-assembled
naturally occurring and other designed protein 2D lattices and opens                                       from nanocrystal building blocks. Nanoscale 8, 9944–9961 (2016).
many areas for investigation. The stepwise assembly approach offers a                                14.   Yeates, T. O. Geometric principles for designing highly symmetric self-assembling protein
                                                                                                           nanomaterials. Annu. Rev. Biophys. 46, 23–42 (2017).
fine level of control to cluster receptors compared with pre-assembled                               15.   Yeates, T. O., Liu, Y. & Laniado, J. The design of symmetric protein nanomaterials comes of
materials or aggregates: the receptor density in the clusters is fixed                                     age in theory and practice. Curr. Opin. Struct. Biol. 39, 134–143 (2016).
and the fluorescence intensity of the array component can be directly                                16.   Matthaei, J. F. et al. Designing two-dimensional protein arrays through fusion of multimers
                                                                                                           and interface mutations. Nano Lett. 15, 5235–5239 (2015).
converted into the absolute number of receptors being clustered.                                     17.   Garcia-Seisdedos, H., Empereur-Mot, C., Elad, N. & Levy, E. D. Proteins evolve on the edge
Together with the localization of activation to regions underneath                                         of supramolecular self-assembly. Nature 548, 244–247 (2017).
the arrays, this should facilitate investigation of the molecular events                             18.   Suzuki, Y. et al. Self-assembly of coherently dynamic, auxetic, two-dimensional protein
                                                                                                           crystals. Nature 533, 369–373 (2016).
downstream of receptor clustering. Imposition of a predetermined                                     19.   Du, M. et al. Precise fabrication of de novo nanoparticle lattices on dynamic 2D protein
order onto transmembrane proteins could open up new approaches to                                          crystalline lattices. Nano Lett. 2, 1154–1160 (2019).
structure determination. More generally, these binary biopolymers and                                20.   Chen, Z. et al. Self-assembling 2D arrays with de novo protein building blocks. J. Am.
                                                                                                           Chem. Soc. 141, 8891–8895 (2019).
methods to generate new ones provide novel tools and paradigms for                                   21.   Herrmann, J. et al. A bacterial surface layer protein exploits multistep crystallization for
the emerging field of engineered living materials35, in which combina-                                     rapid self-assembly. Proc. Natl Acad. Sci. USA 117, 388–394 (2020).
                                                                                                     22.   King, N. P. et al. Accurate design of co-assembling multi-component protein
tions of programmable cells produce building blocks of de novo binary
                                                                                                           nanomaterials. Nature 510, 103–108 (2014).
scaffolds to continuously regenerate or remodel their extracellular                                  23.   Berman, H. M. et al. The Protein Data Bank. Nucleic Acids Res. 28, 235–242 (2000).
structure and function in response to environmental cues. We expect                                  24.   DiMaio, F., Leaver-Fay, A., Bradley, P., Baker, D. & André, I. Modeling symmetric
                                                                                                           macromolecular structures in Rosetta3. PLoS ONE 6, e20450 (2011).
the methodology developed here, combined with the rapid develop-
                                                                                                     25.   Fleishman, S. J. et al. RosettaScripts: a scripting language interface to the Rosetta
ments in de novo design of protein building-blocks and quantitative                                        macromolecular modeling suite. PLoS ONE 6, e20161 (2011).
microscopy techniques, will provide the basis for a future of program-                               26.   Zakeri, B. et al. Peptide tag forming a rapid covalent bond to a protein, through
                                                                                                           engineering a bacterial adhesin. Proc. Natl Acad. Sci. USA 109, E690–E697 (2012).
mable biomaterials for synthetic and living systems.
                                                                                                     27.   Pedersen, M. W. et al. Sym004: a novel synergistic anti–epidermal growth factor
                                                                                                           receptor antibody mixture with superior anticancer efficacy. Cancer Res. 70, 588–597
                                                                                                           (2010).
Online content                                                                                       28.   Heukers, R. et al. Endocytosis of EGFR requires its kinase activity and N-terminal
                                                                                                           transmembrane dimerization motif. J. Cell Sci. 126, 4900–4912 (2013).
Any methods, additional references, Nature Research reporting sum-                                   29.   Goldenzweig, A. et al. Automated structure- and sequence-based design of proteins for
maries, source data, extended data, supplementary information,                                             high bacterial expression and stability. Mol. Cell 63, 337–346 (2016).
                                                                                                     30.   Chandrasekhar, S. Stochastic problems in physics and astronomy. Rev. Mod. Phys. 15,
acknowledgements, peer review information; details of author contri-                                       1–89 (1943).
butions and competing interests; and statements of data and code avail-                              31.   Kirchhofer, A. et al. Modulation of protein properties in living cells using nanobodies. Nat.
ability are available at https://doi.org/10.1038/s41586-020-03120-8.                                       Struct. Mol. Biol. 17, 133–138 (2010).
                                                                                                     32.   Zhao, Y. T. et al. F-domain valency determines outcome of signaling through the
                                                                                                           angiopoietin pathway. Preprint at https://doi.org/10.1101/2020.09.19.304188 (2020).
1.   Sleytr, U. B., Schuster, B., Egelseer, E.-M. & Pum, D. S-layers: principles and applications.   33.   Hsia, Y. et al. Design of a hyperstable 60-subunit protein icosahedron. Nature 535,
     FEMS Microbiol. Rev. 38, 823–864 (2014).                                                              136–139 (2016).
2.   Zhu, C. et al. Diversity in S-layers. Prog. Biophys. Mol. Biol. 123, 1–15 (2017).               34.   Chew, H. Y. et al. Endocytosis inhibition in humans to improve responses to
3.   Gonen, S., DiMaio, F., Gonen, T. & Baker, D. Design of ordered two-dimensional arrays                 ADCC-mediating antibodies. Cell 180, 895–914 (2020).
     mediated by noncovalent protein-protein interfaces. Science 348, 1365–1368 (2015).              35.   Nguyen, P. Q., Courchesne, N.-M. D., Duraj-Thatte, A., Praveschotinunt, P. &
4.   Liljeström, V., Mikkilä, J. & Kostiainen, M. A. Self-assembly and modular functionalization           Joshi, N. S. Engineered living materials: prospects and challenges for using
     of three-dimensional crystals from oppositely charged proteins. Nat. Commun. 5, 4445                  biological systems to direct the assembly of smart materials. Adv. Mater. 30,
     (2014).                                                                                               e1704847 (2018).
5.   Alberstein, R., Suzuki, Y., Paesani, F. & Tezcan, F. A. Engineering the entropy-driven
     free-energy landscape of a dynamic, nanoporous protein assembly. Nat. Chem. 10,                 Publisher’s note Springer Nature remains neutral with regard to jurisdictional claims in
     732–739 (2018).                                                                                 published maps and institutional affiliations.
6.   Charrier, M. et al. Engineering the S-layer of Caulobacter crescentus as a foundation for
     stable, high-density, 2D living materials. ACS Synth. Biol. 8, 181–190 (2019).                  © The Author(s), under exclusive licence to Springer Nature Limited 2021

6 | Nature | www.nature.com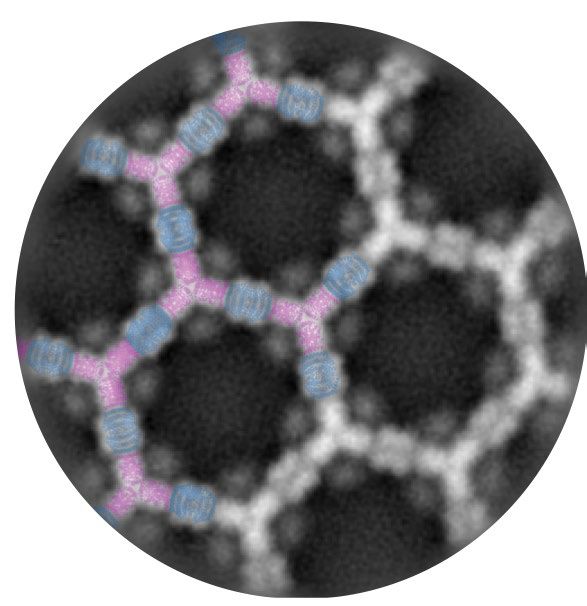
Methods                                                                       mScarlet, spyTag, spyCatcher, mSA242 and AVI tag) were either geneti-
                                                                              cally fused by a combination of PCR and Gibson processes or through
Computational design                                                          post expression conjugation using the SC–ST system26 or biotinyla-
Crystal structures of 628 D2, 261 D3, 63 D4 and 13 D6 dihedral homo-          tion43. Note that the variant of GFP used throughout the paper, on A
oligomers with resolution better than 2.5 Å were selected from the            and B components and the 60-mer nanocages is sfGFP.
Protein Data Bank23 to be used as building blocks. Combinatorial                 The transmembrane nanobody construct (Figs. 3, 4) consists of an
pairs of building blocks were selected such that they afford the two          N-terminal signal peptide from the Drosophila Echinoid protein, fol-
rotation centres required in a selected subset of plane symmetries            lowed by His6–PC (PC is the protein-C tag EDQVDPRLIDGK) tandem
(p3m1 [C3–C3], p4m [C4–C4, C4–C2], p6m [C6–C2, C6–C3, C3–C2]).                affinity tags, a nanobody against GFP31 (GFP-binding peptide (GBP)),
The highest-order rotation symmetry axis of each building block was           a TEV cleavage site, the transmembrane domain from the Drosophila
aligned perpendicular to the plane and an additional two-fold symme-          Echinoid protein, the VSV-G export sequence44,45 and the mScarlet
try axis was aligned with the plane symmetry reflection axis. Preserving      protein46. The protein expressed by this construct thus consists of an
these constraints allows positioning the D2, D3, D4 and D6 building blocks    extracellular anti-GFP nanobody linked to an intracellular mScarlet by
in 6, 2, 2 and 2 unique conformations, respectively, and results in a total   a transmembrane domain (named GBP–TM–mScarlet in the main text
of ~2.6 million unique docking trajectories. In a first iteration, sym-       for simplicity). This custom construct was synthesized (Integrated DNA
metric Rosetta design24 was applied to construct the building blocks          Technologies) and cloned into a modified pCDNA5-FRT-V5-His vector,
dihedral homo-oligomers, position them in the correct configura-              as previously described47 for homologous recombination into the FRT
tion in space and slide them into contact along the plane symmetry            site. A version without the mScarlet (GBP–TM) was similarly derived.
group reflection axes. Docking trajectories were discarded if clashing        We also modified the backbone to allow doxycycline-inducible expres-
between building blocks was detected, if a fraction greater than 20%          sion by first replacing the EF1a promoter with a Tet promoter, then by
of contact positions (residues belonging to one building block within         making the backbone compatible with the MXS chaining system48 and
10 Å of their partner building block residues) did not belong to a rigid      ligating in the CMV::rtTA3 bGHpA cassette.
secondary structure (helix or beta sheet), or if the surface area buried         For the GBP–mScarlet and GBP–EGFR–DARPin fusions, we modified
by the formation of the contact was smaller than 400 Å2. These initial        a pGEX vector to express a protein of interest fused to GBP downstream
filtering parameters narrowed the number of potential design trajec-          of the gluthatione S-transferase (GST) purification tag followed by TEV
tories to approximately 1% of the original number of trajectories. In a       and 3C cleavage sequences. We then cloned mScarlet and a published
second iteration, the selected docks (building blocks pairs and contact       DARPin against EGFR49 (clone E01) into this vector, which thus express
orientations) were regenerated by symmetric Rosetta design, slide into        GST-3C-TEV-GBP-mScarlet and GST-3C-TEV-GBP-EGFR-DARPin fusions,
contact and retract in steps of 0.05 Å to a maximum distance of 1.5 Å.        respectively.
For each position, layer-sequence design calculations, implemented
by a Rosetta script25, were made to generate low-energy interfaces with       Protein expression and purification
buried hydrophobic contacts surrounded by hydrophilic contacts.               Unless stated otherwise, all steps were performed at 4 °C. Protein con-
Designed substitutions not substantially contributing to the interface        centration was determined either by absorbance at 280 nm (NanoDrop
were reverted to their original identities. Resulting designs were filtered   8000 Spectrophotometer, Fisher Scientific), or by densitometry on
on the basis of shape complementarity, interface surface area, buried         Coomassie-stained SDS page gel against a BSA ladder.
unsatisfied hydrogen bonds, binding energy (ddG), and number of                  For initial screening of the 45 designs for A and B, bicistronic plasmids
hydrophobic residues at the interface core. A negative design approach        were transformed into BL21 Star (DE3) E. coli. cells (Invitrogen) and
that includes an asymmetric docking was used to identify potential            cultures grown in LB medium. Protein expression was induced with
alternative interacting surfaces. Designs that exhibited a non-ideal          1 mM isopropyl β-D-1-thiogalactopyranoside (IPTG) for 3 h at 37 °C
energy funnel were also discarded. Forty-five best-scoring designs            or 15 h at 22 °C, followed by cell lysis in Tris buffer (TBS) (25 mM Tris,
belonging to p3m1 (2 designs), p4m (10 designs) and p6m (33 designs)          300 mM NaCl, 1 mM dithiothreitol (DTT), 1 mM phenylmethylsulfonyl
were selected for experiments. Protein monomeric stabilization was            fluoride (PMSF) and lysozyme (0.1 mg ml−1) using sonication (Fisher
done to the D2 and D3 homo-oligomers of design 13 using the PROSS             Scientific) at 20 W for 5 min total ‘on’ time, using cycles of 10 s on, 10 s
server29 (Supplementary Figs. 4, 5, Supplementary Table 5).                   off. Soluble and insoluble fractions were separated by centrifugation
   Pyrosetta36 and RosettaRemodel37 were used to model and generate           at 20,000g for 30 min and protein expression was screened by running
linkers to render the D2 and D3 working homo-oligomers into C2 and C3         both fractions on SDS–PAGE (Bio-Rad) (see Supplementary Fig. 3) and
(cyclic pseudo-dihedral) homo-oligomers (Extended Data Fig. 8, Sup-           for selected samples also by negative-stain electron microscopy. All
plementary Fig. 7, Supplementary Tables 8, 9 for details and further          subsequent experiments done on separately expressed components
discussion). Linkers for non-structural fusions, that is, optical labels      were performed on His6-tagged proteins. Following similar expression
and binding sites such as SC–ST, were not modelled computationally.           protocols (22 °C, 15 h), cultures were resuspended in 20 mM supple-
All Rosetta scripts used are available upon request.                          mented Tris-buffer and lysed by microfluidizer at 18,000 PSI (M-110P
                                                                              Microfluidics). The soluble fraction was passed through 3 ml of nickel
Expression construct generation                                               nitrilotriacetic acid agarose (Ni-NTA) (Qiagen), washed with 20 mM
Genes encoding the 45 designs pairs were initially codon optimized            imidazole, and eluted with 500 mM imidazole. Pure proteins with the
using DNAWorks v3.2.438 followed by RNA ddG minimization of the               correct homo-oligomeric conformation were collected from a Superose
50 first nucleotides of each gene using mRNAOptimiser39 and                   6 10/300 GL SEC column (GE Healthcare) in Tris-buffer (TBS; 25 mM
Nupack3.2.2 programs40 (Supplementary Fig. 1). For screening in an            Tris, 150 mM NaCl, 5% glycerol). Separately expressed components
in-vivo expression setup, bicistronic constructs were cloned (Gen-            were kept at a concentration of about 200 µM at 4 °C.
Script) in pET28b+ (kanamycin resistant), between NcoI and XhoI                  SC–ST conjugation was done by mixing a tagged protein and the com-
endonuclease restriction sites and separated by an intergenic region:         plementary tagged array component at a 1.3:1 molar ratio, overnight
TAAAGAAGGAGATATCATATG. For the working design, separately                     incubation (about 10 h) at 4 °C followed by Superose 6 10/300 GL SEC
expressing constructs were prepared by PCR from sets of synthetic             column purification to obtain only fully conjugated homo-oligomers.
oligonucleotides (Integrated DNA Technologies) to generate linear             Sub-loaded conjugation was done at tag:array protein 0.17:1 molar ratio
DNA fragments with overhangs compatible with a Gibson assembly41              and used as is. Biotinylation of AVI-tagged components was performed
to obtain circular plasmids. Additional labels (His tag, sfGFP, mCherry,      with BirA as described43 and followed by Superose 6 10/300 GL SEC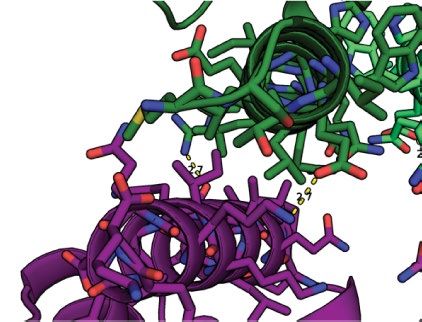
Article
column purification. In vitro array assembly was induced by mixing           particle extraction and 2D alignment and averaging) was accomplish-
both array components at equimolar concentration.                            ing using the Relion software package51.
   GFP-tagged 60mer nanocages were expressed and purified as previ-
ously33. GBP–mScarlet was expressed in E. coli BL21 Rosetta 2 (Strata-       Characterization of kinetics of in vitro assembly
gene) by induction with 1 mM IPTG in 2X YT medium at 20 °C overnight.        Array-formation kinetics was determined by turbidity caused light
Bacteria were lysed with a microfluidizer at 20kPsi in lysis buffer (20 mM   scattering, monitored by absorption at 330 nm, using an Agilent Tech-
HEPES, 150 mM KCl, 1% Triton X-100, 5% glycerol, 5 mM MgCl2, pH 7.6)         nologies Cary 8454 UV-Vis spectrophotometer. Absorption spectrum
enriched with protease inhibitors (Roche Mini) and 1 mg ml−1 lysozyme        in the range 190 nm to 1,100 nm was acquired every 5 s for 25 min imme-
(Sigma) and 10 µg ml−1 DNase I (Roche). After clarification (20,000 rpm,     diately following an initial blank. Absorption curves at 330 nm were
Beckman JA 25.5, 30 min 4 °C), lysate was incubated with glutathione         constructed using measurements of blank samples (buffer: 25 mM
S-sepharose 4B resin (GE Healthcare) for 2 h at 4 °C and washed exten-       Tris-HCl, 150 mM NaCL, 5% glycerol and 500 mM imidazole) as control,
sively with (20 mM HEPES, 150 mM KCl, 5% glycerol, pH7.6), and eluted        B components at 5 µM, and A + B mixtures (5, 10 or 15 µM). Curves were
in (20 mM HEPES, 150 mM KCl, 5% glycerol, 10m M reduced glutathione,         acquired for three experimental replicates for each experimental con-
pH7.6). Eluted protein was then cleaved by adding 1:50 (vol:vol) of          dition (two for blank control). Curves were processed as follows: the
2 mg ml−1 His6–TEV protease and a final concentration of 1 mM DTT,           respective initial value (first time point) was first subtracted from each
0.5 mM EDTA overnight at 4 °C. The buffer of the cleaved protein was         curve to account for initial background; then, a nonlinear offset was
then exchanged for (20 mM HEPES, 150 mM KCl, 5% glycerol, pH 7.6)            applied by subtracting the averaged curve of the blank measurements
using a ZebaSpin column (Pierce), and free GST was removed by incu-          from each and all the other curves. Extended Data Fig. 3a shows the
bation with glutathione S-sepharose 4B resin. Tag-free GBP–mScarlet          average absorption of each group of samples and standard deviation
was then ultracentrifuged at 100,000g for 5 min at 4 °C to remove            (n = 3 experimental replicates). All data were processed using python
aggregates. GBP–mScarlet was then incubated with GFP–60mer nanoc-            Dataframe and Numpy packages.
ages33, followed by size exclusion chromatography (see Supplementary
Information, ‘Microscope calibration’), which further removed the TEV        Characterization of protein stabilization
protease from the final mScarlet–GBP or GFP-60mer.                           Far-ultraviolet circular dichroism (CD) measurements were carried
   GBP–EGFR–DARPin was expressed similarly as GBP–mScarlet, except           out with an AVIV spectrometer, model 420. Wavelength scans were
that lysis was performed using sonication, lysate clarification was per-     measured from 260 to 195 nm at temperatures between 25 and 95 °C.
formed at 16,000 rpm in a Beckman JA 25.5 rotor for 30 min at 4 °C).         Temperature melts were monitored via the absorption signal at 220 nm
After TEV cleavage buffer was exchanged for (20 mM HEPES, 150 mM             in steps of 2 °C min−1 and 30 s of equilibration time. For wavelength scans
KCl, 5% glycerol, pH 7.6) by dialysis, free GST and TEV proteases were       and temperature melts, a protein solution in PBS buffer (pH 7.4) of con-
removed by sequential incubation with glutathione S-sepharose 4B             centration 0.2–0.4 mg ml−1 was used in a cuvette with 1 mm path length.
resin and Ni-NTA resin. Tag-free GBP-EGFR–DARPin was then flash fro-
zen in liquid N2 and kept at −80 °C.                                         SAXS experiments
   DLL4 was prepared from a fragment of the human delta ectodomain           Small angle X-ray scattering data were collected at the SIBYLS beamline
(1–405) with a C-terminal GS–SpyTag–His6 sequence (Supplemen-                at the Advanced Light Source in Berkeley, CA, USA52. Components A
tary Table 7). The protein was purified by immobilized metal affinity        and B were measured independently and as a mixture in 25 Tris, 150
chromatography from culture medium from transiently transfected              NaCl and 5% glycerol. Imidazole was added to the mixture in a stepwise
Expi293F cells (Thermo Fisher), then further purified to homogeneity         fashion after A and B were mixed at 1:1. These solutions were prepared
by size exclusion chromatography on a Superdex 200 column in 50 mM           24 h before collection. Before collection, samples were placed in a
Tris, pH 8.0, 150 mM NaCl, and 5% glycerol, and flash frozen before          96-well plate. Each sample was presented to the X-ray beam using an
storage at −80 °C. DLL4 was conjugated to the SpyCatcher-tagged A            automated robotics platform. The 10.2 keV monochromatic X-rays at a
homo-oligomers (ASC) at 1.5:1 molar ratio of DLL4 to ASC. The ASC–ST–        flux of 1012 photons s−1 struck the sample with a 1 × 0.3mm rectangular
DLL4 conjugate was purified by size exclusion chromatography on a            profile that converged at the detector to a 100 µm × 100 µm spot. The
Superose 6 column. The ASC–ST–DLL4–JF646 conjugate was produced              detector-to-sample distance was 2 m and nearly centred on the detec-
by coupling of 1.5 µM ASC–ST–DLL4 to excess Janelia Fluor 646 SE             tor. Each sample was exposed for a total of 10 s. The Pilatus 2M detector
(Tocris) overnight at 4 °C in 25 mM HEPES, pH 7.5, 150 mM NaCl. The          framed the 10 s exposure in 300 ms frames for a total of 33 frames. No
labelled ASC–ST–DLL4 was then purified by desalting on a P-30 column         radiation damage was observed during exposures.
(Bio-Rad). The final molar ratio of JF646 to ASC–ST–DLL4 was 5:1.               Components A and B were independently collected at 4 concentra-
                                                                             tions (40, 80, 120 and 160 µM). No concentration dependence was
Negative-stain electron microscopy                                           observed so the 160 µM SAXS measurement (the one with the highest
For initial screening of coexpressed designs insoluble fractions were        signal) SAXS measurement was analysed using the Scatter program
centrifuged at 12,000g for 15 min and resuspended in Tris-buffer (TBS;       developed by Rambo et al. (https://www.bioisis.net/) at SIBYLS and
25 mM Tris, 300 mM NaCl) twice before grid preparation. Samples              the Diamond Light Source. SAXS profiles were calculated using FOXS53
were applied to glow-discharged electron microscopy grids with               and compared with the measured data with excellent agreement χ2 < 1
continuous carbon, after which grids were washed with distilled,             for hexameric A and tetrameric B (Extended Data Fig. 5a). No further
deionized water, and stained with 2% uranyl formate. Electron micros-        processing was performed, as the agreement between calculated SAXS
copy grids were screened using an FEI Morgagni 100 kV transmission           from the model and the experiment was sufficient to verify close agree-
electron microscope possessed of a Gatan Orius CCD camera. For the           ment of the atomic model.
working design, electron microscopy grids were initially screened               Mixtures of components A and B were measured at 4 concentrations
using the Morgagni electron microscope. Micrographs of well-stained          (0.5, 2, 5, and 10 µM). The scattering profiles all had peaks (Extended
electron microscopy grids were then obtained with an FEI Tecnai G2           Data Fig. 5a, d, f) at q spacings as indicated in Supplementary Table 7.
Spirit transmission electron microscope (equipped with a LaB6 fila-          The scattering can be described in several ways, according to the scat-
ment and Gatan UltraScan 4k × 4k CCD camera) operating at 120 kV             tering theory. In crystalline systems, the diffraction intensity is the
and magnified pixel size of 1.6 Å. Data collection was performed via         convolution of the lattice and the asymmetric unit within the lattice54.
the Leginon software package50. Single-particle style image process-         Below we will distinguish the peaks as a diffraction component and the
ing (including contrast transfer function estimation, particle picking,      asymmetric unit as the scattering component. We obtain a very good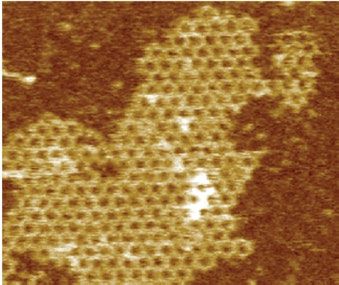
You can also read