National Oesophago-Gastric Cancer Audit 2020 - An audit of the care received by people with Oesophago-Gastric Cancer in England and Wales
←
→
Page content transcription
If your browser does not render page correctly, please read the page content below
National Oesophago-Gastric
Cancer Audit
2020

   An audit of the care received
   by people with Oesophago-Gastric Cancer
   in England and Wales

Version 2: published 8 February 2021
This report was prepared by
Clinical Effectiveness Unit, The Royal College of Surgeons of England
Min Hae Park, Assistant Professor
Hussein Wahedally, Statistician / Data Manager
David Cromwell, Professor of Health Services Research

The Association of Upper GI Surgeons (AUGIS)
Nick Maynard, Consultant Surgeon

Royal College of Radiologists (RCR)
Tom Crosby, Consultant Clinical Oncologist

British Society of Gastroenterology (BSG)
Nigel Trudgill, Consultant Gastroenterologist

NHS Digital
Jane Gaskell, Audit Manager
Rose Napper, Audit Coordinator

Commissioned by Healthcare Quality Improvement Partnership

                            The Royal College of Surgeons of England is an independent professional body
                            committed to enabling surgeons to achieve and maintain the highest standards
                            of surgical practice and patient care. As part of this it supports Audit and the
                            evaluation of clinical effectiveness for surgery. Registered Charity no: 212808

                            The Association of Upper GI Surgeons is the speciality society that represents
                            upper gastrointestinal surgeons. It is one of the key partners leading the Audit.
                            Registered Charity no: 1093090

                            The British Society of Gastroenterology is the speciality society of
                            gastroenterologists. It is one of the key partners leading the Audit.
                            Registered Charity no: 1149074

                            The Royal College of Radiologists is the professional body for clinical radiologists
                            and clinical oncologists. It is one of the key partners leading the Audit.
                            Registered Charity no: 211540

                            NHS Digital is the trading name for the Health and Social Care Information Centre
                            (HSCIC). They provide 'Information and Technology for better health and care'.
                            The Clinical Audit and Registries Management Service of NHS Digital manages a
                            number of national clinical audits in the areas of cancer, diabetes and heart
                            disease. It manages the Audit on behalf of the RCS.
Contents

 Acknowledgements ........................................................................................................... 2
 Executive Summary........................................................................................................... 3
 Recommendations............................................................................................................. 7
 1.    Introduction .............................................................................................................. 10
 2.    Management of HGD patients .................................................................................. 12
 3.    Participation in the OG cancer prospective audit ...................................................... 18
 4.    Patients with oesophago-gastric cancer ................................................................... 21
 5.    Routes to diagnosis .................................................................................................. 23
 6.    Staging investigations............................................................................................... 25
 7.    Treatment planning .................................................................................................. 27
 8.    Curative surgery ....................................................................................................... 34
 9.    Non-curative OG cancer treatment patterns and outcomes ...................................... 44
 10.       Presentation of results as a “composite indicator” ................................................. 50
 Annex 1: Organisation of the Audit .................................................................................. 52
 Annex 2: Audit methods .................................................................................................. 54
 Annex 3: List of regional areas and NHS organisations ................................................... 57
 References ...................................................................................................................... 60
 Glossary .......................................................................................................................... 62

                                                                 1
Acknowledgements
The National Oesophago-Gastric Cancer Audit is thank them for the considerable time that their
commissioned by the Healthcare Quality staff devoted to collecting and submitting data.
Improvement Partnership (HQIP) as part of the
National Clinical Audit and Patient Outcomes We would also like to acknowledge the Welsh local
Programme (NCAPOP). health boards and the Welsh Cancer Network.
HQIP is led by a consortium of the Academy of We would like to thank:
Medical Royal Colleges, the Royal College of Mr John Taylor and the Oesophageal
Nursing and National Voices. Its aim is to promote Patients Association
quality improvement in patient outcomes, and in The members of the Clinical Reference
particular, to increase the impact that clinical Group and Project Board (see Annex 1 for
audit, outcome review programmes and registries full list of members)
have on healthcare quality in England and Wales.
The data linkage team at NHS Digital
HQIP holds the contract to commission, manage
The Office of Data Release, Public Health
and develop the National Clinical Audit and Patient
Outcomes Programme (NCAPOP), comprising England
around 40 projects covering care provided to
The Audit is supported by the Clinical Audit and
people with a wide range of medical, surgical and
Registries Management Service (CARMS), and the
mental health conditions. The programme is
Clinical Audit Platform (CAP) development team
funded by NHS England, the Welsh Government
who provide IT support and technical
and, with some individual projects, other devolved
infrastructure.
administrations and crown dependencies.
www.hqip.org.uk/national-programmes
Finally, we thank and remember Mr David Eaves,
who sadly passed away this year.
We would like to acknowledge the support of the
many hospitals that participated in this Audit and
© 2020 Healthcare Quality Improvement Partnership (HQIP)
All rights reserved. Applications for the copyright owner’s written permission to reproduce significant parts of
this publication (including photocopying or storing it in any medium by electronic means and whether or not
transiently or incidentally to some other use of this publication) should be addressed to the publisher. Brief
extracts from this publication may be reproduced without the written permission of the copyright owner,
provided that the source is fully acknowledged.
2Executive Summary
The National Oesophago-Gastric Cancer Audit by adult patients diagnosed between April
(NOGCA) was established to evaluate the 2017 and March 2019 and their outcomes.
quality of care received by patients with For some outcomes, information is presented
oesophago-gastric (OG) cancer in England and for patients diagnosed over a longer period to
Wales. enable comparisons over time. For example,
in the case of HGD, outcomes of endoscopic
The Annual Report is written for four key treatment are presented for a four-year
audiences: those who deliver, receive, period which enables comparison of the
commission and regulate care. In addition to current cohort (2017 to 2019) with patients
providing information about OG cancer diagnosed in the previous two years (2015 to
services for patients and commissioners, it 2017). For outcomes of curative surgery
enables NHS organisations to benchmark their among OG cancer patients, data are reported
performance and identify areas where care for a three year period (April 2016 to March
could be improved. 2019) to ensure that enough procedures are
included in the analysis to produce robust
The Audit collected data on individuals statistics for individual NHS organisations.
diagnosed in England and Wales with invasive
epithelial cancer of the oesophagus, gastro- Supplementary material, including tables
oesophageal junction (GOJ) or stomach, and containing individual trust results, and further
patients diagnosed with high grade dysplasia information about the Audit can be found on
(HGD) of the oesophagus. The primary focus its website: www.NOGCA.org.uk.
of the 2020 Annual Report is the care received
High grade dysplasia of the oesophagus: key findings
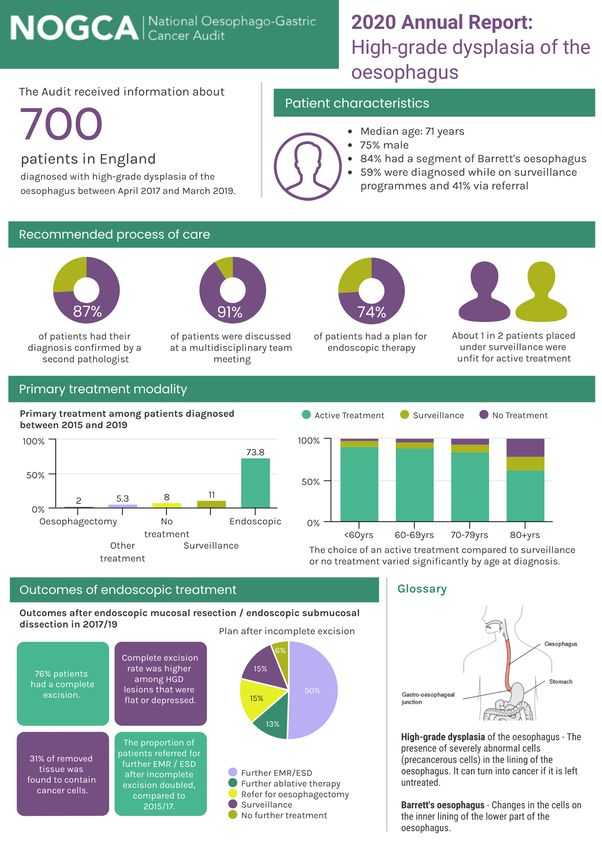
During the 2017-19 period, the Audit received 1. All cases of suspected HGD should be
information on 700 patients diagnosed with confirmed by two gastrointestinal
HGD of the oesophagus in England. This pathologists
number has decreased over the last five years, In the audit period 2017-19, 86.7% of patients
from around 800 patients, and the number of with HGD had their original diagnosis
HGD records submitted per million population confirmed by a second pathologist. As in
shows variation across regions suggesting that previous years, the proportion was higher
case ascertainment is low in some areas. among younger patients. The proportion for
patients aged 80 and over was 84.0%, which
Guidance on the management of patients was an improvement on the figures for the
with HGD was published by the BSG in 2014 preceding four years.
[BSG/Fitzgerald et al 2014]. The guidance
defined clinical standards on the initial 2. All patients with HGD should be discussed
diagnosis of HGD and treatment planning, and by a specialist multi-disciplinary team (MDT).
recommended that patients should be In the 2017-19 audit period, 91.3% of patients
considered for endoscopic therapy in with newly diagnosed HGD were discussed at
preference to either oesophagectomy or an upper gastrointestinal MDT meeting. This
endoscopic surveillance. Performance in four proportion has increased from 84.7% in 2015-
key areas was covered by the Audit: 17. There were regional differences in the
proportion discussed at MDT, with the figure
3exceeding 90% for 12 Cancer Alliances and variation in the use of surveillance or no
being below 70% for two Alliances. treatment across Cancer Alliances.
3. Endoscopic therapy for HGD is preferred 4. Endoscopic treatment should be performed
over oesophagectomy or surveillance in specialist centres treating at least 15 cases
Among patients diagnosed between 2015 and each year.
2019, 73.8% had a plan of endoscopic Based on the data submitted for the 2017-19
therapy. The remaining planned treatments period, 10 of the 37 specialist OG cancer
were: oesophagectomy for 2.0% of patients, centres performed at least 15 endoscopic
surveillance for 11.0% and other treatments procedures per year, an improvement from 7
for 5.3%, while 8.0% of patients had a plan for centres in last year’s Audit period.
no treatment or surveillance. There was some
Oesophago-gastric cancer: key findings
All 131 NHS acute trusts in England and the 6 stage information was incomplete for 17% of
local health boards providing OG cancer care patients. This needs to improve because this
in Wales participated in the 2017-19 Audit information is essential to understand
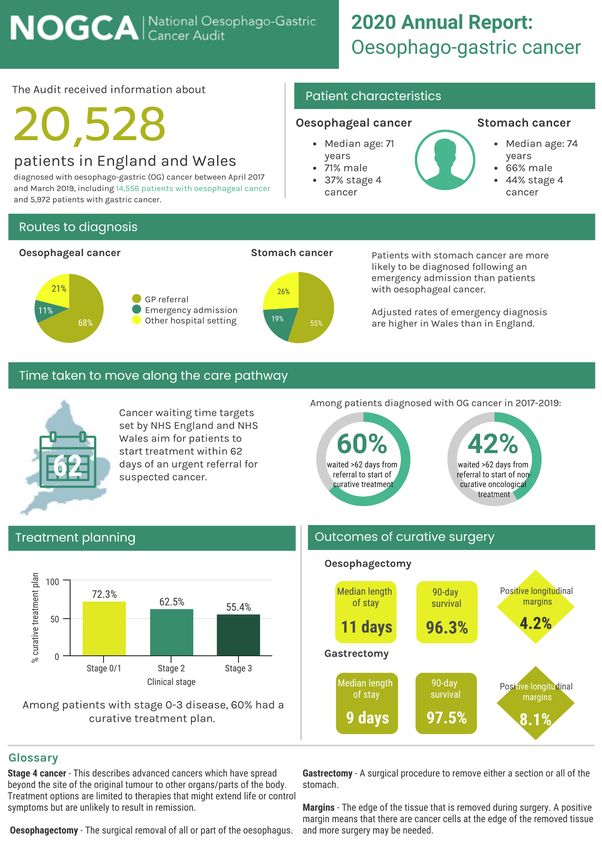
period. Records were submitted for 20,528 patterns of care. Clinical stage information
patients, including 19,171 diagnosed in was more likely to be missing for older
England and 1,357 in Wales. Case patients and those with non-curative
ascertainment was estimated to be 90% in treatment plans.
England and over 85% in Wales.
It is recommended that all patients diagnosed
1. Patterns of care at diagnosis with OG cancer have a CT scan to assess the
Among patients diagnosed in 2017-19, 64% spread of disease. Overall, 94.9% of patients
were diagnosed following referral from a GP, diagnosed in 2017-19 had an initial CT scan,
13% after emergency admission, and 23% and there was generally good compliance
from a non-emergency hospital setting. The with this recommendation across NHS
rate of diagnosis following an emergency organisations.
admission has remained largely unchanged
over the last five Audit years, as has the For patients with oesophageal cancer, the use
proportion of patients diagnosed with early of PET-CT scans is recommended for patients
stage cancer. Regional variation continues to being considered for curative treatment. In
persist in the proportion of patients the 2017-19 cohort, 71.3% of patients with
diagnosed after an emergency admission. oesophageal cancer who had a plan for
Notably, the adjusted rates of emergency curative treatment were recorded to have had
diagnosis in Wales are higher than in England. PET-CT, although there was variation across
This may be due to differences in patient England and Wales.
behaviours as well as practitioner factors.
There may also be variation in the way that Among patients in the 2017-19 cohort with
emergency referral routes are recorded. clinical stage 0-2 disease, 83% of those aged
under 70 years had a curative treatment plan,
2. Staging and treatment planning although this figure was lower among older
As in previous years, a minority of patients. A similar pattern was seem among
organisations submitted limited data about patients with stage 3 disease, with 72% of
staging investigations. In addition, clinical
4those aged under 70 years having a curative insight into the adequacy of staging and
treatment plan. appropriateness of curative surgery. Most of
the NHS surgical centres had an adjusted 1-
3. Time taken along the care pathway year survival rate that fell within the expected
The target waiting time from urgent referral range (defined by the 99.8% control limit).
to the start of treatment is 62 days in both There were two NHS trusts whose survival
England and Wales. In the 2017-2019 cohort, rates were above the upper 99.8% control
the distributions of waiting times from limit, suggesting that they performed better
referral to first treatment were similar across than average during the Audit period.
the Cancer Alliances / Welsh regions. Overall:
60% of patients waited more than 62 Enhanced recovery after surgery (ERAS)
days from referral to first curative protocols can reduce surgical complications
treatment. and shorten length of hospital stay. Data on
19% waited more than 104 days. the use of ERAS protocols in OG cancer
In 7 of 24 regions, over a quarter of surgery were available for English centres for
the last two Audit years (2017-2019). Use of
patients waited longer than 104 days
the ERAS approach was reported for over
to begin treatment.
two-thirds of patients, but was clustered
Among patients receiving non- within NHS trusts, with only 20 of 35 surgical
curative oncological treatment, 42% centres reporting an ERAS pathway for more
waited longer than 62 days and 12% than 80% of surgical patients. Patients on an
waited more than 104 days. ERAS pathway had a shorter average length of
stay following surgery. Patients on a
These waits are unacceptably long and NHS
protocolised ERAS pathway with daily
organisations which perform poorly against
documentation in medical notes had an
the national 62 day target should review their
average length of hospital stay that was
OG cancer pathway and take steps to ensure
around 1.5 days shorter than those on a non-
compliance with this target.
ERAS pathway.
4. Curative Surgery
Other key surgical indicators for patients
In the 3-year period (2016-2019) over which
having curative surgery include the proportion
curative surgery is evaluated, surgical centres
of patients with a positive resection margin. In
submitted data for 4,112 oesophagectomies
the 2016-19 Audit period, all surgical centres
and 2,163 gastrectomies. Rates of 90-day
achieved positive longitudinal margin rates
mortality after curative surgery were within
within the expected ranges from the national
the expected range from the national average
average for both oesophagectomy and
for all NHS surgical centres (overall 90-day
gastrectomy. However, the overall positive
mortality rate was 3.3% for
longitudinal margin rate of 8.1% for
oesophagectomies and 1.7% for
gastrectomy exceeded the 5% target set out
gastrectomies).
in the AUGIS recommendations. At 4.2%, the
overall rate for oesophagectomy was within
Information about 1-year survival after
the target range. Indicators summarising
curative surgery is presented for the first time
positive circumferential margins and number
in this report. Figures were produced for the
of lymph nodes examined showed more
2016-2019 Audit period, and show 82.7% of
variation than the longitudinal margin
oesophageal cancer patients and 85.7% of
indicators, but have shown improvements in
stomach cancer patients survived at least one
recent years.
year after surgery. This measure provides
55. Non-curative treatments died within 30 days of starting palliative
Among patients on a non-curative care chemotherapy.
pathway, palliative oncology was the most
common treatment option. Among patients While the use of triplet regimens has
with a record of palliative oncology, previously been recommended as a first line
chemotherapy was the most frequently used option for palliative chemotherapy, the
treatment for both oesophageal and gastric benefit of these regimens has been
cancers (67% overall). The rates of questioned in recent years and several
completion of chemotherapy were relatively international studies recommend a doublet
low (56%), and did not vary greatly by tumour regimen as standard of care. Reflecting this
type, patient age or clinical stage. The most change, the Audit data show that there is
frequently reported reasons for non- considerable regional variation in the use of
completion of chemotherapy were disease triplet regimens. The use of doublet regimens
progression during treatment, acute has increased over the last five years, from
chemotherapy toxicity and patient death. In 16.5% among patients diagnosed in 2014/15
the 2017-19 Audit cohort, 3.6% of patients to 25.8% among those diagnosed in 2018/19.
6Recommendations
Where in Primary audience
report
Audit participation
1. Regularly assess records submitted to the National Pages 13, Clinical leads,
Oesophago-Gastric Cancer Audit to ensure (a) high case 18, 26 Multi-disciplinary
ascertainment, and (b) low levels of missing data on cancer teams (MDTs),
stage, staging investigations and surgical pathology results. local audit teams
Diagnosis and treatment of high grade dysplasia
2. Review patients who do not have their diagnosis of high Page 14 Clinical leads,
grade dysplasia diagnosed by a second pathologist, and MDTs
examine the reasons for this to ensure that all patients have
their diagnosis confirmed by two pathologists.
3. Examine high rates of non-treatment among patients with Page 15 Clinical leads,
high grade dysplasia in a local audit to ensure offers of MDTs
endoscopic treatment are consistent with British Society of
Gastroenterology recommendations.
4. Ensure protocols on the referral of patients to local specialist Page 17 NHS trusts / local
centres for endoscopic treatment will produce annual health boards,
volumes at these centres that meet recommended caseloads. commissioners
Diagnosis and treatment of oesophago-gastric cancer
5. Review patients who were diagnosed after emergency Page 23 GP practices, MDTs,
admission to identify opportunities for improving earlier Commissioners
detection.
6. Ensure all patients with oesophageal cancer being considered Page 26 MDTs, NHS trusts /
for curative treatment have a PET-CT scan. Hospitals with low local health boards
reported use of PET-CT scans should investigate to determine
the causes. Use of PET-CT scans for gastric cancer patients
should be reviewed in line with recent evidence.
7. Review waiting times through the oesophago-gastric cancer Page 32- MDTs, NHS trusts /
care pathway and identify ways to reduce the proportion of 33 local health boards,
patients waiting longer than 62 days from referral to GPs, commissioners
treatment.
8. Review options for implementing enhanced recovery after Page 35 Upper GI surgeons,
surgery (ERAS) protocols as standard care. AUGIS
9. Continue work towards standardising the methods of Page 38 Upper GI surgeons,
preparing surgical specimens following resection, particularly pathologists, AUGIS
in relation to circumferential margins.
10. Work towards consensus-based practice in the use of triplet Page 47 Oncologists, MDTs,
and doublet palliative chemotherapy regimens. RCR, RCP
78
9
1. Introduction

The National Oesophago-Gastric Cancer Audit             Cancer patients were eligible for inclusion in
(NOGCA) was established to evaluate the                 the Audit if they were diagnosed with invasive
quality of care received by patients diagnosed          epithelial cancer of the oesophagus, gastro-
with oesophago-gastric cancer and identify              oesophageal junction (GOJ) or stomach (ICD10
areas where NHS cancer services in England              codes C15 and C16), and were aged 18 years
and Wales can improve. Oesophago-gastric                or over. Patients with neuro-endocrine
(OG) cancer is the fifth most common type of            tumours or gastro-intestinal stromal tumours
cancer in the UK, with around 13,000 people             (GISTs) were not included in the Audit due to
diagnosed each year in England and Wales.               the different management of these tumours.
In addition, the Audit examines the care
received by patients diagnosed with                     The 2020 Annual Report focuses primarily on
oesophageal high grade dysplasia (HGD), due             the experience and outcomes of patients
to the risk of progression to cancer if HGD is          diagnosed with OG cancer or oesophageal
left untreated.                                         HGD between April 2017 and March 2019.

1.1 The 2020 Annual Report

The aim of this report is to describe the care          the Audit, the interpretation of its findings
provided by NHS OG cancer services in                   and their dissemination is provided by a
England and Wales from the time of diagnosis            Clinical Reference Group (see Annex 1).
to the end of a patient’s primary treatment,
and to identify regional variation in care for           COVID-19
local investigation. It is written for those who         The COVID-19 pandemic has led to the
provide, receive, commission and regulate OG             complete reorganisation of many NHS
cancer care. This includes clinicians and other          services and changes in the health-seeking
healthcare professionals working within                  behaviour of the general public, with
hospital cancer units, clinical commissioners,           implications for OG cancer care.
and regulators, as well as patients and the
                                                         The NOGCA 2020 Annual Report covers a
public who are interested in knowing how OG
                                                         pre-COVID-19 period (April 2017 to March
cancer services are delivered within the NHS.
                                                         2019), therefore the results reported are
A separate Report for the Public and Patients            not affected by the pandemic. However,
will be published on the NOGCA website.                  next year’s report will include patients
                                                         whose care has been impacted during the
The Audit is run by the Association of Upper             peak COVID-19 period.
Gastrointestinal Surgeons of Great Britain &
Ireland (AUGIS), the Royal College of                    In order to understand how OG cancer
Radiologists (RCR), the British Society of               treatment pathways have been affected
                                                         and how services have adapted, the NOGCA
Gastroenterology (BSG), NHS Digital and the
                                                         team has conducted an organisational
Clinical Effectiveness Unit of the Royal College
                                                         survey of all specialist OG cancer centres in
of Surgeons of England (RCS). The delivery of            England and Wales. The findings of this
the Audit is overseen by a Project Board                 survey will be published on the NOGCA
whose role is to ensure NOGCA is well-                   website and will inform the interpretation
managed. Advice on the clinical direction of             of results in the 2021 Annual Report.

                                                   10
1.2 Regional organisation of OG cancer services
OG cancer services within England and Wales
are organised on a regional basis to provide For Wales, three NHS services providing
an integrated model of care. specialist surgical and oncology services are
used to define geographical regions: Swansea
This report presents regional results for Bay, Betsi Cadwaladr (North Wales) and South
English NHS services using the 21 Cancer Wales Cardiff region.
Alliances, which are responsible for
coordinating cancer care and improving A list of the geographical regions and the NHS
patient outcomes for local populations organisations within them is provided in
(https://www.england.nhs.uk/cancer/cancer- Annex 3.
alliances-improving-care-locally/).
1.3 Other information produced by the Audit
Supplementary material from the report, This information can be found in the following
including tables containing individual trust places:
results, and further information about the AUGIS website:
Audit can be found on its website: http://www.augis.org/surgical-
www.NOGCA.org.uk. outcomes-2019/
MyNHS website:
The NOGCA website also contains: https://www.nhs.uk/Service-
Annual Reports from previous years Search/performance/search
Reports for the public and patients
Information on the performance of The results from the Audit are used by various
each NHS organisation other national health care organisations. In
Resources to support local quality particular, the Audit has worked with HQIP
improvement initiatives and the Care Quality Commission (CQC)
Links to other sources of information intelligence team to create a dashboard to
about OG cancer such as Cancer support their inspections.
Research UK
In addition to organisational-level outcomes,
the Audit publishes outcome information
about individual consultant surgeons
currently working at each organisation.
112. Management of HGD patients
Among patients with Barrett’s oesophagus (a To evaluate the care received by patients with
condition that affects the junction of the HGD, the Audit uses performance indicators
oesophagus and the stomach), the cells can identified in the British Society of
become increasingly abnormal, a condition Gastroenterology (BSG) guidance on the
called dysplasia. High grade dysplasia (HGD) is management of Barrett’s oesophagus
the most severe form of dysplasia and, if [BSG/Fitzgerald et al 2014] and NICE clinical
untreated, around 1 in 20 patients develop guidance on ablative therapy in the treatment
oesophageal cancer in the year after diagnosis of Barrett’s oesophagus [NICE 2010] (see Box
[Rastogi et al 2008]. 2.1).
Box 2.1. Recommendations from BSG guidelines on the management of HGD
Recommendation Indicator
All cases of suspected HGD should be confirmed by two % of patients whose diagnosis
gastrointestinal (GI) pathologists was confirmed by a second
Grading dysplasia involves a degree of subjectivity. Studies pathologist
have found that the rate of progression to cancer among
patients with dysplasia is higher when diagnosis is confirmed
by two pathologists.
All patients with HGD for whom therapy is considered should % of patients considered for
be discussed by a specialist multi-disciplinary team (MDT) for treatment who are discussed by
OG cancer specialist MDT for OG cancer
Discussion by the MDT ensures that the most appropriate
treatment options are considered for patients.
Endoscopic treatment of HGD (endoscopic mucosal % of patients who received
resection, radiofrequency ablation) is preferred over endoscopic treatment
oesophagectomy or surveillance
Compared to surgery, endoscopic treatment is associated
with lower morbidity and mortality. There is no evidence to
support the use of surveillance.
Endoscopic treatment should be performed in high-volume Number of patients with HGD
tertiary referral centres (minimum 15 endoscopic procedures receiving endoscopic treatment
per year for HGD or early cancer) at each NHS trust per year
Complication rates after endoscopic treatments have been
found to be higher among endoscopists with less experience.
122.1 Submission of data on HGD patients
The submission of data on HGD patients has years per million population for each Cancer
so far been limited to English NHS trusts. In Alliance (Table 2.1) given that the population
Wales, data collection has not been possible structure within each region is similar (Note:
via the CaNISC IT system. In this report, we North Central London and North East London
present data submitted to the Audit for Cancer Alliances are reported together as
patients diagnosed with HGD between April there were fewer than 10 HGD records
2013 and March 2019. Some indicators are submitted for North East London). The
reported for more recent years only to reflect number of HGD cases across the Alliances
current practice and availability of data items. typically falls between 10 and 40 per million,
although several Alliances have much lower
The number of HGD records submitted to the rates. The most likely explanation for these
Audit has decreased over time: 771 cases in low values is a comparatively worse case-
the two-year period 2013-15, 748 in 2015-17, ascertainment rate.
and 700 in 2017-19. There is unfortunately no
reliable way to identify patients with HGD in We encourage NHS trusts to address this
other national health care datasets to assess issue. The number of HGD patients within
case ascertainment [Chadwick et al 2017]. each area corresponds to 1-4 per month, and
Consequently, we present the estimated therefore the submission of these data does
incidence of HGD among people aged 40+ not represent a substantial burden.
Table 2.1: HGD cases submitted to the Audit per million population by English Cancer Alliance
HGD cases per million,
Adults aged
Cancer Alliance by year of diagnosis
40+ years
2013-2015 2015-17 2017-2019
Cheshire and Merseyside 1,389,031 37.4 37.4 19.4
East Midlands 1,570,650 50.9 38.8 33.7
East of England - North 3,475,008 16.1 18.7 26.5
East of England - South 1,488,820 29.6 20.2 21.5
Greater Manchester 1,441,967 16.6 9.0 16.6
Humber, Coast and Vale 958,930 14.6 12.5 15.6
Kent and Medway 990,126 11.1 14.1 3.0
Lancashire and South Cumbria 936,934 17.1 29.9 33.1
North Central / North East London 1,562,838 34.6 3.2 9.6
North West and South West London 1,097,679 24.6 23.7 23.7
Northern 1,634,735 52.6 48.9 50.2
Peninsula 1,037,742 30.8 28.9 10.6
Somerset, Wiltshire, Avon and Gloucester 1,333,184 21.8 37.5 46.5
South East London 870,132 26.4 69.0 57.5
South Yorkshire and Bassetlaw 1,178,359 24.6 22.1 25.5
Surrey and Sussex 1,192,789 10.9 14.3 4.2
Thames Valley 938,388 14.9 32.0 41.6
Wessex 1,460,613 51.3 45.2 24.6
West Midlands 2,615,051 15.7 18.7 17.6
West Yorkshire and Harrogate 1,217,768 23.0 18.9 14.0
13High grade dysplasia is more common among standard of care is being delivered to patients,
older individuals. For the period 2017-19, the and there has been some improvement
median age at diagnosis was 71 years (IQR 63 particularly for patients aged 80 years or
to 77) and 75% of the 700 patients were male. more. In the 2017-19 audit period:
Given the age profile, it is not surprising that 84% of patients were reported to
51% of patients had at least one significant have a Barrett’s segment.
comorbidity, of whom 49% of patients had a flat mucosa,
25% had cardiovascular disease 46% had a nodular lesion, and 5% had
11% had chronic obstructive a depressed lesion.
pulmonary disease, and The above characteristics are similar to those
10% had diabetes. reported in other studies.
The majority of diagnosed patients (59%) had 2.3 Treatment planning
been on a Barrett’s surveillance programme.
The remaining 41% were diagnosed after Between 2017 and 2019, 91% of newly
referral from a general practitioner. diagnosed HGD patients had a treatment plan
agreed at an upper gastrointestinal MDT
2.2 Diagnosis meeting, an increase from previous periods
(Table 2.2). This proportion was lower among
Table 2.2 shows the proportion of patients the surveillance group (78.8%), compared to
who had their original diagnosis confirmed by the active treatment group (94.1%).
a second pathologist. In general, this
Table 2.2: Proportion of patients whose original diagnosis was confirmed by a second pathologist
by age at diagnosis and year of diagnosis, and proportion of patients with treatment plan agreed
at MDT
Year of diagnosis
2013-15 2015-17 2017-19
Age of patient at diagnosis (years)
Under 60 years 90.6% 94.6% 89.8%
60-69 84.9% 88.5% 84.8%
70-79 85.3% 84.2% 87.8%
80 or over 76.4% 83.2% 84.0%
All patients 84.2% 86.7% 86.7%
Treatment plan agreed at MDT
Yes 86.8% 84.7% 91.3%
14Figure 2.1. Proportion of patients whose treatment plan was agreed at an MDT meeting for
patients diagnosed between April 2015 and March 2019, by Cancer Alliance of diagnosis
There was some variation across the Cancer and the results were unknown for 8
Alliances, with twelve regions reporting that patients
plans were agreed by the MDT for over 90% 5.3% of patients had another
of patients, while two Alliances reported that treatment (argon plasma coagulation,
only two thirds of their patients had plans photodynamic therapy, laser therapy,
agreed by the MDT (Figure 2.1). cryotherapy)
11.0% of patients had a plan of
2.4 Primary treatment modality surveillance alone
8.0% of patients had no treatment or
Endoscopic treatment is recommended as the surveillance planned.
first line treatment for HGD in preference to
either surgery or surveillance alone [BSG / Among patients who had a recorded reason
Fitzgerald 2014]. NHS services were generally for being placed on surveillance (58/152), 47%
performing in line with this recommendation, reported the reason as patient choice while
reporting primary treatments among patients 53% were unfit for active treatment. 84% of
diagnosed between 2015 and 2019 as follows: patients who had a plan for surveillance
73.8% of patients had a plan of alone, had their next planned surveillance
endoscopic therapy (almost all being endoscopy within 6 months of the first
either endoscopic resection (82.6%) endoscopic surveillance.
or radiofrequency ablation (17.4%))
2.0% of patients (n=28) had a plan of The choice of active treatment over
surgery (oesophagectomy). Pathology surveillance or no treatment was strongly
results from the resected tissue associated with age at diagnosis (Figure 2.2).
revealed 43% had HGD, 28% had There was also some variation in the choice of
oesophageal cancer (8/28 patients) treatment modality across Cancer Alliances
(Figure 2.3).
15Figure 2.2. Initial primary treatment by age at diagnosis for patients diagnosed between April
2015 and March 2019
Figure 2.3. Initial primary treatments for patients diagnosed between April 2015 and March 2019
(unadjusted proportions), by Cancer Alliance of diagnosis
West Yorkshire and Harrogate (n=28)
West Midlands (n=96)
Wessex (n=103)
Thames Valley (n=70)
Surrey and Sussex (n=23)
South Yorkshire and Bassetlaw (n=60)
South East London (n=123)
Somerset, Wiltshire, Avon and Gloucester (n=127)
Peninsula (n=41)
Northern (n=166)
North West and South West London (n=53)
North Central / North East London (n=23)
Lancashire and South Cumbria (n=59)
Kent and Medway (n=17)
Humber, Coast and Vale (n=27)
Greater Manchester (n=20)
East of England - South (n=63)
East of England - North (n=158)
East Midlands (n=114)
Cheshire and Merseyside (n=82)
0% 10% 20% 30% 40% 50% 60% 70% 80% 90% 100%
Active Treatment Surveillance No Treatment
16Among patients who underwent active It is possible that more NHS trusts are
treatment, 90.5% had their treatment plan meeting this recommended volume of
agreed at an MDT meeting. activity. The figures only include those
endoscopic procedures performed for
The BSG guidelines recommend that oesophageal HGD/early cancer and not those
endoscopic treatments are undertaken within procedures undertaken for gastric or
NHS trusts treating 15 or more patients each duodenal HGD/early cancer.
year. There were ten specialist OG cancer
centres that met this standard based on the There were 47 non-specialist hospitals that
data submitted for the 2017-19 period. reported performing endoscopic treatments
Among the 37 centres, there were 17 that for HGD patients between 2013 and 2019.
treated at least 15 patients in one or more However, only 12 of them had an annual
years from 2013. volume that met the “15 patients” standard.
2.5 Outcomes after Endoscopic Resection/Dissection
The Audit received information about 844 The proportion of patients referred
patients having endoscopic resections for the for additional EMR/ESD procedures
4-year period 2015-19. The outcome of these after incomplete excision has doubled
procedures was reported for 572 patients in comparison to the 2015-17 period.
(67%) and is summarised in Table 2.3.
There was some evidence that the complete
In the 2017-19 audit period, excision rate varied by the type of HGD lesion:
76% of resections resulted in a The complete excision rate was 66%
complete excision. for lesions of a nodular appearance
and 76% for flat / depressed lesions.
Table 2.3. Outcomes after endoscopic mucosal resection / endoscopic submucosal dissection for
patients diagnosed with HGD between April 2015 and March 2019
2015-17 2017-19
Procedures / outcome reported 423/354 421/224
Complete excision 65% 76%
Histology finding
HGD (or other finding) 74% 69%
Intramucosal carcinoma 23% 29%
Submucosal carcinoma 3% 2%
Plan after incomplete excision
Further EMR/ESD 24% 50%
Further ablative therapy 31% 13%
Refer for oesophagectomy 12% 15%
Surveillance 17% 15%
No further treatment 16% 6%
173. Participation in the OG cancer prospective audit
Patients were eligible for inclusion in the variation across the geographical regions, as
Audit if they were diagnosed with invasive shown in Figure 3.1. The estimated case
epithelial cancer of the oesophagus, gastro- ascertainment rates for each NHS trust / local
oesophageal junction (GOJ) or stomach (ICD10 health board are available in the online Data
codes C15 and C16), and were aged 18 years Tables, available at:
or over. Patients with neuro-endocrine www.nogca.org.uk/reports/2020-annual-
tumours or gastro-intestinal stromal tumours report/.
(GISTs) were not included in the Audit due to
the different behaviour and management of Estimates of case ascertainment in England
these tumours. were derived by comparing the number of
tumour records submitted to the Audit with
The 2020 Audit Report focuses on patients records of histologically confirmed epithelial
diagnosed with oesophago-gastric (OG) OG cancer in the National Cancer Registration
cancer in England and Wales over two years, and Analysis Service (NCRAS) dataset. For
between 1 April 2017 and 31 March 2019. patients diagnosed in Wales, the expected
Records were submitted for 20,528 patients, number of patients was estimated using the
including 19,171 diagnosed at 131 NHS trusts Patient Episode Database for Wales (PEDW)
in England and 1,357 diagnosed at 6 local database, identifying those patients with a
health boards in Wales. diagnosis code for OG cancer (ICD 10 codes
C15 or C16) recorded in the first episode. Case
3.1 Case ascertainment ascertainment estimates for Wales will be
slightly too low because it is not possible to
Case ascertainment for the period April 2017 identify and remove patients with non-
to March 2019 was estimated to be 90.1% in epithelial cancers in PEDW.
England and 85.2% in Wales, but there was
18Figure 3.1: Estimated case ascertainment by English and Welsh geographical regions, 2017-19
100%
90%
80%
70%
60%
50%
40%
30%
20%
10%
0%
Lancs & S Cumbria
Cheshire & Merseyside
SE London
Thames Valley
East Midlands
Wessex
Peninsula
Greater Manchester
East of England - North
Wales: North
Wales: South
NW & SW London
Humber, Coast & Vale
Northern
W Midlands
East of England - South
Kent & Medway
Somers, Wilts, Avon & Glou
W Yorkshire & Harrogate
S Yorkshire & Bassetlaw
Wales: Swansea Bay
North Central London
NE London
Surrey & Sussex
Case ascertainment National average
3.2 Completeness of submitted records
Table 3.1 shows data completeness for a organisation-level indicators. Outcome
selection of data items collected for patients indicators for curative surgery also rely on
diagnosed between April 2017 and March information in the pathology records. While
2019. While data completeness was generally pathology records were submitted for most
good, the table highlights a minority of patients who underwent surgery,
organisations that are not achieving the same completeness of pathological staging
standards as others. information was variable across centres. It is
important that surgical centres ensure they
The completeness of data items related to return all pathology and surgical records
surgical treatment is important because this associated with patients undergoing curative
information is used to produce consultant and surgery.
19Table 3.1: Summary of data completeness for selected data items for the 2017-19 audit period
Tumour data items Completeness overall No. of diagnosing NHS organisations
across 138 organisations with at least 80% completeness
Referral source 98% 133
Staging investigations 90% 110
Pre-treatment TNM stage 83% 100
Surgical data items Completeness overall No. of NHS surgical centres with at
across 39 surgical centres least 90% completeness
Nodal dissection 87% 26
Status at discharge 88% 28
Discharge date 94% 33
Pathological record 94% 30
Pathological TNM stage 85% 17
204. Patients with oesophago-gastric cancer
OG cancer predominantly affects older people proportion in the last five years, declining
and occurs more frequently in men than in from 26.9% in 2014/15 to 24.0% in 2018/19.
women, though there is some variation by
tumour type (Table 4.1).
Figure 4.1: Illustration of the main locations
of OG tumours
The incidence of oesophageal cancer,
particularly cancers located at the gastro-
oesophageal junction, has increased since the
early 1990s, though rates have levelled off Oesophagus
over the last decade. During the same period,
the incidence of stomach cancers has
decreased by more than 50% [Cancer Gastro-
Research UK, 2020a]. This shift reflects oesophageal
changes in the prevalence of risk factors, junction
notably reductions in H. pylori infections
leading to fewer cases of stomach cancer
[Cancer Research UK, 2020b].
This long term change in the relative Stomach
distribution of oesophageal and stomach
cancer can be seen within the Audit, with
gastric tumours accounting for a smaller
Table 4.1: Summary of patient characteristics by type of OG tumour in England and Wales for the
audit period 2017-19
Oes SCC Oes ACA Oes ACA Lower Stomach Total
Upper/Mid (w SI,SII) (w SIII)
Male (%) 49% 70% 81% 66% 70%
Median age (yrs) 71 74 71 74 72
Age groupThe distribution of clinical (pre-treatment)
disease stage is shown below in Table 4.2. It There have been a number of initiatives in
highlights the challenge for clinicians in recent years to promote early diagnosis, most
managing OG cancer, with over one third of notably the national “Be Clear on Cancer”
patients being diagnosed with stage 4 campaign in 2015, which aimed to raise
(metastatic) disease. This may be an awareness of the risk factors and early
underestimate because 17% of patients did symptoms of OG cancer [Cancer Research UK
not have complete clinical stage information 2019c]. However, among Audit patients there
and there is likely to be a higher proportion of has not been a noticeable change in the
patients with metastatic disease in this group proportion of patients diagnosed with early
because patients who will receive only stage cancer in the five years from April 2014.
palliative or best supportive care are less
likely to undergo staging investigations.
Table 4.2: Pattern of clinical stage by type of OG tumour in England and Wales for the audit period
2017-19
Clinical Stage Oes SCC Oes ACA Oes ACA Lower Stomach
(pre-treatment) Upper/Mid (w SI,SII) (w SIII) Total
Stage 0/1 8% 9% 9% 12% 9%
Stage 2 21% 12% 13% 21% 17%
Stage 3 41% 35% 39% 23% 35%
Stage 4 30% 44% 39% 44% 39%
Total 3,796 1,527 9,233 5,972 20,528
Missing 614 317 1,362 1,272 3,565
KEY: Oes – oesophageal, SCC – squamous cell carcinoma, ACA – adenocarcinoma, SI, SII, SIII - Siewert
classification of the gastro-oesophageal junction (GOJ) [Siewert et al 1996]. See glossary for details.
225. Routes to diagnosis
There are several routes that can lead to a admission was almost double the figure for
diagnosis of OG cancer. Typically, an patients with oesophageal cancer. The risk
individual presents to their general was also strongly associated with age, with
practitioner (GP) with symptoms that may the highest proportions of emergency
indicate cancer. Guidelines recommend that diagnoses among those aged over 80 years.
GPs refer patients with suspected OG cancer Patients from socially deprived areas and
as early as possible [NICE 2018; Allum et al those with comorbid conditions were also
2011]. In other cases, diagnosis may occur more likely to be diagnosed after an
following a referral by a hospital consultant, emergency admission.
from a non-emergency setting or as a result of
a surveillance endoscopy. Diagnosis can also As in previous years, there was regional
follow an emergency admission to hospital, variation in the proportion of emergency
with acute symptoms that are often the result diagnoses (Figure 5.1), even after adjusting for
of late stage disease. Late stage disease is patient characteristics such as the site of
associated with poorer outcomes, therefore cancer, presence of comorbidities and
services should aim to reduce the proportion sociodemographic characteristics. Notably,
of diagnoses made after an emergency the rates of emergency diagnosis in Wales
admission. continue to be higher than in England. This
regional variation may be due to unmeasured
Table 5.1 summarises the routes to diagnosis patient factors, but it is also possible that it
for the 2017-2019 Audit cohort. The majority reflects regional differences in how people
of patients were diagnosed following referral respond to their symptoms and seek help
by their GP, typically on either the “two-week from health services, as well as differences in
wait” suspected cancer pathway or (in Wales) how patients are managed and referred
an urgent referral. within general practice. There may also be
differences in the way emergency referral
The proportion of patients with stomach routes are recorded, which are being
cancer diagnosed after an emergency reviewed by information specialists in Wales.
Table 5.1: Routes to diagnosis among OG cancer patients diagnosed between April 2017 and
March 2019 in England and Wales
Route to diagnosis Oes SCC Oes ACA Oes ACA Lower Stomach Total
Upper/Mid (w SI,SII) (w SIII)
GP referral 69% 67% 67% 55% 64%
Urgent / 2 week wait 64% 62% 62% 49% 59%
Routine 5% 5% 5% 6% 5%
Emergency admission 10% 12% 11% 19% 13%
Other 21% 22% 22% 26% 23%
Total cases 3,796 1,527 9,233 5,972 20,528
Missing values 47 34 154 137 372
KEY: Oes – oesophageal, SCC – squamous cell carcinoma, ACA – adenocarcinoma, SI, SII, SIII - Siewert
classification of the gastro-oesophageal junction (GOJ).
23% patients diagnosed after emergency admission
0%
5%
10%
15%
20%
25%
30%
35%
Cheshire & Merseyside
national average.
W Midlands
SE London
Kent & Medway
Surrey & Sussex
Thames Valley
Peninsula
Somers, Wilts, Avon & Glou
Wessex
Lancs & S Cumbria
Greater Manchester
24
NW & SW London
East of England - North
East of England - South
East Midlands
S Yorkshire & Bassetlaw
Humber, Coast & Vale
North Central London
NE London
Northern
W Yorkshire & Harrogate
Wales: Swansea Bay
Wales: North
Wales: South
Welsh region. Graph shows adjusted rates with 95% confidence interval (CI). Blue line shows
Figure 5.1: Proportion of patients diagnosed after an emergency admission by Cancer Alliance /6. Staging investigations
Following a diagnosis of OG cancer, patients 86.9%. However, this overall figure is likely to
should undergo appropriate staging underestimate the true proportion as the
investigations to identify the extent of the quality of the data on staging investigations
disease and determine if it is potentially submitted to the Audit varied across NHS
amenable to curative therapy. Clinical organisations (Chapter 3.2), with some
guidelines recommend that: reporting a high proportion of patients
All patients diagnosed with OG cancer undergoing no investigations. Using data
should have an initial CT scan to from NHS organisations that reported staging
assess the spread of disease and look investigations for at least 80% of patients, the
for evidence of metastatic disease estimated proportion was 94.9%.
If the cancer is localised and the
patient is suitable for curative The proportion of patients who underwent a
treatment, further investigations are CT scan by NHS trust / local health board is
performed to determine the stage of available in the online Data Tables:
the cancer (see Box 6.1) www.nogca.org.uk/reports/2020-annual-
report/.
The overall proportion of patients who had CT
scans in the 2017-2019 audit cohort was
Box 6.1: Recommended staging investigations for oesophageal and gastric cancer [NICE 2018]
- CT scan of chest, abdomen and pelvis to provide an initial local assessment, and look for
evidence of nodal and metastatic spread
- Offer a PET-CT scan to people with oesophageal and gastro-oesophageal junctional
tumours that are suitable for curative treatment (except for T1a tumours).
- Do not offer endoscopic ultrasound only to distinguish between T2 and T3 tumours in
people with oesophageal and gastro-oesophageal junctional tumours.
- Only offer endoscopic ultrasound (EUS) to people with oesophageal and gastro-
oesophageal junctional cancer when it will help guide ongoing management.
- Offer staging laparoscopy to all people with potentially curable gastric cancer.
- Only consider a PET-CT scan in people with gastric cancer if metastatic disease is
suspected and it will help guide ongoing management.
25If a CT scan indicates there is no metastatic treatment plan, 64.6% were recorded to have
disease and the patient is considered PET-CT. This figure increased to 71.3% for
sufficiently fit to be a candidate for curative organisations that reported staging
treatment, they will undergo further staging investigations for at least 80% of patients,
investigations. The current NICE guidance although there was variation between regions
recommends that PET-CT scans should be (Figure 6.1). Use of endoscopic ultrasound
offered to people with oesophageal tumours was reported for 39.0% of these patients.
that are suitable for curative treatment, while
endoscopic ultrasound should only be offered Among patients with stomach cancer, staging
if it helps guide ongoing management (see laparoscopy was reported for 44.6% of
Box 6.1). Staging laparoscopy should be patients who had a curative treatment plan,
offered to all people with potentially curable while 30.5% had a PET-CT. The evidence on
stomach cancer. the benefit of PET-CT for patients with
stomach cancer is still evolving and recent
The figures from the 2017-19 audit period studies suggest it might identify metastases
show that practice is broadly consistent with missed by other forms of staging investigation
NICE recommendations. Among patients with in patients being consider for curative
oesophageal cancer who had a curative treatment [Bosch et al 2020].
Figure 6.1: Use of PET-CT scans among patients with oesophageal cancer who had curative
treatment diagnosed between April 2017 and March 2019, by Cancer Alliance / Welsh region
100%
90%
% patients having PET-CT scan
80%
70%
60%
50%
40%
30%
20%
10%
0%
Thames Valley
Lancs & S Cumbria
East Midlands
Cheshire & Merseyside
SE London
Peninsula
Wessex
Northern
Wales: North
Wales: South
Greater Manchester
East of England - North
NW & SW London
Humber, Coast & Vale
Wales: Swansea Bay
W Midlands
East of England - South
NE London
Kent & Medway
Somers, Wilts, Avon & Glou
W Yorkshire & Harrogate
Surrey & Sussex
S Yorkshire & Bassetlaw
North Central London
267. Treatment planning
Treatment options for people diagnosed with 7.1 Clinical stage
OG cancer depend on several factors,
including the extent of the disease, Data on clinical stage provide essential
performance status (patient’s level of function information to allow interpretation of
in terms of self-care and daily activities), treatment decisions, although staging can be
comorbidities, nutritional status and patient complex due to the need for clinical
preferences. For patients with localised interpretation of multiple staging
disease who are relatively fit, the investigations. Curative treatment options
recommended treatment is generally surgery, require a patient’s cancer to be localised
with or without oncological therapy (see Box (stage 1-3), while options for patients with
7.1). For patients with squamous cell metastatic disease (stage 4) are limited to
carcinoma of the oesophagus, definitive therapies that might extend life or control
chemoradiotherapy is also an option. symptoms but are unlikely to result in
Endoscopic treatment may be suitable for remission.
patients whose tumours are limited to the
mucosa, with little risk of spread to the lymph The completeness of the data on clinical stage
nodes. supplied by NHS organisations during the
2017-19 audit period is shown in Figure 7.1.
For patients with metastatic disease or those Overall, 82.6% of records had clinical stage
who are not sufficiently fit for surgery, there information, but the proportion varied across
are a number of treatment options. Palliative the regions, ranging from just 65% to over
chemotherapy can improve survival and is 97%. Clinical stage information was more
suitable for patients with a reasonable level of likely to be missing among older patients
fitness. Therapies for managing symptoms (Figure 7.2), and among patients with a record
such as dysphagia include endoscopic or of non-curative treatment intent: 80.3% of
radiological interventions (e.g. stents) and patients with non-curative treatment plans
radiotherapy. had clinical stage information, compared to
86.4% of patients with curative plans.
Box 7.1: Recommended curative treatment options for OG cancer [NICE 2018]
Oesophageal squamous cell carcinomas:
- Definitive chemoradiation for proximal oesophageal tumours.
- For tumours of the middle or lower oesophagus, either chemoradiotherapy alone or
combined with surgery.
Oesophageal adenocarcinoma and GOJ tumours:
- Preoperative chemotherapy or chemoradiation is recommended to improve long term
survival after surgery, compared to surgery alone.
- Peri-operative chemotherapy (pre and post-operative) can also be recommended as it
increases survival for junctional tumours.
Gastric cancer:
- Peri-operative chemotherapy is recommended to improve survival compared to surgery
alone.
- In patients at high risk of recurrence who have not had neoadjuvant chemotherapy,
adjuvant chemoradiotherapy may be considered as it has been shown to improve survival
in non-Western populations.
27Figure 7.1: Clinical stage information for the audit period 2017-19, by geographical region
Stage 0-3 Stage 4 Missing
100%
90%
% Patients with clinical stage
80%
70%
60%
50%
40%
30%
20%
10%
0%
SE London
Thames Valley
Lancs & S Cumbria
East Midlands
Cheshire & Merseyside
Peninsula
East of England - North
Wales: North
Wessex
NW & SW London
Northern
Humber, Coast & Vale
Wales: South
W Midlands
Greater Manchester
East of England - South
Wales: sWansea Bay
Kent & Medway
Somers, Wilts, Avon & Glou
W Yorkshire & Harrogate
Surrey & Sussex
S Yorkshire & Bassetlaw
North Central London
NE London
Figure 7.2: Clinical stage by type of OG tumour and age group, for the audit period 2017-19 in
England and Wales
Stage 0-3 Stage 4 Missing
100%
90%
% Patients with each clinical stage
80%
70%
60%
50%
40%
30%
20%
10%
0%7.2 Treatment plans
Overall, 38.5% of patients diagnosed in the patients. Multimodal therapy that combines
2017-19 audit period had a plan for treatment either chemotherapy or chemoradiotherapy
with curative intent, with some variation by with surgery was the dominant treatment
tumour type (Table 7.1). This proportion has among patients with a tumour in the lower
shown a small increase over the last five audit oesophagus or stomach, except among the
years, from 37.7% among patients diagnosed oldest patients for whom surgery only was the
in 2014/15 to 40.0% among those diagnosed
most common treatment.
in 2018/19.
For patients with a non-curative treatment
Among patients with early stage disease
plan, oncological therapy (chemotherapy or
(stage 0-3), 60% had a curative treatment
plan. However, there was substantial radiotherapy) was the planned therapy for
variation by age, with curative treatment 56% of patients during the 2017-19 audit
being much less common among the oldest period. Another 18% of patients had either
patients (Table 7.2). surgery or endoscopic / radiological palliative
therapies, while the remaining 26% had a plan
Planned modes of curative treatment varied for best supportive care. These overall figures
by tumour type (Figure 7.3). Consistent with mask large variation between patient groups,
recommendations for patients with squamous with active treatment plans being far less
cell carcinomas (SCC), definitive common for patients aged 80 years or over
chemoradiotherapy was the most common (Figure 7.4).
planned treatment, particularly among older
Table 7.1: Proportion of patients with curative treatment plans during the audit period 2017-19
Treatment plan Oes SCC Oes ACA Oes ACA Lower Stomach Total
Upper/Mid (w SI,SII) (w SIII)
Total patients 3,796 1,527 9,233 5,972 20,528
Curative intent 40.4% 32.0% 41.8% 33.9% 38.5%
By clinical stage
0/1 72.9% 69.0% 78.9% 64.6% 72.3%
2 62.8% 56.4% 64.2% 61.4% 62.5%
3 48.6% 44.9% 61.6% 50.6% 55.4%
4 10.9% 10.4% 12.5% 4.1% 9.5%
(missing data) 614 317 1,362 1,272 3,565
KEY: Oes – oesophageal, SCC – squamous cell carcinoma, ACA – adenocarcinoma, SI, SII, SIII - Siewert
classification of the gastro-oesophageal junction (GOJ) [Siewert et al 1996]. See glossary for details.
29You can also read