Assessment of tiered restrictions and a second lockdown on COVID-19 deaths and hospitalisations in England: a modelling study
←
→
Page content transcription
If your browser does not render page correctly, please read the page content below
Assessment of tiered restrictions and a second lockdown on
COVID-19 deaths and hospitalisations in England: a modelling
study

Nicholas G. Davies DPhil*1, Rosanna C. Barnard PhD1, Christopher I. Jarvis PhD1, Timothy
W. Russell PhD1, CMMID COVID-19 working group†1, ISARIC4C Investigators††, Prof
Malcolm G. Semple PhD2,3, Prof Mark Jit PhD1, Prof W. John Edmunds PhD1

1
 Department of Infectious Disease Epidemiology, London School of Hygiene & Tropical
Medicine, Keppel Street, London, WC1E 7HT, UK
2
 NIHR Health Protection Research Unit, Institute of Infection, Veterinary and Ecological
Sciences, Faculty of Health and Life Sciences, University of Liverpool, Liverpool, UK
3
 Respiratory Medicine, Alder Hey Children’s Hospital, Institute in The Park, University of
Liverpool, Alder Hey Children’s Hospital, Liverpool L12 2AP, UK

* Correspondence: nicholas.davies@lshtm.ac.uk
† ††
 , See end material for working group authors
Abstract

Background
A second wave of COVID-19 cases in Autumn 2020 led to localised, tiered “Alert Level”
restrictions and subsequently a second national lockdown in England. We examine the impact
of these tiered restrictions and alternatives for lockdown stringency, timing and duration.

Methods
We fit an age-structured mathematical model of SARS-CoV-2 transmission to hospital
admissions and occupancy (ISARIC4C/CO-CIN, NHS England), seroprevalence (ONS, UK
Biobank, REACT-2 study), virology (REACT-1 study) and death data (Public Health England)
across seven NHS England regions from 1 March – 13 October 2020. We analyse mobility
(Google Community Mobility) and social contact (CoMix study) data to estimate the effect of
tiered restrictions in England, and of lockdowns implemented in Northern Ireland and Wales
in October 2020, and project epidemiological scenarios for England to 31 March 2021.

Findings
We estimated a reduction in the effective reproduction number Rt of 2% (95% confidence
interval: 0–4%) for tier 2, 10% (6–14%) for tier 3, 35% (30–41%) for a Northern Ireland-
stringency lockdown and 44% (37–49%) for a Wales-stringency lockdown. From 1 October
2020 to 31 March 2021, a projected COVID-19 epidemic without tiered restrictions or lockdown
results in 280,000 (274,000–287,000) hospital admissions and 58,500 (55,800–61,100)
deaths. Tiered restrictions reduce burdens to 238,000 (231,000–245,000) hospital admissions
and 48,600 (46,400–50,700) deaths. From 5 November 2020, a four-week Wales-type
lockdown with schools open—similar to lockdown measures announced in England—was
projected to further reduce the burden to 186,000 (179,000–193,000) hospital admissions and
36,800 (34,900–38,800) deaths. Closing schools further reduces deaths to 30,300 (29,000 -
31,900). A projected lockdown of greater than 4 weeks reduces deaths, but brings diminishing
returns in reducing peak pressure on hospital services. An earlier lockdown reduces deaths
and hospitalisations in the short term, but leads to a faster resurgence in cases after January
2021.

Interpretation
Lockdown measures outperform less stringent restrictions in reducing cumulative deaths. The
policy adopted in England reduces pressure on the health service, is well-timed to suppress
deaths over the winter period, and keeps schools open. Following completion of the analysis,
we analysed new data from November 2020, and found that despite similarities in policy, the
second lockdown in England had a smaller impact on behaviour than the second lockdown in
Wales.

 2
Research in Context

Evidence before this study
Numerous studies have modelled the relative effect on SARS-CoV-2 transmission of non-
pharmaceutical interventions. We searched PubMed, BioRxiv, and MedRxiv for English-
language articles with the search terms (“COVID-19” OR “SARS-CoV-2” OR “coronavirus”)
AND (“lockdown”) AND (“model”) on 9 November 2020. This search returned a total of 676
results, of which 23 were modelling studies that were fitted to data and examined a second
round of physical distancing restrictions, such as lockdowns or tiered restrictions. Most of the
relevant studies used a model to assess the impact of lockdowns, often on a national scale
and occasionally regionally. The two most similar studies considered tiered responses in
China and “circuit breakers” in the UK. However, typically the length and/or stringency of the
lockdown considered was not varied.

Added value of this study
This study builds upon the existing literature in a number of ways. First, mobility measures
and contact survey data are used to estimate behavioural responses following the introduction
of tiered restrictions in England and the “firebreak” and “circuit breaker” lockdowns in Wales
and Northern Ireland, respectively. Second, the model is fitted to multiple data sources to
reconstruct the dynamics of the SARS-CoV-2 outbreak in England from February until October
2020. Finally, policies for managing a second wave of COVID-19 cases are contrasted.
Comparisons are made between a baseline scenario (i.e. a counterfactual scenario with no
tiered restrictions and no lockdown), implementation of tiered restrictions only, and additional
implementation of different-stringency lockdowns in England, with and without schools open.
The effect on cumulative deaths, pressure on health services and time spent under restrictions
is explored in relation to the type of intervention implemented and the duration and timing of
lockdown interventions. Regional responses to different types, timings and durations of
interventions are also explored.

Implications of all the available evidence
Without the additional public health interventions adopted, the second wave is projected to be
more severe than the first wave. The tiered restrictions introduced in October 2020 (in
particular Tier 3) were likely to have had some effect in slowing transmission, but the addition
of a temporary lockdown provides the strongest effect in reducing deaths and health service
burden. Earlier lockdowns save lives in the short-term but because substantial susceptibility
remains in the population they may result in larger resurgences later in time, requiring the
introduction of further non pharmaceutical interventions.

 3
Introduction

The UK saw a first wave of COVID-19 cases in spring 2020. Following the imposition of a
national lockdown on 23 March 2020, with residents required to stay at home except for
accessing medical care, daily exercise, shopping for essentials and essential work travel,
COVID-19 cases, hospitalisations and deaths subsided. A resurgence of COVID-19 cases
began in the late summer after most restrictions were lifted. By the end of October, large-scale
population-based studies in England suggested there were about 50-100,000 new infections
occurring every day1,2. This resulted in pressure on health services, with a total of 8,822
confirmed COVID-19 cases in English hospitals on 30 October 20203 – about half of that
observed during the previous peak in April 2020 – and increasing numbers of deaths.
Evidence of substantial geographical heterogeneity began to emerge across England, with a
national infection survey suggesting that in late October around 1 in 45 people were infected
in the North West, compared to 1 in 200 in the South East2.

On 12 October 2020, the UK government announced a programme of regionally-differentiated
physical distancing measures using a three-tiered approach, known as “Alert Levels”4. By
default, regions were placed into Tier 1, the least restrictive tier, but could be moved into Tier
2 or 3 if incidence increased. Regions in Tier 1 had a 10pm curfew for hospitality venues and
restrictions on the number of individuals who could meet (“the rule of six”). Tier 2 imposed
additional restrictions on individuals from different households mixing and advised residents
to avoid making unnecessary journeys. Regions in Tier 3 had additional closures of hospitality
and leisure venues such as pubs and restaurants. In the weeks following the announcement,
the UK government placed several local authority districts—particularly in the north of
England— into the highest restriction category, Tier 3. Despite these measures, incidence
continued to rise in all regions of England1,2. Consequently, on 31 October 2020, a new four-
week national lockdown for England was announced, beginning on 5 November 2020. These
restrictions were broadly similar to the initial spring lockdown, but allowed schools and
universities to remain open. It remains unclear how effective the tiered restrictions were in
reducing transmission and what additional reduction in transmission may be accomplished by
the second lockdown.

The other UK nations experienced similar resurgences in September 2020 and, in response
to this, both Northern Ireland and Wales implemented time-limited lockdowns in mid-October
2020. These differed in their stringency, with the “firebreak” measures in Wales being more
comprehensive than the “circuit breaker” measures in Northern Ireland. Both lockdowns were
timed to coincide with the school half-term vacation period. Here, we analyse mobility and
contact survey data to estimate the impact of tiered restrictions and of the lockdowns in
Northern Ireland and Wales. We combine this with a mathematical model fitted to multiple
detailed data sources to estimate the impact of tiered restrictions and explore alternative
scenarios regarding the timing, duration, and stringency of extended physical distancing
measures on hospitalisations and deaths due to COVID-19.

 4
Methods

Epidemiological model and fitting

We used a previously-published dynamic compartmental model of SARS-CoV-2
transmission5,6 stratified into 5-year age bands, and fitted using Markov chain Monte Carlo
(MCMC) methods to reported data across 7 NHS England regions on hospital admissions,
hospital and intensive care unit (ICU) bed occupancy, seroprevalence, PCR positivity, and
deaths within 28 days of an individual’s first positive SARS-CoV-2 test, which is used as the
primary measure of COVID-19 mortality in the United Kingdom7. Hospital admissions and
occupancy data were provided by NHS England and deaths data were provided by Public
Health England. These data sources are unpublished and not public, but are closely aligned
with the UK Government COVID-19 Dashboard3. Seroprevalence data were obtained from the
Office for National Statistics COVID-19 Infection Survey (ONS-CIS)2, UK Biobank8, and the
REACT-2 study1, and PCR positivity data were obtained from the REACT-1 study1.

The age-specific probability of ICU admission given hospital admission, as well as the
distribution of lengths of stay in hospital and in ICU, were estimated using individual patient
data in the COVID-19 Clinician Information Network (CO-CIN) collected from an ongoing study
of COVID-19 patients in the United Kingdom9. Model-fitted distributions for the delays from
infection to death, infection to hospitalization, and infection to ICU admission were also
informed by CO-CIN data. The relative age-specific infection fatality risk (IFR) was adopted
from a global meta-analysis10, and the relative age-specific infection hospitalisation risk (IHR)
was adopted from a study of the COVID-19 epidemic in France11; given these relative age-
specific rates, the overall IFR, IHR and probability of ICU admission given hospitalisation were
inferred for each NHS England region during model fitting. The age-specific fatality risk among
hospitalised patients decreased substantially over time in CO-CIN data9, so we estimated this
relative decrease during model fitting, assuming no further change in the IFR from September
2020 onwards. A full description of fitted and non-fitted parameters is provided in the
Appendix, pp. 5–7.

Transmission rates and mobility indices

Because some of the most reliable indicators of infection—hospitalisations and deaths—lag
substantially behind transmission rates, it is challenging to estimate the impact of policy and
behavioural changes on SARS-CoV-2 transmission in real time. We measured the relationship
between anonymised mobility data collected from smartphone users by Google Community
Mobility12 and fine-grained social contact survey data from the CoMix study13, which has been
collecting data on UK residents’ daily interpersonal contacts since late March 2020. This
allowed us to use indirect but rapidly-available mobility data to predict changes in transmission
resulting from behavioural and policy changes over time. We used this approach both in fitting
the model to policy changes over the first wave of the COVID-19 epidemic in England, and in
estimating the impact of tiered restrictions in England and of lockdown interventions in
Northern Ireland and Wales (Appendix, pp. 1-5).

Intervention scenarios

 5
During Northern Ireland’s “circuit breaker” lockdown, non-essential retail remained open and
household bubbles of up to 10 people from two households were allowed to mix, whereas in
Wales’ “firebreak” lockdown, non-essential retail was closed and residents were advised to
stay at home and were prohibited from mixing with individuals from outside their households.
We therefore constructed a Northern Ireland-stringency and a Wales-stringency lockdown
scenario, both with and without school closures (modelled as a reduction in transmission
primarily in younger age groups), by applying the measured reduction in mobility in Northern
Ireland and in Wales to England. We also varied the duration and timing of lockdown
interventions. Given that the UK Government subsequently opted for a four-week lockdown in
England from 5th November 2020, similar to the Welsh lockdown scenario without school
closures, we focus on this scenario for our assessment of the impact of a second lockdown in
England, examining other possibilities as scenario analyses. By default, we assume that
recovery from SARS-CoV-2 infection confers lifelong immunity to reinfection, but we also
explore a scenario with waning natural protection. Additionally, by default we assume that -
except for changes imposed by restrictions - contact rates remain constant after the imposition
of tiered restrictions on 14 October 2020; we also explore a scenario in which seasonal
increases in contact patterns result in an increase in transmission over the winter period
(Appendix, p. 6).

Statement on data availability

All analysis code and data are available at https://github.com/nicholasdavies/covid-tiers. The
original report submitted to policymakers on 31 October 2020 has been archived at
https://cmmid.github.io/topics/covid19/uk-tiers-2nd-lockdown.html.

Funding statement

This project has received funding from the European Union's Horizon 2020 research and
innovation programme project EpiPose (101003688: MJ, RCB, WJE) and the UK Medical
Research Council [MRC] (MC_PC_19065: NGD, WJE). It was also partly funded by: the Bill
& Melinda Gates Foundation (INV-003174 and INV-016832: MJ, OPP1209135: ISARIC4C);
the EU Platform for European Preparedness Against (Re-)emerging Epidemics (PREPARE;
FP7 project 602525: ISARIC4C); the Global Challenges Research Fund project RECAP
managed through RCUK and ESRC (ES/P010873/1: CIJ); the Liverpool Experimental Cancer
Medicine Centre (C18616/A25153: ISARIC4C); the MRC (MC_PC_19059: CO-CIN); the
National Institute for Health Research [NIHR] (PR-OD-1017-20002: WJE; CO-CIN-01:
ISARIC4C); the NIHR Biomedical Research Centre at Imperial College London [ICL] (IS-BRC-
1215-20013: ISARIC4C); the NIHR Health Protection Research Unit [HPRU] in Emerging and
Zoonotic Infections at University of Liverpool in partnership with Public Health England [PHE],
in collaboration with Liverpool School of Tropical Medicine and the University of Oxford
(200907: MGS); the NIHR HPRU in Immunisation (NIHR200929: NGD, MJ); the NIHR HPRU
in Modelling and Health Economics (NIHR200908: MJ, WJE); the NIHR HPRU in Respiratory
Infections at ICL with PHE (award 200927: ISARIC4C); the Wellcome Trust [WT]
(206250/Z/17/Z: TWR); and the WT and Department for International Development
(215091/Z/18/Z: ISARIC4C). The NIHR Clinical Research Network provided infrastructure
support to ISARIC4C for this research.

 6
The views expressed are those of the authors and not necessarily those of the Department of
Health and Social Care, DID, NIHR, MRC, WT, PHE, or any funders.

See Appendix, pp. 35–37 for working group authors and acknowledgments.

Ethics

Ethical approval for data collection and analysis by ISARIC4C was given by the South Central-
Oxford C Research Ethics Committee in England (reference 13/SC/0149), and by the Scotland
A Research Ethics Committee (reference 20/SS/0028). The ISARIC WHO CCP-UK study was
registered at https://www.isrctn.com/ISRCTN66726260 and designated an Urgent Public
Health Research Study by NIHR.

Role of the funding source

The funders and sponsors of the study had no role in study design, data collection, data
analysis, data interpretation, or writing of the report. The corresponding author had full access
to all the data in the study and had final responsibility for the decision to submit for publication.

 7
Results

Our fitted model captures the observed dynamics of community transmission of SARS-CoV-2
during the first and second waves from mid-February to 13 October 2020 (Fig. 1; Appendix,
pp. 16–18), reproducing region-specific observed infections, seropositivity, deaths,
hospitalisations, and ICU and hospital bed occupancy. In addition, the model was capable of
accurately forecasting the changes in deaths, hospital admissions, and hospital beds occupied
during the autumn period, though it overestimated ICU occupancy due to a sharp decline in
the proportion of hospital patients admitted to ICU after mid-September 2020 (Appendix, pp.
12–16).

Under our base-case assumption of no waning immunity and no seasonal increase in
contacts, and without the imposition of tiered restrictions or of any further intervention, the
model suggests that hospital admissions would peak in the North West around mid-November
2020, with other regions peaking somewhat later over the winter period (Appendix, p. 22). By
the end of such an epidemic around 35-45% of the population in each region might be
expected to have been infected (Appendix, p. 34). In this baseline scenario, the epidemic is
projected to result in 280,000 (95% CI: 274,000–287,000) hospital admissions and 58,500
(55,800–61,100) deaths, with a peak ICU occupancy of 5,000 (4,840–5,170) beds (Table 1)
from 1 October 2020 to 31 March 2021. This compares with our fitted model estimates for the
first wave of 127,000 (125,000–128,000) hospital admissions, 36,900 (36,200–37,500)
deaths, and a peak ICU occupancy of 3,090 (3,020–3,130) beds up to the end of September
2020. That is, the expected scale of the second wave, without any interventions, is larger than
the first on all three of these key metrics. Crucially, this “baseline” scenario for the second
wave is not equivalent to a completely unmitigated epidemic, as social contacts have not
returned to their pre-pandemic rates in England (Appendix, pp. 1–2), and the incidence is also
blunted by immunity acquired during the first wave. There are, however, expected to be
considerable differences between regions in the epidemic burden, with the greatest number
of admissions and deaths projected for the Midlands, North East and Yorkshire, and North
West regions (Appendix, p. 28).

Our analysis of mobility indicators suggests that Tier 3 restrictions are associated with a
substantially greater reduction in mobility than Tier 2 restrictions. In turn, both lockdowns are
associated with a greater reduction in mobility than Tier 3, with the “firebreak” in Wales having
a substantially greater effect than the “circuit breaker” in Northern Ireland (Appendix, pp. 2–
5). In turn, these reductions in mobility are estimated to reduce the effective reproduction
number Rt by 2% (0–4%) for Tier 2, 10% (6–14%) for Tier 3, 35% (30–41%) for a Northern
Ireland-stringency lockdown and 44% (37–49%) for a Wales-stringency lockdown, both of the
latter with schools closed (Table 2). When we introduce tiered restrictions into our model on
14 October 2020, the projected burden of COVID-19 from 1 October 2020 to 31 March 2021
decreases to 238,000 (231,000–245,000) admissions, 48,600 (46,400–50,700) deaths, and a
peak ICU occupancy of 3,900 (3,800–4,010) beds (Table 1).

The model projects a reduction in transmission across all NHS England regions following the
introduction of a four-week Wales-type lockdown (Fig. 2), with the closure of schools resulting
in additional reductions in transmission. The effective reproduction number Rt is suppressed
to below one during lockdown periods. In most regions, following the lockdown period, Rt

 8
initially increases above 1 before reducing over time. This rebound occurs because there is
insufficient immunity in the population, and so as restrictions are eased, transmission
increases. In contrast, in the most heavily affected regions (i.e. the North West) the easing of
lockdown is not expected to result in a bounce-back of infections as accumulated population
immunity retains Rt
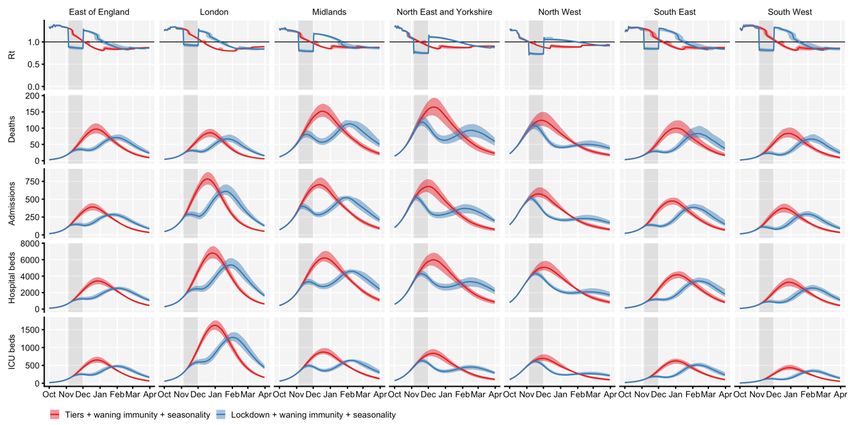
demand for hospital beds and deaths by about 20%, waning immunity by about 25% and both
waning immunity and seasonality by about 50%. Increasing transmission over the winter
period, as a result of either or both of these factors, diminishes the impact of the temporary
lockdown, both in absolute and relative terms. For instance, under the baseline scenario the
four-week November lockdown is expected to reduce hospitalisations by about 52,000
between October 2020 and March 2021, a 21% reduction. However, if both waning immunity
and seasonality occurs, introducing the same temporary lockdown would only be expected to
reduce hospitalisations by about 31,000 over the same time period (a 9% reduction), as the
rebound in infections after the lockdown is more rapid under this scenario (Appendix, pp. 25–
27).

These analyses were originally conducted during late October and early November 2020,
when the decisions over lockdown in England were being made. At the end of November, we
assessed the actual impact of the English lockdown on observed mobility and used these
estimates to update our projections. The English lockdown had an effect on mobility that was
intermediate between the Welsh and Northern Irish lockdowns (Appendix, p. 5). Qualitatively,
the projected impact of the four-week English lockdown on estimated cumulative deaths over
the winter period, hospital pressure and time spent under different restrictions are similar to
our base-case analysis, but the lower impact of the lockdown on behaviour means that the
distinction between alternative policies in terms of timing and duration is less marked
(Appendix, p. 7).

Discussion

Without additional restrictions, the second wave of COVID-19 in England is projected to be
more severe than the first wave in terms of hospitalisations and deaths. Tiered restrictions,
and in particular the most stringent Tier 3, has likely helped to slow transmission, though these
restrictions have a much lesser effect on reducing hospitalisations and deaths compared to
lockdown scenarios. We projected that a lockdown intervention will likely have a strong but
temporary effect, reducing the effective reproduction number to well below one during the four-
week lockdown period with a sustained reduction in cases, deaths, and hospitalisations for
several months afterwards. After easement of the lockdown, we do not expect a large surge
in cases if tiered restrictions remain in place, because in most NHS England regions we project
that there will be sufficient depletion of susceptible individuals—given current contact rates—
to keep Rt below or close to one. However, outbreaks could still occur, particularly in previously
low incidence areas. If there is a seasonal increase in transmission during winter, substantial
waning immunity, or a relaxation in control measures including tiered restrictions, there could
be a larger resurgence in transmission.

Among the lockdown scenarios we considered, the timing of lockdown as enacted in England
is roughly consistent with the largest reduction in deaths and least pressure on the health
service. An earlier lockdown is projected to have saved more lives up to the end of January
2021, but may have resulted in a larger resurgence in February and March 2021 in the
absence of additional measures (Fig. 3). These conclusions are broadly in line with other
studies considering the impact of tiered restrictions and lockdown interventions. A network-
based study considering the effect of tiered restrictions in China concludes that later

 10
implementation of lockdowns and social distancing measures significantly increases the total
number of infections15. Another study looking at short-term circuit breaker interventions in the
UK finds that such interventions have the biggest impact when the growth rate is low. The
authors conclude that such interventions are not long-term solutions16 but can buy time to
improve other control measures such as testing, tracing and isolation, or introduction of a
vaccine.

We arrived at our conclusions by jointly fitting our age structured transmission model of SARS-
CoV-2 to the following data sources: observed hospital admissions, hospital and ICU bed
occupancy, seroprevalence, PCR positivity, and deaths. The model fits well to these data
streams and predicted the time course of hospitalisations and deaths accurately over the
course of the autumn, giving some confidence in the results shown here (Appendix, pp. 12–
16, 21). The failure of the model to accurately predict the level of tiered restrictions that two
regions were placed under by the end of October 2020 (Appendix, p. 13) emphasises the
difficulty of predicting political decisions. Projecting the epidemic over long time frames is
inherently uncertain for many reasons, not least of which being that new interventions (such
as mass screening or vaccination) might be introduced. Accordingly, these results should be
taken as indicative of what might be expected if current policies remain in place, with a return
to tiered restrictions after lockdown, rather than forecasts or predictions. For these reasons,
we also chose the end of March 2021 as the longest timescale to model. Indeed, the roll-out
of vaccines is now underway17. This might foreshorten the appropriate time frame for this
analysis, placing further weight on the importance of prompt action to curb the second wave,
although it will still be several months before vaccination starts to have a population-level
impact.

Our model is subject to certain limitations and uncertainties, a number of which have
previously been discussed in detail5,6. First, we do not consider the implementation of any
further interventions after the lockdown periods considered, aside from a continuation of tiered
restrictions at the level imposed before the lockdown. Second, for the majority of scenarios
considered we have assumed that once individuals have been infected with SARS-CoV-2 and
recovered, their immunity is maintained over the time frames modelled. There is emerging
evidence to suggest that reinfection with SARS-CoV-2 is possible, though rare18. At present it
is unclear how widespread reinfection events are, on what timescale these reinfection events
might occur, and whether reinfection results in greater or lesser severity of disease19. Given
that we have projected that all regions of England are likely to have an Rt close to the critical
threshold of 1 through to winter and early spring 2021, relatively small changes in the level of
natural immunity could have a substantial impact upon predictions.

Although this is not the main focus of the work, we have explored the effects of introducing
seasonal contact patterns and waning protection from reinfection, both of which worsen
outcomes (Table 3). Changes in behaviour are likely to occur over the time frames that we
are modelling, particularly over the Christmas period. Behavioural changes are difficult to
predict, and it is possible that there will be a return to more typical behaviours after the
lockdown, or indeed a continuation of cautious behaviours, as was observed after the spring
lockdown ended. We have not attempted to capture these possible changes; an improved
understanding of how behaviours might alter in the light of changes in risk and government
advice is urgently needed to improve the longer-term accuracy of modelling studies. Finally, it
should be stressed that this model only considers direct COVID-19 related morbidity and

 11
mortality (and indeed may underestimate the latter due to the use of the UK-standard definition
of deaths within 28 days of an individual’s first COVID-19 test). There are a range of other
COVID-19 related outcomes related to short-term illness and likely long-term sequelae that
we do not consider here. There are also many indirect health effects that can result from
disruption to health services, which our measures of health service pressure are only a rough
proxy for. Moreover, there are multiple social, psychological, economic and (for children)
developmental costs and loss of educational opportunity, both in the short and longer term,
resulting from interventions. We focus on direct epidemiological implications for COVID-19
and do not attempt to measure wider effects here, but acknowledge that they must be taken
into account when deciding on a course of action.

Faced with rising COVID-19 cases and resulting pressure on health systems, countries across
Europe have tried to adopt measures that maximise the suppression of transmission whilst
minimising social and economic harms. Many have chosen to reintroduce strict measures
such as lockdowns. In England, the government introduced a second national lockdown
starting on 5 November 2020. We estimate that this will reduce COVID-19 deaths and ease
the pressure on the health service over the winter of 2020–21. More stringent or lengthy
interventions could reduce deaths and hospital pressure further, but these benefits need to be
weighed against the heavier social and economic cost associated with stricter measures.

 12
Contributions
NGD, RCB, and CIJ conducted analyses. RCB and TWR performed the literature search.
ISARIC4C provided CO-CIN study data, for which MGS is guarantor. NGD and RCB accessed
and verified all data. All authors contributed to study design and drafting of the manuscript.

Declaration of interests
NGD and WJE are participants of the Scientific Pandemic Influenza Group on Modelling. WJE
and MGS attend the Scientific Advisory Group for Emergencies. All authors declare no
competing interests.

Acknowledgements
This work uses data provided by patients and collected by the NHS as part of their care and
support #DataSavesLives. We are extremely grateful to the 2,648 frontline NHS clinical and
research staff and volunteer medical students, who collected this data in challenging
circumstances; and the generosity of the participants and their families for their individual
contributions in these difficult times. We also acknowledge the support of Jeremy J Farrar,
Nahoko Shindo, Devika Dixit, Nipunie Rajapakse, Lyndsey Castle, Martha Buckley, Debbie
Malden, Katherine Newell, Kwame O’Neill, Emmanuelle Denis, Claire Petersen, Scott
Mullaney, Sue MacFarlane, Nicole Maziere, Julien Martinez, Oslem Dincarslan, and Annette
Lake.

References
1 Real-time Assessment of Community Transmission findings.
 https://www.imperial.ac.uk/medicine/research-and-impact/groups/react-study/real-time-
 assessment-of-community-transmission-findings/ (accessed Nov 2, 2020).

2 Office of National Statistics. Coronavirus (COVID-19) Infection Survey. 2020; published
 online Oct 30.
 https://www.ons.gov.uk/peoplepopulationandcommunity/healthandsocialcare/conditions
 anddiseases/datasets/coronaviruscovid19infectionsurveydata (accessed Nov 2, 2020).

3 Coronavirus (COVID-19) in the UK. https://coronavirus.data.gov.uk/ (accessed Nov 2,
 2020).

4 Prime Minister’s Office, Street 10 Downing. Prime Minister announces new local COVID
 Alert Levels. GOV.UK. 2020; published online Oct 12.
 https://www.gov.uk/government/news/prime-minister-announces-new-local-covid-alert-
 levels (accessed Nov 2, 2020).

5 Davies NG, Kucharski AJ, Eggo RM, Gimma A, Edmunds WJ, Centre for the
 Mathematical Modelling of Infectious Diseases COVID-19 working group. Effects of non-
 pharmaceutical interventions on COVID-19 cases, deaths, and demand for hospital
 services in the UK: a modelling study. Lancet Public Health 2020; 5: e375–85.

6 Davies NG, Klepac P, Liu Y, et al. Age-dependent effects in the transmission and control

 13
of COVID-19 epidemics. medRxiv 2020; : 2020.03.24.20043018.

7 Department of Health and Social Care. New UK-wide methodology agreed to record
 COVID-19 deaths. GOV.UK. 2020; published online Aug 12.
 https://www.gov.uk/government/news/new-uk-wide-methodology-agreed-to-record-
 covid-19-deaths (accessed Nov 6, 2020).

8 UK Biobank COVID-19 antibody study: latest updates.
 https://www.ukbiobank.ac.uk/2020/07/uk-biobank-covid-19-antibody-study-latest-
 updates/ (accessed Nov 2, 2020).

9 Docherty AB, Harrison EM, Green CA, et al. Features of 20 133 UK patients in hospital
 with covid-19 using the ISARIC WHO Clinical Characterisation Protocol: prospective
 observational cohort study. BMJ 2020; 369. DOI:10.1136/bmj.m1985.

10 Levin AT, Hanage WP, Owusu-Boaitey N, Cochran KB, Walsh SP, Meyerowitz-Katz G.
 Assessing the Age Specificity of Infection Fatality Rates for COVID-19: Systematic
 Review, Meta-Analysis, and Public Policy Implications. medRxiv 2020; :
 2020.07.23.20160895.

11 Salje H, Tran Kiem C, Lefrancq N, et al. Estimating the burden of SARS-CoV-2 in France.
 Science 2020; 369: 208–11.

12 Google. COVID-19 Community Mobility Reports.
 https://www.google.com/covid19/mobility/ (accessed Nov 2, 2020).

13 Jarvis CI, Van Zandvoort K, Gimma A, et al. Quantifying the impact of physical distance
 measures on the transmission of COVID-19 in the UK. BMC Med 2020; 18: 124.

14 Kissler SM, Tedijanto C, Goldstein E, Grad YH, Lipsitch M. Projecting the transmission
 dynamics of SARS-CoV-2 through the postpandemic period. Science 2020; 368: 860–8.

15 Ge J, He D, Lin Z, Zhu H, Zhuang Z. Four-tier response system and spatial propagation
 of COVID-19 in China by a network model. Math Biosci 2020; 330: 108484.

16 Keeling MJ, Guyver-Fletcher G, Holmes A, et al. Precautionary breaks: planned, limited
 duration circuit breaks to control the prevalence of COVID-19. medRxiv 2020; :
 2020.10.13.20211813.

17 Department of Health and Social Care. An update on the coronavirus vaccine, 2
 December 2020. GOV.UK. 2020; published online Dec 2.
 https://www.gov.uk/government/speeches/an-update-on-the-coronavirus-vaccine-2-
 december-2020 (accessed Dec 7, 2020).

18 Tillett RL, Sevinsky JR, Hartley PD, et al. Genomic evidence for reinfection with SARS-
 CoV-2: a case study. Lancet Infect Dis 2020; published online Oct 12.
 DOI:10.1016/S1473-3099(20)30764-7.

19 ECDC. Re-infection and viral shedding - threat assessment brief. 2021
 https://www.ecdc.europa.eu/sites/default/files/documents/Re-infection-and-viral-
 shedding-threat-assessment-brief.pdf.

 14
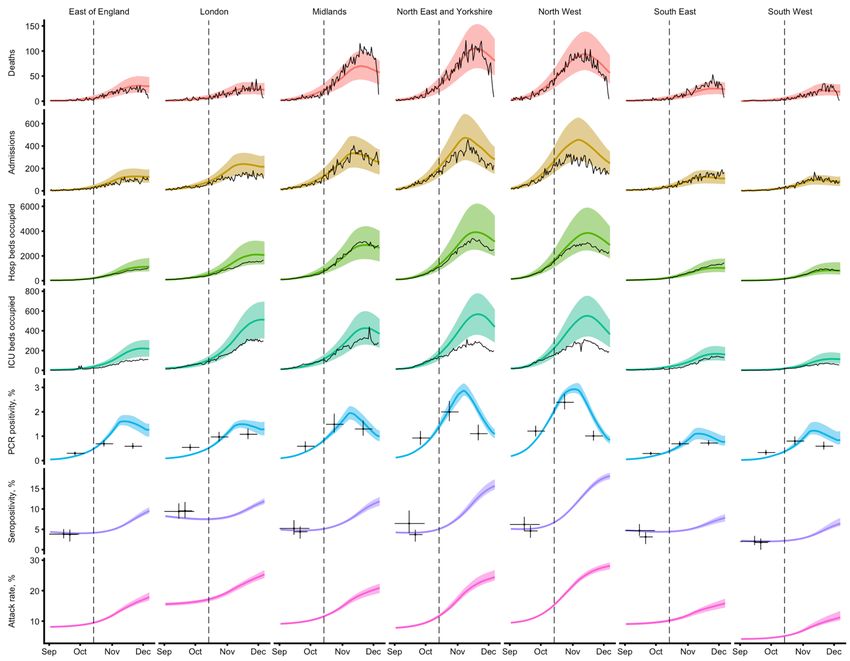
Figures

Figure 1. Model fit to region-specific data on the number of COVID-19 deaths, hospital
admissions, all occupied hospital beds, occupied ICU beds, and of PCR prevalence and
seroprevalence, as well as the implied regional attack rate (% ever infected), from 1 March to
14 October 2020.

 15
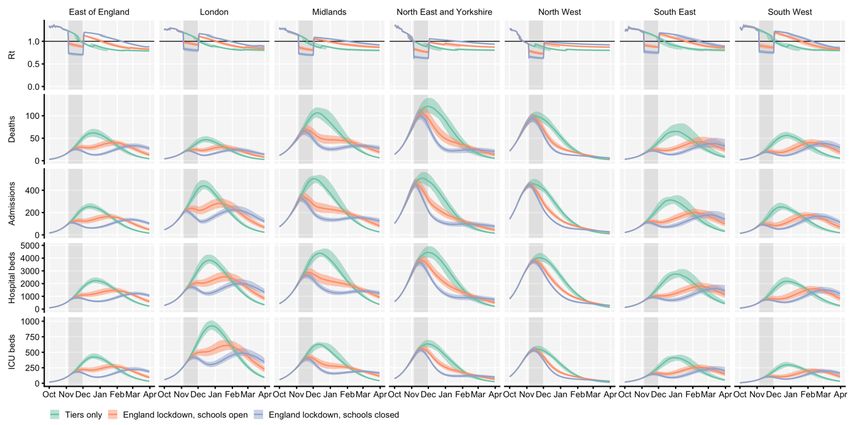
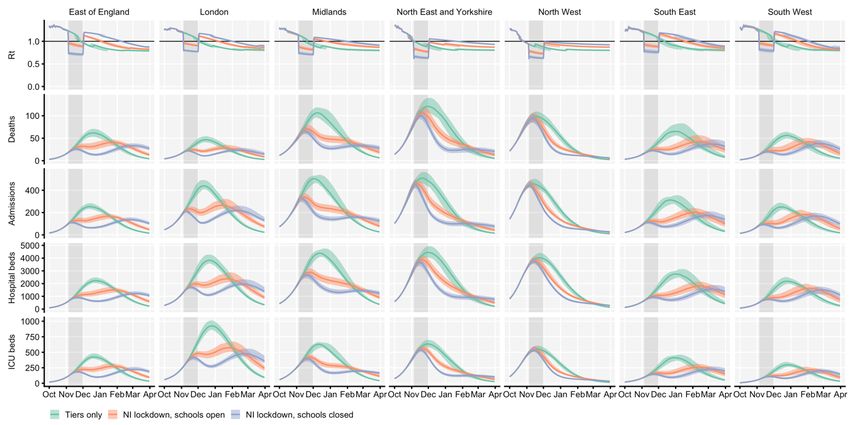
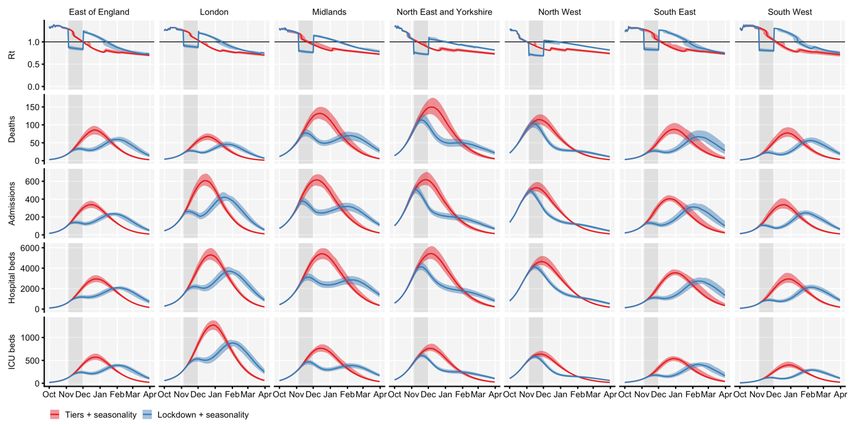
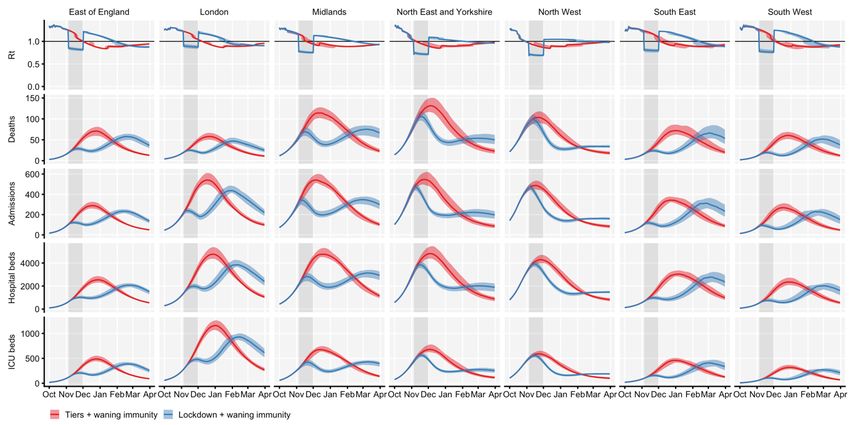
Figure 2. Projected impact of a Wales-type lockdown in England. The effective reproduction
number Rt, as well as the daily incidence of deaths and hospital admissions and the daily
prevalence of occupied hospital and ICU beds is contrasted across seven NHS England
regions for three different scenarios: (i) tiered restrictions only, (ii) Wales-type lockdown with
schools open, (iii) Wales-type lockdown with schools closed. Lockdowns extend from 5
November to 2 December 2020. Lines and shaded ribbons give the median and 95% credible
interval for plotted quantities, while the shaded background area shows the lockdown period.
Step changes in Rt show the introduction or relaxation of tiered restrictions and lockdown
measures.

 16
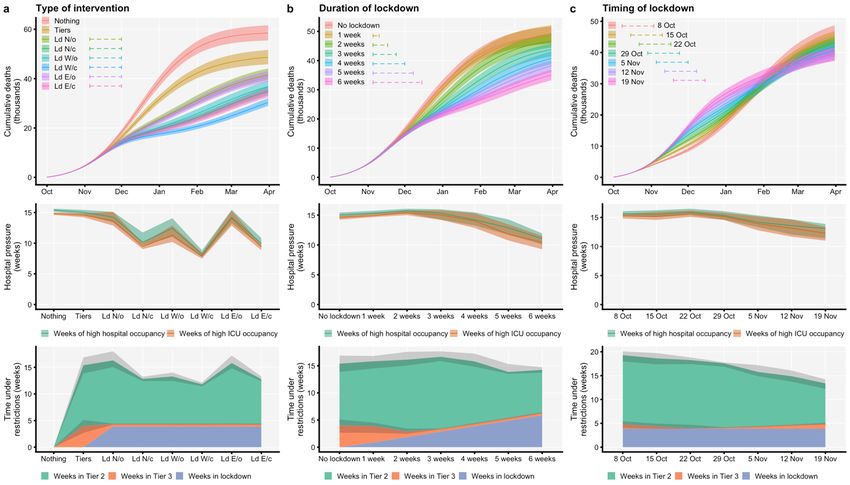
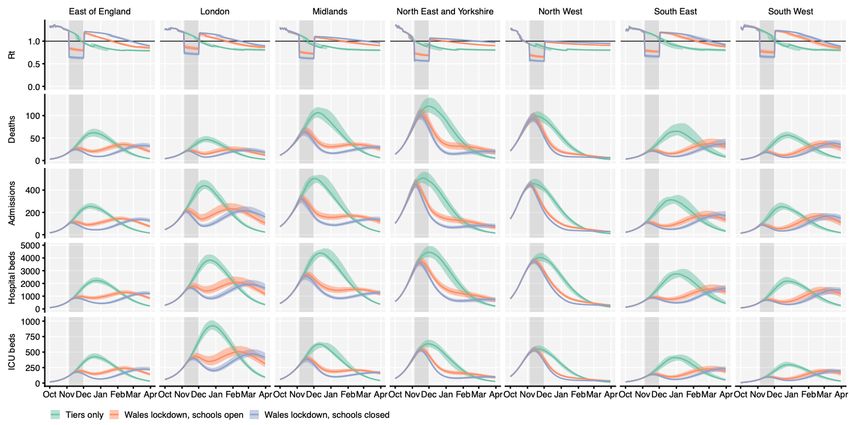
Figure 3. Contrasting alternative intervention strategies. (a) Type of intervention: baseline
epidemic without intervention (Baseline), tiered restrictions only (Tiers), Northern Ireland-type
lockdown with schools open (Ld N/o) or with schools closed (Ld N/c), Wales-type lockdown
with schools open (Ld W/o) or closed (Ld W/c). Note that the lines for Ld N/c and Ld W/o
closely overlap in the top row. (b) Duration of lockdown: with tiered restrictions in place,
commencing on 5 November 2020, Wales-type lockdowns with schools open with durations
from 0 weeks (No lockdown) to 6 weeks are contrasted. (c) Timing of lockdown: four-week
Wales-type lockdowns with schools open starting up to four weeks before or two weeks after
5 November 2020 are contrasted. Top row shows cumulative deaths over time under each
scenario. Middle row shows hospital pressure, defined as the population-weighted average
number of weeks that an NHS region’s hospital (green) or ICU (orange) bed occupancy
exceeds 50% of the peak occupancy for that region during the first wave of COVID-19 in
England. Bottom row shows the expected number of weeks that a random individual in
England spends under Tier 2, Tier 3, or lockdown restrictions for each scenario. All panels
show medians with shaded regions defining 95% confidence intervals.

 17
Tables

Table 1. Model projections, England. Burdens are summed over the period from 1 Oct 2020
to 31 March 2021. Weeks of high ICU occupancy are calculated by measuring the number of
weeks in each region where ICU occupancy is 50% or greater than the peak occupancy during
the first wave. In this table, weeks in Tier 2, weeks in Tier 3, weeks in lockdown, and weeks
of high ICU occupancy are calculated as the population-weighted mean for these values
across all 7 NHS England regions. Lockdowns are assumed to run from 5 November – 2
December 2020 inclusively. Medians and 95% projection intervals shown.

Indicator Baseline Tiers only NI-style NI-style Wales-style Wales-style
 lockdown, lockdown, lockdown, lockdown,
 schools open schools closed schools open schools closed

Admissions 280,000 238,000 206,000 (199,000 177,000 (171,000 186,000 (179,000 - 157,000 (152,000 -
 (274,000 - (231,000 - - 213,000) - 181,000) 193,000) 163,000)
 287,000) 245,000)

Deaths 58,500 48,600 41,500 (39,600 - 34,900 (33,500 - 36,800 (34,900 - 30,300 (29,000 -
 (55,800 - (46,400 - 43,400) 36,700) 38,800) 31,900)
 61,100) 50,700)

Peak ICU (rel. 168% (162 - 131% (128 - 96% (93 - 102%) 88% (85 - 91%) 90% (85 - 94%) 87% (83 - 91%)
W1) 174%) 135%)

Peak ICU 5,000 (4,840 - 3,900 (3,800 - 2,870 (2,760 - 2,610 (2,520 - 2,670 (2,540 - 2,590 (2,480 -
requirement 5,170) 4,010) 3,040) 2,720) 2,810) 2,710)

Weeks in Tier 2 0 (0 - 0) 11.4 (10 - 12 (10.8 - 13.3) 8.48 (8.16 - 8.84) 8.95 (8.28 - 9.62) 7.46 (7.11 - 7.78)
 12.7)

Weeks in Tier 3 0 (0 - 0) 4 (2.96 - 5.03) 0.477 (0.368 - 0.471 (0.358 - 0.473 (0.354 - 0.473 (0.346 -
 0.575) 0.574) 0.565) 0.575)

Weeks in 0 (0 - 0) 0 (0 - 0) 3.86 (3.86 - 3.86) 3.86 (3.86 - 3.86) 3.86 (3.86 - 3.86) 3.86 (3.86 - 3.86)
lockdown

Weeks of high 14.8 (14.7 - 14.6 (14.3 - 13.7 (12.9 - 14.7) 9.45 (9.12 - 9.95) 11.3 (10.3 - 12.7) 7.92 (7.51 - 8.38)
ICU occupancy 15) 14.9)

 18
Table 2. Estimated effect of Tier 2 and Tier 3, and the Northern Ireland lockdown, Wales
lockdown, and England lockdown, on the reproduction number Rt in England.

Intervention Reduction in Rt

Tier 2 2% (0 - 4%)

Tier 3 10% (6 - 14%)

NI lockdown, 35% (30 - 41%)
schools closed

NI lockdown, 22% (15 - 27%)
schools open

Wales lockdown, 44% (37 - 49%)
schools closed

Wales lockdown, 32% (25 - 39%)
schools open

England 36% (29 - 42%)
lockdown,
schools closed

England 22% (15 - 29%)
lockdown,
schools open

 19
Table 3. Sensitivity analysis for scenarios with a seasonal increase in contact rates and/or
waning immunity. Burdens are summed over the period from 1 Oct 2020 to 31 March 2021.
Here, the lockdown scenario uses the assumption of a Wales-type lockdown with schools
open. Lockdowns are assumed to run from 5 November – 2 December 2020 inclusively.
Seasonal contact patterns and waning protection from reinfection take effect on 1 October
2020. Medians and 95% projection intervals shown.

Indicator Tiers only Lockdown Tiers only + Lockdown + Tiers only Lockdown Tiers only + Lockdown +
 seasonality seasonality + waning + waning seasonality + seasonality +
 waning waning

Admissions 238,000 186,000 283,000 247,000 297,000 260,000 355,000 324,000
 (231,000 - (179,000 - (274,000 - (240,000 - (288,000 - (252,000 - (345,000 - (316,000 -
 245,000) 193,000) 289,000) 253,000) 304,000) 267,000) 364,000) 333,000)

Deaths 48,600 36,800 58,100 49,900 59,200 50,200 72,300 64,100
 (46,400 - (34,900 - (55,400 - (47,300 - (57,000 - (48,200 - (69,300 - (61,600 -
 50,700) 38,800) 61,100) 51,900) 61,600) 52,500) 76,100) 67,400)

Peak ICU (rel. 131% 90% (85 - 166% (161 - 122% (119 - 148% 120% (117 - 193% (187 - 152% (148 -
W1) (128 - 94%) 173%) 127%) (143 - 124%) 203%) 158%)
 135%) 153%)

Peak ICU 3,900 2,670 (2,540 4,950 (4,780 3,640 (3,540 4,400 3,570 (3,470 5,760 (5,570 - 4,510 (4,400 -
requirement (3,800 - - 2,810) - 5,150) - 3,790) (4,250 - - 3,680) 6,050) 4,690)
 4,010) 4,550)

Weeks in Tier 11.4 (10 - 8.95 (8.28 - 7.04 (6.82 - 12.9 (11.3 - 11.6 (10.3 14.9 (14.1 - 10.1 (9.47 - 13.2 (12.6 -
2 12.7) 9.62) 7.83) 14) - 12.8) 15.7) 10.3) 14.3)

Weeks in Tier 4 (2.96 - 0.473 (0.354 8 (7.29 - 8) 1.51 (0.911 - 6.26 (5.64 1.5 (1.06 - 8.67 (8.67 - 5.19 (4.37 -
3 5.03) - 0.565) 2.27) - 6.99) 2.25) 8.67) 5.7)

Weeks in 0 (0 - 0) 3.86 (3.86 - 0 (0 - 0) 3.86 (3.86 - 0 (0 - 0) 3.86 (3.86 - 0 (0 - 0) 3.86 (3.86 -
lockdown 3.86) 3.86) 3.86) 3.86)

Weeks of 14.6 (14.3 11.3 (10.3 - 15.1 (14.9 - 16.8 (16.4 - 17.6 (17.3 18.4 (17.7 - 18.2 (17.9 - 20.7 (20 -
high ICU - 14.9) 12.7) 15.4) 17.5) - 18) 19.1) 18.6) 21.3)
occupancy

 20
Appendix

Mobility and contact rates

We analysed the relationship between mobility indices for England from the Google
Community Mobility report1 and surveyed social contact rates from the POLYMOD study2 and
the CoMix study3.

Specifically, we conducted an exploratory analysis to determine which mobility indicators, if
any, could be used to predict social contact rates—in home, work, school, or other settings—
on a given day. We could not identify a convincing relationship between mobility indices and
interpersonal contact in the home or school settings, which were better predicted by simple
step functions following the first imposition of lockdown measures in England and school
closures. We did, however, identify a clear relationship between workplace contacts reported
in CoMix and the “workplace visits” indicator of Google Mobility, and between “other” contacts
in social contact surveys and the “retail and recreation”, “grocery and pharmacy”, and “transit
stations” indicators of Google Mobility. We characterised these relationships by fitting
generalised additive models (GAM) of workplace and of “other” contacts to Google Mobility
indicators using the R package mgcv4, using workplace visits in Google Mobility as the
predictor for workplace contacts in CoMix and using a weighted average of “retail and
recreation”, “grocery and pharmacy” and “transit station” visits in Google Mobility as the
predictor for “other” contacts in CoMix. The optimal weighting of these three indicators was
identified by optimising coefficients over the 3-simplex (i.e., 3 non-negative numbers summing
to 1) to achieve the maximum deviance explained in the generalised additive model. Baseline
levels of contact (those applying in the model prior to the first lockdown in March) were taken
from the POLYMOD survey that collected contact data from the UK in 20062. The changes in
home and school contacts as a result of lockdown and school closures, and the relationship
between workplace and other contacts and Google Mobility data is shown in Fig. S1.

We found that the average daily number of home contacts was well described by a step
function transitioning from an average of 3.89 home contacts before March 23rd (the date of
the first lockdown in the UK) to an average of 1.54 home contacts after March 23rd, with no
evidence for substantial changes in the daily number of home contacts following an initial
reduction in home contacts coinciding with the first lockdown in the UK (Fig. S1a). The average
daily number of school contacts was well described by a step function transitioning from an
average of 5.67 school contacts among individuals 18 or younger while schools were open,
and zero school contacts when schools were closed (Fig. S1b). The average daily number of
work contacts was well approximated by an approximately linear function of the number of
“workplace” visits in the Google Mobility dataset, averaged across regions of England,
extending from zero workplace contacts when workplace visits were at 23% of the baseline
rate or lower, to 2.65 workplace contacts when workplace visits were at 100% of the baseline
rate (Fig. S1c). Finally, the average daily number of “other” contacts was well approximated
by a curved function of a weighted combination of transit station visits (44.5%), retail and
recreation visits (34.5%), and grocery and pharmacy visits (21.0%; Fig. S1d). The particular
functions for work and other contacts were obtained using thin-plate regression using the mgcv
R package5, while the coefficients used to weight transit station, retail and recreation, and

 Appendix, p. 1
grocery and pharmacy visits were obtained by optimising a thin-plate regression model for
maximum deviance explained over the 3-simplex of potential coefficients summing to 100%.

Fig. S1. Analysis of social contact rates during the SARS-CoV-2 epidemic in England.
We illustrate the results of our analysis of social contact rates using the POLYMOD and CoMix
contact surveys in the UK, using either the calendar date (a, b) or Google Community Mobility
indices (c, d) as predictors. Shown are the obtained functions describing (a) home contacts
(all individuals), (b) school contacts (among individuals 18 years of age or under), (c) work
contacts (among individuals 18 to 65 years old), and (d) other contacts (among all individuals).
Each point for CoMix represents an aggregated two-week period. For school contacts, some
survey respondents in weeks 36–39 were reporting contact with all members of their class
instead of conversational/physical contacts only, resulting in an illusory spike in contact rates
at the beginning of the school year; the half-term break in week 43 resulted in fewer school
contacts for the week 42–43 data point.

Impact of tiered restrictions (Alert Levels 1–3)

On October 14, 2020, the UK government announced a system of “Alert Level” tiered
restrictions to be applied at the local authority level depending upon the local burden of
disease. To estimate the impact of these tiered restrictions, we analysed how Google
Community Mobility indicators in each region under restrictions (i.e., those in Tier 2 or Tier 3)
changed relative to the regions without additional restrictions (i.e., those in Tier 1). We began
by isolating Google Community Mobility indicators as a time series extending from 1
September to 27 October 2020, the most recent data available relating to tiered restrictions at
the time of the analysis. There were 2,112 trend lines in total, representing six indicators for
residential, workplace, park, grocery and pharmacy, retail and recreation, and transit station

 Appendix, p. 2
visits for each of 352 local regions tracked by Google Community Mobility in England. There
was a substantial day of week effect in all trend lines, which we removed by fitting a
generalised additive model to estimate the weekday effect using the mgcv R package, fitting
a cyclic spline with 7 knots — one for each day of the week — to each trend line (i.e., for each
region and indicator available), and then subtracting this effect from each trendline. We then
estimated a national trend for each of the six indicators using a generalised additive model
with thin-plate spline regression and subtracted this national trend from the trend lines with
weekday effects removed. Finally, for each trend line, we estimated a “baseline” value by
taking the mean mobility index over the last seven days of data prior to the start of tiered
restrictions, i.e. from 7 to 13 October 2020. We estimated the effect of each tier on mobility
indices by comparing, for each region and mobility indicator, the difference between the
baseline value and the mean mobility index over all days for which the region was under a
given tier. This yielded 299 point estimates of the impact of Tier 1 relative to baseline, 104
point estimates of the impact of Tier 2 relative to baseline, and 35 estimates of the impact of
Tier 3 relative to baseline, for each of the six mobility indicators (Fig S2). We used the mean
difference between Tier 2 and Tier 1 and the mean difference between Tier 3 and Tier 1 in
these point estimates as a measure of the impact of Tiers 2 and 3 on mobility.

Fig. S2. Impact of tiered restrictions on mobility indices as measured by Google. Points
show the individual within-region estimates of the impact of each tier relative to a pre-tiers
baseline, with violin plots showing the distribution of points. Labelled values represent the
difference between the mean of each respective tier effect and the mean of the tier effect for
Tier 1, which we use to estimate an impact on mobility for Tiers 2 and 3 relative to Tier 1. Note
that the Parks and Residential mobility indices are not used to inform changes in contact rates
in our analysis.

 Appendix, p. 3
Impact of lockdown restrictions

In order to estimate the potential impact of lockdown restrictions in England, we used Google
Community Mobility indices to estimate the impact of lockdown restrictions that were imposed
in Northern Ireland from 16 October 2020 and in Wales from 23 October 2020. Additionally,
after this analysis was originally conducted, we used the same methodology to estimate the
impact of the lockdown as enacted in England. We began by averaging across the mobility
indices for each local region in Northern Ireland, Wales, or England, weighting each local
region by population, to obtain an overall series of daily mobility indices for each country.
Then, we selected a week’s worth of data to use as a baseline for comparison for each
country’s lockdown; the baseline periods were 9–15 October for Northern Ireland, 16–22
October for Wales, and 17–22 October for England. To analyse mobility changes during the
lockdown periods, we focused on 17–30 October for the circuit breaker in Northern Ireland,
24 October–6 November for the firebreak in Wales, and 5–25 November for the lockdown in
England, subtracting each within-lockdown day’s mobility indices from the mobility indices
measured for the corresponding weekday during the baseline period. Matching by weekday
in this manner allowed us to control for day-of-week effects; we chose a baseline period for
England further back in time relative to the lockdown than we did for Northern Ireland and
Wales so that the baseline period in England would not overlap with the half-term school break
during 24 October – 1 November. The average difference for each indicator and country was
assumed to capture the impact of lockdown restrictions (Fig. S3). We found a substantially
greater impact of lockdown restrictions in Wales compared to Northern Ireland, with the
retrospectively analysed lockdown in England having an intermediate effect between the two.

Imposition of tiered restrictions

Regarding our analysis of tiered restrictions in England, UK government guidelines state that
a local authority will be considered for admission to Tier 2 when the incidence of cases (as
detected by tests administered by the NHS (Pillar 1) and commercial partners (Pillar 2))
exceeds 100 new cases per 100,000 population over a period of one week. There is no official
guidance on the threshold needed to progress to Tier 3, but inspection of the seven-day case
rates in regions that were placed under Tier 3 restrictions suggests a threshold of
approximately 300 cases per 100,000 population over a seven-day period. Using ONS
estimates for viral prevalence, we estimated that approximately 1 in 7 SARS-CoV-2 infections
in the UK is detected by Pillar 1 or Pillar 2 surveillance. We fixed model thresholds for
progressing into Tiers 2 or 3 at 700 new infections per 100,000 population and 2,100 new
infections per 100,000 population over a seven-day period, respectively. In keeping with stated
UK government guidelines, we assumed that tier classifications would be reviewed after 28
days for potential downgrading of a tier (i.e. from Tier 3 or Tier 2 to a lower tier). However, we
assumed that regions could move into a higher tier immediately if they passed the threshold
for a higher tier before the 28-day review period had passed.

When simulating the impact of tiered restrictions and lockdown on transmission dynamics, we
use both the mean estimated impact for each mobility index as well as the standard error of
each impact. When running simulations, we draw normally-distributed random numbers for
each run of the simulation to incorporate this uncertainty, and apply these to the estimated
impacts of each type of restriction. For example, if the random number is +1 for Tier 2, then
we add one standard error to each mobility indicator whenever a region is under Tier 2

 Appendix, p. 4
restrictions. We assume that these errors are correlated across mobility indicators within a
given restriction, i.e., if the effect of Tier 2 on workplace contacts is overestimated by one
standard error, we assume that the effect of Tier 2 on grocery and pharmacy contacts is also
overestimated by one standard error, but uncorrelated between Tier 2, Tier 3, and lockdowns.

 Grocery and pharmacy Residential Retail and recreation
 20
 0

 (−1.3) (+6.6)
 15 −20
 (+4.9)
 −10 (+4.6) (−15)
 (−4.6)
 −40
 10
 −20 (−16.1)
 (−27.6)
 −60 (−37.5)
 5
Google Mobility index

 −30

 −21 −14 −7 0 7 14 21 28 −21 −14 −7 0 7 14 21 28 −21 −14 −7 0 7 14 21 28
 Transit stations Workplaces

 −20
 −10

 −30
 −20
 Country
 −40
 England
 (−10.6) −30 Northern Ireland
 −50 (−9.9) Wales
 (−14.3)
 (−14.9)
 (−19) −40 (−18.5)
 −60

 −70 −50
 −21 −14 −7 0 7 14 21 28 −21 −14 −7 0 7 14 21 28
 Days from lockdown

Fig. S3. Estimated mean change in mobility indices following lockdown restrictions imposed
in Northern Ireland, Wales, and England, relative to the first full day of lockdown (day 0).
Average mobility indices for each country are shown using fine lines, while thick horizontal
lines show the average mobility indices for pre-lockdown and lockdown periods. The vertical
dashed line marks the first full day of lockdown. Labelled numbers in parentheses show the
relative change for each mobility index between pre-lockdown and lockdown. Note that the
Residential mobility index is not used to inform changes in contact rates in our analysis.

 Appendix, p. 5
Sensitivity analyses with waning immunity and seasonal patterns of transmission

As a sensitivity analysis, we estimated how the effect of interventions might vary under a
scenario with a seasonal increase in contact rates and/or with waning immunity to reinfection
by SARS-CoV-2. In both cases, we assumed that seasonal increases or waning would start
only on 1 October 2020 and carry forward for the rest of the simulation. We assumed that
seasonal changes in contact rates were uniform across age groups and followed a sinusoidal
curve with an amplitude of 10% (i.e. peak-to-trough difference of 20%), peaking on 1 January
2021, and that waning immunity followed an exponential distribution with an average duration
of protection of 40 weeks; estimates for seasonality and waning are adopted from a previous
study6.

PCR positivity

We obtained estimates for the probability of testing PCR positive on a given day since infection
from an unpublished study which included both symptomatic and asymptomatic individuals.
We assumed that the time from infection to PCR positivity and the time from PCR positivity to
loss of PCR positivity were uncorrelated, and could each be described by a separate gamma
distribution with a mean and shape parameter to be estimated. Adopting uniform priors for the
mean and shape of both gamma distributions, we performed Bayesian inference using MCMC
to estimate the parameters of both gamma distributions, which yielded an average duration of
PCR positivity of 8.5 days.

Model fitting

To fit the model to data on deaths, hospital admissions, hospital bed and ICU bed occupancy,
PCR positivity, and seroprevalence for each of the 7 NHS England regions, we performed
Bayesian inference using Markov chain Monte Carlo, employing the Differential Evolution
MCMC algorithm7. For each posterior sample, we simulated epidemics from 1 January to 24
October 2020, using data that were current as of 23 October 2020. We used Google
Community Mobility data up to 13 October 2020, the day before the implementation of tiered
restrictions in England, to capture how interpersonal contact rates changed over the course of
the epidemic, as detailed above; from 14 October 2020, we assumed that mobility indicators
were “frozen” at their mean values for each region as measured over the week of 10-16
October, with further changes dictated by the introduction of tiered restrictions and lockdowns,
as well as sinusoidally varying seasonal changes in transmission rates for sensitivity analyses
with seasonally-varying transmission.

For deaths, hospital admissions, hospital bed occupancy and ICU bed occupancy, we used a
negative binomial likelihood with size parameter fixed at 20 for each daily data point. For
seroprevalence and PCR prevalence, we used a skew-normal likelihood for each data point
fitted to produce the same mean and 95% confidence interval as was reported for the data
and took the expected value of the model prediction over the date range during which the
prevalence was measured.

As part of model estimation, we separately fit for each region: the start time of community
transmission; the basic reproduction number R0 prior to any changes in mobility or closure of
schools; the delay from infection to hospital admission, to ICU admission, and to death; a

 Appendix, p. 6
You can also read