GREATER GEELONG REGION PROFILE - JULY 2019 - G21 Geelong Region Alliance
←
→
Page content transcription
If your browser does not render page correctly, please read the page content below

GREATER GEELONG
REGION PROFILE
JULY 2019
G21 IS THE FORMAL ALLIANCE
OF GOVERNMENT, BUSINESS
AND COMMUNITY ORGANISATIONS,
WORKING TOGETHER TO IMPROVE
THE LIVES OF PEOPLE WITHIN THE
GEELONG REGION ACROSS
FIVE MUNICIPALITIES – COLAC OTWAY,
GOLDEN PLAINS, GREATER GEELONG,
QUEENSCLIFFE AND SURF COAST.

                         This document was prepared by Civic Collective for
                         the G21 - Geelong Region Alliance

                                           Dr Fiona Gray
                                           fiona@civiccollective.com.au
                                           0417 056 659
                                           http://www.civiccollective.com.au/

                         © G21 Geelong Region Alliance

                         Please refer to data tables in appendix for
                         detailed data, at www.g21.com.au/region-profile-
                         data-tables

2
CONTENTS
1.0 INTRODUCTION                                   4     4.12 HOMELESSNESS                        25
2.0 STRENGTHS & CHALLENGES                         6     4.13 GAMBLING                            26
3.0 PLACE                                          8
                                                         4.14 CRIME & SAFETY                      26
 3.1 ABOUT THE CITY OF GREATER GEELONG             8
                                                         4.15 HEALTH BEHAVIOURS                   27
 3.2 URBAN SETTLEMENT PATTERN                      11
                                                         4.16 SCREENING, HEALTH CHECKS & ACCESS   28
 3.3 HOUSING SUPPLY & DEMAND                       11
                                                         4.17 HEALTH STATUS                       28
 3.4 NEW DWELLING BUILDING APPROVALS COMPARISONS 13
                                                         4.18 HEALTH SERVICES                     29
 3.5 HOUSING                                       13
                                                         4.19 DISABILITY                          30
 3.6 FACILITIES & SERVICES                        14
                                                         4.20 MENTAL HEALTH                       30
 3.7 TRANSPORT                                     15
                                                         4.21 INFANTS & CHILDREN                  31
4.0 PEOPLE                                        16
                                                        5.0 ECONOMY                               34
 4.1 POPULATION GROWTH TRENDS & FORECASTS          18
                                                         5.1 INDUSTRY PERFORMANCE & GROWTH        36
 4.2 AGE STRUCTURE                                 19
                                                         5.2 CITY DEAL                            42
 4.3 GENDER DISTRIBUTION                           19
                                                         5.3 REVITALISATION OF CENTRAL GEELONG    42
 4.4 LESBIAN, GAY, BISEXUAL, TRANS/TRANSGENDER
                                                        6.0 ENVIRONMENT                           44
     & INTESEX (LGBTI) PEOPLE                      19
                                                         6.1 NATURAL FEATURES & LAND USE          45
 4.5 FAMILY STRUCTURE                             20
                                                         6.2 CLIMATE & RAINFALL                   46
 4.6 INDIGENOUS POPULATION                        20
                                                        7.0 REFERENCES                            48
 4.7 CULTURAL DIVERSITY                           20
                                                        8.0 GLOSSARY                              49
 4.7 INDEX OF RELATIVE SOCIO-ECONOMIC DISADVANTAGE 21
                                                        9.0 ABBREVIATIONS                         52
 4.8 INCOME                                        21
                                                        10.0 DATA NOTES                           52
 4.9 EDUCATION                                     22
                                                        11.0 DATA RESOURCES                       53
 4.10 EMPLOYMENT CHARACTERISTICS                  23

 4.11 YOUTH ENGAGEMENT                            25

                                                                                                       3
1.0 INTRODUCTION

The Greater Geelong Region Profile (2019) has been prepared
to provide an evidence-based resource for planning, priority
project identification and implementation and advocacy for
regional growth, health and wellbeing in the G21 region and the
City of Greater Geelong. The G21 region comprises five local
government areas (LGAs): Colac Otway, Golden Plains, Greater
Geelong, Queenscliffe and Surf Coast.

The Greater Geelong Profile (2019) represents an update of the
previous Region Profile undertaken in 2014 and forms part of a
series of region profiles prepared for the G21 region.

A broad range of demographic, socio-economic, health,
community and economic data is presented in the Region Profile,
as well as information contained in key strategic documents
relevant to Greater Geelong and the broader G21.

While there are considerable interconnections between each data
domain, the profile has been arranged into 4 key sections:

PLACE
A broad description of the physical assets of the region, including
information about the region’s housing, facilities and services.

PEOPLE
Demographic information about the current population and
examines population change and projections. It also includes
information about the population’s socio-economic status,
income, education, employment, and health and wellbeing
status.

ECONOMY
Information about industries of employment and trends in this
area, labour force characteristics, Gross Regional Product and
identifies emerging industries and priority projects.

ENVIRONMENT
Information about natural environmental features, climate,
water and climate change.

Note: Arts and Culture is also important to the region however a
dearth of data exists at the Local Government Area (LGA) level.
Please refer to the G21 Region Profile for regional level data.

This profile is supported by an extensive series of data tables
provided in the Greater Geelong Region Profile – Data Tables.
References to relevant tables are provided at the end of each
Chapter.
4
5

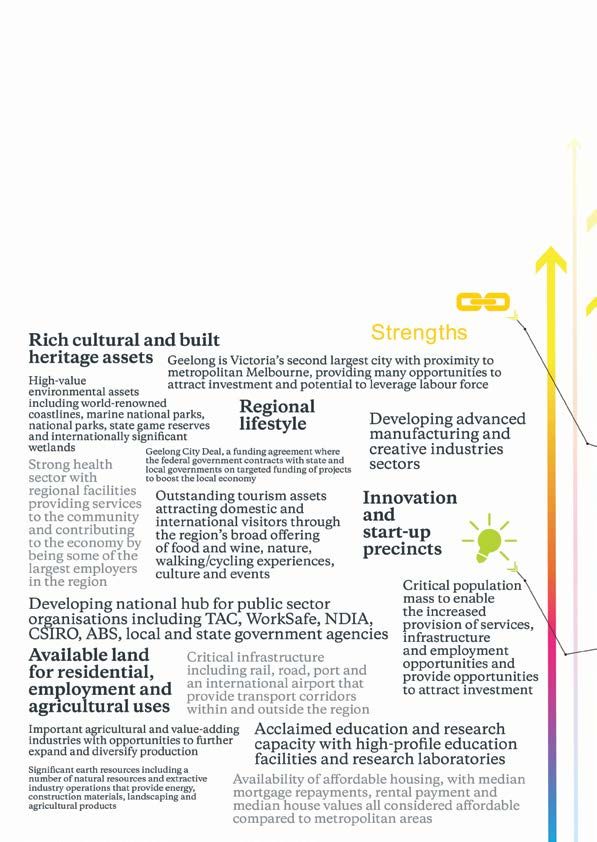
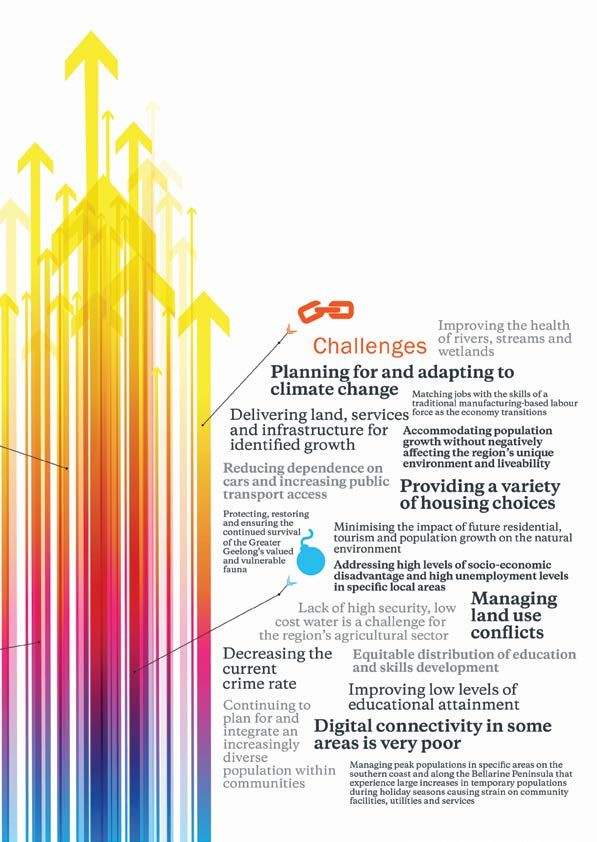
2.0 STRENGTHS & CHALLENGES

6

7
PLACE

8
3.0 PLACE

3.1 ABOUT THE CITY OF
GREATER GEELONG
The City of Greater Geelong (Greater Geelong) is             Greater Geelong encompasses an area of 1,247 square
located in regional Victoria, approximately a one-hour       kilometres. The vast majority of the land is utilised
drive to the south-west of the Melbourne CBD. Geelong        by intensive uses such as residential and industrial,
is the second largest city in Victoria and is the regional   with areas on the periphery of Greater Geelong
centre for industry and business, health and education,      including farmland and rural residential living. Greater
and a wide range of retail, commercial, entertainment        Geelong also includes a number of coastal towns and
and community facilities and services. The traditional       settlements such as Barwon Heads, Ocean Grove and
owners of the Geelong area are the Wadawurrung               Portarlington. The Lake Connewarre wildlife reserve
people.                                                      also encompasses a significant portion of the land in
                                                             the southern region of Greater Geelong.
In 2017 Greater Geelong had a preliminary estimated
resident population of approximately 244,789 persons,        The City of Greater Geelong adjoins Golden Plains
accounting for 76% of the total population in the G21        Shire to the west, Morrabool Shire to the north,
region. Almost 67% of the Greater Geelong population         Wyndham City to the north-east, and Surf Coast Shire
(approximately 164,389 residents) reside in the urban        to the south-west, with coastal boundaries to the south
area of Geelong (Urban Centre Locality).                     encompassing almost the entirety of the Bellarine
                                                             Peninsula (except for the Borough of Queenscliffe).

SNAPSHOT
MEASURE									GREATER GEELONG                                                                              VICTORIA

HOUSING

►► HOUSING
►► NUMBER OF DWELLINGS (2016)							106,018
►► OCCUPANCY RATE (2016)								86.6%			88.9%
►► FULL HOME OWNERS								34.7%			30.7%
►► RENTERS									27.7%			26.7%
►► MEDIAN MORTGAGE REPAYMENTS (PER MONTH, 2016)					$1,517			$1,728
►► MEDIAN RENT (PER WEEK, 2016)							$280			$325
►► MORTGAGE STRESS								8.4%			10.2%

TRANSPORT

►► PEOPLE WHO LIVE WITHIN 400M OF A PUBLIC TRANSPORT NETWORK			                     76.9%			                 73.9%
►► HOUSEHOLDS OWNING TWO OR MORE VEHICLES					57.0%			56.2%
►► TRAVEL TO WORK BY TRAIN							2.1%			5.8%
►► TRAVEL TO WORK BY BICYCLE							0.8%			1.3%
►► TRAVEL TO WORK BY WALKING							2.6%			3.2%

Note: Data collected from a range of sources

                                                                                                                       9
SMYTHESDALE

                                                                                                                              MELBOURNE
                               ROKEWOOD

                                                                                                You
                                                                                               Yangs

                                                                                       LARA
                                                                                                         Avalon
                                                           BANNOCKBURN                                   Airport
                                                                                                                                      PORT PHILLIP

                                                                               CORIO             CORIO BAY

                                                                         GEELONG                                    PORTARLINGTON

                                                                                              WHITTINGTON

                                                                                       ARMSTRONG
                                                                                           CREEK                    HW
                                                                                                                         Y

                                                                                                              QUEENSCLIFF

                                                                                                                     POINT
                                                                                                       BARWON      LONSDALE
                                                                                                        HEADS

                                   COLAC                                           TORQUAY

                                                                           ANGLESEA

                                                          LORNE
                                                Great
                                                Otway
                                               National
                                                 Park
                                                           BASS STRAIT

                    Great
                    Otway
                   National
                     Park

                                       APOLLO BAY
                         Great
                         Otway
                        National
                          Park

MAP OF G21 REGION

Geelong serves as the regional centre for many of the          of excellence for specialised research, with Deakin
surrounding areas providing a comprehensive range              University and CSIRO performing an integral role.
of the retail, commercial, community, education
                                                               Significant future population growth is occurring in
and health facilities and services. The G21 Regional
                                                               growth areas such as Armstrong Creek, while the City
Growth Plan (2013) identifies Geelong as performing
                                                               of Greater Geelong is also planning for new growth
a ‘Regional City’ role which functions as “the primary
                                                               areas to the north and west of existing urban areas.
service centre in the south-western half of the state,
                                                               Significant investment is also occurring the Geelong
playing a key support role to Melbourne.” (p. 9).
                                                               CBD which is assisting in the revitalisation of the
Major employing industries in Greater Geelong                  regional city that services much of western Victoria.
include health, retail, construction, education, and
                                                               Greater Geelong is the economic centre for the G21
manufacturing, constituting more than 50% of all
                                                               region accounting for 80% of the region’s Gross
jobs. Greater Geelong is also the location for many
                                                               Regional Product (GRP) and 81% of the region’s jobs.
new and emerging industries including carbon fibre
manufacturing, creative industries, and ICT-based
businesses. Geelong is building a reputation as a centre

10
3.0 PLACE
3.2 URBAN SETTLEMENT PATTERN 3.3 HOUSING SUPPLY & DEMAND
In 2017 Greater Geelong had a population density The City of Greater Geelong recently prepared the
of 196 persons/km2 which is much higher than the Settlement Strategy (October 2018) which provided the
Victorian (28 persons/km2) and regional Victoria (7 following insights into housing supply and demand in
persons/km2) averages. Greater Geelong.
Geelong is the largest urban area in the Greater
RESIDENTIAL SUPPLY
BAY Geelong municipality and G21 region. The Geelong
Urban Centre Locality (UCL) had a 2017 population of Residential capacity in future growth areas:
approximately 164,400 persons, accounting for 67% • Armstrong Creek: Remaining capacity of 20,000
of the Greater Geelong population and 68% of the G21 dwellings
Population.
• Lara: Capacity for 6,000 dwellings
CITY OF GREATER GEELONG
https://www.whereis.com/
113.0 PLACE
• Northern Geelong Growth Area: Capacity for ESTIMATED YEARS OF BROAD-HECTARE AND
16,000 dwellings MAJOR INFILL LAND SUPPLY
• Western Geelong Growth Area: Capacity for 18,000 Including the identified Northern and Western
dwellings Growth Areas, the City of Greater Geelong has 57
• Bellarine Peninsula: Capacity for 12,000 dwellings years of residential land supply if long term historic
There is significant capacity for major and dispersed trends continued (1.3% p.a.). Accounting for the
infill development in the established areas of Geelong, ‘G21 Aspirational’ scenario (2.5%) which reflects the
Central Geelong and urban renewal precincts. G21 Regional Growth Plan (2013) and current rates of
population growth (ABS ERP 2.6% p.a. 2017/18) the
RECENT CHANGE IN DWELLING STOCK City of Greater Geelong has a residential supply of 25+
The net change in dwelling stock in Greater Geelong years.
remained above 2,200 dwellings a year between 2013
and 2015, based on information contained in the
Settlement Strategy (October 2018).
NET DWELLING CHANGE (2010-2015)
City of Greater Geelong, Settlement Strategy October 2018
RESIDENTIAL LAND SUPPLY (AS OF 1 JANUARY 2017)
City of Greater Geelong, Settlement Strategy October 2018
123.0 PLACE
3.4 NEW DWELLING BUILDING 3.5 HOUSING
APPROVALS COMPARISONS
HOME OWNERSHIP
Between 2013/14 and 2017/18, Greater Geelong has
Residents in Greater Geelong are marginally less
averaged approximately 2,760 new dwelling building
likely to fully own their home compared to the Victoria
approvals per year. The level of building approvals is
average (Greater Geelong: 34.7%; Vic: 35.0%) and are
comparable with or greater than the following growth
also marginally less likely to purchase their home with
area Council’s in metropolitan Melbourne over the
a mortgage (Greater Geelong: 34.1%; Vic: 35.5%) and
four-year period:
more likely to be renting (Greater Geelong: 27.7%; Vic:
• Whittlesea: which averaged approximately 2,780 26.7%).
new dwelling building approvals a year
• Melton: which averaged approximately 2,050 new HOUSING COSTS
dwelling building approvals a year Compared to Victorian benchmarks, housing costs in
• Cardinia: which averaged approximately 1,730 new Greater Geelong are considered affordable. Median
dwelling building approvals a year. mortgage repayments in Greater Geelong were $1,520
Furthermore, new dwelling building approvals in per month in 2016, which was 12.2% below the median
Greater Geelong were approximately three times higher for Victoria of $1,730 per month. Median rents in
than the 920 approvals a year in Greater Bendigo, Greater Geelong were approximately $280 per week,
which was the second fastest growing regional city in which was 13.9% below the median rent throughout
Victoria of $325 per week.
Victoria over the period.
An estimated 8.4% of Greater Geelong households
experienced mortgage stress in 2016, which was
below the Victorian benchmark of 10.2%. Households
NEW DWELLING BUILDING APPROVALS - ANNUAL AVERAGE 2013/14 TO 2017/19
ABS, Building Approvals, annual
133.0 PLACE
experiencing rental stress in Greater Geelong RESIDENTIAL AGED CARE
accounted for 32.1% of renting households in 2016,
At June 2016, the estimated provision of residential
above the average for regional Victoria of 27.2%.
aged care places in Greater Geelong (91.2 per persons
aged 70 years and over) was above the Victorian average
DWELLING OCCUPANCY RATES
of 85.1. In 2016, Greater Geelong accommodated a total
In 2016 Greater Geelong had an estimated 106,020 of approximately 2,560 residential aged care beds.
private dwellings including approximately 14,210
dwellings (or 13.4%) that were unoccupied. This share 3.6 FACILITIES & SERVICES
of unoccupied private dwellings is above the Victorian
average of 11.1%. Community access to facilities and services in Greater
Geelong is measured by community strength indicators
DWELLING STRUCTURE from a variety of sources and in relation the Victorian
benchmark. Selected community strength indicators
In 2016 separate houses accounted for 84.6% of
are discussed below:
occupied dwellings in Greater Geelong and this share
is significantly higher than the Victorian average of • Pleasant environment rating: 94% of Greater
72.3%. This dwelling structure reflects the largely low- Geelong residents rated their community as having
density form of development throughout the region. By a ‘pleasant environment’, which was similar to the
comparison, flats, units and apartments accounted for Victorian benchmark of 95%.
just 3.7% of occupied dwellings, while semi-detached
• People who help as volunteer: 20% of residents
dwellings accounted for 11.1% of dwellings.
of Greater Geelong stated that they volunteer in
In 2016 dwellings in Greater Geelong were most likely local groups which was similar to the Victorian
to contain three-bedrooms (47.8%), compared to the benchmark of 19%.
Victorian average (41.8%). In Greater Geelong, 2.2%
• Access to community services and resources: access
of dwellings were considered to require an additional
to community services and resources was higher
bedroom (based on the ABS definition – refer Glossary)
in Greater Geelong, with 89% indicating they had
which was below the State average of 3.9%; however,
access to good community services and resources
81.0% of dwellings are considered to have bedrooms
compared with the Victorian average of 85%.
spare, which was higher than the State average of
75.5%. • People who rated their community as an active
community: 81% of Greater Geelong residents
SOCIAL HOUSING considered themselves to be active in the
Social housing is made up of two types of housing, community and have an interest in local issues
public housing and community housing. It is for people compared to the Victorian average of 82%.
on low incomes who need housing, especially those Geelong provides a range of local and regional
who have recently experienced homelessness, family community, health and educational facilities and
violence or have other special needs. Public housing is services to the broader G21 region. The Barwon Health
a form of long-term rental social housing managed by network, and its associated hospitals in Geelong, is a
the State Government. Community housing is secure, major provider of health services in the region.
affordable, long term rental housing managed by not-
for-profit organisations for people on low incomes or
with special needs.
In 2016 an estimated 3,310 dwellings were occupied
through the public housing system in the Greater
Geelong, representing a 13.6% share of all rental
dwellings. This share was higher than the Victorian
average of 10.1%.
143.0 PLACE
3.7 TRANSPORT
PUBLIC TRANSPORT
The Department of Health and Human Services In 2016/17 patronage on the Geelong line amounted to
(DHHS) LGA profiles 2015, provides estimates of the 7.62 million, having almost doubled from 3.89 million
proportion of residents who live within 400m of a in 2012/13. Figures for the Geelong line show patronage
public transport network. Greater Geelong residents increased further in 2017/18 to 8.67 million.
have a relatively high level of access to public transport,
with 76.9% of residents living within 400m (the
Victorian average was 73.9%). This access is influenced RELEVANT DATA TABLES
by the critical mass of population within Greater
NO. DESCRIPTION
Geelong’s urban areas, which supports public transport
services. 1.1 Population density (2017)
1.2 Median monthly housing loan repayment (2006-16)
PRIVATE MOTOR VEHICLES
1.3 Monthly housing loan repayment (2016)
Motor vehicle ownership in Greater Geelong for 2016
1.4 Households experiencing mortgage stress (2016)
was generally in-line with Victoria, with a slightly
higher proportion of households owning two vehicles 1.5 Median weekly rent (2006-16)
(Greater Geelong: 39.6%; Vic: 37.9%), and a slightly 1.6 Weekly rent (2016)
lower proportion of household owning three or more 1.7 Affordable rental housing (March 2017)
vehicles (Greater Geelong: 17.3%; Vic: 18.3%).
1.8 Households experiencing rental stress (2016)
In total, 56.9% of Greater Geelong households own two 1.9 Occupied private dwellings by dwelling structure (2016)
or more vehicles compared to the Victoria average of
1.10 Bedrooms in occupied private dwellings - number (2006-16)
56.1%. Car ownership in Greater Geelong has increased
since 2006, with the proportion of household owning 1.11 Bedrooms in occupied private
dwellings - proportion (2006-16)
two vehicles rising from 53.9% to 56.3% over the period.
1.12 Unoccupied private dwellings - change 2006-16
Greater Geelong residents primarily use motor vehicles
as a driver or passenger as their mode of transport to 1.13 Unoccupied private dwellings (2006-16)
work according to the ABS 2016 Census, with motor 1.14 Tenure type (2006-16)
vehicles providing the transportation for 75.0% of 1.15 Landlord type (no.) - rented occupied private dwellings (2016)
employed persons. This share is above the Victorian
1.16 Landlord type (%) - rented occupied private dwellings (2016)
average of 67.7%.
1.17 Population aged 70+ in residential aged care (June 2016)
Compared to the Victorian average, employed residents
1.18 Population aged 70+ in community aged care (June 2011)
were more likely to travel to work by bus (Greater
Geelong: 1.3%; Vic: 1.1%) but less likely to travel by 1.19 Housing suitability (2016)
train (Greater Geelong: 2.1%; Vic: 5.8%), travel by 1.20 Indicators of community strength (%) (2008-15)
bicycle (Greater Geelong: 0.8%; Vic: 1.3%) or walk to 1.21 More indicators of community strength (%) (2008-15)
work (Greater Geelong: 2.6%; Vic: 3.2%).
1.22 Access to services summary data (2015)
GROWTH IN GEELONG LINE TRAIN PATRONAGE 1.23 Internet connection (2006-16)
Strong population growth throughout Greater Geelong 1.24 Internet connection by indigenous status of household (2016)
and improved linkages with metropolitan Melbourne 1.25 Method of travel to work (2006-16)
have contributed to a significant increase in the
1.26 Number of persons living* in G21 LGA’s and
number of rail patrons on the Geelong V/Line train working in Greater Melbourne (2016)
line. According to data published in the V/Line Annual
1.27 Number of persons living* in Greater Melbourne
Report 2016/17, between 2012/13 and 2016/17 rail and working in G21 LGA’s (2016)
patronage on the Geelong line increased by an average
1.28 Population who live near public transport (2015)
18.3% per annum. This compares to a 7.2% per annum
increase on the Ballarat line, 1.7% per annum increase 1.29 Number of motor vehicles per dwelling (2006-16)
on the Seymour line, and declines in patronage on the 1.30 V/Line rail patronage by line (2012/13-16/17)
Bendigo and Traralgon lines.
15PEOPLE 16
4.0 PEOPLE

KEY STATISTICS
MEASURE								GREATER GEELONG		VICTORIA

POPULATION

►► 2017 ESTIMATED RESIDENT POPULATION					244,790
►► AVERAGE ANNUAL POPULATION GROWTH RATE (2006-17)			                  1.8%
►► MEDIAN AGE								40				37
►► % POPULATION AGED 65 YEARS OR OVER (2016)				                       18.6%				   15.6%
►► SAME-SEX COUPLES							0.7%				1.0%
►► FAMILIES WITH CHILDREN							42.6%				47.0%
►► COUPLES WITH NO CHILDREN						38.9%				36.0%
►► ONE PARENT FAMILIES							17.1%				15.1%
►► INDIGENOUS PERSONS							1.0%				0.8%
►► NEW SETTLERS TO AUSTRALIA (PER 100,000 PERSONS, 2015)			            279				     683
►► POPULATION BORN IN AUSTRALIA (2016)					80.6%				64.9%

SOCIO-ECONOMICS

►► SEIFA SCORE (IRSD)							994
►► MEDIAN WEEKLY PERSONAL INCOME (2016)					$600				$644
►► YEAR 12 COMPLETION RATE						50.9%				59.4%
►► POST-SCHOOL QUALIFICATIONS						49.2%				50.5%
►► UNEMPLOYMENT RATE (DECEMBER 2017)					6.4%				6.0%
►► LABOUR FORCE PARTICIPATION RATE					61.6%				64.5%
►► HOMELESSNESS SA3 GEOGRAPHIC AREA (2016)				0.4%				0.4%

SAFETY

►► PERCEPTION OF SAFETY DAY						96.0%				92.5%
►► PERCEPTION OF SAFETY NIGHT						54.8%				55.1%
►► FAMILY VIOLENCE INCIDENT RATE (PER 100,000 PERSONS, APRIL 2018)		   1,274				   1,165

HEALTH

►► EXCELLENT/VERY GOOD SELF-REPORTED HEALTH				45.8%				40.2%
►► PREMATURE DEATHS (PER 100,000 PERSONS)					250				259
►► CURRENT SMOKER (2014)							12.2%				13.1%
►► CONSUMES ≥ FIVE SERVES OF VEGETABLES & FRUIT PER DAY			             9.4%				    7.4%
►► TAKES SUFFICIENT PHYSICAL ACTIVITY					41.2%				41.4%
►► CONSUMES ALCOHOL AT RISKY OR HIGH-RISK LEVELS – SHORT TERM		        44.9%				   42.5%
►► CONSUMES ALCOHOL AT RISKY OR HIGH-RISK LEVELS – LONG TERM		         58.2%				   59.2%
►► DAILY CONSUMPTION OF SOFT DRINK					15.3%				12.4%
►► OVERWEIGHT MALES							42.4%				38.4%
►► OVERWEIGHT FEMALES							22.9%				24.3%
►► OBESE MALES								16.3%				20.4%
►► OBESE FEMALES							16.9%				17.2%
Note: Data collected from a range of sources
                                                                                           17
4.0 PEOPLE 4.1 POPULATION GROWTH TRENDS & FORECASTS POPULATION GROWTH POPULATION GROWTH COMPARISONS In 2017, Greater Geelong had an estimated population WITH MELBOURNE’S GROWTH AREAS AND of approximately 244,789 persons, which accounts VICTORIA’S REGIONAL CITIES for 76% of the G21 region’s population. The majority Between 2011 and 2017 Greater Geelong’s population (67.2% or 164,389 persons) reside in the urban area of increased by approximately 28,960 persons. The level Geelong (UCL). of population growth is comparable with some of Population growth in recent years has broadly been Melbourne’s growth area municipalities. For instance, in line with the average for Victoria, with Greater population growth in Greater Geelong over this period Geelong’s population increasing by 2.1% per annum was greater than that which occurred in Cardinia Shire between 2011 and 2017. By comparison, Victoria’s (26,690 residents) but less than the City of Melton population increased by 2.2% per annum over this (36,250 residents). period. Compared to Victoria’s regional cities, Greater In recent years, the SA2s experiencing the most Geelong’s population growth over the period 2011 significant population growth within Greater Geelong to 2017 was almost three times higher than Greater include Ocean Grove–Barwon Heads (6,440 residents Bendigo which increased 11,620 residents and was between 2011 and 2017), Grovedale (5,420 residents), the second fastest growing regional city in population Lara (3,340 residents), Leopold (3,160 residents) and terms. Highton (3,150 residents). GREATER GEELONG ESTIMATED RESIDENT POPULATION TRENDS (2006-17) ABS, Regional Population Growth, Cat No. 3218.0 18
4.0 PEOPLE

POPULATION PROJECTIONS                                       A comparison of the Greater Geelong age structure in
                                                             2016 compared to Victoria is provided below:
The Geelong Region Plan: A Sustainable Growth Strategy
forecast the population for the G21 region of 500,000        •   0-19 years: Greater Geelong (24.3%) had a similar
persons by 2051. Directions for accommodating the                proportion compared to the Victorian average
expected increase in population within the region                (24.3%).
are set out in the G21 Regional Growth Plan, taking          •   20-34 years: Greater Geelong (19.4%) had a lower
into account the need for changes to infrastructure,             proportion compared to the Victorian average
land supply and other factors to maintain the region’s           (22.0%).
character through these changes. It is expected that         •   35-54 years: Greater Geelong (25.4%) had a similar
population growth in Greater Geelong will continue to            proportion compared to the Victorian average
be the main driver for overall population growth in the          (26.8%).
G21 region.                                                  •   55-74 years: Greater Geelong (22.5%) had a higher
Demographic and spatial consultants .id prepare                  proportion compared to the Victorian average
population projections through to 2036. Population               (20.0%).
numbers for the 2016 base year are derived from              •   75+ years: Greater Geelong (8.5%) had a higher
Estimated Resident Population from the Australian                proportion compared to the Victorian average
Bureau of Statistics. A series of further factors are            (7.0%).
considered in determining population projections.
These include demographic changes such as births,
                                                             4.3 GENDER DISTRIBUTION
deaths and migration rates applied to the base               Greater Geelong’s population comprised a greater
population. At the same time, scrutiny of urban              proportion of females and a lower proportion of males
development drivers is undertaken (residential               compared to the Victorian average in 2016. Greater
development opportunities, vacancy rates, etc.). The         Geelong had a distribution of 48.5% males and 51.5%
combination of varied assumptions about these inputs         females, and this compares to 49.1% males and 50.9%
results in the forecast population. The .id projections      of females throughout Victoria in 2016.
indicate that in percentage terms, Greater Geelong
                                                             The higher proportion of females in Greater Geelong
has an average annual population growth of 1.57%,
                                                             begins in the 25-34 age group. In younger cohorts (0-24
equating to an increase of 87,174 people between 2016
                                                             years) males have a higher share of population for all
and 2036. At the time of publication, the City of Greater
                                                             age groups. Throughout Victoria, this shift in gender-
Geelong were updating population and dwelling
                                                             specific age structure also occurs in the mid-20s age
forecasts to 2041 (see: https://forcast.id.com.au/geelong)
                                                             cohorts.
The continued development of greenfield residential
areas in Armstrong Creek and the future western              4.4 LESBIAN, GAY, BISEXUAL, TRANS/
and northern residential growth fronts on the urban          TRANSGENDER & INTERSEX (LGBTI)
edges of Geelong are expected to support high rates of
                                                             PEOPLE
residential development and population growth.
                                                             In 2016, the ABS Census recorded approximately 700
Greater Geelong is forecast to experience almost
                                                             same-sex couples in Greater Geelong, accounting for
double the growth in population compared to Greater
                                                             0.7% of all couples. This figure compares to 1.0% of all
Bendigo, which is the next fastest growing regional city.
                                                             couples in Victoria. Overall, little variation is evident
The forecast population growth over the 2016 to 2031
                                                             within the G21 region of those identifying as same-
period is also comparable with Cardinia Shire, one of
                                                             sex couples in ABS Census data, ranging from 0.5%
metropolitan Melbourne residential growth areas.
                                                             in Golden Plains to 0.7% in Greater Geelong and Surf
                                                             Coast. Due to its large population in a regional context,
4.2 AGE STRUCTURE                                            Greater Geelong accounts for the majority of same-sex
Greater Geelong has an older population than the             couples in the G21 region (77%).
Victorian benchmark. In 2016 the median age of
                                                             A significant increase in the number and share of
Greater Geelong residents was 40 years, which was
                                                             couples identifying as a same-sex couple has occurred
above the median for Victoria (37 years) and slightly
                                                             over the past decade, with the number of persons in
below the median age for the G21 region (41 years).
                                                             same-sex couples in the Greater Geelong more than
                                                             doubling from approximately 300 couples in 2006. The
                                                             share of same-sex couples in Greater Geelong increased
                                                             from 0.3% in 2006 to 0.7% in 2016.

                                                                                                                    19
4.0 PEOPLE
This data takes into account same-sex couples within attributable to the change in the number of people who
the same household and does not account for same-sex identify as indigenous in the census.
couples living in different households.
In broad terms, the age profile of the Greater Geelong
Indigenous population is younger than the total
4.5 FAMILY STRUCTURE population, with 66% aged under 35 years, compared
In 2016 families with children accounted for the to 44% of the total Greater Geelong population. This
highest share of families in Greater Geelong (42.6%) trend is also reflected State-wide.
although this was below the Victorian and G21 averages
(Vic: 47.0%. G21: 43.4%). Families with no children 4.7 CULTURAL DIVERSITY
accounted for 38.9% of families, which was above the
The majority of people who live in Greater Geelong
Victorian average of 36.0% but below the G21 average of
were born in Australia, accounting for 77.1% of the
39.4%.
population in 2016. This figure is higher than the
Compared to the Victorian average, Greater Geelong Victorian average of 64.9%.
had a greater proportion of single-parent families
In 2016, after Australia, the next most common
(Greater Geelong: 17.1%; Vic: 15.1%; G21: 15.8%), and
countries of birth for Greater Geelong residents were
other families (Greater Geelong: 1.5%; Vic: 1.4%; G21:
the England (3.4% of residents), India (1.0%) and New
1.9%).
Zealand (1.0%). No other country of origin contributed
4.6 INDIGENOUS POPULATION more than 1.0% of residents. The majority of Greater
Geelong residents speak English with only 1.7% stating
The traditional owners of the Geelong area are the
they did not speak English well or not at all in 2016;
Wadawurrung people. In 2016 Greater Geelong had an
throughout Victoria, this share was 4.5%.
Indigenous population of approximately 2,410 persons
having increased from approximately 1,790 persons in In 2015, the rate of new settlers (from overseas) in
2011. The Indigenous population accounted for 1.0% of Greater Geelong was 279 per 100,000 population, which
the total population in Greater Geelong, which is above was 87% higher than the regional Victorian average of
the Victorian average of 0.8%. 149 per 100,000 people but lower than the average for
Victoria of 683 per 100,000 people. According to DHHS
Growth in the indigenous population in Greater
LGA Profile data, 29.5% of new settlers in 2015 arrived
Geelong between 2011 and 2016 amounted to 35%
through the humanitarian stream, higher than the
(or approximately 620 persons), although it cannot
average for Victoria of 9.3%.
be determined how much, if any, of this increase, is
FAMILY STRUCTURE (2016)
ABS, Census of Population and Housing, 2016
204.0 PEOPLE
RELIGION 4.9 INCOME
Christianity is the most common religious affiliation
Collectively, Greater Geelong residents in 2016 had
among Greater Geelong residents (Greater Geelong:
comparably low median incomes compared with
53.0%; Vic: 47.9%), followed by Islam and Buddhism
Victorian benchmarks:
(1.1% and 1.0%, respectively), with 34.1% of people
stating they had no religious affiliation. • Median personal income (weekly): Median
personal income of Greater Geelong residents was
4.8 INDEX OF RELATIVE SOCIO- approximately $600/week, which was 6.8% below
ECONOMIC DISADVANTAGE (IRSD) the median for Victoria of $640/week. The median
personal income of Greater Geelong residents was
The Socio-Economics Indexes for Areas (SEIFA) the second lowest of all G21 LGAs.
index of relative socio-economic disadvantage (IRSD)
• Median household incomes (weekly): Median
summarise a range of information about the economic
household incomes of Greater Geelong households
and social conditions of people and households within
($1,240/week) were also the second lowest among
an area. The index provides a useful snapshot of the
G21 LGAs and were 12.4% below the median for
area’s relative socio-economic disadvantage.
Victoria ($1,420/week).
IRSD scores for the G21 region in 2016 indicate that • Above average levels of income growth: Both
Greater Geelong (994) has a near average level of socio- median personal and household incomes
economic disadvantage, with Greater Geelong being experienced average annual growth between 2006
at the 51st percentile in Victoria. However, the level and 2016, in-line with the Victorian averages.
of socio-economic disadvantage varies significantly Median personal incomes increased by 4.0% per
within Greater Geelong. For instance, Norlane and annum between 2006 and 2016 (Vic: 3.5% per
Corio are both at the 1st state percentile in regard to annum) and median household income increased
socio-economic disadvantage, meaning they are among by 3.4% per annum (Vic: 3.3% per annum).
the most disadvantaged communities in Victoria.
Greater Geelong residents are also more likely to be
Conversely, Point Lonsdale (88th percentile) and Ocean receiving all of the main types of Centrelink benefits
Grove (81st percentile) are considered to have relatively than the Victorian average.
low levels of disadvantage.
SELECTED CENTRELINK PAYMENT (MARCH 2018)
Centrelink
214.0 PEOPLE
4.10 EDUCATION
YEAR 12 COMPLETION SCHOOL LEAVERS
Compared to the Victorian average, Greater Geelong On Track is a survey undertaken one-year post
has a low share of the population whose highest year schooling by the Department of Education and
of completed secondary schooling was Year 12. 50.9% Training (DET) which records the primary activity in
of the Greater Geelong population (aged 15 years and which a former student is engaged.
over) have completed Year 12 compared to 59.4% for
The results of the 2016 On Track Survey indicates the
Victoria and 50.6% for the G21 region. However, the
following in relation to persons who completed Year 12
proportion of the population who complete Year 12 in
in 2016:
Greater Geelong has increased from 40.1% in 2006.
• Low share of school leavers remained in education
Educational attainment for the Greater Geelong
with 70% from Greater Geelong school leavers
Indigenous population (aged 15 years and over) was
continuing their education post-secondary school.
below that of the total population, with 37.9% of the
The average for Victoria was 75%.
Indigenous population (aged 15 years and over) having
completed Year 12. • Low share of school leavers enrolled in university
with 51% of Greater Geelong school leavers
POST-SCHOOL QUALIFICATIONS enrolled in university compared to 54% for Victoria.
Regarding post-school qualifications, 49.2% of Greater • High share of school leavers employed in full-time
Geelong residents (aged 15 years or older) stated they and part-time work accounting for 25% of school
had Certificate level or higher, broadly in line with the leavers in Greater Geelong compared to 20% for
average for Victoria of 50.4% and the G21 region of Victoria.
49.7%. • Part-time employment accounts for a high share of
school leavers in employment, accounting for 16%
By gender, 51.7% of Greater Geelong males indicated
of Greater Geelong school leavers compared to 13%
they held a Certificate level or higher qualification,
for Victoria.
compared with 46.9% of Greater Geelong females. Both
genders were below their Victorian averages (Males:
52.4%; Females: 48.6%).
POST-SCHOOL QUALIFICATIONS (2016) (% OF PERSONS 15 YEARS+)
Census of Population and Housing 2016, ABS
224.0 PEOPLE
4.11 EMPLOYMENT CHARACTERISTICS
In December 2017 Greater Geelong had approximately • Corio-Norlane, with an unemployment rate of
7,930 unemployed persons and an unemployment rate 19.2%
of 6.4%, which is above the Victorian average of 6.0%. • Newcomb-Moolap, with an unemployment rate of
The number of unemployed persons had remained 10.2%
relatively stable over the 12-months since December
• Portarlington, with an unemployment rate of 8.4%
2016, when approximately 7,980 persons were
unemployed, and the unemployment rate was 6.5%. • Geelong North-Bell Park, with an unemployment
rate of 7.8%.
However, areas exist within Greater Geelong where
This data is based on information contained in the
high rates of unemployment are prevalent. In
Small Area Labour Market (SALM) publications
December 2017 the following SA2s had a considerably
prepared by the Department of Jobs and Small
higher rate of unemployment compared to the Greater
Business (DJSB).
Geelong average:
UNEMPLOYMENT RATE
UNEMPLOYMENT RATE (MARCH 2018)
DJSB, Small Area Labour Markets, Quarterly 234.0 PEOPLE
LABOUR FORCE PARTICIPATION OCCUPATION
The labour force includes those currently employed In 2016, workers in Greater Geelong were more likely to
and those looking for work (or unemployed), and the be employed as:
labour force participation rate is the share of the labour
• Professionals - 20.8% (Regional Vic: 17.4%; Vic:
force as a percentage of the total population aged 15
23.2%);
years or over.
• Technicians and Trade workers - 15.0% (Regional
Based on ABS Census data for 2016, the labour force
Vic: 14.8%; Vic: 13.1%); and
participation rate for Greater Geelong was 61.6%,
which is slightly below the G21 region average of 62.3% • Community and Personal Service Workers - 12.9%
and the Victorian average of 64.5%. (Regional Vic: 11.7%: Vic: 10.6%).
The labour force participation rate in Greater Geelong Conversely, Greater Geelong workers were less likely to
has increased by 0.8% percentage-point since 2006 be employed in the following occupations:
from 60.8%. This compares to a 0.1 percentage-
• Machinery Operators and Drivers 6.0% (Regional
point increase in the labour force participation rate
Vic: 6.5%; Vic: 5.8%);
throughout Victoria.
• Labourers 10.3% (Regional Vic: 12.4%; Vic: 9.0%);
and
PART-TIME EMPLOYMENT
• Sales workers 10.5% (Regional Vic: 9.7%; Vic:
In 2016 employed Greater Geelong residents were
9.7%).
more likely to work part-time compared to the Victoria
average (Greater Geelong: 39.6%; Vic: 35.5%) and less
likely to work full-time (Greater Geelong: 57.0%; Vic:
64.5%).
There was a greater proportion of women employed
part-time in Greater Geelong compared to the Victorian
average (Greater Geelong: 57.0%; Vic: 50.5%); while
men working part-time was broadly in-line with the
Victorian average (Greater Geelong: 23.3%; Vic: 22.3%).
OCCUPATION OF EMPLOYED PERSONS
Department of jobs and Small Buisness, Small Area Labour Markets, Quarterly
244.0 PEOPLE
4.12 YOUTH ENGAGEMENT 4.13 HOMELESSNESS
Youth engagement is a measure of the share of persons According to the 2016 ABS Census, the number of
aged 15-19 years who are either working or studying (or homeless persons in Greater Geelong increased from
both). In Greater Geelong, youth engagement is slightly 630 persons in 2011 to 750 persons in 2016. Belmont
below the average for Victoria. In 2016, 82.0% of youths (SA2), Corio – Norlane (SA2) and Grovedale (SA2) all
in Greater Geelong (15-19 years old) were considered had over 100 homeless persons in the region in 2016.
to be fully engaged compared to 84.2% for Victoria.
In 2016, homeless persons accounted for 0.3% of the
Youth engagement in Greater Geelong comprised the
total Greater Geelong population, which is in-line with
following:
the share across the whole G21 region and lower than
• 46.6% were studying full-time the Victorian average of 0.4%.
• 25.6% were working part-time and studying full- More detailed analysis of homelessness is available at
time the SA3 level, with sub-categories that include not just
• 4.1% were working full-time homelessness but near-homelessness, such as persons
• 1.6% were working full-time and studying part-time in supported accommodation for the homeless; persons
in other temporary lodgings; and persons living in
• 1.3% were working part-time and studying part-
other crowded dwellings. The SA3’s relevant to Greater
time
Geelong is the Geelong (SA3), and parts of Barwon-
• 0.4% were working full-time and studying full-time. West (SA3) and Surf Coast – Bellarine Peninsula (SA3).
A slight decline in youth engagement is evident in
Based on ABS data for Geelong (SA3), the overall level
Greater Geelong over recent years, falling from 82.3%
of homelessness and the extent to which people are
in 2011 to 82.0% in 2016. This contrasts with the trend
considered to be at risk of homelessness is below the
experienced throughout Victoria, where the share of
Victorian benchmarks. For instance, an estimated
fully engaged young people increased from 83.8% to
1,140 persons are considered to be either homeless or
84.2% over the period.
at risk of homelessness, and this represents 0.6% of the
population compared to 1.2% for Victoria.
% OF YOUNG PEOPLE (15-19 YEARS) FULLY ENGAGED
ABS, Census of Population and Houing, 2016
252012/13 2016/17 Change 2012/13 2016/17 Change 2012/13 2016/17 Change
Queenscliffe 47 30 -36.2% $1.5m $1.3m -15.2% $539.30 $508.11 -5.8%
G21 Region 1,591 1,519 -4.5% $119.7m $125.8m 5.1% $542.62 $555.50 2.4%
4.0 PEOPLE26,068
Victoria 26,365 1.1% $2,490.5m $2,609.5m 4.8% $549.50 $541.86 -1.4%
No. of EGMS Total Net Expenditure Net EGM Expenditure per Adult
Region
2012/13 2016/17 Change 2012/13 2016/17 Change 2012/13 2016/17 Change
Colac Otway 110 110 0.0% $7.1m $7.5m 4.9% $406.27 $472.86 16.4%
G21 Region 1,591 1,519 -4.5% $119.7m $125.8m 5.1% $542.62 $555.50 2.4%
Victoria 26,068 26,365 1.1% $2,490.5m $2,609.5m 4.8% $549.50 $541.86 -1.4%
OVERVIEW OF ELECTRONIC GAMING MACHINE PROVISION AND EXPENDITURE, 2012/13 AND 2016/17
No. of EGMS Total Net Expenditure Net EGM Expenditure per Adult
Region
2012/13 2016/17 Change 2012/13 2016/17 Change 2012/13 2016/17 Change
Greater Geelong 1,275 1,265 1.0% $117.5m $113.6m 0.9% $623.00 $614.72 0.9%
G21 Region 1,591 1,519 -4.5% $119.7m $125.8m 5.1% $542.62 $555.50 2.4%
Victoria 26,068 26,365 1.1% $2,490.5m $2,609.5m 4.8% $549.50 $541.86 -1.4%
Victorian Commission for Gambling and Liquor Regulation, Electronic Gaming Machine LGA Level Expenditure, 2012/13 and 2016/17
4.14 GAMBLING In its statistical reports, Victoria Police use the term
“Family Incident” while the Victorian Family Violence
Greater Geelong had 26 gaming machine venues in Database (which uses Victoria Police data) uses the
2018, the same as in 2017. The number of Electronic term “Family Violence Incident”. These terms refer to
Gaming Machines (EGM) remained increased from the same incidents (as defined above). The statistics
1,265 in 2016/17 to 1,275 in 2017/18. The provision of that follow are for any family violence incidents
EGMs for 2018 is 7.0 per 1,000 persons in Greater attended by Victoria Police and may or may not involve
Geelong compared to the Victorian ratio of 5.0 per violence and may not result in charges being laid.
1,000 persons.
The Family Violence incident rate in Greater Geelong
Net gaming machine expenditure in Greater Geelong was 1,274 incidents per 100,000 persons for the 12
for 2018 was $117.5 million, which represents an average months to April 2018, which was above the average rate
of approximately $623.0 per adult aged 18 years or over for Victoria of 1,165 incidents per 100,000 persons. The
while the Victorian average was $534 per capita. rate at which Family Violence incidences have occurred
has increased by 8.5 per cent since 2012/13 when these
4.15 CRIME & SAFETY incidences occurred at a rate of 1,174 incidents per
100,000 persons in Greater Geelong. This increase can
CRIME partly be attributed to efforts made by advocacy groups,
Crime levels fluctuate considerably throughout the G21 promoting the reporting of these incidents to Police
region. However, Greater Geelong has crime rates (per resulting in higher numbers of recorded call outs.
100,000 persons) above the Victorian average for the The above trends are also reflected in the rate of these
following categories: incidents where charges were laid. In the 12 months
• Crimes against the person: Greater Geelong: 1,361; to April 2018, the rate where charges were laid was 589
Vic: 1,301 incidents per 100,000 persons in Greater Geelong,
and this has increased from 505 incidents per 100,000
• Crimes against property: Greater Geelong: 6,121;
persons in 2012/13.
Vic: 4,707
• Other crime: Greater Geelong: 1,740; Vic: 1,721. The most common age of victims was between 30-
39 years with this age cohort accounting for 25.5%
• Drug Offences: Greater Geelong 469; Vic 458.
of victims in Greater Geelong. The most common
FAMILY VIOLENCE relationship between victim and perpetrator was
Family Violence is defined in the Victorian Police ‘Family’ which involved 37.0% of incidents, followed by
Code of Practice for Investigation of Family Violence in ‘current partner’ with 32.7% and ‘former partner’ with
accordance with the Family Violence Protection Act 30.0%.
(2008). In the Code, family violence is defined as “any
behaviour, whether a criminal offence or not, that in
PERCEPTION OF SAFETY IN THE COMMUNITY
any way controls or dominates a family member and Having regard for findings in the 2015 VicHealth
causes them to feel fear for their own, or other family Indicators Survey, Greater Geelong residents have a
members’ safety or well-being. It includes violent, similar perception of safety to the rest of the state, with
threatening, coercive or controlling behaviour that 54.8% of respondents stating the felt safe walking alone
occurs in a current or former family, domestic or at night and 96.0% of respondents stating they feel safe
intimate relationship. Family means any family or walking alone during the day; the average for Victoria
family-like relationship, including current and former was 55.1% and 92.5% respectively.
intimate partners, relatives, same-sex partners and
carers”.
26ALCOHOL-RELATED ASSAULTS or deaths sustained from assaults and traffic
accidents. Data from 2014-15 indicates that
Alcohol-related assault in Greater Geelong were residents of Greater Geelong had a lower incidence
recorded at a rate of approximately 113 per 100,000 of alcohol-related hospital admissions than the
persons, slightly below the Victorian rate of 114 per State average (Greater Geelong: 35.5 per 10,000; Vic:
100,000 persons. 55.0 per 10,000).
• Nutrition: Daily consumption of soft drink was
4.16 HEALTH BEHAVIOURS more prevalent in Greater Geelong compared to the
An overview of the extent of unhealthy behaviours average for Victoria (Greater Geelong: 15.3%; Vic:
or chronic disease risk factors of Greater Geelong 12.4%). However, Greater Geelong residents were
residents is provided below: more likely to consume at least three serves of fruit
and vegetables a day compared with the average
• Smoking: Rates of smoking in Greater Geelong
Victorian (Greater Geelong: 37.0%; Vic: 33.9%).
were recorded at 12.2% of the population in 2014,
which was below the State average of 13.1%. • Physical Activity: The proportion of people that
undertook sufficient physical activity was slightly
• Alcohol Consumption: High or risky levels of
lower in Greater Geelong than the Victorian
alcohol consumption related to short-term harm
average (Greater Geelong: 41.2%; Vic: 41.4%).
was higher in Greater Geelong than the Victorian
average (Greater Geelong: 44.9%; Vic: 42.5%). • Obesity: In 2014, obesity in the Greater Geelong
However, long-term alcohol consumption-related male population was less prevalent compared
risky behaviour was lower for Greater Geelong than with the Victorian male average (Greater Geelong:
Victoria (Greater Geelong; 58.2%; Vic: 59.2%). 16.3%; Vic: 20.4%). A lower prevalence of obesity
also existed among the female population
• Drug & Alcohol Patients: In 2014, 5.9 persons per
compared to the Victorian female average (Greater
1,000 population in the Greater Geelong region
Geelong: 16.9%; Vic: 17.2%).
were engaged in some form of treatment program.
This was above the State average of 5.0 per 1,000 • Sun Protective Behaviour: Greater Geelong
population. residents were more likely to wear hats (Greater
Geelong: 54.7%; Vic: 52.6%) and to usually wear
• Alcohol-related Harm: High levels of alcohol
sunglasses (Greater Geelong: 83.5%; Vic: 74.0%).
consumption can lead to various types of alcohol-
related harm, including alcohol-related injuries
274.0 PEOPLE
4.17 SCREENING, HEALTH CHECKS 4.18 HEALTH STATUS
& ACCESS
SELF-REPORTED HEALTH
In general terms, the prevalence of health checks
The Victorian Population Health Survey provides
among Greater Geelong residents varies compared
estimates of self-reported health. Greater Geelong
to the Victorian averages. For instance, screening for
has a relatively high level of self-reported health with
cervical and bowel cancers is undertaken at a greater
45.8% of survey respondents reporting that they were
rate than the Victorian average while screening for
in ‘Excellent/Very good’ health which is above the
breast cancer among women was below the Victorian
regional Victorian average of 41.2% and the Victoria
average. An overview of the prevalence of health checks
average of 40.2%.
and screening for Greater Geelong is described below:
• Breast cancer screening: Breast cancer screening SELECTED CHRONIC DISEASES
rate in Greater Geelong for females aged between
The 2014 Victorian Population Health Survey provides
50-69 years was below the Victorian average for
the latest data at the LGA level for chronic diseases.
females (Greater Geelong: 81.1%; Vic: 83.8%).
A comparative overview of the Greater Geelong
• Cervical Cancer Screening: The participation of prevalence of selected chronic diseases in 2014
Greater Geelong residents in cervical cancer testing compared to the Victorian average is described below:
in the two years to 2015 is greater than the State
• Heart Disease: Greater Geelong had a lower
average (Greater Geelong: 61.9%; Vic: 57.9%).
incidence compared to the Victorian average
• Bowel Cancer Screening: Greater Geelong
(Greater Geelong: 5.4%; Vic: 7.2%).
residents are more likely to have undergone bowel
• Stroke: Greater Geelong had a higher incidence
cancer testing in the two years prior to 2015 than
compared to the Victorian average (Greater
the Victorian average (Greater Geelong: 40.3%; Vic:
Geelong: 3.2%; Vic: 2.4%).
37.2%).
• Cancer: Greater Geelong had a lower incidence
• Other Health Checks: For a selection of other
compared to the Victorian average (Greater
health checks, the results for Greater Geelong
Geelong: 4.9%; Vic: 7.4%).
varied in comparison to the Victorian average. For
instance: • Osteoporosis: Greater Geelong had a higher
incidence compared to the Victorian average
- Blood pressure checks were more common in
(Greater Geelong: 6.2%; Vic: 5.2%).
the two years to 2014 (Greater Geelong: 86.3%; Vic:
79.9%) • Arthritis: Greater Geelong had a lower incidence
compared to the Victorian average (Greater
- Cholesterol checks were less common in the
Geelong: 18.8%; Vic: 19.8%).
two years to 2014 (Greater Geelong: 58.8%; Vic:
59.5%) • Anxiety or Depression: Greater Geelong had a
higher incidence compared to the Victorian average
- Blood glucose checks were less common in the
(Greater Geelong: 32.3%; Vic: 24.2%).
two years to 2014 (Greater Geelong: 51.5%; Vic:
53.1%). • Sought help for a mental health problem in the
previous year: Greater Geelong had a higher
• GP Attendance: Greater Geelong residents had
incidence compared to the Victorian average
higher rates of GP services delivered to males (4.8
(Greater Geelong: 22.1%; Vic: 16.0%).
GP attendances per persons) and females (6.6)
compared state averages (males: 4.6; females: 6.3). • Type 2 Diabetes: Greater Geelong had a lower
incidence compared to the Victorian average
(Greater Geelong: 5.0%; Vic: 5.3%).
The 2014 Victorian Population Health Survey data
showed that Greater Geelong had the highest
prevalence of Stroke, Osteoporosis and Anxiety/
Depression of all LGAs within the G21 region. However,
the prevalence of Heart Disease and Cancer was the
lowest within their respective categories compared to
other LGAs in the G21 region.
284.0 PEOPLE
ADMISSION FOR AMBULATORY CARE ROAD ACCIDENTS
SENSITIVE CONDITIONS (ACSC) Over a four-year period to 25 June 2018, a total of 71
Ambulatory Care Sensitive Conditions (ACSCs) road accident fatalities were recorded in the G21 region,
are those for which hospitalisation is thought to comprising 58 males (82%) and 13 females (18%).
be avoidable with the application of public health Greater Geelong had the most fatal accidents (30).
interventions and early disease management, usually
delivered in an ambulatory setting such as primary PREMATURE DEATH RATES
care. High rates of hospital admissions for ACSCs may Premature death (i.e. death prior to reaching life
provide indirect evidence of problems with patient expectancy) is measured by the Social Health Atlas for
access to primary healthcare, inadequate skills and Australian LGA and broader regions. Greater Geelong
resources, or disconnection with specialist services had the second highest rate of premature deaths among
(Department of Health, Victoria Health Information all G21 LGAs for males (311.1 premature deaths per
Surveillance System, 2014). 100,000 persons) and females (189.4). The average
Acute ACSCs include diseases such as dehydration/ rate of premature death at the State level was 251 per
gastro, kidney infection, perforated ulcer, cellulitis, 100,000 males and 157 per 100,000 females.
pelvic inflammatory disease, ear, nose and throat
(ENT) infections and dental conditions. Chronic 4.19 HEALTH SERVICES
ACSCs include diseases such as selected chronic In broad terms, Greater Geelong is reasonably well-
diseases such as diabetes, asthma, angina, serviced by general practitioners (GPs) and aged care
hypertension, congestive heart failure and chronic facilities. However, the provision of medical and health
obstructive pulmonary disease (COPD). specialists is slightly below the benchmark for Victoria.
In 2015-16, ACSCs in the Greater Geelong were similar
than the Victorian average for all categories. Detailed GENERAL PRACTITIONER PROVISION
breakdowns of ACSCs by type, as well as hospital A total of 299 GPs were in practice in Greater Geelong
admission rates for these conditions, are accessible in in 2015, at a rate of 1.29 GPs per 1,000 persons, and this
the data tables for this profile. rate was above the Victorian rate of 1.21 GPs per 1,000
persons.
EMERGENCY DEPARTMENT PRESENTATIONS
In 2015, emergency department presentation rates in
Greater Geelong were 242 per 1,000 persons, which was
below the Victorian average of 263 per 1,000 persons.
ADMISSIONS FOR AMBULANCE CARE SENSITIVE CONDITIONS (RATE PER 1,000 PERSONS
Ambulatory care sensitive conditions (ACSCs) 2015-16, Victorian Health Information Surveillance System (VHISS)
294.20 DISABILITY Measures of psychological distress presented in
the Social Health Atlas indicate Greater Geelong
The ‘Core Activity in Need for Assistance’ concept has a relatively high proportion of its population
was developed by the ABS to indicate the prevalence experiencing high levels of psychological distress
of the population with a severe disability. The concept (15.8% compared to 12.6% for Victoria). Greater
identifies the proportion of the population who Geelong had a higher rate of suicide or deaths from
requires assistance to conduct routine activities such self-inflicted injuries over the period 2010 to 2014 (rate
as self-care, movement or communication. Analysis of of 11.2 per 100,000 people), compared to the Victorian
this data for 2016 shows the following key features for rate of 9.6.
Greater Geelong:
• In 2016, 6% of the Greater Geelong population had
SOCIAL CONNECTIONS AND PARTICIPATION
a Core Activity Need for Assistance, and this was Community and civic engagement, whether through
slightly above the Victorian average of 6%. The joining a local club, volunteering or attending a
share of persons in Core need for Assistance in local event is associated with better mental and
Greater Geelong increased from 5% in 2006. physical health. An overview of community and civic
engagement for the City of Greater Geelong is provided
• Persons aged 65 years or over accounted for 53%
below:
of the population who had a Core Activity Need
for Assistance and this share had declined from • Sports: Greater Geelong adults are more likely to
57% in 2006. Conversely, the share of the younger participate in a sports group than the Victorian
population (64 years and younger) requiring average (Greater Geelong: 27.9%; Vic: 25.7%).
assistance increased from 43% in 2006 to 47% in
• Religious: Greater Geelong adults are less likely to
2016.
participate in a religious group than the Victorian
• A lower share of the Greater Geelong population average (Greater Geelong: 19.9%; Vic: 18.6%).
aged 65 years or over (17.3%) had a core need for
assistance compared to the average for Victoria • School: Greater Geelong adults are more likely to
(18.1%). participate in a school group than the Victorian
average (Greater Geelong: 17.8%; Vic: 13.7%).
• 3.4% of the population aged 0-64 years in Greater
Geelong had a core need for assistance, and this • Professional: Greater Geelong adults are less
figure is higher than the average for Victoria of likely to participate in a professional group than
2.8%. the Victorian average (Greater Geelong: 20%; Vic:
The proportion of the population aged 15-64 years 23.7%).
receiving the Disability Support Pension is also an • Local Community Event: 71.2% of Greater Geelong
indication of the level of disability within an area. In residents attended a local community event in
March 2018, 6.3% of the Greater Geelong population 2014.
(aged 15-64 years) were receiving the Disability Support
It is hypothesised that volunteering improves health
Pension, which was significantly above the Victorian
by raising self-esteem, increasing the number of social
average of 4.7%. Greater Geelong had the second
relationships and improving self-care behaviours.
highest share of the population receiving the Disability
In Greater Geelong in 2016, approximately 39,260
Support Pension of all G21 LGAs.
persons were engaged in some type of volunteering;
4.21 MENTAL HEALTH this represented 20.5% of the total population
and represented an increase from 18.5% in 2011.
According to data modelled by the Social Health Atlas, Volunteering rates in Greater Geelong were similar to
persons in Greater Geelong with mental health and the Victorian average of 20.8% in 2016.
behavioural problems were estimated to occur at a rate
By gender, females (22.0% in 2016) were more likely to
of 11.9 per 100 males and 15.3 per 100 females. The
volunteer than males (18.9%) in Greater Geelong, with
equivalent rates for Victoria were 10.8 for males and
both of these rates being marginally lower the Victorian
14.6 for females.
averages (Female: 22.5%; Male: 19.1%).
30You can also read