Using well-being indicators for policy making: Region of Sardinia, Italy
←
→
Page content transcription
If your browser does not render page correctly, please read the page content below
Using well-being indicators for policy making:
                                      Region of Sardinia, Italy

HOW'S LIFE IN YOUR REGION? MEASURING REGIONAL AND LOCAL WELL-BEING FOR POLICY MAKING © OECD 2014
TABLE OF CONTENTS – 3

                                                             Table of contents

Executive summary .......................................................................................................................... 5
Introduction ...................................................................................................................................... 7
Overview of well-being outcomes in Sardinia ................................................................................ 9
    Income levels in Sardinia are lower than the national average ................................................. 10
    Labour market performance is weak with women and youth very vulnerable ......................... 12
    Sustaining strong employment requires improving educational attainment ............................. 14
    Health outcomes are high, but satisfaction with health services needs to be monitored ........... 15
    Sardinia is a safe region, although the perception of security has deteriorated in Italy in
    recent years .............................................................................................................................. 15
    Environmental quality has improved quickly in some outcomes.............................................. 16
    Broadband connection has improved dramatically in Sardinia in recent years......................... 18
Regional framework for measuring well-being ........................................................................... 19
    Rationale for measuring well-being .......................................................................................... 19
    Key aspects to consider in building a well-being agenda in Sardinia ....................................... 23
Using well-being metrics for policy making in Sardinia ............................................................. 31
    Steps to develop a well-being metrics ....................................................................................... 31
    Consultation process in a multi-level governance framework .................................................. 33
Conclusions and recommendations............................................................................................... 39
    Well-being framework for policy making ................................................................................. 39
    Well-being indicators ................................................................................................................ 40
Notes ................................................................................................................................................ 41
Bibliography.................................................................................................................................... 42

 Tables

Table 1. How does Sardinia rank in well-being in Italy and among OECD regions? ...................... 10
Table 2. Public expenditure in Sardinia and main sectors of expenditure, average 2009-12 ........... 21
Table 3. A possible well-being metrics for Sardinia ........................................................................ 25
Table 4. Possible cross-dimensional well-being indicators in Sardinia ........................................... 30

Figures

Figure 1. Sardinia’s well-being outcomes, 2013 ................................................................................ 9
Figure 2. Material conditions in Sardinia, Italy and OECD (1995-2012) ........................................ 11
Figure 3. Income inequality in Sardinia, 2011 ................................................................................. 12
Figure 4. Regional relative poverty rates in Europe, 2010 ............................................................... 13
Figure 5. Unemployment rate in Italian regions and selected OECD countries, 2013 ..................... 14
Figure 6. Average PISA scores in mathematics in Italian regions and selected countries, 2012 ..... 15
Figure 7. Perception of safety and public trust ................................................................................. 17
Figure 8. Sardinia’s Index of Multi-Deprivation: Income and education components, 2011 .......... 23

HOW'S LIFE IN YOUR REGION? MEASURING REGIONAL AND LOCAL WELL-BEING FOR POLICY MAKING © OECD 2014
4 – TABLE OF CONTENTS
Figure 9. Percent of employed people who use public transport to go to work, 2013 ..................... 26
Figure 10. Elderly dependency rate in Sardinia, Italy and the OECD (2000-12) ............................. 27
Figure 11. Net internal migration flows in Sardinia’s provinces, (2006-11).................................... 28
Figure 12. Complementarities among well-being dimensions ......................................................... 30
Figure 13. Regional well-being measurement cycle: A possible sequencing of steps ..................... 31
Figure 14. Different stakeholders are involved in the regional well-being initiative ....................... 33
HOW'S LIFE IN YOUR REGION? MEASURING REGIONAL AND LOCAL WELL-BEING FOR POLICY MAKING © OECD 2014EXECUTIVE SUMMARY – 5
Executive summary
Overview of well-being outcomes
• In international comparisons, Sardinia ranks high in environment, health and safety; civic
engagement; and access to services, but low in income, jobs, housing and education.
• Rural internal areas suffer from ageing and depopulation. Inequalities among different
territories of the region can be high in terms of well-being outcomes: income, education
and access to services.
Framework for measuring well-being in Sardinia
• Well-being measures are being introduced in the regional programming of the 2014-20
European and national Cohesion Policy that foresees approximately EUR 4 490 million of
public investment in Sardinia. The regional development plan covers virtually all of the
well-being dimensions, with a focus on improving jobs and the competitiveness of firms.
• Sardinia can make use of past practices of using well-being indicators to improve the
delivery of results and increase the accountability of policy making. It can also rely on
statistics and knowledge on well-being outcomes and ways to improve them, coming from
different national and regional initiatives (Obiettivi di servizio).
Strengths and opportunities for using well-being metrics in Sardinia
• Good institutional dialogue has been established with socio-economic partners, who can
help gather citizens’ needs and expectations.
• Sardinia has experienced innovative practices in the regional public administration
(budget rules, one-stop shop for enterprises) and positive results in improving service
delivery (for example, waste management and broadband connections). Lessons learnt
from these experiences should more clearly be part of the ex ante evaluation of the
well-being agenda.
Challenges and constraints for using well-being metrics in Sardinia
• Aligning objectives and responsibilities across the different levels of government remains
challenging. A re-organisation of responsibilities and functions between the region and the
municipalities should be considered, in particular given the small size of municipalities.
• A stronger political engagement for achieving some measurable objectives of well-being
could strengthen the process and help overcome the difficulty for engaging citizens.
• Some bottlenecks in the internal process of the public administration may reduce the
efficiency of a result-oriented public policy. For example, a reform of the regional public
administration structure has not followed the budget reform, and the management of the
incentives to firms remains fragmented.
What’s next
• Sardinia needs to build a shared ownership of its well-being agenda. In order to do so,
many stakeholders should be on board – to integrate technical capacity, local knowledge,
policy and programming responsibility. Finally, engaging citizens and bringing the
well-being metrics to the political agenda will be crucial to increase the legitimacy of the
well-being agenda.
HOW'S LIFE IN YOUR REGION? MEASURING REGIONAL AND LOCAL WELL-BEING FOR POLICY MAKING © OECD 2014INTRODUCTION – 7
Introduction 1
The region of Sardinia has started measuring well-being to support regional policy, in
particular to improve the design and implementation of the EU and national Cohesion
Policy. While the experience is still at its inception, it illustrates the ways in which
regional well-being metrics can help OECD regions to improve the design and delivery of
public policy. First, well-being indicators provide a comprehensive picture of material
and quality of life in Sardinia, showcasing the region’s strengths – for example
environment – and weaknesses – for example jobs – compared to the other OECD
regions. Second, well-being measures can raise social awareness of policy objectives or
specific issues. Third, they can help prioritise policy, highlighting where interventions are
needed, as is the case of education in Sardinia. Finally, using well-being measures can
help build more coherent policies across sectors, through more effective co-ordination
and citizen engagement.
The experience of Sardinia in the use of well-being indicators to guide public choices
can highlight common challenges in policy implementation and can serve as input for
other regions, in particular in the programming of the 2014-20 EU Cohesion Policy
(Box 1).
Sardinia is one of the two main islands in Italy and hosts around 1.6 million people. It
is characterised by low population density (around one-third of the national value), and is
home to two cities with a population larger than 50 000 and many small municipalities.
Internal rural areas experience ageing, de-population and low accessibility to transport
and services. The regional GDP per capita is around 76% of the national value and both
output and employment have decreased since 2008. The economy of the region relies
mainly on the tertiary sector (80% of regional GDP), and the public sector alone
represented almost 30% of the regional GDP. The industrial base is characterised by a
large number of micro firms (less than ten employees) oriented towards traditional sectors
and low propensity to innovation: R&D expenditure and patents represented less than 1%
of the national values in 2010 (OECD, 2013a). As other regions in the southern part of
Italy, the economic trajectory of the region was heavily influenced by national and
European public incentive schemes. However, public direct investment represented only
2.8% of the regional GDP in 2011 (Department for Economic Development and
Cohesion, 2013).
The administrative structure of Sardinia has 3 tiers of government: the region,
8 provinces and 377 municipalities. The region is governed by an elected body, the
regional government, which holds a five-year mandate (the most recent elections were
held in February 2014). The region has substantial strategic autonomy and political power
to play an important role in the economy by shaping local institutions and allocating the
financial resources it directly and indirectly commands. 2
Previous experiences of using outcomes indicators to measure the results of public
policy in Sardinia suggest that the availability of socio-economic measures that are
comparable across areas and regions can act as a catalyst for policy makers, spur public
support for action and create a mechanism for prioritising resources. At the same time,
great importance should be given to understanding the conditions for sound policy
implementation and the ways to intervene, including through public deliberation and
alignment of objectives among different levels of government.
HOW'S LIFE IN YOUR REGION? MEASURING REGIONAL AND LOCAL WELL-BEING FOR POLICY MAKING © OECD 20148 – INTRODUCTION
Box 1. How can the measurement of regional well-being improve policy making?
Adopting well-being metrics can improve the design and delivery of policies in regions and
cities along four directions.
First, they provide a comprehensive picture of material conditions and quality of life in
regions, making it possible to assess whether economic growth translates also into better
non-economic outcomes (in terms of health, environmental quality, education, etc.) and whether
progress is shared across population groups and places. Spatial concentration of advantages or
disadvantages varies strongly at various territorial scales and different sources of inequality can
reinforce one another, locking households and communities into circumstances that make it
particularly hard for them to improve their life chances.
Second, well-being metrics can raise social awareness on policy objectives or specific
issues, promote policy change and increase accountability of governments.
Third, they can help prioritise policy interventions by recognising where improvements are
needed; knowledge of local conditions can also help policy makers to identify potential
synergies among different dimensions that can be leveraged by policy and to better understand
citizens’ preferences.
Fourth, well-being metrics can improve the coherence of policies. Many of the important
interactions among sectoral policies are location specific. For instance, integrating land-use,
transport and economic development planning can contribute to outcomes that are greener
(increasing reliance on public transport), more equitable (improving access to labour markets for
disadvantaged areas) and more efficient (reducing congestion, commuting times, etc.). The
complementarities among different strands of policy are likely to be most evident – and the
trade-offs among them most readily manageable – where they occur, in specific places. More
coherent policies can be designed and implemented through effective co-ordination across
different levels of government and jurisdictions. They also need to engage citizens in the design
(to better understand their needs) and in the implementation (to use citizens’ capacity to bring
change), in turn to increase the legitimacy of policies and support of policy objectives.
Designing coherent policies requires policy makers to consider the trade-offs and
complementarities involved in both the objectives they aim to target and the channels through
which they do so.
Source: OECD (2014) How’s Life in Your Region? Measuring Regional and Local Well-Being for Policy
Making, OECD Publishing, Paris.
This case study is organised in four sections. First, it offers an overview of well-being
outcomes in Sardinia, according to the common OECD How’s Life in Your Region
framework complemented with further analysis (OECD, 2014a). Second, it describes the
well-being framework developed by Sardinia and puts forward some features that could
be included to strengthen it. Third, it explores how regional well-being indicators are
being developed, communicated and used for policy design and implementation in
Sardinia. It concludes with a set of possible recommendations for strengthening the
regional well-being measurement initiative in Sardinia that could be useful to other Italian
regions wanting to develop well-being metrics for policy making.
HOW'S LIFE IN YOUR REGION? MEASURING REGIONAL AND LOCAL WELL-BEING FOR POLICY MAKING © OECD 2014OVERVIEW OF WELL-BEING OUTCOMES IN SARDINIA – 9
Overview of well-being outcomes in Sardinia
Sardinia’s well-being outcomes have been assessed along the nine dimensions of the
OECD regional well-being indicator set that includes both material conditions and quality
of life (OECD, 2014a). Sardinia scores lower than the OECD and national averages in
material conditions, such as income, jobs and housing, but also in education. Regarding
quality of life, however, environment and access to services (broadband connection) are
above the national values; outcomes in health and civic engagement are above the OECD
average although below the national one; and safety is below the national average and
very close to the OECD average (Figure 1 and Table 1).
Figure 1. Sardinia’s well-being outcomes, 2013
Education
10
9
Housing 8 Jobs
7
6
5
4
3
Access to services 2 Income
1
0
Civic engagement Safety
Environment Health
Sardinia Italy OECD
StatLink 2 http://dx.doi.org/10.1787/888933145865
Notes: Each well-being dimension is measured by one or the average of two indicators. Indicators are
normalized to range between 10 (best) and 0 according to the following formula: (indicator value –
minimum value across all OECD regions)/(maximum value across all OECD regions – minimum value
across all OECD regions) multiplied by 10. In cases where high values of an indicator mean worse well-
being (for example unemployment), the indicator is normalized with the same formula subtracted to 10.
Source: OECD (2014), Regional Well-Being (database), www.oecdregionalwellbeing.org;
http://dx.doi.org/10.1787/region-data-en.
With respect to the early 2000s, the relative position of Sardinia vis-a-vis the other
361 OECD regions has improved in most of the well-being categories, the only
exceptions are income and civic engagement, where the regional ranking has gotten
worse (Table 1). Table 1 provides a snapshot of well-being outcomes using a limited set
of indicators; the following paragraphs will delve into each well-being category to
provide a more detailed picture of well-being outcomes in Sardinia.
HOW'S LIFE IN YOUR REGION? MEASURING REGIONAL AND LOCAL WELL-BEING FOR POLICY MAKING © OECD 201410 – OVERVIEW OF WELL-BEING OUTCOMES IN SARDINIA
Table 1. How does Sardinia rank in well-being in Italy and among OECD regions?
Rank among Change in the ranking
Score Rank among
362 OECD among OECD regions Indicators used
(out of 10) 21 Italian regions
regions since 2000
Income 3.2 16 Bottom 36% Worsened Household disposable
income
Jobs 2.1 16 Bottom 8% Improved Employment rate
Unemployment rate
Health 9.1 14 Top 13% Improved Mortality rate
Life expectancy
Education 3.8 21 Bottom 20% Improved Labour force with
at least secondary
education
Environment 7 1 Top 35% Improved Air quality
Access to services 6.2 9 Bottom 33% Improved Household broadband
access
Safety 9.2 17 Top 35% Improved Murder rate
Civic engagement 5.6 18 Top 50% Worsened Voter turnout
Housing 3.6 3 Bottom 43% Not available Number of rooms per
person
Source: OECD (2014), Regional Well-Being (database), www.oecdregionalwellbeing.org;
http://dx.doi.org/10.1787/region-data-en.
Income levels in Sardinia are lower than the national average
Real gross domestic product (GDP) per capita growth in Sardinia averaged 0.16% per
year in the period 2001-11. Even if growth in Italy was, on average, negative in the same
period, Sardinia has not reduced its gap with the rest of the country significantly since the
early 2000s: the GDP per capita of the region was 73% of the national average in 2002
and 76% in 2011. Gains in labour productivity (measured as the ratio between GDP and
total employment at place of work) were registered between 2003 and 2008 but were lost
in the following years. The labour productivity in 2011 stood at USD 57 200, very close
to the value in 2003, and the employment rate in 2011 was only 0.8% higher than in 2003
(Figure 2). In 2012, export in Sardinia increased, essentially due to the increases both in
the value and the quantity of products from oil refining (Banca d’Italia, 2013). However,
the value added of industry, excluding the oil sector, has been steadily decreasing
since 2008, at 10% in 2011. Regional and domestic demand has worsened in recent years
following the economic crisis, revealing the long-standing crisis of industry in Sardinia.
Income levels in Sardinia are low compared to the country and OECD averages.
Compared to GDP per capita, household disposable income is a more appropriated
measure of the maximum amount that a household can afford to spend on consumption
goods or services without having to reduce its financial or non-financial assets or by
increasing its liabilities.3 As such, income is an important component of individual
well-being as it allows people to satisfy their basic needs and meet other purposes that are
important for their lives. In 2011, the average household disposable income per capita in
Sardinia stood at USD 13 200, the 6th worst among Italian regions, below the national
average (USD 16 139 at constant prices and constant PPP) and the OECD average
(USD 20 553) 4 (Figure 2). Compared to 2009, the household disposable income in
Sardinia has decreased by 1.7%, less than the decrease of 2.7% in Italy (Istat, 2014). The
relative ranking of Sardinia compared to the OECD regions has remained the same since
the early 2000s.
HOW'S LIFE IN YOUR REGION? MEASURING REGIONAL AND LOCAL WELL-BEING FOR POLICY MAKING © OECD 2014OVERVIEW OF WELL-BEING OUTCOMES IN SARDINIA – 11
Figure 2. Material conditions in Sardinia, Italy and OECD (1995-2012)
Income per capita Employment rate
USD, PPP 2005 % of working age population
Italy Sardinia OECD (28) Italy Sardinia OECD (34)
23 000 70%
21 000 65%
19 000 60%
55%
17 000
50%
15 000
45%
13 000
40%
11 000
1995
1996
1997
1998
1999
2000
2001
2002
2003
2004
2005
2006
2007
2008
2009
2010
2011
2012
1995
1996
1997
1998
1999
2000
2001
2002
2003
2004
2005
2006
2007
2008
2009
2010
2011
GDP per capita Labour productivity
USD, PPP 2005 USD, PPP 2005
Italy Sardinia OECD (34) Italy Sardinia OECD (25)
33 000 75 000
31 000
29 000 70 000
27 000
65 000
25 000
23 000 60 000
21 000
19 000 55 000
17 000
50 000
1995
1996
1997
1998
1999
2000
2001
2002
2003
2004
2005
2006
2007
2008
2009
2010
2011
2012
15 000
1995
1996
1997
1998
1999
2000
2001
2002
2003
2004
2005
2006
2007
2008
2009
2010
2011
2012
StatLink 2 http://dx.doi.org/10.1787/888933145873
Notes: Real GDP per capita is converted in USD using constant 2005 PPP. Labour productivity is computed as the ratio between
GDP and total employment by place of work. The OECD figure of labour productivity includes 25 countries for lack of
comparable data on employment at place of work in the remaining nine countries. The OECD figure on income includes 28
countries.
Source: OECD (2014), OECD Regional Statistics (database), http://dx.doi.org/region-data-en; and Istat.
Income inequalities within the region are in line with the national ones. In addition to
the average material living standards, household income inequalities are another element
that can affect the overall level of cohesion and well-being in places. Income inequality is
high in Italy. Based on international comparisons, it has the 6th highest value among
OECD countries (OECD, 2011a). Moreover, income disparities are also high between
and within regions in Italy, especially in the south of Italy, which is characterised by
lower levels of income and higher inequalities. However, in Sardinia, the Gini Index of
disposable income is slightly below the national and the OECD median values. When
considering another measure of income distribution, the disposable income of the 20%
richest households in Sardinia is five times higher than the income of the poorest 20%, in
line with the OECD median value and below the national value (Figure 3).
HOW'S LIFE IN YOUR REGION? MEASURING REGIONAL AND LOCAL WELL-BEING FOR POLICY MAKING © OECD 201412 – OVERVIEW OF WELL-BEING OUTCOMES IN SARDINIA
Figure 3. Income inequality in Sardinia, 2011
Gini Index (left) and ratio between top and bottom quintile of the income distribution (right);
Italian regions
Gini disposable income (left) Income ratio between top and bottom 20% (right)
Income ratio between top and bottom 20% income
0.40 9
Gini Index of disposable income
8
7
0.35
6
5
0.30
4
3
0.25
2
1
0.20 0
Sicily
Valle d'Aosta
Emilia-Romagna
Lombardia
Calabria
Lazio
P.A.Trento
P.A. Bolzano
Puglia
Veneto
Umbria
Toscana
Molise
Piemonte
Italy
Campania
OECD(29) median
Basilicata
Abruzzo
Friuli-Venezia Giulia
Marche
Liguria
Sardinia
StatLink 2 http://dx.doi.org/10.1787/888933145889
Note: OECD median includes 29 countries.
Source: Own calculations for OECD (2014), How’s Life in Your Region? Measuring Regional and Local
Well-Being for Policy Making, OECD Publishing, Paris, from the OECD Income Distribution Database.
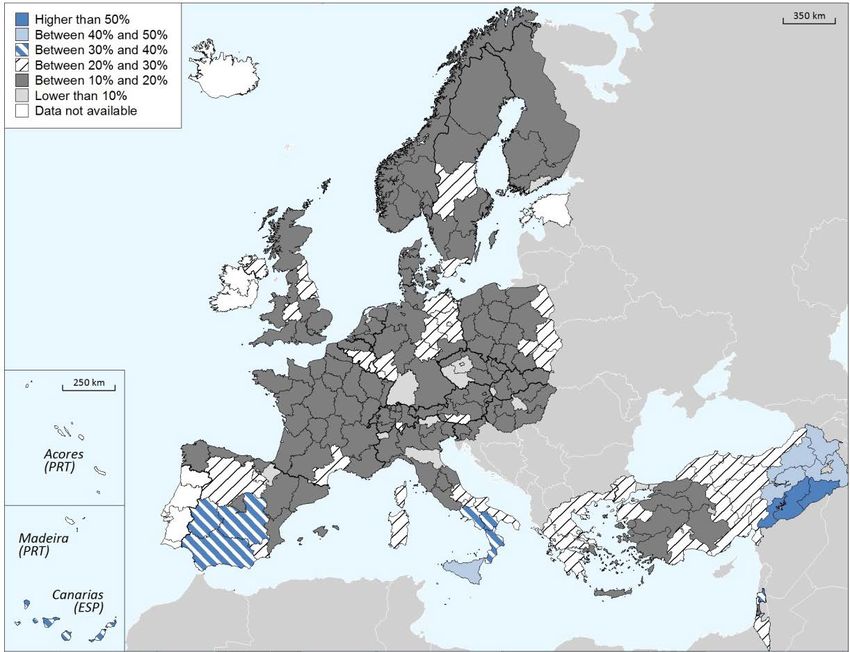
The share of people at risk of poverty, here defined as the share of people with
income less than 60% of the national disposable median income, reached 22% in 2011
(Figure 4). This value is higher than the median of OECD regions (18%) and the national
value (20%), although much lower than in the other southern regions of Italy such as
Calabria, Campania and Sicily. Poverty rates have been on the rise in Italy in recent years
following the economic crisis. The traditionally higher levels of poverty in the south of
Italy highlight the strong association between poverty and low educational levels, and
between low-skilled jobs and unemployment, all phenomena with a higher incidence in
the Mezzogiorno 5 (Istat, 2013). Estimates of the territorial distribution of poverty within
Sardinia indicate a relative advantage of the major urban centres and a greater
disadvantage of the internal areas (Sistema informativo IDMS, 2011).
Labour market performance is weak with women and youth very vulnerable
Looking at the eight well-being dimensions considered, Sardinia scores the worst in
jobs (2.1), with a value among the bottom 10% of all OECD regions (Table 1). In
international comparisons, Italy combines a low score on the jobs dimension (25th out of
the 34 OECD countries) with the largest disparities across regions. The availability of
jobs and their quality are important aspects of well-being not only as a generator of
income but also because having a job helps people feel connected with others, and
improves their competencies and skills. The employment rate in Sardinia has been
decreasing since 2008 and was equal to 52.4% in 2012, almost 6 percentage points lower
than Italy and 15 percentage points lower than the OECD area (Figure 2). While
employment recovered in the biennium 2009-11 almost to its pre-crisis level of 2007, it
then declined again in 2012: the improvement was essentially due to workers
HOW'S LIFE IN YOUR REGION? MEASURING REGIONAL AND LOCAL WELL-BEING FOR POLICY MAKING © OECD 2014OVERVIEW OF WELL-BEING OUTCOMES IN SARDINIA – 13
Figure 4. Regional relative poverty rates in Europe, 2010
Note: This document and any map included herein are without prejudice to the status of or sovereignty over
any territory, to the delimitation of international frontiers and boundaries and to the name of any territory, city
or area. Poverty headcounts with poverty line defined at 60% of the national median income. For a full picture
of OECD regions, see OECD (2014a).
Source: Own calculations for OECD (2014), How’s Life in Your Region? Measuring Regional and Local
Well-Being for Policy Making, OECD Publishing, Paris from the OECD Income Distribution Database.
aged 55-64 years while the rate of youth employment (18-25 years) continued to
decrease. Female employment has been steadily increasing, from 29% in 1999 to 46% in
2012. However, the value is still below the national average of 50.5% and well below the
OECD average of 57%. Unemployment rates have been soaring in many OECD countries
since 2008. Italy has the 6th highest unemployment rate among OECD countries, at
12.2% in 2013 (OECD, 2014b). The regional divide between the southern and northern
regions is very strong, with unemployment rates in Campania, Calabria and Sicily higher
than 20% (close to the value of Spain), whereas Friuli, Bolzano, Trento or Veneto score
below 8% (closer to the unemployment rates of Germany or Japan). In Sardinia, the
unemployment rate is higher than in Italy: 17.5% compared to 12.2% in 2013 (Figure 5).
Italian youth represent one of the most vulnerable groups in the labour market in Italy:
in 2012, one out of three people aged 15-24 years was unemployed, the highest value
since 1977; the share of youth neither in education or training nor employed (so-called
NEET) jumped from 19.5% in 2009 to 22.7% in 2012. In Sardinia, the youth
unemployment rate reached 47.3% in 2012.
HOW'S LIFE IN YOUR REGION? MEASURING REGIONAL AND LOCAL WELL-BEING FOR POLICY MAKING © OECD 201414 – OVERVIEW OF WELL-BEING OUTCOMES IN SARDINIA
Sustaining strong employment requires improving educational attainment
There are several mechanisms through which education can affect well-being. First,
education per se has a value that directly benefits individuals, responding to the need to
learn (OECD, 2011b). By investing in education, people develop skills, many of which
are important for having a good life, such as carrying out activities that bring satisfaction
(Scitovski, 1976). Education is also strongly linked with many other well-being
dimensions. For example, higher education can increase health, not only through a better
income and employment conditions, but also by affecting people’s behaviours (Cutler and
Lleras-Muney, 2006). Literature also documents that higher levels of educational
attainment are associated with higher civic engagement (see, for example, Milligan et al.,
2004). Besides private returns, moreover, education has important social returns, which
affect the overall productivity of places, reduce crime rates and increase civic engagement
and social cohesion (Moretti, 2004).
Figure 5. Unemployment rate in Italian regions and selected OECD countries, 2013
30
25
20
15
10
5
0
StatLink 2 http://dx.doi.org/10.1787/888933145890
Note: In white, selected OECD countries; in blue, Italian regions.
Source: OECD (2014), OECD Regional Statistics (database), http://dx.doi.org/region-data-en.
Looking at quality of life dimensions, education is the one where Sardinia scores the
lowest. In 2012, the share of the labour force with at least a secondary education was
54%, the lowest value in Italy and among the bottom 20% of OECD regions. Although
the share of the labour force with a secondary education has increased, from 45% in 2000,
still one-fourth of Sardinia’s young people (aged 18-24) had dropped-out after mandatory
schooling in 2012, compared to 17% in Italy. Quality of education, in addition to
coverage, should also be monitored. According to the latest OECD PISA results, student
achievements in mathematics in Sardinia appear to be among the lowest in Italy (only
above Campania, Sicily and Calabria) and among OECD countries (slightly above Greece
and Turkey) (Figure 6).
HOW'S LIFE IN YOUR REGION? MEASURING REGIONAL AND LOCAL WELL-BEING FOR POLICY MAKING © OECD 2014OVERVIEW OF WELL-BEING OUTCOMES IN SARDINIA – 15
Figure 6. Average PISA scores in mathematics in Italian regions and selected countries, 2012
600
500
400
300
200
100
0
StatLink 2 http://dx.doi.org/10.1787/888933145905
Note: In white, selected OECD countries; in blue, Italian regions. The statistical data for Israel are supplied by
and under the responsibility of the relevant Israeli authorities. The use of such data by the OECD is without
prejudice to the status of the Golan Heights, East Jerusalem and Israeli settlements in the West Bank under the
terms of international law.
Source: PISA 2012 database.
Health outcomes are high, but satisfaction with health services needs to be
monitored
Sardinia enjoys high life expectancy at birth (82.1 years) and a low mortality rate
(7.4 per 1 000 people), among the best 15% of OECD regions for both indicators. The
main causes of death are tumours and cardio-vascular diseases whose values are slightly
higher than the national average. The share of families that have declared difficulties in
reaching the emergency care was in line with the national average (55.4%); however, the
share of families declaring they were very satisfied with the quality of the medical
assistance in the hospital (36.3%) and with the opening hours of the territorial healthcare
facilities (36.3%) are lower than the corresponding national averages (Istat, 2012).
Recently, the regional health system has developed an online platform where citizens can
monitor in real time the number of patients in all the emergency care hospitals of the
region. Information on the seriousness of emergency being treated at the moment is given
and, on the base of it, the estimated waiting time for new patients.
Sardinia is a safe region, although the perception of security has deteriorated in
Italy in recent years
Personal security is the extent to which people feel safe and secure from personal
harm or crime. Crime has, of course, a huge direct and often long-lasting effect on
victims. However, it can also strongly affect the well-being (e.g. mental health) of those
who are not victims but that live in the same community (Cornaglia and Leigh, 2011).
Crime and insecurity are associated to other well-being dimensions, such as education,
income, access to jobs and social connections. Any meaningful measure of the cost of
crime should consider the distribution across crime categories and cost items (Alda and
Cuesta, 2011). Besides direct health and private security costs, previous attempts to
HOW'S LIFE IN YOUR REGION? MEASURING REGIONAL AND LOCAL WELL-BEING FOR POLICY MAKING © OECD 201416 – OVERVIEW OF WELL-BEING OUTCOMES IN SARDINIA
measure the economic and social cost of crime include several external effects, such as
the erosion of human and social capital, a worse business climate and a high allocation of
public resources away from more productive uses (OECD/IMCO, 2013). Indicators of
security are also increasingly included in international measurement of competitiveness,
such as in the World Economic Forum’s Global Competitiveness Report. Yet the
relationship between crime and other well-being outcomes is a complex one, especially
when looking for causal associations.
Measuring the number of homicides, Italy is the 8th safest OECD country and
Sardinia ranks among the top 35% OECD regions. However, the homicide rate of 1.3 per
100 000 people is the 5th highest among Italian regions (Table 1). It is worth noting that
in Sardinia, the perception of safety, an important aspect of security, is among the highest
in Italy. In 2009, 71.4% of Sardinia’s citizens felt relatively safe to walk alone in the
dark, 12 percentage points higher than the national average; 7.4% declared to be worried
of being potentially the victim of a crime (theft or assault) compared to 10.6% in Italy;
and 12.9% declared perceiving social distress in their municipality of residence compared
to 15.6% in Italy (Istat-Cnel BES, 2013).
The level of safety can also affect the overall well-being perceived in a given place
through its relationship with public trust. Trust is a keystone of good governance, an
important factor influencing the functioning of the markets, economic growth and
well-being of people (OECD, 2000). In Italy, both the perception of safety and public
trust (towards different institutions and political parties) decreased between 2002
and 2012. Both subjective and objective measures of personal safety in Italian regions are
positively associated to the level of trust. As shown in Figure 7, the higher the share of
people feeling safe to walk alone in the dark, the higher the trust in the local public
authorities (correlation 0.6). Similar relationships were also found between public trust in
local authorities and the number of homicides or the perception of social distress in the
area.
Internationally comparable indicators of civic participation are limited to voter
participation in national elections. According to this indicator, Sardinia ranks among the
top 40% of OECD regions, but the second to last among Italian regions (Table 1).
National statistics with regional detail that cover other aspects of the civic participation
and governance dimensions are available through the Survey Aspetti della vita quotidiana
(Multipurpose Survey on Households: Aspects of Daily Life), carried out annually by the
National Institute for Statistics (Istat). These include, for example, civic and political
participation, the share of women in public administrations, and trust in various
institutions, which could be added to the well-being metrics developed by Sardinia. In all
these indicators, Sardinia ranks below the national average with the exception of civic
and political participation. On the other hand, objective or subjective measures of
corruption are currently lacking in Italy.
Environmental quality has improved quickly in some outcomes
Environmental outcomes and quality of environmental services, generally good in
Sardinia, have a strong impact on current and future well-being. Air quality is very good
in Sardinia according to international comparisons. New estimates show the concentration
of particulate matter (PM2.5) in Sardinia was the lowest in Italy in 2012. 6 Local air
pollution, however, is of particular concern in the areas of closed mines (Sulcis,
Iglesiente).While Sardinia distinguishes itself for the quality of the coastal and interior
landscape as well as climate, the environmental quality is challenged in many aspects.
HOW'S LIFE IN YOUR REGION? MEASURING REGIONAL AND LOCAL WELL-BEING FOR POLICY MAKING © OECD 2014OVERVIEW OF WELL-BEING OUTCOMES IN SARDINIA – 17
More than 80% of energy in Sardinia comes from oil and carbon and the potential for
using renewable energy (wind, sun) has not yet been exploited. CO2 emissions per capita
have not significantly improved in the 2000s and Sardinia had the 6th highest level
among Italian regions in 2008 (OECD, 2013a).
Figure 7. Perception of safety and public trust
The share of people who feel safe is positively associated to the share of people
who trust local public authorities
5.5 Trento
Bolzano
5
Friuli-Venezia Giulia
Valle d'Aosta
Trust in local public authorities (score)
Emilia-Romagna
4.5
Veneto Toscana Liguria
Lombardia
Piemonte Marche
Umbria Abruzzo
4
Molise Basilicata
Lazio Puglia
Campania Sardinia
3.5 Calabria
Sicily
3
2.5
45 50 55 60 65 70 75 80 85
% of people feeling safe to walk alone in the dark
StatLink 2 http://dx.doi.org/10.1787/888933145911
Note: Trust in local authorities is measured with an average score ranging between 0 (lowest trust) and
10 (highest trust).
Source: Authors’ elaborations based on Istat Indagine aspetti della vita quotidiana (2012) and Indagine sulla
sicurezza dei cittadini (2009).
The richness of Sardinia’s ecosystem and landscape, crucial also to the development
of tourism, needs to be preserved. Hydrogeological risk (soil erosion) and fires are among
the main environmental issues threatening the region, while the fast rate of urbanised land
around some municipalities (Olbia, Alghero) adds environmental pressure to the coast.
Regarding waste management, large improvements have been made in the past ten years.
Today, almost 50% of urban waste is recycled compared to less than 5% in 2003; waste
landfill was halved and more than 70% of bio-waste is now treated through composting
(Department for Economic Development and Cohesion, 2014). However, regarding water
quality, the share of people served by wastewater treatment, equal to 83% (61% for
people in urban areas) in 2012, has not increased significantly since 2005, although this
value is the highest in Mezzogiorno. Losses in the water distribution were still very high
in 2012, around 55%, and the efficiency of the distribution network seems to have
worsened since 2005 (Department for Economic Development and Cohesion, 2014).
HOW'S LIFE IN YOUR REGION? MEASURING REGIONAL AND LOCAL WELL-BEING FOR POLICY MAKING © OECD 201418 – OVERVIEW OF WELL-BEING OUTCOMES IN SARDINIA
Broadband connection has improved dramatically in Sardinia in recent years
Individual well-being is strongly connected to the availability and quality of services
accessible where people live. The access to services comprises three aspects. Physical
accessibility refers to the ability to reach the place where the service is provided;
economic accessibility refers to the extent to which the service is affordable, since the
lack or low quality of it harms poorer people who cannot afford alternatives; institutional
access accounts for constraints imposed by the institutional environment, such as laws,
regulations, values, knowledge, etc. (OECD, 2014a). The access to services is a
significant dimension of regional well-being as the territorial distribution of people and
service points can make national averages misleading. Public transport is an example of
public service that is available to different extents across space (differences across
regions, between urban and rural areas, etc.). Another example is the access to IT
services, which in turn is connected to access to knowledge. In 2013, 70% of households
in Sardinia had access to broadband Internet services, above the national average of 68%.
This indicator has increased rapidly since 2007, when it was 25% in Sardinia and Italy
(Table 1).
HOW'S LIFE IN YOUR REGION? MEASURING REGIONAL AND LOCAL WELL-BEING FOR POLICY MAKING © OECD 2014REGIONAL FRAMEWORK FOR MEASURING WELL-BEING – 19
Regional framework for measuring well-being
Rationale for measuring well-being
In Sardinia, the Regional Development Plan (Programma Regionale di Sviluppo) sets
out the strategic vision of the regional government at the beginning of its mandate,
identifying the major objectives and financial resources for the following five years, and
represents the general framework for all the programming documents issued by the
region. Many well-being dimensions are addressed in the 2009-14 Regional Development
Plan, namely income, jobs, health and environment, although without an explicit
approach to adopting well-being metrics to policy making. The Regional Development
Plan for the period 2014-19 will be approved in September 2014.
The Regional Planning Centre (CRP), which is part of the regional administration and
acts as the co-ordinating authority of the EU Cohesion Policy in Sardinia, has convened a
reflection with various stakeholders and the OECD to bring well-being to the centre of
Cohesion Policy and orient local development towards shared objectives of improved
quality of life. 7
The CRP’s approach to measuring well-being attempts to respond to three main
objectives: i) to orient the programming of the 2014-20 Cohesion Policy towards
measurable results; ii) to broaden the dialogue with stakeholders to implement a more
coherent policy for the region; and iii) to make better use of the available statistical
information, including the recently developed Index of Multi-Deprivation for
Municipalities.
First, well-being measures are introduced to orient Cohesion Policy in the region
towards measurable and verifiable results. The Regional Strategic Document (DUS,
Documento Unico Strategico, 2013) approved by the regional government in
September 2013, is the main instrument for the economic and financial programming of
the 2014-20 EU Cohesion Policy. For its implementation, EUR 4 490 million of national
and European funds will be allocated. It encompasses a comprehensive strategy around
11 broad policy themes. For each theme, a description of the expected results and actions
for pursuing them are included, as well as a list of indicators to measure the results. While
the introduction of expected results and indicators in the Regional Strategic Document
represents a commitment towards a more transparent and evidence-based policy, the set
of indicators is still large, without a clear prioritisation according to the policy choices.
Moreover, the set mixes both indicators measuring the expected results (for example, the
“share of young neither employed nor in education or training”, NEET) and indicators
measuring input or output of policy interventions (for example, the “share of firms that
have training programmes targeted to young”); finally, some indicators are still
unavailable and thus a diagnosis based on them is currently not possible.
With the exception of housing, all the well-being dimensions included in the OECD
Regional Well-Being Framework are included in the DUS. The approach seems to focus
on the economic aspects of well-being, in particular on jobs and the competitiveness of
small firms, and to the links between inequalities and growth. The poor results on
education are to be monitored also in view of the positive impact that their improvement
could have on the region’s competitiveness.
EU Cohesion Policy emphasises the role of indicators as policy tools for the 2014-20
programming period, suggesting that a more results-oriented approach for EU funding
can be met by clearly stating and quantifying expected results. Regional governments, in
HOW'S LIFE IN YOUR REGION? MEASURING REGIONAL AND LOCAL WELL-BEING FOR POLICY MAKING © OECD 201420 – REGIONAL FRAMEWORK FOR MEASURING WELL-BEING
charge of EU Cohesion programmes are required to identify results, and the outcome
indicators that measure progress towards the expected results, and monitor their change
during implementation. According to this framework, result indicators should drive the
choice of policy actions more strictly than in the past (Barca and McCann, 2011).
Within the frame set by EU regulations, the Department for Economic Development
and Cohesion (DPS), which is the Italian national co-ordinating authority, has
co-ordinated a reflection with the regional authorities, institutional and socio-economic
stakeholders, to identify a range of relevant expected results and indicators, as well as
possible actions to achieve those results. This exercise produced a list of expected results,
indicators and actions which were included in the national programming document, the
Partnership Agreement, submitted by the Italian government to the European
Commission. 8 At the same time, the region started its own programming process,
involving all relevant partners at the local level in order to identify regional priorities.
During the negotiation, the national and regional processes interacted and led to a
common set of objectives and indicators at national level in the Partnership Agreement
and subsets at regional level in the Operational Programme, which should better reflect
the needs and the challenges of each region (Ministro Coesione Territoriale, 2012).
The need to identify objectives and indicators that clearly measure intended change,
as the new EU paradigm foresees, is a great challenge for regional authorities designing
programmes in Italy as well as in other OECD countries. The results of a pilot test carried
out by the European Commission of 23 regional programmes in 15 countries underline a
very limited use of result indicators and recommend concentrating resources on a few
objectives where effects can be measured through quantitative or qualitative targets. To
make choices and concentrate action, the European Commission emphasises the need to
carry out a deliberative process, with the involvement of a wide range of stakeholders,
including the political level and of civil society (European Commission, 2013).
Second, the regional well-being agenda can be a way to link policies in a coherent
development strategy for the region. The Regional Planning Centre aims at engaging a
wide range of stakeholders to identify actions and responsibilities towards agreed upon
well-being objectives. While the consultation has started within the Cohesion Policy
framework, it should move beyond it to ensure a comprehensive and participatory
approach. A deliberative approach can help prioritise policy actions and select projects
that reflect citizen preferences and aspirations.
The region of Sardinia has important responsibilities in terms of provision of public
goods and services, which play a crucial role in affecting citizens’ well-being as well as
the conditions in which firms operate. Social protection, health, general administration
and education represent about 70% of the total public expenditure in Sardinia (Table 2).
Current expenditure represents 88% of the total expenditure, which was around
EUR 12 687 per capita on average in 2009-12, almost EUR 200 lower than the average
value for the country. The main economic sectors of investment (capital expenditure) are
social protection and health (Ministry of Economic Development, 2013).
Previous experiences show the importance of bringing citizens and other stakeholders
closer to policy making and to evaluating the capacity of policy to deliver results.
Sardinia was engaged in a performance scheme to improve well-being in four dimensions
(education, water, waste, and elderly and child care) through a system of measurable and
agreed outcomes referred to as Obiettivi di servizio (Box 2). Improvements in the areas of
waste management and child and elderly care were significant. For example, the amount
of urban waste landfilled was halved, while the share of recycled urban waste increased
HOW'S LIFE IN YOUR REGION? MEASURING REGIONAL AND LOCAL WELL-BEING FOR POLICY MAKING © OECD 2014REGIONAL FRAMEWORK FOR MEASURING WELL-BEING – 21
from 27% to 48% in five years. The improvements in the waste cycle management of the
past years are recognised as a success story of engaging institutions, private sectors and
civil society around clear and measurable objectives and identifying the actions to pursue
these objectives. On the other hand, no significant changes were registered in water
management and poor results were obtained on education. The percentage of youth
without a secondary school diploma actually increased in the period, reaching 25%, and
the share of 15-year old students with poor competencies stayed at around 28% according
to the latest two rounds of the OECD PISA Survey (whereas the value for Italy is 19%).
Difficulties in the alignment of objectives across different levels of government and
institutions were mentioned as the main cause of the poor results on the fight against
school drop-outs.
Table 2. Public expenditure in Sardinia and main sectors of expenditure, average 2009-12
EUR EUR % of total
Public expenditure % GDP Main expenditure sectors
per capita per capita expenditure
Current expenditure 11 165 56.6% Social protection and wage integrations 4 566 36%
Capital expenditure 1 522 7.7% Health 1 790 14.1%
Total expenditure Sardinia 12 687 64.3% General administration 1 535 12.1%
Education 974 7.7%
Total public expenditure Italy 12 871 49.9% Sardinia’s public expenditure in the 4 sectors 8 865 69.9%
Source: Department for Economic Development and Cohesion (DPS) (2013), Conti Pubblici Territoriali, Rome.
Box 2. Using indicators to improve policy delivery:
The case of Obiettivi di servizio in Italy
Obiettivi di servizio is a performance scheme, targeted to eight Italian regions, and introduced in
the 2007-13 Italian implementation of EU Cohesion Policy. According to the scheme, regional
authorities of the eight southern regions were asked to achieve minimum standards in four policy
areas where the level and quality of public services were lagging behind other areas of the country.
The four policy areas are education, child and elderly care, waste management and water
service. A set of 11 indicators is used to measure the starting point and monitor the progress at
regional level in these 4 policy areas. For each indicator, a target for 2013 was set at the same level
for all regions (see www.dps.tesoro.it/obiettivi_servizio for the list of indicators and targets). The
indicators are expressed as improvements in citizen well-being and the performance framework was
conceived to help regional authorities design programmes and select projects by focusing on the
improvement of results in key well-being dimensions.
Prior to starting the performance scheme, the ministry co-ordinating regional policy (Ministry
of Economic Development, Department for Economic Development and Cohesion) set up a
deliberative process to identify the four policy areas and the statistical indicators, engaging the
National Institute for Statistics (Istat) and national and regional authorities. Many stakeholders were
consulted, including associations of service providers, representatives of local authorities, data
providers and socio-economic partners. Such a deliberative process was considered essential to
increase the public’s understanding of the performance scheme and the accountability of those
directly or indirectly responsible for the delivery of services. Indeed, the analysis and discussion on
possible alternative indicators made participants aware of the strengths and weaknesses of each
option and gave indications on the links between policy areas (Brezzi and Utili, 2007).
HOW'S LIFE IN YOUR REGION? MEASURING REGIONAL AND LOCAL WELL-BEING FOR POLICY MAKING © OECD 201422 – REGIONAL FRAMEWORK FOR MEASURING WELL-BEING
Box 2. Using indicators to improve policy delivery:
The case of Obiettivi di servizio in Italy (cont.)
Once the performance framework was set up, regional authorities were asked to draft an action
plan, encompassing the whole range of actions needed to reach the targets in the four policy areas.
The actions can include investments, supported with all available financing sources, but also
legislative, regulatory or organisational actions.
While the original framework was changed during the implementation, with respect to both the
allocation rule of the financial reward to performing regions and its amount (which was halved from
the planned EUR 3 billion), all of the other features were maintained (objectives, indicators, targets,
action plan). In particular, the Department for Economic Development and Cohesion has worked
closely with the regions to assess the results and consequently update the Action Plan (Anselmo,
2012).
Source: Authors’ elaboration based on www.dps.tesoro.it/obiettivi_servizio.
Third, the Regional Planning Centre (CRP) aims to make a better use of the existing
evidence to support the well-being agenda. Many statistics are available at a territorial
level from Istat and other sources. More recently, national initiatives to measure
well-being have gathered a set of indicators, many of which are available with regional
detail, organised in 12 well-being dimensions (Istat-Cnel BES, 2013). Sardinia could use
the available information to measure well-being and compare it with other regions in Italy
and in the OECD area, without a large investment in statistical production.
Moreover, Sardinia has developed a comprehensive measure of internal disparities.
The region has published the Index of Multi-Deprivation (IDMS, Indice di deprivazione
multipla della Sardegna), which is applied to the 377 municipalities and refers to 2011
(Box 3). The results show municipalities where deprivation in one dimension is
particularly high and thus can help target policies and financial resources, for example, to
fight poverty or the school dropout rate (Figure 8). They can also give indications on
which dimensions of deprivation tend to be associated with each other, helping design
comprehensive policies and tackle inequalities. Future updates and uses of the Index of
Multi-Deprivation could include supporting local and regional decisions, particularly in
project definition and selection.
Box 3. The Index of Multi-Deprivation in Sardinia
The Regional Planning Centre, in collaboration with the University of Cagliari, has
developed an Index of Multi-Deprivation applied to the 377 municipalities of Sardinia referring
to the year 2011.
The index includes seven dimensions: income, jobs, education, health, environment, access
to basic services and safety. Each dimension is measured by one or more indicators and provides
a picture of the inter-municipal differences in deprivation.
Indicators in each of the seven domains are transformed into indices ranging from 0 to 1
(highest deprivation), then compiled into a single number. Therefore, municipalities are ranked
by level of multi-deprivation (composite index) as well as by the level of deprivation in each
dimension.
Most of the data come from administrative sources, published for the first time, and none of
the dimensions includes subjective measures.
Source: Sistema Informativo IDMS (2013), Gli svantaggi dei comuni sardi, Tangram Ed,
www.sardegnaprogrammazione.it/documenti/35_84_20140213123944.pdf.
HOW'S LIFE IN YOUR REGION? MEASURING REGIONAL AND LOCAL WELL-BEING FOR POLICY MAKING © OECD 2014You can also read