Indian Monetary Policy in the Time of Inflation Targeting and Demonetisation - By Rakesh Mohan & Partha Ray - Brookings Institution
←
→
Page content transcription
If your browser does not render page correctly, please read the page content below
Indian Monetary Policy
in the Time of Inflation
Targeting and
Demonetisation
By Rakesh Mohan & Partha Ray

                               W O R K I N G P A P E R - 4 M AY 2 0 1 8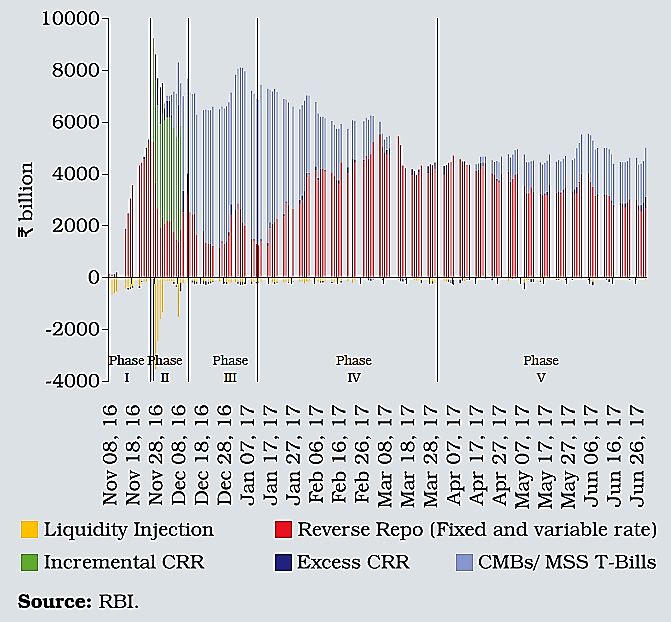
Brookings India Working Paper

© 2018 Brookings Institution India Center
No. 6, Second Floor,
Dr. Jose P Rizal Marg, Chanakyapuri,
New Delhi - 110021
www.brookings.in

Recommended citation:
Mohan, Rakesh; Ray, Partha. “Indian Monetary Policy in the Time of Inflation
Targeting and Demonetisation,” Brookings India Working Paper 4, May 2018.

An earlier version of the paper has been presented at the 27th conference of
Asian Economic Policy Review (AEPR) in Tokyo on April 7, 2018.

The Brookings Institution India Center serves as a platform for cutting-edge,
independent, policy-relevant research and analysis on the opportunities and
challenges facing India and the world. Established in 2013, the Center is based in
New Delhi, and registered as a company limited by shares and not for profit, under
Section 8 of the Companies Act, 2013 (formerly Section 25 of the Companies Act,
1956). Our work is centred on the motto of “Quality, Independence, Impact.”

All content reflects the individual views of the author(s). Brookings India does not hold
an institutional view on any subject.
Indian Monetary Policy
in the Time of Inflation
Targeting and
Demonetisation
By Rakesh Mohan & Partha Ray
Rakesh Mohan
Senior Fellow at the Jackson Institute for Global Affairs,
Yale University
And Distinguished Fellow, Brookings India
e-mail: rakesh.mohan@yale.edu

Partha Ray
Professor, Economics Group,
Indian Institute of Management Calcutta
e-mail: pray@iimcal.ac.in
Abstract
This paper provides a narrative of Indian monetary policy since the North Atlantic
Financial Crisis (NAFC) in the mid-2008 till the current period. The period 2009-
13 was dominated by the joint monetary and fiscal stimuli of the Indian authorities
prompted by the NAFC. These, along with some structural shocks and a hands-off
attitude in forex market intervention, could have had their role in rising inflation
and external account instability (leading up to the taper tantrum episode). In this
backdrop, after considerable discussion during 2013-2014, a Monetary Policy
Framework Agreement (MPFA) was signed between the Government of India and the
Reserve Bank of India (RBI) on February 20, 2015, which formally adopted flexible
inflation targeting (IT) in India. Under the new statutory IT framework, a six-member
Monetary Policy Committee (MPC) met for the first time on October 3 and 4, 2016.
While the IT regime so far has coincided with significant reduction in inflation in
India, the atmosphere has been benign. Now that fuel prices have started moving in
the north-east direction, a revised framework for the Minimum Support Price (MSP)
in the Union Budget for 2018-19 has been proposed by the government and fiscal
slippages have started happening, it remains to be seen whether IT can withstand
more rough weather in the days to come. Finally, in recent years, Indian monetary
policy has been dominated by two significant events: the emergence of significant
deterioration of Indian public sector balance sheets, and the demonetisation episode
in November 2016. Monetary policy in both of these periods wrestled with fashioning
an appropriate strategy for managing the impossible trinity.
INDIAN MONETARY POLICY

                       1. Introduction
                       The story of Indian monetary policy and financial sector reforms from the early
                       1990s to 2009 has been chronicled in some detail by both the authors.1 During
                       this period, a financially repressed economy, characterised by high statutory pre-
                       emption, sectoral credit targets, administered interest rates and fiscal dominance,
                       traversed a sea change in its financial sector structure, conduct and performance
                       through a comprehensive reform process. As financial repression was progressively
                       dismantled, interest rates deregulated, the banking sector liberalised, financial and
                       money markets developed and fiscal dominance reduced, the Indian financial sector
                       emerged as a market oriented modern system by the mid-2000s.

                                Monetary policy reform was a key element of this process. Till about the
                       mid-1980s, monetary policy in India was more appropriately characterised as “credit
                       planning”, whereby the main objective was to channel credit at cheap administered
                       rates for the developmental needs of the economy, with public sector banks acting
                       as the key intermediaries. Inflation was dominated by structural shocks like flood,
                       drought or changes in oil prices. The first break in monetary policy formulation came
                       about in the mid-1980s when monetary targeting was adopted, wherein the targeted
                       path of monetary expansion was designed to fund the ‘desired growth of GDP in
                       nominal terms’, i.e., growth after accounting for tolerable inflation. Though the
                       Reserve Bank of India (RBI) had introduced a number of money market instruments in
                       the late 1980s, together with deregulation of interest rates on existing money market
                       instruments, these were mostly at the periphery. Thus, in the absence of a well-
                       functioning money market and predominance of RBI credit to the central government,
                       the primary tool of monetary policy was the traditional cash reserve ratio (CRR) that
                       aimed at controlling overall money supply to contain inflationary pressures while also
                       keeping in mind the objective of providing bank credit to the commercial sector.
                       Besides, fiscal dominance through significant automatic monetisation of budget
                       deficits deprived the RBI of operational autonomy.

                               Monetary policy started to become operationally independent when the
                       practice of automatic monetisation through creation of ad hoc treasury bills was
                       completely eliminated in April 1997.2 Just as monetary targeting had lost favour in
                       advanced economies, its effectiveness in India began to be questioned in the mid-
                       1990s. Consequently, the RBI announced in April 1998 that it would switch to a
                       “multiple indicators approach”, wherein “besides broad money, which remains as an

1
 See Mohan (2008) for a summary. Mohan (2009), Mohan (2011) and Ray (2011) provide detailed narratives of the reform process
design and implementation over this period.
2
 Later in 2003, with the passing of the Fiscal Responsibility and Budget Management Act (FRBM) RBI is now not legally allowed to
lend directly to the government.                                                                                                   7
INDIAN MONETARY POLICY
information variable, a host of macroeconomic indicators including interest rates
or rates of return in different markets (money, capital, and government securities
markets) along with such data as on currency, credit extended by banks and
financial institutions, fiscal position, trade, capital flows, inflation rate, exchange rate,
refinancing and transactions in foreign exchange available on high frequency basis
are juxtaposed with output data for drawing policy perspectives in the process of
monetary policy formulation” (Mohan, 2008).
The monetary policy operating framework was simultaneously modernised
so that the money market could operate effectively. A Liquidity Adjustment Facility
(LAF) was set up in 2000, which enabled the RBI to use the repo and reverse repo
rates as the key policy signalling rates providing a corridor for overnight money market
rates. This combination of the multiple-indicator approach and monetary operations
through LAF has constituted the operating framework of Indian monetary policy ever
since late 2013.
In this paper we chronicle Indian monetary policy since the North Atlantic
Financial Crisis (NAFC) in the mid-2008 till the current period.3,4 The period 2009-
13 was dominated by the joint monetary and fiscal stimuli prompted by the NAFC,
and their consequences in rising inflation and external account instability leading
up to the taper tantrum episode. Indian monetary policy after 2013 has been
dominated by three significant events: the adoption of inflation targeting in 2014,
the emergence of significant deterioration of Indian public sector balance sheets,
and the demonetisation episode of November 2016. Policy in both of these periods
wrestled with fashioning an appropriate strategy for managing this impossible trinity.
This paper is an account of some of these issues and shocks concerning
Indian monetary policy since the emergence of the NAFC in late 2008. For ease
of expository convenience, the rest of the paper is organised as follows: Section 2
gives a perspective of monetary policy making in India till the NAFC. Section 3 is
devoted to a discussion of Indian monetary policy after the NAFC. The evolution and
adoption of India’s IT regime is taken up in Section 4. Section 5 is devoted to three
contemporary challenges of Indian monetary policy, viz., (a) demonetisation; (b) spurt
of non-performing assets and (c) strategy of intervention in the forex market. Section
6 concludes this study.
3
Our choice of the term NAFC, in contrast to the more popular usage of global financial crisis (GFC), has been conscious and has been
prompted by (a) the origin of the crisis; and (b) its uneven spread across the globe beyond the North Atlantic.
4
Mohan (2008) has covered the period up to 2008.
8INDIAN MONETARY POLICY
2. Monetary Policy in India in the New
Millennium till the NAFC
The new millennium witnessed the introduction of modern monetary policy making
in India whereby monetary policy is signalled through periodic modification of policy
interest rates. The RBI’s operating framework moved to the management of daily
excess (or shortage of) liquidity in the money market: primarily through open market
operations, outright or reverse repos/repos. This was implemented through operation
of the Liquidity Adjustment Facility (LAF) in 2000:
• Under the announced repo and reverse repo rates RBI carries out repo/
reverse repo operations, thereby anchoring overnight money market
rates within this corridor.
• The LAF has settled into a fixed rate overnight auction mode since April
2004.
• LAF operations continue to be supplemented by access to the RBI’s
standing facilities linked to the LAF repo rate – export credit refinance
to banks and standing liquidity facility to the primary dealers.5
A major challenge of monetary policy during this period was the flood of
capital inflows into India resulting from the push of accommodative monetary policy
in the advanced economies (AEs) and pull of the fast growing Indian economy
(Table 1). To manage the sterilisation needed to handle the liquidity impact of such
inflows, a major monetary policy innovation in the Indian context was introduction
of the Market Stabilization Scheme (MSS) in early 2004. Under this scheme, “the
government agreed to allow the RBI to issue Treasury bills and dated securities under
a new Market Stabilization Scheme (MSS) where the proceeds of MSS bonds are held
by the government in a separate identifiable cash account maintained and operated
by the RBI. The amounts credited into the MSS account are appropriated only for
the purpose of redemption of these instruments” (Mohan, 2008).6 Apart from these
instruments, India was one of the earliest users of macro prudential measures so as
to attain the objective of financial stability. Continuous institutional deepening and
market development have been the major features of financial sector development
and reforms in monetary policy in India.
5
The LAF has helped to stabilise overnight call rates within a specified corridor. The LAF is also effective in modulating liquidity in the
economy, which is affected continuously by changes in government cash balances, and by the volatility in excess capital flows.
6
These securities have all the attributes of existing Treasury bills and dated securities are indistinguishable from regular government
securities in the hands of the creditors. They are serviced like any other marketable government securities but their interest costs are
shown separately in the budget. At the same time, there is an increase in the holdings of the RBI’s foreign currency assets, which leads
to higher earnings for the RBI and these are mirrored in higher surplus profit transfers to the central government from the RBI. Thus, the
interest expenses incurred by the government on account of issuances under the MSS are offset by higher transfers from the RBI.
9INDIAN MONETARY POLICY
What were the outcomes of monetary policy in India during this period?
Chart 1 plots the relevant monetary policy rates along with call money rate and inflation
(as measured by wholesale price index, WPI) during 2000-01 through 2007-08.7
CHART 1: Monetary Policy Rates in India: 2000-01 through 2007-08
Source: Database on Indian economy, RBI website.
In this context it is instructive to turn to Mohan (2008) who noted:
“In the final analysis, the efficacy of monetary policy has to be evaluated in terms of
its success or otherwise in achieving the ultimate goals of price stability and moderation in the
variability of the growth path. In terms of the variability of real GDP growth, India outperformed
most EMEs and developed economies during the 1990s. While variability of output growth
has increased modestly during 2000–2007, India continues to experience stability in growth
conditions along with some developed countries and EMEs that have adopted inflation
targeting as a common feature. ...Of course, the stability in the growth conditions cannot
be attributed entirely to the conduct of monetary policy; it is also attributable to other key
developments, such as better inventory management by firms, growing use of information
technology, rising share of the services sector activity in output, and overall stability in the
policy framework. Furthermore, it is important to note that India’s growth is largely driven
by domestic consumption. ...In terms of inflation volatility, the Indian experience has been
more rewarding. Over the 1990s and up to the recent period, variability of inflation in India
has been low, attesting to the effectiveness of monetary policy in reducing the inflation-
risk premium. During this period, improvement in the fiscal scenario has also contributed
towards the moderation in inflation and inflation expectations. The significant turnaround in
the inflation outcome reflected the improved monetary–fiscal interface during this period”
(Mohan, 2008, pp. 230-232).
In this backdrop, the rest of paper presents a narrative of the Indian monetary
policy since the NAFC in end-2008.
7
Indian financial year spans over April of the previous year to March of the current year, i.e., 2000-01 indicates the period April 2000
through March 2001.
10INDIAN MONETARY POLICY
3. Monetary Policy in the aftermath
of the NAFC in India (2008-2013)
It is important to recall the economic and monetary context that existed in India
when the NAFC broke in 2008. The initial impact of the crisis on the Indian economy
was rather muted. Following the cuts in the U.S. Fed Funds Rate in August 2007,
there was a massive jump in net capital inflows into the country, amounting to almost
10 per cent of GDP in 2007-08. Despite the measures taken by the Reserve Bank
to sterilise the liquidity impact of consequent large foreign exchange purchases in
2007-08, inflationary pressures emanated from both strong domestic demand and
elevated global commodity prices.8 The concern at that time was clearly with elevated
inflation.
Whereas the direct effect of the sub-prime crisis on Indian banks/financial
sector was almost negligible because of limited exposure to complex derivatives and
other macro-prudential policies put in place by the Reserve Bank, some elements
of stress did emerge on both Indian financial markets and real sector. Following the
Lehman failure in September 2008, the external environment witnessed a classic
sudden stop. After the unprecedented $108 billion net capital inflows in 2007-08,
they fell to just $9 billion during 2008-09. While foreign direct investment (FDI) flows
exhibited resilience, access to external commercial borrowings and trade credits was
rendered somewhat difficult. Furthermore, as in the case of other major emerging
market economies (EMEs), there was a sell-off in domestic equity markets by foreign
portfolio investors reflecting deleveraging in their home markets. This led to large
capital outflows during September-October 2008, with concomitant pressures in
the foreign exchange market necessitating substantial usage of foreign exchange
reserves by the RBI, and a consequent squeeze on domestic rupee liquidity.
Consistent with global economic impact of the NAFC through trade and
financial channels, the Indian economy also witnessed moderation in growth in the
second half of 2008-09 after consistent high growth in the preceding five years (8.8
per cent per annum). Industrial output exhibited a decline in Q4 2008-09 for the first
time since the mid-1990s.
To ease both domestic and foreign exchange liquidity contraction the RBI
announced a series of measures starting mid-September 2008, encompassing both
monetary policy and proactive liquidity management measures.9 First, monetary policy
8
Press release, Macroeconomic and Monetary Developments First Quarter Review 2008-09, July 28, 2008, available at https://www.
rbi.org.in/scripts/BS_PressReleaseDisplay.aspx?prid=18883 (accessed in February 2018).
9
The advent and transmission of NAFC to India almost coincided with a change of guard in both the Reserve Bank of India, and the
Ministry of Finance. D. Subbarao took over from Y. V. Reddy as RBI Governor on September 6, 2008, and Pranab Mukherjee became the
Finance Minister of India on January 24, 2009, succeeding P. Chidambaram who had been in office since mid-2004.
11INDIAN MONETARY POLICY
was eased substantially: the repo rate was reduced from 9 to 4.75 per cent and the
reverse repo rate from 6 to 3.25 per cent between August 2008 and April 2009. The
effective policy rate actually swung from 9 to 3.25 per cent as the economy moved to
an excess liquidity from a shortage situation. Second, a range of measures were taken
between October 2008 and April 2009 to forestall any potential liquidity pressures
throughout the financial system. The RBI adopted both conventional measures, such
as reduction of the cash reserve ratio (CRR), as well as a range of unconventional
measures. The following may be mentioned in particular:
Enhancement of broad market liquidity
• Significant reduction in the CRR from 9 per cent to 4.75 per cent (as on
April 21, 2009);
• Unwinding the market stabilisation scheme (MSS) securities.
Special unconventional facilities for specified financial institutions
• Introduction of a special repo window under the liquidity adjustment
facility (LAF) for banks for on-lending to mutual funds, non-banking
financial companies (NBFCs) and housing finance companies (HFCs);
• Institution of a special purpose vehicle (SPV) set up to provide liquidity
support to non-banking financial companies;
• Introduction of a special refinance facility that banks can access without
any collateral.
Facilities for forex liquidity
• Substantial forex market intervention through use of foreign exchange
reserves;
• Upward adjustment of the interest rate ceilings on different types of
foreign currency non-resident deposits;
• Relaxation of the external commercial borrowings regime;
• Allowing NBFCs/HFCs access to foreign borrowing and allowing
corporates to buy back foreign currency convertible bonds; and
• Institutions of a rupee-dollar swap facility for banks with overseas branches.
These measures resulted in augmentation of potential liquidity of over Rs 5.85
trillion (Table 1), thereby easing the liquidity position (possibly excessively) starting
mid-November 2008 and injecting confidence in domestic financial markets.10
10
By October 2009 a process of exit from many of these unconventional measures had started. The statutory liquidity ratio (SLR), which
was reduced from 25 per cent of demand and time liabilities to 24 per cent, was restored to 25 per cent. The limit for export credit
refinance facility, which was raised to 50 per cent of eligible outstanding export credit, was returned to the pre-crisis level of 15 per
cent. Besides, the two non-standard refinance facilities: (a) special refinance facility for scheduled commercial banks; and (b) special
term repo facility for scheduled commercial banks (for funding to mutual funds, non-banking financial companies, and housing finance
companies were also discontinued. See, RBI’s Second Quarter Review of Monetary Policy for the Year 2009-10 for details (available at
https://www.rbi.org.in/scripts/Annualpolicy.aspx ).
12INDIAN MONETARY POLICY
TABLE 1 : Liquidity Injection/Availability during September 2008-September 2009
MEASURE/FACILITY AMOUNT (RS. BILLION) % OF GDP (2008-09)
1. CRR Reduction 1,600 2.9
2. Unwinding/Buyback/De-sequestering of MSS Securities 1,590 2.9
3. Open Market Operations (purchases) * 1,041 1.9
4. Term Repo Facility 600 1.1
5. Increase in Export Credit Refinance 223 0.4
6. Special Refinance Facility for SCBs (Non-RRBs) 385 0.7
7. Refinance Facility for SIDBI/NHB/EXIM Bank** 160 0.3
8. Liquidity Facility for NBFCs through Special Purpose Vehicle @ 250 0.4
9. Total (1 to 8) 5,850 10.5
Memo: Statutory Liquidity Ratio (SLR) Reduction 400 0.7
* Includes Rs 575 billion of OMO purchases against the proposed OMO purchases of Rs 800 billion during the first
half of 2009-10.
**SIDBI: Small Industrial Development Bank of India; NHB: National Housing Bank of India.
@ Includes an option of Rs 50 billion.
Source: Reserve Bank of India (2010): Report on Currency & Finance, 2008-09.
In response to the fiscal and monetary stimuli put in place, and in contrast to
the prevailing pessimistic global outlook, real Indian GDP growth recovered in 2009-
10 and 2010-11 to 8.6 and 8.9 per cent respectively. However, this strong recovery
started getting mirrored in rising inflation: initially in food inflation (by end-2009)
followed by underlying inflation by April 2010. Elevated international commodity
prices, domestic problems related to the availability of select domestic food items
(pulses and other protein items), increasing administered food grain prices, and
enhanced rural wage growth resulting from employment programmes,11 contributed
to these inflationary pressures (e.g., Khundrakpam, 2008; Joshi and Acharya, 2011;
Kapur, 2013; Patra & others, 2014; Ball & others, 2014).
It is useful to examine the inflationary trends over a relatively longer period
(Chart 2). Inflationary pressures had begun to emerge just before the NAFC but then
reversed immediately after the crisis. Inflation expectations responded in like fashion
but became persistently high only after early 2010.12
11
Under the Mahatma Gandhi National Rural Employment Guarantee Act.
12
The RBI has been conducting Inflation Expectations Survey of Households (IESH) on a quarterly basis since September 2005. The Sur-
vey seeks qualitative responses from households on price changes (general prices as well as prices of specific product groups) in the next
three months as well as in the next one year and quantitative responses on current, three-month ahead and one-year ahead inflation
rates. The results of this Survey are being used as one of the important inputs to the monetary policy formulation.
13INDIAN MONETARY POLICY
Chart 2: WPI Inflation, CPI and Inflation Expectations (Mean) (Per cent): 1996-2013
14
12
10
8 14
12
6
10
4 8
6
2
4
0 2
0
-2
1996 -2 1998 2000 2002 2004 2006 2008 2010 2012
1996 1998 2000 2002 2004 2006 2008 2010 2012
CPI_INFLATION
CPI_INFLATION
Current Inflation Expectation
Current Inflation Expectation
WPI Inflation
WPI Inflation
Source: Database on Indian economy, RBI website.
As inflationary pressures became increasingly evident, monetary policy was
tightened gradually from April 2010 to late 2013 (Chart 3a and 3b). However, the
pace of tightening was probably too gradual, as real policy rates remained in negative
territory and monetary accommodation thus continued till early 2013. In contrast
to the rather benign period of relatively low inflation (and muted expectations)
during the previous 15 years or so, consumer price indes (CPI) inflation and inflation
expectations became elevated, reaching near double digits between 2010 and 2013.
This inflation process quickly became generalised as strong demand pressures along
with rising input costs, through wages and raw-material prices, quickly transmitted to
output prices of goods and services leading to sharp increases in underlying inflation
(Table 2) (Benes & others, 2016). This extended period of high inflation and inflation
expectations contributed to the adoption of inflation targeting in 2014.
An important criticism of monetary policy of this period is whether Indian
monetary expansion during 2008 and 2010 was consistent with the Indian economic
14INDIAN MONETARY POLICY
conditions of the time or whether it was influenced excessively by the global
bandwagon of expansionary monetary and fiscal policy. Given that the Indian banking
system had little exposure to the so-called sub-prime toxic assets, and that domestic
consumption continued to play a significant role in demand generation in India, such
criticism cannot be rejected.
CHART 3: Monetary Policy Rates in India: 2008-2013
(a) Nominal Monetary Policy Rates in India
Source: Database on Indian economy, RBI website.
(b) Real Monetary Policy Rates (i.e., Nominal Rate minus WPI Inflation) in India
Source: Database on Indian economy, RBI website.
15INDIAN MONETARY POLICY
Table 2: Inflation Rates based on Wholesale Price Index (2004-05 = 100)
(Per cent per annum)
All Primary Food Non-Food Fuel and Manufactured
Commodities Articles Articles Articles Power Products
2005-06 4.4 4.3 5.4 -3.3 13.6 2.4
2006-07 6.6 9.6 9.6 5.8 6.5 5.7
2007-08 4.7 8.3 7.0 11.9 0.0 4.8
2008-09 8.1 11.0 9.1 12.9 11.6 6.2
2009-10 3.8 12.7 15.3 5.5 -2.1 2.2
2010-11 9.6 17.7 15.6 22.3 12.3 5.7
2011-12 8.9 9.8 7.3 9.6 14.0 7.3
2012-13 7.4 9.8 9.9 10.5 10.3 5.4
2013-14 6.0 9.8 12.8 5.6 10.2 3.0
Source: Database on Indian economy, RBI website (accessed February 2018).
External Management
There was a significant change during 2009-2013 in the RBI’s capital account
management and foreign exchange market intervention policies. The RBI seems to
have practiced a hands-off approach during this period (Chart 3) even though there
was no announced change in Indian exchange rate policy.13 The results can be seen
in Chart 4: both the nominal and real exchange rates appreciated, accompanied
by a widening trade and current account deficit until late 2011, but there was no
corresponding foreign exchange intervention. This hands-off approach to forex
market intervention by the RBI during this period was also accompanied by loosening
of restrictions on foreign portfolio investment in the domestic government securities
and corporate debt markets. With falling global interest rates, debt portfolio inflows
amounted to between 1.5 and 2 per cent of the gross domestic product (GDP) in
2012 and 2013, until the taper tantrum. These flows added to the upward pressure
on the exchange rate in the absence of intervention.
13
This policy is best captured in following statement of Governor Bimal Jalan, “RBI does not have a fixed ‘target’ for the exchange rate
which it tries to defend or pursue over time; RBI is prepared to intervene in the market to dampen excessive volatility as and when nec-
essary; RBI’s purchases or sales of foreign currency are undertaken through a number of banks and are generally discrete and smooth;
and market operations and exchange rate movement should, in principle, be transaction-oriented rather than purely speculative in
nature.” (Jalan, 2003).
16INDIAN MONETARY POLICY
CHART 4: Purchase & Sale of USD by the RBI (USD Million)
Source: Database on Indian Economy, RBI Website (accessed February 2018).
The RBI finally changed its intervention strategy after being bitten by the
taper tantrum which also coincided with a change of guard in RBI with Raghuram
Rajan taking over a RBI Governor on September 5, 2013.
The appreciating exchange rate, accompanied by high domestic demand,
and loosening of restrictions on the import of gold into India, all contributed to
continuing deterioration in the current account, and consequent loss of confidence.
India then got included in the “fragile five” during the “taper tantrum”. As capital
outflows from India accelerated on account of both debt and equity,14 (though
predominantly from the recently opened domestic debt markets) the Indian rupee-
U.S. dollar exchange rate came down from Rs 56.8 to Rs 67.9 during June and
August 2013, indicating a depreciation of nearly 16 per cent over just three months
(Chart 5).15 Admittedly, various factors can be held responsible behind such a widening
of current account deficit, such as (a) sluggish global growth since 2009 that has
impacted India’s export markets; (b) despite sluggish global growth, elevated levels
of international commodity prices (perhaps supported by accommodative monetary
policies of the advanced economies, abundant global liquidity and near zero interest
rates); and (c) domestic supply and policy constraints leading to increase in imports of
coal (from around 0.5 per cent of GDP during 2004-08 to 0.9 per cent in 2011-12)
14
On May 22, 2013, U.S. Federal Bank Chairman Ben Bernanke made the following statement in his testimony before the U.S. Con-
gress: “Over the nearly four years since the recovery began, the economy has been held back by a number of headwinds. Some of these
headwinds have begun to dissipate recently, in part because of the Federal Reserve’s highly accommodative monetary policy”. This
statement was largely interpreted by the financial market players as a hint that the U.S. Fed may soon start tapering off the size of the
bond-buying programme.
15
The Finance Minister in a statement on August 23, 2013 is reported to have said, “The panic that has gripped the currency market is
unwarranted; we believe that the rupee is undervalued and has overshot what is generally believed to be a reasonable and appropriate
level” (The Economic Times, August 23, 2013); available at https://economictimes.indiatimes.com/news/economy/policy/finance-min-
ister-p-chidambaram-says-rupee-undervalued-slams-excessive-pessimism/articleshow/21987659.cms
17INDIAN MONETARY POLICY
or restrictions on iron ore mining activity since 2010-11 (Kapur and Mohan, 2014).
This period was also associated with steep depreciation of nominal exchange rate
of Indian rupee-USD (Chart 5c). Even in terms of real exchange rate, there was a
depreciating trend (despite some gyrations) since January 2011 - the depreciating
trend has been very stark since January 2013 (Chart 5b).
CHART 5: India’s Current Account Balance and Exchange Rate: 2007-08 through 2013-14
(a) Current Account Deficit (as % of GDP)
(b) Movement in 36 Country REER (c) Rs-USD Exchange Rate
(2004-05: April-March =100)
Source: RBI website (accessed February 2018).
18INDIAN MONETARY POLICY
Operating Framework
Although RBI’s operating framework remained broadly stable, some changes were
indeed put into operation in May 2011. The RBI reduced its forex intervention
drastically after 2009 when liquidity switched to the deficit mode. The operation
of the liquidity adjustment facility (LAF) of the RBI was now modified. Consequent
to acceptance of the recommendations of the RBI Working Group on Operating
Procedure of Monetary Policy (RBI, 2011), following changes were made effective:
• The weighted average overnight call money rate (WACMR), the only one
independently varying policy rate, became the operating target of monetary
policy.
• The reverse repo rate continued to be operative but it was pegged at a
fixed 100 basis points below the repo rate.
• A new Marginal Standing Facility (MSF) was instituted from which banks
can borrow overnight (on a non- collateralised basis) up to one per cent of
their respective Net Demand and Time Liability (NDTL); the rate of interest
on amount accessed from this facility was 100 basis points above the
repo rate.
• As per the above scheme, the revised corridor would have a fixed width of
200 basis points. The repo rate will be in the middle. The reverse repo rate
will be 100 basis points below it and the MSF rate 100 basis points above it.
• While the width of the corridor is fixed at 200 basis points, the RBI would
have the flexibility to change the corridor, should monetary conditions so
warrant.
What was the performance of Indian monetary policy during this period?
While India’s macroeconomic stability was similar to the leading emerging markets
until the late 1990s and between 2003 and 2007, a recent report from the World
Bank has noted, “India experienced significantly lower and deteriorating levels of
macroeconomic stability between 2008 and 2012... While growth revived momentarily
after the GFC, this was at the expense of high budget and current account deficits
and high inflation, putting the sustainability of India’s post-crisis growth experience
into question (World Bank, 2018).16
16
An index of macroeconomic stability was constructed as an average of the standardised indexes of CPI inflation, current account
deficit (per cent of GDP), and fiscal deficit (per cent of GDP).
19INDIAN MONETARY POLICY
4. Monetary Policy after the Taper
Tantrum: Towards Inflation
Targeting (IT) (2013-18)
Backdrop
RBI’s approach to monetary policy during November 1997 to September 201317 was
characterised as a “multiple indicators approach”.18 Inflation was, of course, a key
element among the vector of variables that were included under the multiple indicator
approach. As then Governor Reddy indicated, the RBI – instead of a formal inflation
target – set out an outlook for inflation in each monetary policy statement which
served in some ways as a target under the circumstances. He described his approach
to inflation at that time as “self-imposed, indicative inflation targeting, consistent
with global trends, and the compulsions of maintaining growth momentum” (Reddy,
2017).
Why had the RBI not adopted inflation targeting earlier? First, unlike many
other developing countries, India had a record of moderate inflation, with double digit
inflation being the exception, and which is otherwise largely socially unacceptable.
Inflation targeting has been especially useful in countries that have experienced
high inflation prior to the adoption of inflation targeting. Second, inflation targeting
requires an efficient monetary transmission mechanism through the operation of
efficient financial markets and absence of interest rate distortions. In India, although
the money market, government and corporate debt and forex markets have indeed
developed in recent years, they still have some way to go. Moreover, a number of
administered interest rates continue to exist. Third, as we have seen, inflationary
pressures often emanate from significant exogenous supply shocks, particularly from
energy and food price sources. Targeting some theoretical “core inflation” rate, which
excludes a significant portion of any inflation index in a low income economy, was felt
to have little utility. Fourth, till very recently India did not have a pan-India consumer
price index (CPI).19
17
This covers the regimes of governors Jalan, Reddy and Subbarao.
18
As already noted, Governor Jalan was credited to have been the initiator of this approach. In his monetary policy statement of April
1998, making a departure of the erstwhile practice of monetary targeting, the RBI announced that it would switch to a multiple indica-
tors approach “to widen the range of variables that could be taken into account for monetary policy purposes rather than rely solely on
a single instrument variable such as growth in broad money (M3)”.
19
In fact, governors Jalan, Reddy and Subbarao were on record in speaking against IT; see for example, Reddy (2008), Mint (2017) and
Subbarao (2011).
20INDIAN MONETARY POLICY
The emphasis on inflation targeting appeared officially for the first time in
the Report of the Committee on Financial Sector Reforms (CFSR), constituted by
the Government of India (Planning Commission) and chaired by Raghuram Rajan
(then Professor at University of Chicago).20 The Committee argued that the RBI “can
best serve the cause of growth by focusing on controlling inflation”, and explicitly
recommended, “The RBI should formally have a single objective, to stay close to a
low inflation number, or within a range, in the medium term, and move steadily to
a single instrument, the short-term interest rate (repo and reverse repo) to achieve
it” (Government of India, 2007; p.5). Subsequently, the Financial Sector Legislative
Reforms Commission (FSLRC) (Government of India, March 2013) also endorsed this
view. Further, the FSLRC explicitly recommended formation of a Monetary Policy
Committee (MPC). Until 2013, there was a consistent explicit difference of opinion
on the desirability of inflation targeting (IT) in India: while views from government and
some academics tended to favour IT, the RBI for all practical purpose was against it
for the reasons given above. Until 2009 RBI’s multiple indicators approach had been
successful: inflation had been contained in mid-single digits for almost 15 years since
the mid-1990s. However, the emergence of sustained double-digit inflation (and
enhanced inflation expectations) between 2009 and 2013 brought more support for
the adoption of inflation targeting.
RBI’s view changed as Raghuram Rajan took over as RBI Governor in
September 2013. In his opening statement, taking support from the preamble to
the RBI Act21 he said, “The primary role of the central bank, as the Act suggests, is
monetary stability, that is, to sustain confidence in the value of the country’s money....
Ultimately, this means low and stable expectations of inflation, whether that inflation
stems from domestic sources or from changes in the value of the currency, from
supply constraints or demand pressures. I have asked Deputy Governor Urjit Patel,
together with a panel he will constitute of outside experts and RBI staff, to come up
with suggestions in three months on what needs to be done to revise and strengthen
our monetary policy framework”.22
The Patel Committee23 submitted its report on January 21, 2014 and
stated:
“Drawing from the review of cross-country experience, the appraisal of India’s
monetary policy against the test of outcomes and the recommendations made
20
Interestingly, this Committee did not have any representation from the RBI.
21
The RBI Act preamble stated RBI’s objective : “to regulate the issue of Bank notes and the keeping of reserves with a view to securing
monetary stability in India and generally to operate the currency and credit system of the country to its advantage”.
22
“Statement by Raghuram Rajan on taking office on September 4, 2013”, available at
https://rbi.org.in/Scripts/BS_PressReleaseDisplay.aspx?prid=29479
23
Urjit Patel later succeeded Raghuram Rajan as Governor of the RBI in September 2016.
21INDIAN MONETARY POLICY
by previous committees, the Committee recommends that inflation should be the
nominal anchor for the monetary policy framework. This nominal anchor should
be set by the RBI as its predominant objective of monetary policy in its policy
statements. ...Subject to the establishment and achievement of the nominal
anchor, monetary policy conduct should be consistent with a sustainable growth
trajectory and financial stability” (RBI, 2014; p. 11; emphasis added).
After considerable discussion a Monetary Policy Framework Agreement
(MPFA) was finally signed between the Government of India and the RBI on February
20, 2015, specifying the following:
• Government has set a target for RBI to bring down inflation below 6 per
cent by January 2016, 4 per cent for financial year and all subsequent years
with band of +/- 2 per cent;
• If RBI fails to meet the target, it will report to the government with the
reasons for the failure to achieve the target and propose remedial actions to
be taken;
• The RBI will further estimate the time period within which the failed
target would be achieved.
Flexible inflation targeting was formally adopted in India with the signing of
the MPFA. Subsequently, the RBI Act was amended on May 14, 2016 to give the
key provisions in the MPFA a statutory basis. Accordingly, the central government, in
consultation with the Reserve Bank, notified the inflation target of 4.0 per cent (with
6.0 per cent and 2.0 per cent as the upper and lower tolerance levels, respectively)
formally in August 2016. This inflation target is applicable for the period from August
5, 2016 to March 31, 2021. Moreover, “factors that constitute a failure to achieve
the inflation target – i.e., if the average inflation is more/less than the upper/lower
tolerance level for three consecutive quarters – have also been defined and notified
in the Official Gazette on June 27, 2016” (RBI, 2016).24
Later, a six-member Monetary Policy Committee (MPC) was formed in
September 2016.25 Nine meetings of the Monetary Policy Committee (MPC) have
24
Interestingly, while formally IT has been adopted since May 2015, for all practical purpose the monetary policy framework of the RBI
became tilted towards IT ever since Rajan took over as Governor in September 2013. The RBI started publishing a bi-annual Monetary
Policy Report from September 2014, which provides forecasts of inflation and growth as well as an assessment of the overall macroeco-
nomic conditions.
25
Out of the six members of the MPC, three ex-officio members are from the RBI (Governor/Chairperson, Deputy Governor in charge
of Monetary Policy, and one officer of the RBI, currently the Executive Director in Charge of Monetary Policy), and three non-official
external academicians. The non-official/academic members will hold office for a period of four years or until further orders, whichever
is earlier. Before the constitution of the MPC, a Technical Advisory Committee (TAC) on monetary policy with experts from monetary
economics, central banking, financial markets and public finance used to advise the RBI on the stance of monetary policy. However, its
role was only advisory in nature. With the formation of MPC, the TAC on Monetary Policy ceased to exist.
22INDIAN MONETARY POLICY
been held since then till February 2018. Now, the MPC determines the policy interest
rate required to achieve the inflation target. The voting pattern of the MPC meetings
and the minutes reveal an interesting regularity. There was complete unanimity
among the members in the first four meetings but there has been evidence of some
dissent from the majority view (in both directions) since then.
Conduct of Monetary Policy under IT
How was monetary policy conducted in India after adoption of IT? In 2013-
14, monetary policy was torn between concerns about the slowdown in growth
and external sector shock following the announcement of the tapering of the
unconventional monetary policy in the US. The RBI reduced the repo rate by 25
basis points (bps) to 7.25 per cent in May 2013 in view of the steep deceleration of
growth (more than halving from 9.2 per cent in Q4 of 2010-11 to 4.5 per cent in Q3
of 2012-13), and the RBI’s prevailing assessment of subdued activity.
Consistent with inflation targeting, monetary policy went into a tightening
mode soon after Raghuram Rajan took charge as Governor in early September 2013.
In the aftermath of the taper tantrum and the ensuing global and domestic financial
market volatility, and rising inflationary concerns (fuelled primarily by fuel price
increases) RBI increased the repo rate to 7.5 per cent. With an aim to break inflation
persistence, key policy rates were increased further in January 2014 reinforcing the
earlier hikes in the second half of 2013.
With the move towards flexible IT, the RBI set out a formal framework in 2014
to guide monetary policy operations with two key components: (a) announcement
of “a disinflationary glide path for bringing down CPI inflation to below 8 per cent
by January 2015 and to below 6 per cent by January 2016”; and (b) introduction
of “a revised liquidity management framework which aimed at strengthening
transmission in the money market by anchoring the weighted average call rate
(WACR) at or closely aligned to the repo rate” in September 2014 (RBI, 2015). By
January 2015, the rate of inflation turned out to be nearly 3 per cent below the then
target of 8 per cent. Interestingly, by the third quarter of 2014-15, a revised liquidity
management framework was implemented.26 With the institution of the revised
liquidity management framework, the role of term repo auctions under the liquidity
adjustment facility (LAF) has become significant.
26
The revised liquidity management framework had four main features:
a) subject to availability of excess SLR securities, assured access to central bank liquidity of 1 per cent of banks’ net demand and
time liabilities was provided through overnight fixed rate repo / 14-day variable rate term repo;
b) fine-tuning of operations through variable rate repo/reverse repo auctions of maturities ranging from overnight to 28 days;
c) outright open market operations to manage enduring liquidity mismatches; and
d) overnight marginal standing facility (MSF) up to excess statutory liquidity ratio (SLR) plus 2 per cent below SLR of individual banks.
23INDIAN MONETARY POLICY
In April 2016, the liquidity management framework was further revised so
as “to progressively lower the average ex ante liquidity deficit to a position closer to
neutrality”. Accordingly, the Reserve Bank injected permanent liquidity through open
market operations (outright). To minimise volatility in WACR it narrowed the policy
rate corridor around the repo rate from +/-100 bps to +/- 50 bps and reduced the
minimum daily maintenance of the cash reserve ratio (CRR) from 95 per cent of the
requirement to 90 per cent.
Under the new statutory IT framework, the six-member MPC met for the first
time on October 3 and 4, 2016. The MPC unanimously voted for a reduction in the
key policy rate by 25 bps and assessed that inflation would remain within 5 per cent
by Q4 of 2016-17 (Chart 6a). Subsequently, the MPC’s decision not to tinker with
the repo rate in late 2016 and early 2017 rate was marked by the phenomenon of
“heightened uncertainty around the outlook for growth and inflation in the aftermath
of demonetisation” (RBI, 2017).
CHART 6: Monetary Policy Rates, Call Money Rates and CPI Inflation (Year on Year; %)
a) Nominal Rates
(b) Real Rates (i.e., Nominal Rates minus CPI Inflation)
Note: Inflation refers to all India CPI inflation.
Source: Database on Indian economy, RBI website.
24INDIAN MONETARY POLICY
With the successful achievement of its below 6 per cent target for January
2016, the RBI set a target for CPI inflation at 5 per cent by March 2017 with an
eventual aim to move towards 4 per cent CPI inflation by the end of 2017-18.
Performance of IT in India
What has been the performance of the IT framework in India? The performance
on inflation control front has been impressive. First, CPI inflation has followed the
glide path specified in official documents and has come down secularly.27 Second,
inflation has been reasonably range bound within the norm of 4 per cent ± 2 per
cent. Third, the call money rate had remained within the narrower corridor between
repo and reverse repo rates (Chart 6a). Fourth, inflation expectations have been
on a downward trend, as measured by the mean perception on current inflation
in RBI’s inflation expectations survey (Chart 7). Expected inflation is, however, still
significantly higher than the inflation target.
CHART 7: Actual CPI Inflation and Inflation Expectations
Source: Database on Indian economy, RBI website.
Operating Framework (2014-18)
How did the RBI conduct its monetary policy operations during this period? The
money market, in general, was in deficit mode as posited by policy, until the initiation
of the demonetisation process on November 8, 2016, when the money market
turned into surplus and remained in this mode until late 2017. The RBI influences
liquidity in the money market through a battery of operations (Chart 8).
27
Chief Economic Adviser Arvind Subramanian is reported to have put forward a “plausible alternative macroeconomic assessment”
which is different from RBI’s assessment. As per this alternative view, the inflation outlook has been encouraging by an appreciating
exchange rate, a good monsoon and a capping oil prices by structural shifts in which economic conditions and the outlook warranted
substantial monetary policy easing; see https://scroll.in/latest/840042/rbi-repo-rate-arvind-subramanian-says-economic-condi-
tion-warrants-policy-easing for details.
25INDIAN MONETARY POLICY
CHART 8: Net Injection (+)/ Absorption (-) by the RBI (Rs Billion)
The following are the modes of RBI liquidity operations: LAF operations under: (1) Repo;
(2) Reverse Repo; (3) Term Repo; (4) Term Reverse Repo; and (5) MSF; (6) Standing liquidity
purchases; (7) MSS; (8) open market sale; (9) open market purchase. Net liquidity injection
(+) / absorption (-) is defined as: (1+3+5+6+9-2-4-7-8).
Source: Database on Indian economy, RBI website.
We have already seen that from January 2015, inflation conditions have
evolved generally in accordance with the disinflation glide path reaching 5.7 per cent
in January 2016 (below the target of 6 per cent), 3.2 per cent in January 2017 and
5.1 per cent in January 2018.
It is probably too early to fully evaluate the performance of IT in India given
its brief experience so far. However, it is pertinent to ask: how much of such lower
inflation can be attributed to adoption of IT in India? To paraphrase Easterly and
others (1993), how much of this success on the inflation front is due to good policy
and how much of it due to good luck?28
One of the earlier apprehensions on the adoption of IT in India had stemmed
from the multiplicity of price indices in the country. There are at least five major
countrywide price indices in India (Table 5). Apart from the combined CPI29 (introduced
in 2011 and now formally adopted for inflation targeting), there is also a consumer
price index (CPI) for industrial workers (CPI-IW), another one for agricultural labourers
(CPI-AL), and yet another one for rural labourers (CPI-RL), in addition to a wholesale
price index (WPI).
The weighting diagram of the combined CPI series, based on the Consumer
Expenditure Survey (CES), 2004-05 is clearly dominated by four groups: (a) food &
beverages; (b) housing; (c) fuel & light; and (d) a number of miscellaneous items (e.g.,
Household goods and services like furniture & household appliances; health; transport
28
Easterly, William, Michael Kremer, Lant Pritchett, and Lawrence H. Summers (1993): “Good Policy or Good Luck? Country Growth
Performance and Temporary Shocks”, Journal of Monetary Economics, Vol. 32, No. 3, pp/ 459-483.
29
This series has been prepared using the Modified Mixed Reference Period (MMRP) data of Consumer Expenditure Survey (CES),
2011-12, of the 68th Round of National Sample Survey (NSS).
26INDIAN MONETARY POLICY
& communication; recreation & amusement; and education) (Table 5). Of these, the
two largely exogenous segments of food and beverages and fuel and light cover over
50 per cent of the weight in the All India CPI.30 Thus the impact of monetary policy
actions on the CPI is likely to be muted, thereby reducing the efficacy of monetary
policy transmission.
Thus, while assessing the performance of IT in India, downward trends in
inflation on account of food and fuel prices appear to have incorporated some elements
of good luck during the period under consideration. In fact, an early evaluation of the
efficacy of monetary policy in India indicated some interesting factors behind the
deflationary trends in 2013-2015 (Chinnoy, Kumar and Mishra, 2016). First, 20 per
cent of the disinflation is due to a sharp decline in the discretionary component of
minimum support price (MSP). Second, the bulk of the disinflation can be attributed
to a moderation in the historical dynamics of inflation (reflective of backward adaptive
expectation) as well as by forward-looking expectations (45 per cent and 35 per cent,
respectively). Third, global crude price and exchange seemed to have played some
(but not necessarily a large) role.
30
In the U.S., the weights of energy in All Urban Consumers (CPI-U) is 8.030 while that in the Consumer Price Index for Urban Wage
Earners and Clerical Workers (CPI-W) is 9.792; see US Bureau of Labor Statistics (BLS) BLS Handbook and Methods, Chapter 17 on
“The Consumer Price Index” (Updated 2-14-2018), available at https://www.bls.gov/opub/hom/pdf/homch17.pdf
27INDIAN MONETARY POLICY
Table 5 : Description of Various Price Indices in India
Consumer Price CPI- CPI - CPI- Rural Wholesale
Index (CPI) Industrial Agricultural Labourers Price Index
- Combined Workers Labourers (WPI)
1 Base year 2012 2001 1986-87 1986-87 2011-12**
All India Households Households Households All
2 Universe
Rural & of Industrial of Agricultural of Rural transactions
Urban workers labourers labourers at first point
Households of bulk sale
1181 village Selected Shops and Shops and 8331
3 Centres/price (268351 quotations) markets in markets catering markets quotations
and 1114 urban 78 selected to 20 States (600 catering to
quotations (281001 quotations)
markets covering all centres villages) 20 States
districts (600 villages)
4 Items covered 299 393 182 182 697
5 Weights of
major groups
Food,
Beverages & 48.24 48.47 72.94 70.47 22.62
(Primary articles)
Tobacco
Fuel & Light 6.84 6.42 8.35 7.9 13.15
Housing 10.07 15.29 – –
Clothing &
6.53 6.58 6.98 9.76 64.23
Footwear
Miscellaneous 28.32 23.32 11.73 11.87
Total 100 100 100 100 100
6 Basis for 68th round Working 38th Round 38th Round Gross Value of
Weighting Consumer Class Family of Consumer of Consumer Output (GVO) at
Diagram Expenditure Income and Expenditure Expenditure current National
Survey Expenditure Survey (1983) Survey (1983) Accounts
(2011-12) Survey for agricultural – for rural Statistics (2011-
(1999-2000) labourer labourer 12)
7 Methodology Geometric mean Weighted Weighted Weighted Weighted
for elementary arithmetic arithmetic mean arithmetic arithmetic
item index and mean according according to mean mean according
Laspeyres Index to Laspeyres Laspeyres Index according to to Laspeyres
Formula for higher Index Formula Formula Laspeyres Index Formula
level index Index Formula
8 Producer Central Labour Labour Labour Ministry of
Statistics Bureau, Bureau, Bureau, Commerce
Office, Government Government Government & Industry,
Government of of India of India of India Government of
India India
**In the new series of WPI, prices used for compilation do not include indirect taxes in
order to remove impact of fiscal policy.
@In WPI, Food has a weight of 24.38 per cent.
Source: Das and George (2017) and Central Statistics Office.
28INDIAN MONETARY POLICY
Chart 9 reports the inflation rates of all these six sub-groups of all-India CPI.
Food and beverages clearly exhibited a downward trend November 2013-November
2014, and thereafter during June 2016-May 2017. Fuel inflation was on a downward
trajectory during November 2015-July 2016, in tune with the fall in global price of
petroleum. Thus the largely exogenous fall in food and fuel prices have dominated
the observed fall in headline inflation.
CHART 9: Inflation of Major Components in CPI Basket (2012=100) (Year-on-Year, %)
Source: Database on Indian economy, RBI website.
There are a number of inter-related critiques on RBI’s strategy and
implementation of IT.
First, some analysts have expressed doubts about the accuracy of RBI’s
inflation forecasts and expectations (Sharma and Bichhal, 2017 and Goyal, 2017)
arguing that this affects RBI’s credibility and hence, the effectiveness of IT.
Second, there have been concerns expressed, particularly by the government,
that the RBI’s IT strategy has been less mindful of the growth and investments
imperatives of a growing economy like India. Chief Economic Adviser Arvind
Subramanian (2015) showed that real policy rates (i.e., repo rate less inflation rate)
have diverged significantly for consumers and producers, being unusually high for the
latter which could have constrained growth.31
31
More recently in June 2017, Subramanian is reported to have said that the headline inflation has been running well below the target
while growth in the real economy has decelerated from last July and that the outlook for growth is unlikely to warrant any serious
concern about closing output gaps; see https://www.thehindubusinessline.com/economy/ceas-comments-hint-at-brewing-finminr-
bi-tussle/article9722144.ece. However, with recent surge in inflation much of this argument loses its punch and in end January 2016,
Subramanian is reported to have said that the scope for monetary easing is now limited; see http://www.livemint.com/Opinion/qxn-
GUxRWMujaTq86ceqUBI/Economic-Survey-Is-the-monetary-policy-debate-over.html
29You can also read