Thinking big Doing better - Adani Enterprises Limited Investor Presentation - BankTrack
←
→
Page content transcription
If your browser does not render page correctly, please read the page content below

Adani Enterprises Limited
                   Investor Presentation

Thinking big
Doing better                     July 2018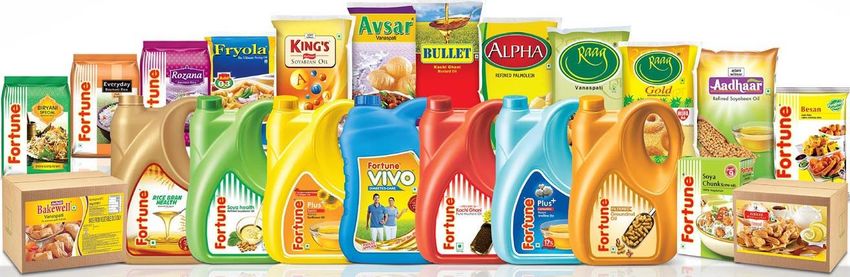
Legal Disclaimer

Certain statements made in this presentation may not be based on              AEL assumes no responsibility to publicly amend, modify or revise any
historical information or facts and may be “forward-looking                   forward looking statements, on the basis of any subsequent
statements,” including those relating to general business plans and           development, information or events, or otherwise. Unless otherwise
strategy of Adani Enterprises Limited (“AEL”), its future outlook and         stated in this document, the information contained herein is based on
growth prospects, and future developments in its businesses and               management information and estimates. The information contained
competitive and regulatory environment, and statements which                  herein is subject to change without notice and past performance is
contain words or phrases such as ‘will’, ‘expected to’, etc., or similar      not indicative of future results. AEL may alter, modify or otherwise
expressions or variations of such expressions. Actual results may differ      change in any manner the content of this presentation, without
materially from these forward-looking statements due to a number of           obligation to notify any person of such revision or changes.
factors, including future changes or developments in its business, its        No person is authorized to give any information or to make
competitive environment, its ability to implement its strategies and          any representation not contained in and not consistent with this
initiatives and respond to technological changes and political,               presentation and, if given or made, such information
economic, regulatory and social conditions in India. This presentation        or representation must not be relied upon as having been authorized
does not constitute a prospectus, offering circular or offering               by or on behalf of AEL. This presentation is strictly confidential.
memorandum or an offer, or a solicitation of any offer, to purchase or        This presentation does not constitute an offer or invitation
sell, any shares and should not be considered as a recommendation             to purchase or subscribe for any securities in any jurisdiction,
that any investor should subscribe for or purchase any of AEL’s shares.       including the United States. No part of its should form the basis of or
Neither this presentation nor any other documentation or information          be relied upon in connection with any investment decision or any
(or any part thereof) delivered or supplied under or in relation to the       contract or commitment to purchase or subscribe for any securities.
shares shall be deemed to constitute an offer of or an invitation by or       None of our securities may be offered or sold in the United States,
on behalf of AEL.                                                             without registration under the U.S. Securities Act of 1933, as
AEL, as such, makes no representation or warranty, express or implied,        amended, or pursuant to an exemption from registration therefrom.
as to, and does not accept any responsibility or liability with respect to,   This presentation is confidential and may not be copied or
the fairness, accuracy, completeness or correctness of any information        disseminated, in whole or in part, and in any manner. This presentation
or opinions contained herein. The information contained in this               contains translations of certain Rupees amounts into U.S. dollar
presentation, unless otherwise specified is only current as of the date       amounts at specified rates solely for the convenience of the reader.
of this presentation.

                                                                                                                                                    2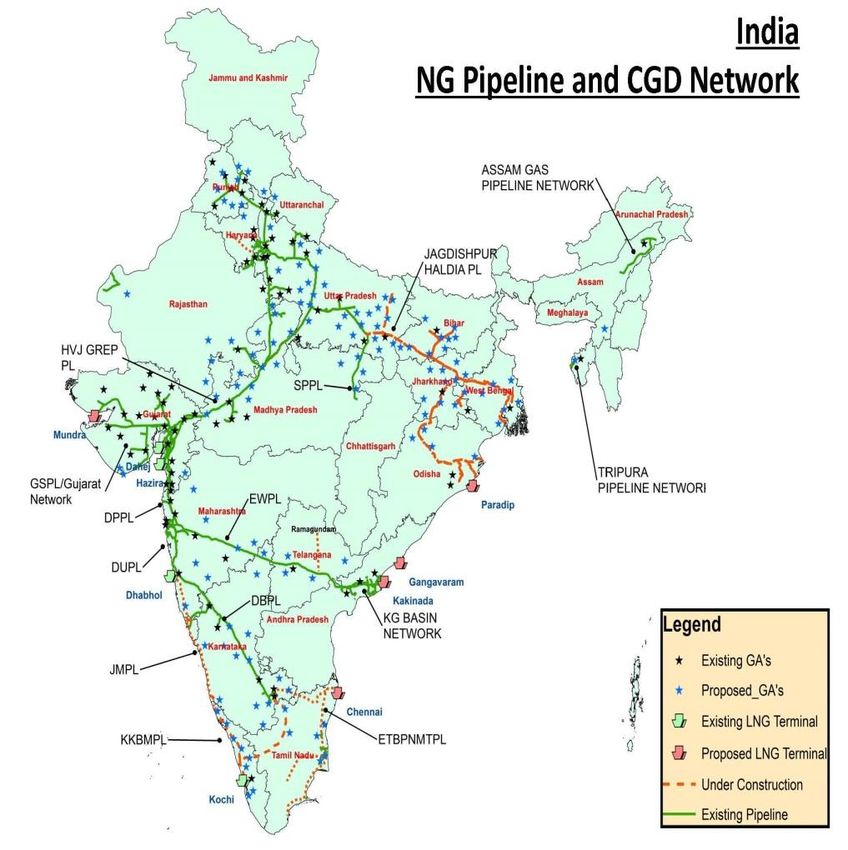
Contents

      Adani Group

      Company Profile

      AEL: Coal Mining & ICM

      Adani Gas Ltd

      Adani Wilmar Ltd

      Mundra Solar PV Ltd

      Others

      Carmichael Mine, Australia

                                   3
Nation Building - Responding strategically to some of India’s profound challenges

     One of the global growth                   Rising middle class              Estimated to be the
     engines of the 21st century,                places increasing                world’s 5th largest               Availability of cost
     ranking high on many macro-                     demand on                   consumer market by                effective engineering
     economic indicators                           infrastructure                        2025                            resources

       Rising Energy Needs                 Growing Infra Requirements          Increasing Power Demand                   Food Safety

 •   Indian economy to remain          •    90% of the volume and 72%      •   ~70% of electricity is          •   India has among the highest
     heavily reliant on Coal                of total value of country’s        generated from thermal              food losses in the world
                                            international trade is             power which will continue
 •   The key driver of coal                 through maritime transport         over the next two decades       •   Stagnant oil seed
     demand is the power sector                                                                                    production and rising edible
                                       •    Shipping Ministry estimates    •   In 2015, as per IEA, World          oil demand is increasing
                                            Indian Ports will need to          Energy Outlook, over 240            import dependency
                                            have capacity to handle 2.5        million Indian citizen had no
                                            bn MT cargo by 2025                access to electricity

 •   Resources: Obtaining coal         •    Logistics: A large network     •   Energy: Conventional and        •   Agri: Agri products &
     from mines and trading; in             of ports, Special Economic         Renewable Power                     infrastructure
     future it will also include oil        Zone and multi-modal               generation, transmission,
     and gas.                               logistics – rail and ships         Solar PV manufacturing and
 •   Adani’s coal operations will                                              gas distribution
     account for ~20% of India’s       •    Adani Ports will handle ~20%   •   Adani’s power generation will   •   Adani will cater to 25% of
     projected coal requirements            of the total cargo at Indian       represent ~5% of India’s            India’s edible oil demand by
     by 2021                                Ports by 2021                      projected capacity by 2021          2021

                                                                                                                                             4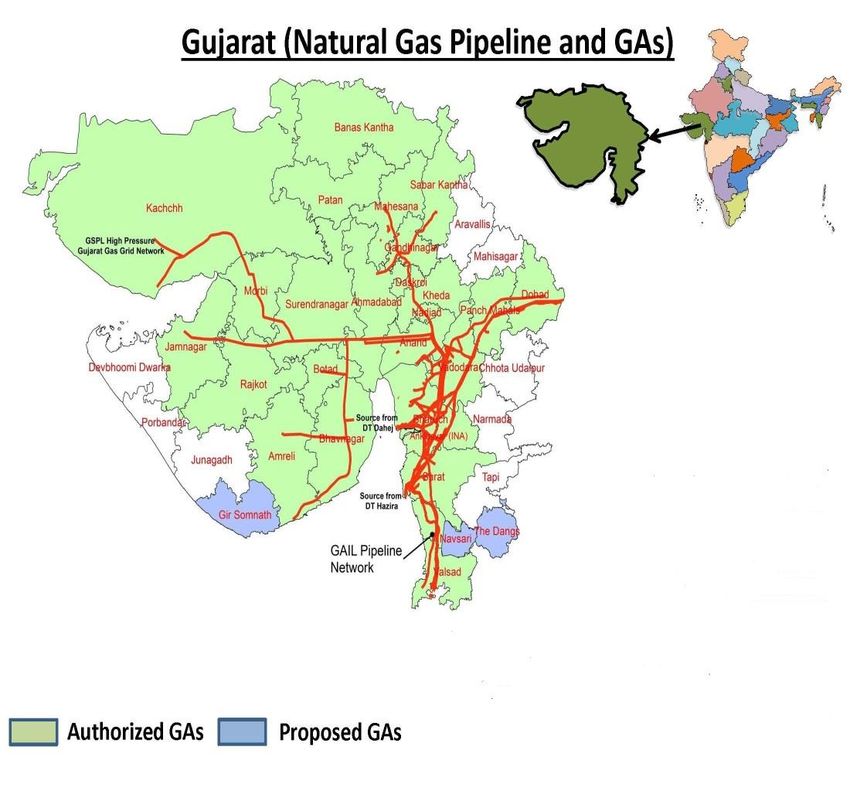
The Making of India’s Leading Infrastructure Group
1988 1995 2002 2009 2018
Coal Trading
Started a Commenced Among the largest
(1999) Coal traders in the
Commodity world
Trading ICM
Gautam Adani
Business Awarded India’s
Chairman 1st MDO
(2006)
Acquired Carmichael
Adani Acquired Bunyu coal mine Australia
Coal Mine (2010)
Enterprises listed
Indonesia (2008)
(1994) Mining operations
in India, Indonesia Coal Mining
& Australia
Mundra Port
(MDO)
Commenced
1995 (1995)
50: 50 JV with
Wilmar International Commissioned
(2000) Solar PV plant at Mundra
(2017)
Grain Silo Depot
2002 commissioned at 7
Solar Mfg
locations (2007)
Adani Power
1st CNG Station
Adani listed (2009)
Ahmedabad Awarded Grain Storage
Ports
(2004) business from MP state
listed
(2007)
“Fortune”
Largest Food
2009 Commissioned first 1st transmission FMCG brand in
line India
unit (2009)
commissioned
(2009) Worlds Largest JV with
Single location Indian Oil Agro
Acquired Solar Power Plant Corporation
Presence
Dhamra Port Listed (2015) (648 MW) (2016) (2014)
Acquired 1,200 MW in 13 cities
(2014)
Udupi Thermal Power
plant (2015)
Acquired GMR and
Reliance Transmission Project pipeline To be
Lines (2016) > 2GW listed
(2018)
2018 Operates 10
Bangladesh PPA
ports/terminals
Signed (2017) To be
BSES acquisition (2017)
listed
(2018)
Adani Gas
Adani Ports Adani Power Adani Transmission Adani Green Energy
Adani Green Energy = will be demerged from AEL w.e.f from 1st April 2018 FMCG = Fast-moving consumer goods
All business in green colour in Adani Enterprises Limited 5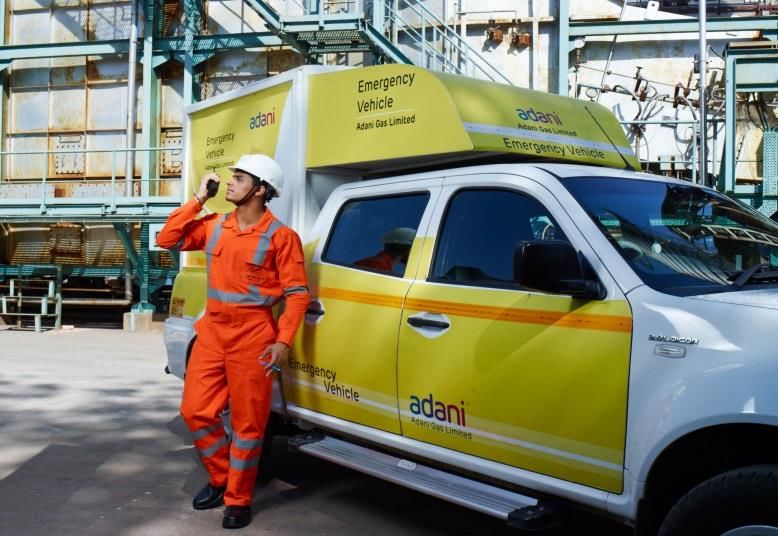
Adani Group – At a Glance
                                 Largest private sector ports, thermal power, transmission, renewables and coal trading player in India

 180 MMT ~15% of India’s EXIM trade                                                                               10,440 MW      ~5% of India’s Thermal Generation Capacity
 2,500 MW ~4% of India’s Renewable Generation Capacity                                                            11,890 Ckt Km ~3% of India’s Transmission Network

     Promoter                           Promoter                            Promoter                          Promoter                      Promoter                     Promoter
       Group                             Group                               Group                              Group                        Group                        Group
           74.9%                             63.6%                                73.1%                              74.9%                       86.9%                        74.9%
  Adani Enterprises              Adani Ports and SEZ                      Adani Power                     Adani Transmission          Adani Green Energy                Adani Gas

–Integrated coal                 –India’s largest                   –India's largest private             –India’s largest             –Renewables                  –Leading Private
 management                       commercial ports                   thermal power                        private transmission         Capacity: 1.9 GW             Sector CGD
 operations                       operator and                       generation Co with                   Co                           operational, 1.2 GW          Company in India
–Over 50% market                  integrated logistics               installed capacity of               –Installed Capacity           under pipeline              –Focussed Pure Play
 share in coal (66                Company                            10,440MW                             5,000ckt KMs;               –Solar: 90%, Wind:            Gas Marketing and
 MTPA)                           –Market share of ~15%              –A national record:                   doubling by 2019             10%(3)                       Distribution
–Leading Coal MDO                 in India’s cargo                   Mundra thermal plant                –SPA signed in Dec           –Geographically               company
 player in India                 –10 Ports across West               running continuously                 2017 to acquire BSES         diversified portfolio       –Operational in 4
                                  and East Coast                     for 600 days                         Electricity                                               cities
–Agro commodities and                                                                                                                 –Tamil Nadu 648 MW
 storage, ‘Fortune’ -            –Multi-modal logistics             –Signed PPA with Govt                 distribution (c. 3 mn        :      World’s largest      –IOAGPL – 50:50 JV
 India's leading cooking                                             of B’desh in 2017 for                consumers)                   single location solar        with Indian Oil
                                 –Mundra SEZ (8481                   1.6 GW ultra super-
 oil brand                        ha)                                                                    –Rated Investment             plant                        Corporation with
                                                                     critical thermal power               Grade by Moody’s,                                         operations in 9 cities
–India’s largest solar           –Rated Investment                   project (COD 2022)                                               –Quality
 panel and cell                                                                                           S&P, Fitch                   Counterparties:
                                  Grade by Moody’s,
 manufacturer (1.2 GW             S&P, Fitch                                                                                              SECI – 28%,
 p.a.)
                                                                                                                                          NTPC - 17%

 Revenues      EBITDA           Revenues          EBITDA             Revenues         EBITDA            Revenues         EBITDA      Revenues       EBITDA        Revenues       EBITDA
₹ 37,984 Cr   ₹ 3,002 Cr       ₹ 12,334 Cr       ₹ 8,073 Cr          ₹ 21,093 Cr     ₹ 6,174 Cr         ₹ 3,239 Cr      ₹ 2,937 Cr   ₹ 1,078 Cr     ₹ 857 Cr      ₹ 1309 Cr      ₹374 Cr
Total Debt Total Assets         Total Debt     Total Assets          Total Debt    Total Assets         Total Debt Total Assets      Total Debt   Total Assets    Total Debt Total Assets
₹ 17,915 Cr ₹ 43,615 Cr         ₹ 21,433 Cr     ₹ 47,375 Cr          ₹ 52,835 Cr   ₹ 69,523 Cr          ₹ 10,009 Cr ₹ 17,265 Cr      ₹ 9,280 Cr   ₹ 13,280 Cr      ₹348 Cr       ₹1,311 Cr
Market Cap: ₹ 14,776 Cr         Market Cap: ₹ 76,731 Cr               Market Cap: ₹ 7,039 Cr            Market Cap: ₹ 16,634 Cr       Market Cap: 4,337 Cr              Listing Oct 2018

                                                                              Operational
      Massive                       Unmatched
                                                                               excellence                               Track record of                    Experienced management
       scale                        execution
                                                                                Focus on                                  integrating                       Expertise in regulatory
     Largest in                  Greenfield assets
                                                                              productivity,                              acquisitions                        environment in India
       class                      in record time
                                                                              lowest cost

                     Note 1: All the financials are from respective companies’ Annual Financial Statements dated 31 March 2018
                          2: Market cap is as of 18th June 2018                   3: Mix as of March 31, 2018                                                                      6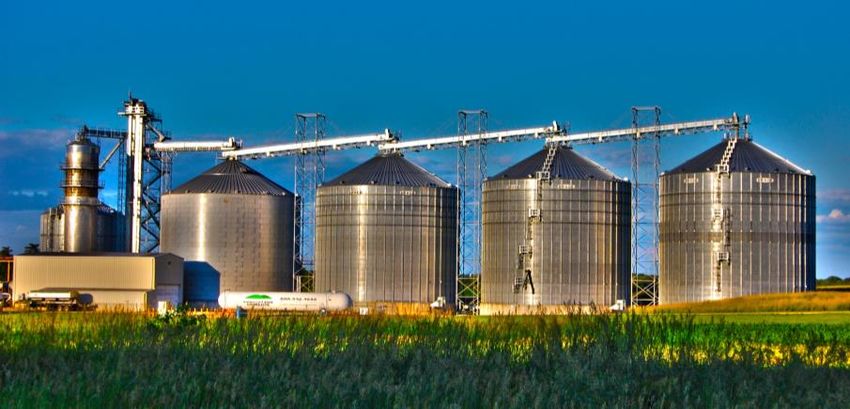
Adani Group : Financial Snapshot* and Stock Price Movement
Revenue Total Net Worth
EBITDA Total Assets
15% CAGR
16,953 39,904 73,640 75,729 5,546 18,218 21,043 1,75,597 1,91,058 1,151 19,490 38,310 45,106
474 1,06,997
5,534
4% 4% 4% 4%
11% 11% 7% 6% 8% 3%
27% 14% 8% 13%
8% 8%
32% 28% 31% 2%
35% 51% 48%
41%
69% 29% 34% 65%
13% 16% 46% 47%
38% 25%
96%
81% 24% 25% 23%
37% 39%
52% 50% 49% 44% 39%
31% 34% 28% 35% 35%
28% 27%
17% 14%
FY 2007 FY 2012 FY 2017 FY 2018 FY 2007 FY 2012 FY 2017 FY 2018 FY 2007 FY 2012 FY 2017 FY 2018 FY 2007 FY 2012 FY 2017 FY 2018
AEL APSEZ APL ATL AGEL AEL APSEZ APL ATL AGEL AEL APSEZ APL ATL AGEL AEL APSEZ APL ATL AGEL
Stock Price Movement (%)
Adani Enterprises Adani Ports and SEZ Adani Power Adani Transmission
34%
133%
394%
16%
16%
16%
Oct-2016 Mar-2018 Oct-2016 Mar-2018 Oct-2016 Mar-2018 Oct-2016 Mar-2018
Adani Enterprises NIFTY 50 Adani Ports & SEZ NIFTY 50 Adani Power NIFTY 50 S&P BSE POWER Adani Transmission NIFTY 50
•
•
Includes listed Group Companies
Stock Price Movements are until 31-03-2018
7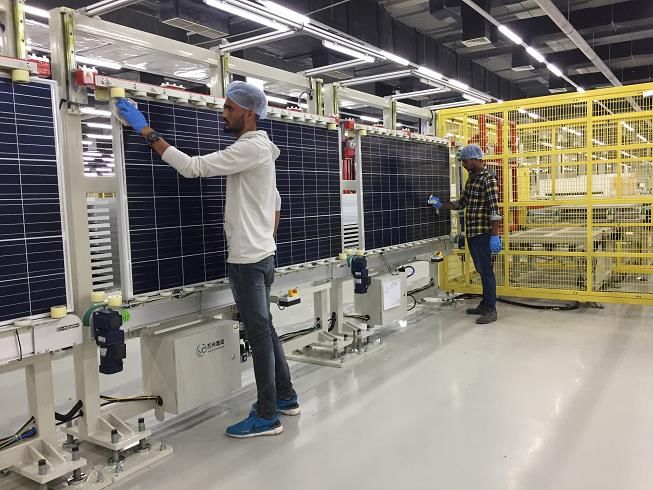
Adani Enterprises: a Diversified Incubator

                                             8
Thinking Big, Doing Better

            Unique Incubator with a distinctive capability in nurturing businesses of national
            importance creating value for all stakeholders

            Massive Scale - Largest & best in class

            Unmatched Execution - Greenfield assets in record time

            Experienced Management Team - Expertise in regulatory environment in India

            Operational Excellence - Focus on productivity, lowest cost

            Delivered stupendous CAGR of 32% for 24 years (since listing)

                                                                                                 9
Adani Enterprises : Evolution

                                                             2018
                                                             • Demerger of Adani Green Energy & Adani Gas

                                                  2010
                                                  • QIP of $ 850 mn
                                                  • Acquired Carmichael Coal Mine
                                                  • Won First Coal MDO contract

                                      2007
                                      • APSEZ IPO subscribed 116x
                                      • FCCB Issue of $ 250 mn

                                                                                                      2017
                                                                                                      • Solar Mfg plant
                        2001                                                                            commissioned
                        • Adani Gas Started

                                                                                          2015
   1996                                                                                   • Demerger of APSEZ, APL & ATL
   • Bonus Issue of 1 : 1
                                                                                2009
                                                                                • APL IPO subscribed 21x
                                                                                • Bonus Issue of 1 : 1

                                                          2006
   Nov-1994 listed on                                     • Stock Split : Ratio 10 : 1
   BSE & NSE @ Rs
   150/share
   Subscribed 25x             1999
                              • Signed JV with Wilmar, Singapore
                              • Bonus Issue of 1 : 1

                                                                                                                           10
AEL: Corporate Structure
Promoters
75%
Adani Enterprises Limited
(AEL)
Coal MDO ICM **
(Division) (Division)
100% 100% 51% 50% 100%
AGL AWL
Adani Global MSPVL
(City Gas (Edible Oil & Others
Mauritius (Solar Mfg)
Distribution) Food)*
100% AALL/AAFL
100% 100%
(Agro Storage)
AGPTE AGFZE
Singapore Dubai 100% Defence
100%
Road, Metro &
100% 100% 100% 100%
Railways
AMPTY PTAG ASPL ABPL
Carmichael Bunyu Coal
Shipping Bunkering 100% Cement
Coal Mine Mine
(Singapore) (India)
(Australia) (Indonesia)
100%
Water
Consolidated Financials FY18 (₹ in Crs)
Parameter Total Coal MDO ICM AGL MSPVL AALL+AAFL Others AWL*
Revenue 37,984 863 29,454 1,309 554 314 5,406 26,435
Op. EBIDTA 3,002 466 1,261 374 328 100 473 1,010
* AWL financials shown are on 100% basis
** ICM – Integrated Coal Management 11Adani Enterprises : Exemplary Value Creation
EBIDTA Mix
AEL delivered CAGR of 32% since listing
1000000 FY2012 Others,
Vs 8%
Nifty CAGR of 9.3% & Sensex CAGR of 9.3% ICM, APSEZ,
28% 38%
100000 APL, 26%
FY2015
10000 Others,
ICM, 12% 6%
APSEZ,
31%
APL, 51%
1000
FY2018
100
ICM
9%
Coal MDO 13%
Solar Mfg 25%
Solar Gen
37%
10 CGD 11%
1995
1997
1998
1994
1996
1999
2002
2001
2007
2003
2005
2008
2014
2000
2004
2006
2009
2016
2010
2011
2012
2013
2015
2017
Others
5%
AEL Nifty Sensex
Note: Chart value in log scale rebased to 100
12Adani Enterprises : Experienced Management Team
Mr Gautam Adani, Chairman & Founder - Adani Group Mr Rajesh Adani, MD – Adani Enterprises Ltd
Mr Adani has more than 33 years of business He has been associated with Adani Group since its
experience. His journey has been marked by his inception. He is in charge of the operations of the
ambitious and entrepreneurial vision, coupled with Group and has been responsible for developing its
great vigour and hard work. This has not only enabled business relationships. His proactive, personalized
the Group to achieve numerous milestones but also approach to the business and competitive spirit has
resulted in creation of a robust business model which is helped towards the growth of the Group and its various
contributing towards building India. businesses.
Mr Pranav Adani, Director
Mr Vinay Prakash, CEO - Mining & ICM
He has been active in the group since 1999. He has
A mechanical engineer with MBA (finance), Mr. Vinay
spearheaded the Joint Venture with the Wilmar Group
Prakash has a rich and diversified experience of over 24
of Singapore and transformed it from a single refinery
years, spanning across the complete coal value chain,
edible oil business into a pan India Food Company. He
from Mining, Trading, Shipping & Logistics to Port &
also leads the Oil & Gas, City Gas Distribution & Agri
Power. He has been instrumental in nurturing our
Infrastructure businesses of the Group. His astute
trading & mining business & achieving multi-fold growth
understanding of the economic environment has helped
subsequently.
the group in scaling up the businesses multi fold.
Mr Rajeev Sharma, CEO – Adani Gas Ltd Mr T K Kannan, CEO – Adani Wilmar Ltd
Mr Sharma has over 38 years of focused experience in Mr Kannan has been active in the group since 1999. He
Oil & Gas industry especially natural gas pipelines and has about 40 years of experience in the Edible Oil
city gas distribution networks. He has been with Adani Sector. Out of which the last 20 years he has been with
since 2003 & responsible for Group’s initiatives in city Adani Wilmar Ltd working in Singapore & India. With his
gas distribution. He was associated with GAIL for 19 rich experience he has been handling the Edible Oil
years in various capacities. Mr Sharma was the business and Co-ordinating, Trading, Marketing &
founding MD of Indraprastha Gas Ltd and has Manufacturing since inception. Prior to joining Adani
implemented the prestigious CNG Program in Delhi. Wilmar, he worked 20 years for Godrej Soaps Ltd.
Mr Ramesh Nair, CEO – MSPVL (Solar Manufacturing) Mr Rajiv Nayar, CFO
Mr Nair has over 27 years of experience in the Mr Nayar joined the Adani Group in April 2016 after a
manufacturing industry. He has worked in Essar Steel 30 years career at Citigroup. At Citi, he had a broad
Limited, Sterlite Industries Limited as COO Sterlite based experience in both developed and emerging
Copper and Director - MALCO and Jindal Stainless markets in India, London and Hong Kong across various
Limited as President & Executive Director. Before disciplines including Corporate Banking, Project
joining Adani Solar, he was the CEO and whole time Finance, Leveraged and Acquisition Finance, Capital
Director of Bharat Aluminium Company Limited (BALCO) Markets as well as Risk and Portfolio Management.
for the last 4 years.
13Adani Enterprises : Consolidated Historical Financials
AEL FY 16 FY 17 FY 18 Value creation
35,131 38,056 37,984 • Demerger of AGEL, renewables vertical
Revenue
• Listed in June 2018
EBITDA 2,789 3,090 3,002
• Demerger of AGL, city gas distribution vertical
PAT 1,009 988 870 • Listing in 2H FY 19
Basic and Diluted EPS (in ₹) 9.19 8.98 6.89
Net Fixed Assets (NFA) 18,135 21,399 16,081
Expansion of existing businesses
Total Assets 41,756 47,689 43,615
• Enhancing nationwide footprint in Agro and
Total Long Term (LT) Debt 8,163 10,166 5,072
Coal MDO through organic route
Total Debt 19,169 20,846 16,990
• Acquisition of Ruchi Soya, one of the largest
Total Net Worth (TNW) 13,463 14,698 15,588 edible oil producers in India, by Adani Wilmar,
EBITDA / Interest 2.1x 2.5x 2.3x
Total LT Debt / EBIDTA 2.9x 3.3x 1.7x Highly successful incubator
Total LT Debt / TNW 0.6x 0.7x 0.3x • Unparalleled track record of transforming
Total Debt / EBITDA 6.9x 6.7x 5.7x businesses from challenging gestation to
1.4x 1.4x 1.1x robust independence
Total Debt / TNW
• Venture into new businesses such as
Note 1: Excludes Adani Wilmar (50% JV) now consolidated as per equity method per IndAS. defence, roads, cement and water
Note 2: FY18 figures exclude AGEL
Note: 1. Per Indian Accounting Standard (IndAS) 2. Note: EBITDA = PBT + Depreciation + Net Finance Costs 3. Debt figures exclude Intra-Group Borrowings
14AEL: India Coal – Coal MDO & ICM
1
5Global Coal: Demand to remain stable, with India contributing significantly towards
imports & Australia towards exports
India net imports, Australia net exports to be the highest
-38
-67
+40
~+95 +69
+21
-67
-3
+130
India thermal coal imports by country
Seaborne Thermal
Coal Market 2017 2035
1062
/ Net exports/ imports in 2035 over 2017 levels
29%
945 44% 42%
51%
5% 29%
2017 2035
Coal Volumes (Mt) Indonesia Australia Others
Source: Wood Mackenzie
16Global Coal Scenario – Stable Outlook
Global coal demand flat lines, with falls in China and OECD offset by increases in India and other Asia
2,500 Million toe Coal Consumption by Region 5.0% Coal Consumption Growth and Regional Contributors
4.0%
2,000 China India OECD Other Asia Other
3.0%
1,500 2.0%
1.0%
1,000
0.0%
500
-1.0%
- -2.0%
2000 2010 2015 2020 2030 2040 2000-2010 2010-2020 2020-2030 2030-2040
China India OECD Other Emerging Asia RoW
Source: BP Statistical Review Source: BP Statistical Review
Decline in exports from Indonesia to be offset by exports from Australia With thermal coal prices projected to remain stable
1,600 Thermal coal price nominal estimate(US$/t)
120
500 96
1,200 100
87 86
457 80 82
76 78
429 80
Rest of World
800
416 Indonesia
60
397
Australia
316
40
400
550 20
399 450
0 0
2015 2025 2040 2017 2018E 2019E 2020E 2021E 2022E 2023E
Source: International Energy Outlook, 2017 Source: Bloomberg, JP Morgan Estimates
17Evolution of Indian Coal Mining & Opportunities
Amendment to Coal Mines Nationalization Act •Allowed private sector participation in coal mining for captive usage
(1973), 1991 •Case to case basis allotment of 218 coal blocks
Auction by Competitive Bidding of Coal Mines •Additional regionally-explored (RE) coal blocks allocated to various PSUs - 14 for Power
Rules, 2012 end use & 3 for commercial mining
•Various complaints were received by the Govt.
CAG Report, 2012 & SC Judgement in 2014
•Arbitrary and non transparent allotment led to cancellation of 204 coal blocks out of 218
•Re-Allocation of the coal blocks; 2- pronged strategy
Coal Mines Special Provisions Act, 2015
•Auction for Private & Allocation for PSUs - either for captive or commercial use
•MoC has opened commercial mining for private sector under Act’ 2015
Way Forward
•Methodology for auction published on Feb 27, 2018 and tender process expected soon
Captive mines portfolio including CIL’s mines for potential MDO business shown below
Category No. of Coal Blocks Category No. of Blocks
Allocation/Auction under Coal Mines Act 204 Allocation & Auction 86
Category No. of Coal ~52 Bn Ton
2015
To Allocate/ Auction Blocks
118
Allocation under CMN Act 1973 14 Pakri Barwadih, Tasra 2
Category No. of Coal ~7 Bn Ton
UMPP Linked Block Blocks12
Sub Total (Coal Blocks) 218
PSUs – Power; allocated 10
Allocation under Mining Rules 2012 ~9 Bn Ton
17
PSUs- Power; cancelled 4
Category No. of Coal
CIL Coal Block for MDO 3 Commercial Mining Blocks 3
~2 Bn Ton
Grand Total 238 Kaniha , Siarmal, Pelma 2
70 Billion Ton
18Demand Drivers for Thermal Coal in India
Share of Thermal Power to go down to 51% in next 5 years, although expected to increase in absolute terms
2016-17 2022-23
Coal
8% Large Hydro
2% 2%6%
4%
Small Hydro 13%
10% & Bio Mass
Wind Power
4% 326 GW 472 GW 51%
Solar Power 13%
59%
13% Nuclear 4%
Gas & Diesel 12%
Coal based thermal power capacity @ 240 GW by FY 2023
240000
220000
200000
Additions Capacity
MW
180000
160000
140000
120000
FY 17 FY 23
Coal based power capacity expected to increase from 204 GW in FY 2018 to 240 GW in FY 2023
Power generation expected to increase at rate of 6 to 7 % for next 5 years
Source: Ministry of Power, Adani Estimates 19Domestic Coal Production
CIL Total Coal Production (Mn Ton) SCCL Total Coal Production (Mn Ton)
800 762 90 84
CAGR: 721 CAGR: 79
750
726 80 75 80
700
Base—4.6%, 683 Base—4.5%, 71 76
694 68 73
Pessimistic-3.6%, 646
664 70 Pessimistic---3.5%, 64 70 76
650 612 634 692 67 74
Optimistic---5.6%, 668 Optimistic---5.5%, 64 71
579 606 69
600 645 60 60 61 66
622 64
579
550 554 579 600 52 53
50
53
538 50
500 493
40
450 452 462
436
400 30
CIL- Base CIL- Pessimistic CIL- Optimistic SCCL - Base SCCL - Pessimistic SCCL - Optimistic
210 Captive & Others Coal Production (Mn Ton) MoC has auctioned/allocated 94 captive coal blocks
191
180 under CMN* Act 1973, CMSP Act 2015, CBR 2012
172
147
150
152 Production started in 13 auctioned/allocated coal blocks
111 132
120
80 100 117 Production forecasted to reach 172 MT by FY23 based on
90
63 59
52 51 53 72 89 possible opening of new mines and ramp up
60 40 44 46
53 64
46
30 46 47
FY-12 FY-13 FY-14 FY-15 FY-16 FY-17 FY-18 FY-19FY-20 FY-21 FY-22 FY-23
Optimistic Base @90% Pessimistic@80%
FY-15 FY-16 FY-17 FY-18 FY-19 FY-20 FY-21 FY-22 FY-23
Peak MTPA 115 53 68 73 106 143 206 256 308
• CMN Act : Coal Mines Nationalization Act, 1973
Source: Ministry of Coal, Market reports, Adani Analysis • CMSP : Coal Mines Special Provisions Act, 2015 20
• CBR 2012 : Competitive Bidding of Coal Mine Rules, 2012Demand Supply of Thermal Coal
MMT Supply Total Demand
1200 1117
1050
988
1000 930
852 886
828 843
783
800 733
647 686
597 625
600
400
200
0
FY-17 FY-18 FY-19 FY-20 FY-21 FY-22 FY-23
Imports over the next 5 years likely to be range bound between 140 to 160 MMT
(MMT) 2016-17 2017-18 2018-19 2019-20 2020-21 2021-22 2022-23 CAGR (18 to 23)
Total Demand 828 852 886 930 988 1050 1117 5.6%
% Increase 3.05% 2.94% 3.99% 4.97% 6.24% 6.28% 6.38%
Total Supply
597 625 647 686 733 783 843 6.2%
(Pessimistic)
% Increase 3.3% 4.6% 3.5% 6.02% 6.8% 7.09% 7.5%
Total Supply (Base) 597 625 659 706 763 825 897 7.5%
% Increase 3.3% 4.7% 6.4% 7.4% 8.54% 8.25% 8.9%
Imports may go beyond the range based on how CIL & captive performs, removal of infrastructure bottlenecks
including railways !!
21Adani India Mining: Introduction
Largest Mine Developer & Operator in India
• Exploration
Parsa East and Kanta Basan,
Peak Capacity 15 MMTPA • Preparation of GR, Mine Plan
• Land Acquisition, R&R
Kente Extension
Peak Capacity – 7 MMTPA • Obtaining Clearance
• Establishment of washery & reject based TPP
Parsa,
Peak Capacity – 5 MMTPA (if applicable)
• Planning, Developing & Operations
Jitpur, • Operation of mine
Peak Capacity – 2.5 MMTPA
• Logistics solution
Talabira II & III
Peak Capacity – 20 MMTPA
Gere Pelma-III
Peak Capacity – 5 MMTPA
• Average Potential mine life: 30 years
• Estimated direct employment to 3200 persons
Operational Under Development
Map Source: http://clipground.com/clipart-maps-of-india.html MMTPA: Million Metric Tons/ Annum 22MDO Business Model & Project Pipeline
Mine Owner Packages wherever applicable basis
Payments to MDO Coal Delivery by MDO
Facilitating in obtaining clearances, DPR / mine plan, Land
Mine Developer acquisition and R&R
and Operator
(MDO) Construction of Infra such as CHP, Washery, rail siding etc.
Bundled
Coal & OB Removal Package
Coal Loading & Transport
MDO to do all Investments as per
Scope of Work of which some O&M of Washery & Disposal of rejects
part are reimbursable
O&M of railway siding
Major risks are transferred to one contractor- Ease in Contract Management
Parsa East & Kente Gare Pelma Talabira II
Parsa Gare Pelma -II Jitpur Total
Kante Basan Extension -III & III
Owner RRVUNL RRVUNL RRVUNL CSPGCL Mahagenco NLC APL 7 Contract
Geological
516 256 200 210 736 589 81 2588
Reserves (MnT)
Mineable
451 184 160 (Est) 134 553 554 66 2102
Reserves (MnT)
Capacity
15 5 7 (Est) 5 23.6 20 4 80
(MTPA)
Status of Producing Start in Start in Start in Start in Start in
Start in 2019
Production since 2013 2021 2018 2021 2019 2020
Adani Role MDO MDO MDO MDO MDO MDO Captive
CMDPA
Contract Status Signed Signed Signed Signed LoA awaited LOA issued
signed
23Why we entered into MDO? - a natural progression from Coal Trading
Successfully developed Power
projects and Ports in India –
Gained experience in LA,
Community engagement, infra
development- critical for Coal
mining as well
Mining in Indonesia since 2007- Our presence in Coal Trading
Built credence to venture in business with PSUs, SEBs –
Indian mining industry after a Built strong relationship with
taste of success in foreign soil PSUs
Adani entered in
Indian Mining
MDO Business in
2008 - with
RVUNL
24PEKB Project - World class infrastructure developed within a record time
Infrastructure consisting Pit top railway siding, silo
Mining Operation Started in Jan 2013
with Rapid Loading system for evacuation of coal
Coal Production commenced in Feb 2013 is under final completion
Mining operations started within record time of 5 Strong EBIDTA Margins & Profitability with stable
cash inflows and robust financial indicator
years from the date of allocation of coal block
In-house expert team of Geologists and Mining
Engineers
8.27 8.33
More than 25 MMT coal produced since the start
6.3
of mine
Peak Mining capacity as per approved plan - 15 3.44
MMTPA
Developed world class coal washery and CHP
FY 15 FY 16 FY 17 FY 18
ROM Production (MMT)
PEKB mine - a model project - it is vertically integrated through private rail corridor (SRCPL) to provide last mile
delivery of coal at TPS
PEKB – Parsa East & Kante Basin 25Competitor Landscape
Turnover (Rs.Cr) Financial Position of Competitors FY16-17 Networth (Rs.Cr)
10000 JSPL* 10000
Jaypee Power
9000 Adani 9000
Turnover Networth Essel
8000 8000
7000 Less 7000
6000 Aggressive 6000
Dilip Buildcon Competitors
5000 Most Aggressive Competitors 5000
Adani
4000 Sadhbhav 4000
Jaypee Power
3000 3000
Monte Carlo BGR Lanco Sadhbhav
2000 Sainik 2000
VPR AMR Dilip Buildcon
1000 Ambey Sical Essel 1000
Southwest Thriveni
Lanco
0 Dhansar 0
Mahalaxmi
Single Mine with Highest Mineral Production in one
Mineral (Mn Year From FY11-FY17 Mineral+OB
35 Ton) (Mn Cum) 70 80
Mineral (LHS)
30 60
25 50 MDO for Coal/Lignite/Iron Ore
20 40
15 30
10 20
5 10
0 0
Dhansar
Sainik
AMR
JSPL
VPR
Essel
Mahalaxmi
Sadhbhav
PT Darma
Southwest
Monte Carlo
Sical
Adani
Ambey
BGR
Jaypee Power
Thriveni
Indonesian
Company
* JSPL : Turnover - Rs. 15494 Cr. ; Networth – Rs. 21675 Cr. Source: Adani Analysis, Company Reports
26Robust operations driving strong financial performance
8.27 8.33
7.31 7.1
6.3
5.5
3.44
2.95
1.2 0.96
FY 14 FY 15 FY 16 FY 17 FY 18 FY 14 FY 15 FY 16 FY 17 FY 18
ROM Production (MMT) Washed Coal Dispatch (MMT)
61%
56%
54%
47%
956 579
863
466
570 23% 322
286
135
77
18
FY 14 FY 15 FY 16 FY 17 FY 18 FY 14 FY 15 FY 16 FY 17 FY 18
Revenue (in ₹ Cr) EBITDA (in ₹ Cr) Margin
27Integrated Coal Management: Our Global Footprint…
Multi-Country Multi modal Customer Account
Financing Management
Procurement Logistics
ICM
Private Adani Power Overseas
PSU
Business Ltd business Yamunagar
Suratgarh Panipat
Hissar Harduaganj
Dadri Tanda Vindyachal
Kota Unchahar Kahalgaon
Badarpur
Parichha Sagardighi
Chhabra Rihand
Dhamra Bakreshwar
Kandla Mejia Bandel
Panki Durgapur
Wanabori
Mundra Kolaghat
Gandhinagar Sipat
Bedi Haldia Tarakan
Navlakhi Korba [Talcher]
Samarinda Tanjung Bara
Dahej Tiroda
Koradi Bontang
Paradip
Hazira Chanderpur
Parli
Ramagundam Vishakhaptnam Muara Satui
TanjungIndonesia
Simhadri
Kondapalli Gangavaram Pemancingan
Kakinada
Richard Bay
Goa
South Africa
Queensland
Ennore
North Chennai Australia
Mettur Tuticorin
Ports
Locations served
Tuticorin
We are a team of 200 + People with operations spread across globe through more than 20 satellite offices & branch
offices, 4 global offices and a HO based out of Gurgaon
28AEL: Integrated Coal Management – Amongst World’s leading & India’s largest
Resilient Business Model with Dominant Market Position Sales Mix
In MMT FY 18
7%
31% 48% 56% 45%
22% SEBs
66 MMT APL
78 81
185 66 Exports
58 164
145 147
63% Private/Others
8%
FY15 FY16 FY17 FY18
AEL Coal Trading Volume India Steam Coal Import
Stable Operating Performance Realizations on an uptrend
in ₹ Crs. In $/ MT
Revenue EBIDTA
27,446 30,232 29,454 66.61
55.71
52.52
967 998 1,261
2.85
1.85 1.84
FY 16 FY 17 FY 18
Revenue / MT EBITDA / MT
FY16 FY17 FY18
29AEL: Adani Gas –
City Gas Distribution
www.adanigas.com
30Natural Gas – A Low Cost, Clean & Efficient Source of Energy
Abundance Availability Affordability
Acceptability
Gas Value Increasing Expanding Price decline,
Less polluting,
Proposition Liquefaction Imports / commoditized,
clean and green
capacity infrastructure fungible
Global Gas export capacity increasing 50% between 2016-20 Infrastructure around natural gas import is accelerating
425 398
400 374 80 73
375
350 328 60 53
325 44
299
300 40 28
265 24
275 245 248
241 16
250 20
225
200 0
13 14 15 16 17e 18e 19e 20e China LNG (MMTPA) India LNG (MMTPA) India Pipeline ('000 KM)
mtpa FY 16 FY 20E
Poor air quality in cities supporting gas adoption Gas is cheaper than oil linked fuel
$/MMBTU
Oil Linked Fuels
Gas Price
Iran 3
Nigeria 11.3 10.8
5
Pakistan 5 8.7
7.6 7.1
B'desh 6 6.3
Saudi Arabia 6 No of Cities 3.7
2.7
China 16
India 31
0 10 20 30 40
World’s 100 cities with worst Air Quality
From a fragmented and regional market, natural gas now a global commodity. Supply is driven by new discoveries and demand
by rapid infrastructure development
31India belatedly catching up on the Natural Gas
Environmental commitments, “Make in India” initiative, need for energy security makes natural gas a priority
Lower Gas Consumption per Capita (Cbm/person) India Contracted and Uncontracted LNG Demand
30,630 21,449
2,367 1,678
253 152
80
UAE Qatar United Thailand Bangladesh China India
States
Gas as % of primary energy consumption declining National Priorities
60 61 • Paris agreement requires 35% reduction in CO2 over 2005 level
51 49 49 50
46
40 42
32
36 37
• Reduce oil import 10% by 2020
28 30
26 26
9 10 10 10 • Balance energy mix- gas 6% to 15%, by 2022
8 7 7 8 8 8 8 8 8 7 7 6 6
2000 2002 2004 2006 2008 2010 2012 2014 2016
• 100% LPG/PNG penetration
Gas as % of Primary energy Prmary Energy Gas Consumption
India has lagged, but given the global glut, this might be a advantage with significant uncontracted demand.
Gas and Renewables together serves the twin purpose of climate and growth
32City Gas Distribution (CGD) infrastructure generates demand
China Gujarat
Gas consumption increased 4 times compare to India Highest CGD penetration and gas has 25% share in energy mix
LNG as transport fuel picked up due to LNG infrastructure compare to national average of 6%
Gas demand India Vs China (In BNSCMD)
India China
188
200 172
151
Gas Consumption
137
150
111
93
84
100 73
59
48
35 41
50 30
71
60 61
51 49 49
36 37 40 42
28 30 32
-
FY 02 FY 04 FY 06 FY 08 FY 10 FY 12 FY 14
China LNG as auto fuel demand rising as fueling station increasing
200 2800 3000
2667
180
Heavy Duty trucks('000)
2230 2500
160
140 1824
2000 LNG Station (Nos)
120
100 1500
175
80
777 137 1000
60 124
40 304 74 500
203
20 101
14 17 22 38
0 0
FY 09 FY 10 FY 11 FY 12 FY 13 FY 14 FY 15 FY 16
Heavy duty Trucks ('000) LNG station (in Nos)
Consensus at political & judicial level to replicate Gujarat model , i.e. to increase gas share to 25%
33Massive Infrastructure Investment in Oil & Gas sector is underway
Carrier first- Commodity latter. Infrastructure will unblock latent demand.
Ongoing Infrastructure Investment
India Gas Pipeline and CGD Network
• LNG terminals from 4 to 11; 6 under construction, 2
terminal from group company
• Pipeline network of 16000 kms extended by
13000kms work is started on most of stretches
• City Gas Distribution from 78 to 250 cities by 2020,
bids for 150 cities are likely by March 2018.
• Incentives to explore and extract gas, 1st round
under OLAP/HELP is going on.
• Small oil field 1st round concluded and second
round by May 2018.
Blue star denotes proposed 146 GA for CGD bidding
About $23bn will be spent in the next 5 years to build oil & natural gas infrastructure.
Approx. $1 bn VGF has been granted to GAIL to build pipeline infrastructure with likely unbundling
34Indian CGD is ready for next growth cycle
CGD to provide base load to Gas Economy. Government is aggressively pushing Compressed Natural Gas and Piped Natural Gas
Growth Drivers
India Gas Demand is Increasing
252
500
219 • 120 districts have high pollution levels
190
400 167
150 • Stringent emission norms. SC suggestion to ban Fuel Oil &
MMSCMD
300 Petcoke on pan India basis
191 206
157 173
200 134
0 131
0 139
0 146
121
0 117
0 • Coverage to increase to 322 cities (total >700 districts)
100
• Favourable regulatory support for CGD
0
FY 12 FY 13 FY 14 FY 15 FY 16 FY 17 FY 18 FY 19 FY 20 FY 21
• Tax arbitrage between liquid fuel and Gas
Normalised Demand Bull Case
• Energy security by balances energy mix
CGD demand adequately covered by domestic production • Industrial automation supports gas as fuel
38%
140 40%
35% • Domestic production of natural gas is rising and expected to
120 35% grow considerably
31%
100 29%
30%
80
26% • Fuel Oil production declining at refineries
21% 25%
60 111
97
17%
19%
100 103 108
20%
• Absolute constrain on LPG production and Import
92 88 87 91
40 infrastructure
14%
20 41 15%
27 31 36
15 16 17 18 22
0 10% • Highway, Inter city traffic, MHV, 2W will drive demand
FY 13 FY 14 FY 15 FY 16 FY 17 FY 18 FY 19 FY 20 FY 21
• Urbanisation and High rise building supports CGD
India CGD Demand Domestic Productiom
CGD as % of Domestic Production
CGD will have wider political patronage due to its wider, small consumption intensity (Household, passenger vehicles, small
enterprises)
35Natural Gas: Clean Fuel for Swachh Bharat (Clean India)
Fuel for urban India, clean India, digital India, GST compliant India
CNG has significant price advantage over Petrol Khurja- Case Study
INR/ ltr energy equalized
80.00 Demonetization, GST roll out and environmental pressure changing the
70.00 fuel landscape.
60.00
33.44 Small town about 100 Km from Delhi is famous for ceramics art work. 150
50.00
units making hand crafted pottery and ceramic work.
40.00 14.83
9.06
30.00 11.78 Unorganized sector, avoided using natural gas which leaves a trail and can
20.00 reveal financial data.
29.22
10.00 22.64
- Used all kinds of fuels – Furnace Oil, PetCoke, Kerosene, Rubber/Tyre Oil,
Petrol CNG as emission monitoring not a deterrent
Brent/ Gas S&D Cost/ Margins Taxes
The tri–combination of Demonetization, GST and SC’s decision to ban
Furnace Oil, PetCoke has proved to be a game changer for fuel mix.
Natural Gas Vehicle Penetration is low and will increase
India 1% November 2016 our total PNG sale in Industrial segment at Khurja was
2000 SCMD.
Thailand 1%
China 2%
December 2017 sales, increased to 16000 SCMD, registering 8 fold growth
Brazil 2%
Egypt 3%
FY 19 will reach 80000 SCMD, growth of 4000% in 2 year expecting 100%
Banglade… 11% units on Natural Gas.
Iran 15%
Pakistan 33% Industry is happy with ease of use with gas: saving space/ easy to handle/
on tap/ pay after use/ safe and reliable. It has improve the product quality.
0% 10% 20% 30% 40%
NGVs as % of total vehicle population
Apart from less polluting and ease of operation, Natural Gas will continue to have significant competitive advantage over
liquid fuel
36Regulatory Framework, Policy Landscape
Regulator Framework Pricing Mechanism Recent Policy Impetus
• No regulatory control on Sales Price
• Allocation of domestic gas for household
Petroleum and Natural Gas Regulatory
Board • Sales price are benchmarked to alternate
and transportation segment
fuel in each segment
• Public Utility status to CGD
Asks for bids for Municipal areas based • Natural Gas will have clean and Green
upon premium over alternative fuel • CGD eligible for funding from infra cess
• Network Tariff-20% • Prices are more stable and less volatile • LNG approved as fuel for highway
• No. of Domestic Connection-50% than liquid fuel
• No. of CNG Outlets-20% transportation
• Inch KM of Pipeline-10% Gas Supply Mechanism
• Natural gas is likely Ito be included in GST
• Government allocates gas for CNG &
• Push for LPG penetration in rural area
domestic use
• Strong entry barriers by regulation-
Awards 25 years concession • Gas for other segments bought from open
market exclusivity
• Awardee to build the urban
network • Sourcing is fair mix of short term and spot • Ban on Fuel Oil in NCR and SC suggestion
o Network exclusivity for 25 yrs
o Marketing exclusivity for 5 yrs contracts
to ban pan India
expected to increase to 8 year
• Term prices are benchmarked to Brent
• Massive infrastructure in oil & Gas
• No regulation around marketing crude
margin
• Main suppliers are GAIL, GSPC, IOCL • Likely unbundling of GAIL
In essence, Utility Business with a market economy flavour - largely unregulated
* Compressed Natural Gas 37Adani Gas Expanding CGD Network
AGL is directly operating in 4 cities and added 9 cities in recent bidding rounds through IOCL JV, All 9 cities to be operational by 2021
Chandigarh AGL along with JV to expand footprint
Udham Singh Nagar Network by FY21 ADANI GAS IOAGPL
Panipat
Bulandshahr Cities 4 9
Faridabad
Khurja Infrastructure
-Steel Pipeline KM 500 750
Ahmedabad -PE Pipeline KM 6,000 5000
Allahabad Customer No.
-Industrial 1,500 750
-Household 4,00,000 2,50,000
Vadodara -Commercial 3,000 1,000
Daman
CNG Outlets No. 100 75
Dharwad
South Goa Gas Volume
MMSCMD 1.75 1.5
Adani Gas
Ernakulum IOAGPL Aspirations to add more cities to portfolio in upcoming
bidding rounds
Largest private sector CGD. Well positioned to expand the network
38The JV with IOCL: Public sector pedigree with private sector expertise
Petronet LNG, IGL with 50% private ownership are success stories in Indian gas sector, IOAGPL to replicate and exceed the
same in CGD JV will have private sector character
Domain Expertise Infrastructure
• Processes Logistics & resources
• Manpower Borrowing Capacity
• Strong commitment of promoters
• Promoters has stake in 5 upcoming LNG terminal
• Economics of scale will allow
• Continued cost leadership
• Competitive sourcing of gas, IOC is importing LNG
• With IOC good support at government/ regulatory levels
• Easy access to ready marketing infra of IOCL, 25000 retail outlets
• Strong credit rating of promoters
• Ability to hire talent
• Easy to scale on technology platform developed by AGL
• Strong safety practices adopted at AGL
IOAGPL is in perfect position to participate in growth driven by new geographies and intensify growth within developed
cities
39Adani Gas – Key growth drivers
Intensifying the growth within same and new geography, increasing PNG penetration in each segment
Replicating the AGL learnings at JV
CNG Household Industrial/Commercial LNG
• Existing User- additional • Building with infrastructure-
mileage • Linked with Economic growth • Long distance fixed route
current penetration < 50%
• Inbound from other GA highway vehicle
• Outbound to other GA • New Industrial clusters
• New Building, under
• New User construction building- 100% • Industries not connected with
• New CNG car buyers • NCR- as much coverage Pipelines
penetration from day-1
• New CNG conversion
• New Segment • Outer Faridabad • CNG for cities closer to LNG
• Pubic building, Defense, PSU
• Commercial MHV colony, Auda terminal not yet authorized
• Cab aggregators
• Existing user of other CGD • Heating application current user
• boarder area base around 30%
Strategy Strategy Strategy Strategy
• Zero waiting at outlet • Customer Ease • On demand connection • Early mover
• Spot Billing
• Targeted marketing and • Prepaid meters • EMI for upfront cost • Pilot type projects
awareness
• Targeted marketing and • Targeted marketing and
• Strategic positioning of new awareness awareness
outlets
• Safety awareness • Safety awareness
CGD is in resurgence mode and ready for next round of growth, likely to have higher growth compared to peers
40Adani Gas customer base is well spread out across segment and cities
Pure play CGD company with 10 year of operational track record
Segment Wise Volume City wise Volume
Comm VAD KHJ
The Differentiators
3% 6% 2%
Dom
7% • Balanced product segment mix
FBD
28% • Wide customer base
Ind CNG
37% 53% AHD
64%
• No single entity greater than 2% of revenue
• Cost leadership – Lowest operating cost in the industry
• Under penetrated market in Gujarat and NCR
Gujarat segment Volume NCR segment wise Volume
Comm
• Management Depth
Comm Dom 1%
Dom 4% 3%
9% • Strong Brand
• Technology driven only CGD company to have SCADA
CNG Ind CNG
53% 44% 52%
Ind
34% based operation
• Evolving SCM integration with new terminals
Well established player, competitive advantage from low operating cost, scale advantage for new cities
41Adani Gas: De-Merger
Adani Gas Limited (AGL) operates the CGD business and is currently 100% subsidiary of AEL
• AGL is operating in 4 cities and its 50: 50 joint venture with Indian Oil Corporation
Largest Private Sector CGD
Limited, has been authorised for 9 cities.
player in India with significant
• CGD is end customer facing business, listing of AGL will provide AGL with brand
growth opportunities
awareness for future growth
• AGL will be a pure play gas marketing and distribution company.
Focused Pure Play Gas
• All the CGD assets will be housed under AGL
Marketing and Distribution
• Focused management team to capture emerging opportunity in Gas as Green Fuel
• Unlocks value of CGD business currently embedded in the value of AEL
Shareholder Value Unlocking • Shareholders to get direct exposure to high growth CGD business of AGL, removing any
holding company discount
Post demerger, AGL is to list on stock exchanges tentatively by end of H1FY19
42Resilient operations resulting into robust financial performance
Strong Operational Matrix
Volume in MMSCMD Gross Margin INR per SCM Gross Margin in % & INR/Crs)
800 50%
25
CAGR 10.1 700 45%
1.50 9.6 9.7
1.3 37% 38%
40%
20 8.5 600
1.1 1.1 33%
1.20 1.1 1.0 35%
500 25%
15 30%
0.63 6.0
0.90 11.09 12.34
0.57 0.51 11.80 400 178 25%
0.52 0.47
11.81 16% 133 20%
10 300 132
0.60 94
7.53 15%
200 93
0.30 0.61 0.68 5 306 10%
0.55 0.56 0.57 7.69 7.73 240 232 261
7.11 100
4.47 4.96 152 5%
- 0 - 0%
FY 14 FY 15 FY 16 FY 17 FY 18 FY 14 FY 15 FY 16 FY 17 FY 18 FY 14 FY 15 FY 16 FY 17 FY 18
CNG PNG PNG CNG CNG
Robust Financial Performance
Operating EBIDTA INR per SCM / Free Cash Flow INR/Crs. ROCE (%)
EBIDTA Margin in %
9 35%
7.6
8 49 21%
6.9 6.9
7 30% 19% 18%
5.8 16%
6 30% 29% 12 33 140
40
25%
5 4.1 26% 125
30 11%
4 0 78
20%
3 18%
50
2 15% 128 96 152
1
11%
79 178
0 10%
FY 14 FY 15 FY 16 FY 17 FY 18 FY 14 FY 15 FY 16 FY 17 FY 18 FY 14 FY 15 FY 16 FY 17 FY 18
EBIDTA (Per SCM) FCF (Post Capex) ROCE
43Key Investment Highlights
Natural gas has become a major source of clean fuel based energy across the world with heavy investment in
production, transportation and distribution infrastructure
Lower cost and cleaner than other fossil fuels
India has lagged; however now serious efforts to catch up: $23bn earmarked
Exponential multiyear growth expected
Adani Gas is the largest private sector player – well positioned to take advantage of this growth
Cost leader, strong balance sheet and superior execution capability should help in building pan India CGD
infrastructure
44AEL: Adani Wilmar – Edible Oil & Food www.farmpik.com
Edible Oil Industry in India

•   India consumes almost 21 MMT edible oil every year
•   Consumption of edible oil growing @ CAGR of approx. 4%
•   India is the third largest consumer of edible oils (12% of global consumption), after China and the EU
•   Every increase in income translates to a rise in demand for food products including cooking oil.
•   Consumption-driven demand growth has outstripped domestic supply growth, increasing the country's import dependence to nearly 60%.

                                                                                                                                46
Indian Edible Oil Consumption Growth Drivers
One of the lowest per capita oil consumption (in kg) Market Dynamics
70
61.1 63.9 63.9 63.6
59.7 • Exponential increase in consumption driven by rising
60 62.4 62.8 64.2
59.5 60.1 income levels and aspiration.
50
43.8 43.8
40 39.6 39.7 41.2
• Imports which constituted 3% in late nineties of
30 overall consumption now at 70%.
25.1 25.7 26.2 26.4 26.6
20
15.4 15.8 16.7 17.4
14.9
10 • Per capita consumption to rise to about 23kg by 2025
with a growth likely to be around 4%.
0
2011-12 2012-13 2013-14 2014-15 2015-16
EU USA China Brazil India • Indian oilseed production stagnating and not likely to
grow – fueling growth of Imports
Consumption to grow manifold
35
30 • Lowest Per Capita Consumption (Kg) of Edible Oil in
30 26 India – Huge potential to grow.
25 23
20 20
20 17
15 • 50% of consumption still catered by unorganized
10 sector- Huge potential for consumer pack business.
5
0
• Demand not constraint - Supply is abundant.
2015-16 2020-21 2024-25
Per Capita (In Kg) Demand (MMT)
47Adani Wilmar: Strong Growth through Brand across Food segments
Edible Oil and Food Business Dominant Market Share
(as at March-18)
19%
14%
5% 4% 4%
Basket of Brands for Edible Oil & Food Products
• Refineries spread across India to cater the geographies Haldia-
(North East), Mundra-(West) Mangalore, Kakinada&
Krishnapatnam- (South).
• Crushing Units located in the proximity to seed cultivating areas-
Mantralayam –Sunflower Seed, Neemuch, Chindwara, Shujalpur
(M.P.) , Bundi (Rajasthan) & Nagpur (Maharashtra)-Soya Seed,
Alwar & Bundi (Rajasthan)-Mustard Seed.
• Job work units spread across India to cater the local markets.
48Business Model & Strategy
Journey so far….
• Set up first refinery at Mundra with a refining capacity of 600 TPD in the year 1999
• Launch of Fortune Brand in the year 2000
• Grown from 1 refinery in 1999 to 18 refineries in 2018
• Refining capacity increased from 600 TPD in 1999 to 11000 TPD in 2018
• Owns 18 refineries and 10 crushing units at various strategic locations across India.
• One of the leading exporters of Castor Oil, Oleo-Value Added Products and De-oiled Cakes
• Revenue went up from INR 417 Cr to INR 25000 Cr over these years
• Capital investment of INR 2500 Cr as on date
Competitive Advantage Future Plans
• 18 Refineries & 10 Crushing Units • To be considered as FMCG Food Company instead of only
• Refining capacity of over 11,340 tonnes per day
edible oil company
• Seed crushing capacity of 8,950 tonnes per day
• Packaging capacity of 8,360 tonnes per day • Overall Volume Target – 10 MMT by 2021-22
• 5000+ distributors & >1 mn outlets serve 30 mn • Consumer Packed Oil Business – 3LMT/Month as against
households
1.75-1.80 LMT/Month at present
• India’s No.1 edible oil brand “Fortune” having presence all
over India • Plan to Grow in new business segments like Wheat Flour,
• Diversified food products such as Rice, Soya, Pulses, Besan, Rice, Soya Nuggets and Sugar
Castor and Soya & Oleo value added products
49Financial Parameters
Volume MMT Revenue Rs Cr
4.50 4.27 30000
3.92 26435
4.00 CAGR : 11% CAGR : 16%
25000 23215
3.50 3.15
3.00 2.78 2.73 20000 17828
2.50 14836 14861
15000
2.00
1.50 10000
1.00
5000
0.50
0.00 0
FY14 FY15 FY16 FY17 FY18 FY14 FY15 FY16 FY17 FY18
EBIDTA Networth
Rs Cr Rs Cr
1200
1800 1655
1010
1000 1600
CAGR : 24% CAGR : 21%
1400 1280
783
800 1200 1048
961
600 525 1000
502 776
426 800
400 600
200
400
200
0 0
FY14 FY15 FY16 FY17 FY18 FY14 FY15 FY16 FY17 FY18
50Key Investment Highlights
1
Indian food
consumption trend is
a compelling case
for AWL’s business
7 2
Competitive advantages in
Strong parentage, company sourcing, investment in
managed by professionals
capacities and strong
and industry experts business strategy aligned to
shift in consumption pattern
Investment 3
6
Diversified product highlights
Pan India presence and
portfolio and focus on extensive manufacturing,
branding to capture marketing, sales and
incremental market share distribution platform
5 4
Strong financial profile with Prudent business strategy and
revenue growth ~25% CAGR, risk management policies, given
with comfortable cash flows the low margin business coupled
throughout the tenor of the with commodity cycles and
project competition
51AEL: Mundra Solar PV - Solar Manufacturing
52Solar Manufacturing - Demand-Supply Scenario
Global solar PV demand projection (in GW)
China US Japan India EU RoW
119 121
116 116
107 33
99 38
45 42
79 14
48 13
52 3
13 4
34 12 17
51 5 16
10 6
15 7 12 13 14 15
15 12 12
7 11 13
8
12 9 10
5 9 35 40
2 8 7 21 28 31
7
6 9 11
2015 2016 2017E 2018E 2019E 2020E 2021E 2022E
India cumulative solar capacity (MW)
Installed Capacity
Projected Capacity
100000
82500
65000
48000
32000
12288
3745 6760
FY15 FY16 FY17 FY18 FY19 FY20 FY21 FY22
To achieve such an ambitious target, India is projected to install on average 18,000 MW of solar capacity annually
Source: GTM Research – PV Pulse, February 2018, MNRE
IEO – International Energy Outlook 53Drivers & Regulatory framework for Growth
• Impending safeguard / CVD duties to open up market demand
India • Increased demand for Indian made cells / modules set to raise ASPs and margins
domestically
• Cells / Modules imported from India exempt from Section 201 tariffs
USA
• Projected market of ~350 MW / year opens up with price premiums
Vietnam • Announced project pipeline is above 8.8 GW
• Energy Strategy Package - 40 GW of PV on top of installed 19.2 GW (EoY 2016),
Italy
translating to 3 GW annual market from 2018 to 2030
• Resurgence of European demand in 2018 will bring 43% annual growth from 2017 levels
Europe
of 6.3 GW
• France, Netherlands and Taiwan round out some of the most attractive markets by 5-
Others
year market size (~ 2 GW/annum) and growth rate (2-3x)
Supportive Regulatory framework
Gujarat Govt. Policy Safeguard Duty Countervailing Duty M-SIPS Policy
o INR 100 Cr CAPEX o Status o Status o Status
subsidy • Recommended • Ongoing • INR 342 Cr. Capex
o INR 10 Cr Interest subsidy assessed
subvention o Expected impact o Expected impact
o Full exemption of • 70% duty on imported • 30-35% on panel o Timeline
electricity duty cells from China / prices • Subsidy disbursement
o INR 1/unit rebate on Malaysia expected shortly
electricity rates
o SEZ benefits on import
duties
Duty impacts are expected to have a cumulative impact on imported PV products; an additional customs duty of
7.5% is also being considered
Source: GTM / BNEF 54Support for Incremental Capex
Proposed Capital Subsidy for new/upgraded capacities
Polysilicon Wafer Cell Module
Est. Capex for
1000 MW ~ $150 Mn ~ $120 Mn ~ $160 Mn ~ $50 Mn
2-3 GW 4 GW 6 GW 6 GW
Upper limit of
CFA* @30%
~ $46 Mn ~ $37 Mn ~ $48 Mn ~ $16 Mn
Manufacturing Support Creation of Local Offtake
• Interest subvention of up to 3% for upgrading/expansion • Restructuring requirements for greater backward
of existing capacity integration
• Exemption from customs duty on import of capital goods • Rooftop DCR to have 40% requirement of domestic
• Lenient allocation and banking of renewable energy for cells in 2018/19
manufacturing • 20% of DCR modules to have domestic made wafers
• Supply of power at APPC + 5% rates from 2019/20
• Land at preferential rates / near ports • 2020/21 to see earmarked DCR component of 20% for
domestic polysilicon
CPSU scheme has been increased to 12 GW from 1 GW;
Creating offtake and price premiums for locally made cells and modules
* CFA – Central Financial Assistance 55Why India needs to build Solar Manufacturing Capacity
• Controlling Forex outflow: In the absence of manufacturing, India will need to import USD 42 bn. of solar equipment by 2030
corresponding to 100 GW of installed capacity1.
• Job Creation: Solar manufacturing can also create direct employment of more than 50,000 in the next 5 years assuming local
manufacturing captures 50% domestic market share and 10% global market. Another at least 125,000 indirect jobs will be created in
the supply chain
• Investment opportunity in the country impacting the GDP
• Achieving self-sufficiency:
a) Major exporters may decide to divert most of their supply for domestic use (as evidenced by increased demand pull in Q3 2017 and
non-availability of imported modules)
b) Sudden jump in prices in the future due to supply shortages (polysilicon supply constraint raised the price due to supply disruptions)
c) Dispute with major suppliers (as evidenced in the case of China’s rare earth supply to Japan or supply of gas by Russia to European
nations)
d) Unless end-to-end value chain capability is created domestically, temporary protectionist measures like ADD/CVD on cells/modules
may attract additional tariffs on imported raw material like wafers/polysilicon
• Protection against fluctuation in pricing: Unless end-to-end value chain capability is created domestically, temporary protectionist
measures like ADD/CVD on cells/modules may attract additional tariffs on imported raw material like wafers/polysilicon
• Quality and warranty assurance
1) India’s energy imports have risen sharply from USD 43 bn. in 2005-06 to USD 167 bn. in 2013-14. In comparison India’s trade deficit
in 2013-14 was USD 139 bn. Solar power is a strategic need for the country as solar power can potentially save USD 20 billion in fossil
fuel imports annually by 2030.
56You can also read