AGRICULTURE AND ALLIED SECTORS - CHAPTER - eptri
←
→
Page content transcription
If your browser does not render page correctly, please read the page content below

Ministry of Environment, Forest &
Climate Change, Govt. of India

                                                              CHAPTER - 6

                                            AGRICULTURE AND
                                             ALLIED SECTORS

                                    The discovery of agriculture was the first big
                                    step towards a civilized life.”
                                                                         Arthur Keith
This chapter discuss on variation in population
growth leading to food security issues. High lights
about land Utilization Pattern, rainfall, Cropping
Intensity, irrigation sources, Labour Force,
Livestock, poultry population and on Fisheries. It
focuses on area, production and productivity of
major agricultural crops and horticultural crops,
more emphasis on area under fodder crops, agro-
forestry and Organic farming.

This chapter also focuses on the impact due to
Fertilizer consumption, Pesticide consumption, etc
and on case studies. It focuses on seed production
and supply and promotion of new varieties
through new technology.        It also talks about
various Government programmes, initiatives and
schemes such as Mission Bhagheeratha, Grama
Jyothi, Telangana PallePragathi, Mission Kakatiya,
Rashtriya Krishi Viaks Yojana, Mana Vooru- Mana
Kurgayalu Programme, etc, New Initiatives for
Sustainable Agriculture Development, Policy
implications. Key challenges and recommended
actions and good practices are discussed.
Ministry of Environment, Forest &                                   Environment Protection Training & Research Institute, Hyderabad
        Climate Change, Govt. of India

                                                                                         CHAPTER 6
                                                                    AGRICULTURE AND ALLIED SECTORS

6.0 Introduction
The new State of Telangana is with a geographical area of 1, 12,077sq km and population of 350.04 lakh
(2011 census). The State is bordered by Maharashtra and Chhattisgarh in the north, Karnataka in the west
and Andhra Pradesh in the south and the east. The State is strategically located in the Deccan plateau in a
semi-arid region. The climate is predominantly hot and dry.
Two major perennial rivers - the Krishna and the Godavari are passing through the State. The catchment
area of Godavari lying in the State is 79% and that of the Krishna is 68.5%. Despite a large proportion of the
catchment area of the two major rivers lying in the State, the present utilization of these river waters in the
State is much below the potential because of the neglect of the region in the erstwhile State of Andhra
Pradesh.
6.1 Driving Factors
A stable and high growth in agriculture sector is essential for uplifting the standard of living of the rural
population. However, one of the worrying features of the recent growth experience has been that of the
deceleration in agriculture growth. The Agriculture sector has been experiencing negative growth in the
last two years, on account of consecutive drought and structural rigidity. Crops sector per se was badly
affected due to these reasons and recorded a negative growth of 18.2%. However, growth in primary sector
was partially compensated by the positive growth registered in Livestock (12.2%), Fisheries (17.8%),
Mining and Quarrying (6.9%) sectors. Table 6.1 shows growth rates of agriculture and allied sectors based
on GVA at constant prices in Telangana state.

Table 6.1 Growth rates of agriculture and allied sectors based on GVA at constant prices in Telangana State
                                                            2012-13        2013-14           2014-15          2015-16
            S. No.                              Item         (SRE)          (SRE)             (FRE)             (AE)
               1       Crops                                        9.8            1.7            -14.2              -18.2
               2       Livestock                                    8.0            2.3               8.2               12.2
               3       Forestry and logging                         -0.6          -2.5               1.4               -2.7
               4       Fishing and aquaculture                    10.4            14.4               8.5               17.8
               5       Agriculture, forestry and fishing            8.8            2.1              -5.3               -4.5
       Source: Socio Economic Outlook 2016, Pg.No.12, Planning Department, Government of Telangana.

The share of agriculture sector in total GSDP has been declining steeply as compared to decline in
employment in agriculture sector. As per the 2011-12 prices, agriculture& allied activities share in total
GVA was 12.9 percent, whereas about 55.6 percent of total workforce is dependent on it.
In other words, more than half of the State's population is experiencing reduced income. Keeping the
drought conditions into consideration, the Government has prepared an Action Plan for mitigating the
adverse impact of drought through provision of input subsidy, augmenting fodder availability, livelihood
assistance etc.
The Government also realizes that there is an increased need for a second green revolution in order to
overcome the structural rigidities in the agricultural sector and to make farming more remunerative. This,
for instance, needs farmers to diversify towards production of non-cereals, protein-rich food products such
as milk, egg, etc. In this direction, Government of Telangana has given a lot of emphasis on horticulture and
animal husbandry. Telangana contributes significantly in the production of horticultural crops such as -
mango, red chilli, turmeric, vegetables etc., and production of milk and poultry products. In order to boost

                                                                                                                                      Chp.18
                                                                                                                                      Chp. 6
State of Environment Report, Telangana - 2015                 22
                                                              115
Ministry of Environment, Forest &                                                 Environment Protection Training & Research Institute, Hyderabad
        Climate Change, Govt. of India

growth in these sectors, the Government has launched five major schemes (i) micro-irrigation (ii)
greenhouses/polyhouses scheme (iii) farm mechanization (iv) Rs. 4 subsidy per litre milk to dairy farmers
(v) power subsidy to poultry farmers.
Irrigation is a critical determinant of agriculture productivity, especially in drought prone regions. In order
to increase area under irrigation, the Government has taken two major initiatives: (i) launching of 'Mission
Kakatiya' to repair and revive the existing tanks to their full potential, and (ii) according high priority to
complete all major irrigation projects to utilize the State's water share from major rivers, duly modifying
the design, wherever necessary, to suit the State's needs. Mission Kakatiya is a flagship program of the
Government, under which over 45,000 water bodies are planned to be rejuvenated in a phased manner. In
phase I of this Mission over 8200 tanks were taken up for restoration and the work has already been
completed on more than 6000 tanks. Now works have been taken up on 9000 tanks under Phase-II.
6.1.1        Population growth
61.12% of people in the state reside in rural areas and 38.88% reside in urban areas (Table 6.2). The overall
growth of total population during the decade 2001 to 2011 is 13.58%, whereas it was 18.77% in the
preceding decade (Table 6.3). The growth of the population in urban areas has been witnessing a
significant increase. Urban population in the State grew by 38.12% during the decade 2001 to 2011 as
compared to the preceding decade (25.13%). In sharp contrast, rural population in the state grew by a
modest 2.13% as per the 2011 census. However it is much higher than the United Nations estimates of
world population growth at 1.23%. Around 30% of the total urban population is residing in the capital city
of Hyderabad alone. Due to increase in population in the state there is increase in the demand for food and if
this trend continues the demand for food grains will rise further in future. The Government should take
necessary initiatives keeping the demand projection into consideration.
                               Table 6.2 Population in Telangana State according to 2011 census
                                                Population      Number in lakhs               Percentage
                                                  Rural                         213.95                      61.12
                                                  Urban                         136.09                      38.88
                                                  Total                         350.04                   100.00

                                           Source: Statistical Year Book 2016

                       Table 6.3 Variation in population from 1901 to 2011 census in Telangana State
                                                      Variation since the Preceding          Density
                      Census                                                 Census       of Population
                       Years       Persons        Absolute (Nos.)       Percentage         (perSq.km.)
                       1901         59,72,448                -                -                 52
                        1911                  72,66,516             +1294068                 +21.67                             63
                        1921                  69,91,433              -2,75,083                 -3.79                            61
                        1931                  81,24,122            +11,32,689                +16.20                             71
                        1941                  93,46,269            +12,22,147                +15.04                             81
                        1951                1,08,98,622            +15,52,353                +16.61                             95
                        1961                1,26,94,581            +17,95,959                +16.48                            111
                        1971                1,58,17,895            +31,23,314                +24.60                            138
                        1981                2,01,82,438            +43,64,543                +27.59                            176
                        1991                2,60,89,074            +59,06,636                +29.27                            227
                        2001                3,09,87,271            +48,98,197                +18.77                            270
                        2011               3,50,03,674             +40,16,403                +13.58                            312
              Source: Directorate of Census Operations,2011, Hyderabad.

                                                                                                                                                    Chp.18
                                                                                                                                                    Chp. 6
State of Environment Report, Telangana - 2015                              116
                                                                           22
Ministry of Environment, Forest &                                                 Environment Protection Training & Research Institute, Hyderabad
        Climate Change, Govt. of India

6.1.2        Food Security
Enactment of the National Food Security Act has changed the food distribution scenario in the State, apart
from improving the nutritional levels. The Act seeks to make the right to food a legal entitlement by
providing subsidized food grains. In addition to the mandated coverage under the Act, State Government
has increased the coverage by relaxing eligibility criteria and providing additional rice at a cheaper rate.
Every eligible person is provided with 6 kilograms of rice per month without any ceiling for a family. The
Government is also providing “SannaBiyyam” (fine rice) to the students' at all social welfare hostels and
under Mid-Day meal scheme in the schools, which is now proposed to be extended to college students.
The Government has launched a massive drinking water supply scheme, “Mission Bhagheeratha”, with a
vision to provide tapped water connection to each and every household in all habitations. This pioneering
scheme has been commended by the Government of India for other States to emulate. Rural development
with public participation has become the focus of the Government. GramaJyothi scheme is aimed at
empowering Gram Panchayats for the holistic development of the Panchayats in the spirit of 73rd
Constitutional Amendment. Telangana PallePragathi, focuses on improving livelihood opportunities of
poor rural households through intervention in five focal areas.
6.2         Pressure
6.2.1        Land Utilization
Telangana State covers a geographical area of over 112.07 lakh hectares, has about 39 percent under
agriculture and around 23 percent is under forest cover. Land put to non-agriculture uses is around 8
percent. Details of land utilization pattern during 2014-15 are given in the Figure 6.1.

                                                1.1, 1% 1.8, 2%
                                                                  3, 3%                          Land under misc. Tree crops &
                                                                                                 grovers
                                                               6.1, 5%                           Culturable Waste

                                                                      8.1, 7%                    Permanent pastures and
                                                                                                 grazing lands
                                                                                                 Barren & uncultivable land
                          43.8, 39%
                                                                               8.8, 8%
                                                                                                 Other fallow lands

                                                                                                 Land put to non - agricultural
                                                                                                 uses
                                                                          14, 12%
                                                                                                 Current fallow lands

                                                                                                 Forest area

                                                   25.4, 23%                                     Net area sown

                  Source: Socio Economic Outlook 2016, Pg.No.26, Planning Department, Government of Telangana

                                Figure 6.1 Land Utilization Pattern in Telangana during 2014-15

The pattern of land Utilization in Telangana (Table 6.4) indicates that both the total cropped area and net
sown area decreased in 2014-15 as compared to the previous year due to drought and low rainfall.
Accordingly, the area under current and other fallow land also increased. The land put to non-agricultural
uses and culturable waste increased from 824 to 884 thousand hectares and 170 to 182 thousand hectares
respectively from 2009-10 to 2014-15 which is of concern to meet the food security demand of the state.

                                                                                                                                                    Chp.18
                                                                                                                                                    Chp. 6
State of Environment Report, Telangana - 2015                            117
                                                                         22
Ministry of Environment, Forest &                                                       Environment Protection Training & Research Institute, Hyderabad
        Climate Change, Govt. of India

                             Table 6.4 Pattern of land utilization in Telangana (Area in 000' hectares)

          S. No                                 Category                         2009-10   2010-11     2011-12     2012-13      2013-14    2014-15

           1.      Forest Area                                                      2743       2742         2742        2742        2540       2540

           2.      Barren and Uncultivable Land                                      617        617          616         616         607         607

           3.      Land put to Non Agricultural Uses                                 824        870          881         885         880         884

           4.      Culturable Waste                                                  170        166          164         173         176         182

           5.      Permanent Pastures and other Grazing Lands                        308        302          302         302         300         298

                   Land Under Misc. Tree Crops and Groves (not included in Net       115        113          113         113         112         112
           6.
                   Area Sown)

           7.      Current Fallow Lands                                             1937       1397         1236        1203         950       1400

           8.      Other Fallow Lands                                                807        780          825         790         716         805

           9.      Net Area Sown (including fish and prawn ponds)                   3959       4492         4599        4653        4923       4376

           10.     Area sown more than once                                          939       1375         1102        1036        1320         938

           11.     Total cropped Area                                               4898       5867         5701        5690        6243       5315

      Source: Statistical year Book 2015, 2016-pgno.91 Government of Telangana

6.2.2        Land Holdings and Operated Area
Land resource is a vital input for agriculture. Average landholding in Telangana in 2010-11 was 1.12
hectares (2.8 acres) as against the all India average of 1.16 hectares. There are 55.54 lakh operational
holdings with an area of 61.97 lakh ha. The number of operational holdings belonging to various categories
and the land operated by them (2010-11) is indicated in Table 6.4. Increase in population has put pressure,
leading to fragmentation of landholdings. As shown in Table 6.5 and 6.6, the share of marginal and small
landholdings constitutes about 86 percent of total landholdings in Telangana State in 2010-11, while their
share in total area was around 55 percent. About 14 percent of total landholdings in the State were medium,
ranging between 2 to 10 hectares, with 40.5 percent share in total area. District wise analysis shows that
average landholding size was less than one hectare in Nizamabad, Karimnagar, and Medak districts
showing skewed land distribution in the State, making agriculture a subsistence source of livelihood for the
majority of the population of the state. Average size of land holding is highest (1.40 ha) in Adilabad district
and lowest (0.92 ha) in Nizamabad district.

                                    Table 6.5 Land holdings and area operated in Telangana 2010-11
                                                                                                                    Percentage
                                                  Number of Holdings             Area Operated              Number of
     S. No            Category                       (lakh Nos)                    (lakh ha)                 Holdings      Area Operated
       1          Marginal                                    34.41                      15.67                      61.96            25.28
       2          Small                                       13.27                      18.69                      23.90            30.17
       3          Semi Medium                                  6.03                      15.85                      10.86            25.58
       4          Medium                                       1.67                       9.27                        3.00           14.96
       5          Large                                        0.16                       2.49                        0.28            4.01
                  Total                                      55.54                      61.97                      100.00          100.00
 Source: Statistical Year Book 2015, Pg.No. 87, DES, Government of Telangana

                                                                                                                                                          Chp.18
                                                                                                                                                          Chp. 6
State of Environment Report, Telangana - 2015                                     118
                                                                                  22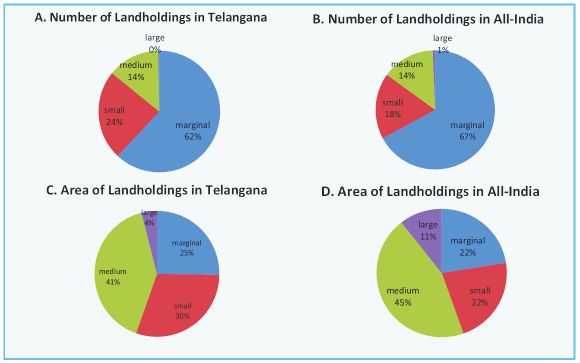
Ministry of Environment, Forest &                                          Environment Protection Training & Research Institute, Hyderabad
        Climate Change, Govt. of India

     Table 6.6 Percentage distribution of landholdings and area operated according to size class, 2010-11
   S. No.              District                   Marginal          Small              Medium                     Large                    Avg.
                                                (Upto 1.0 ha)   (1.0 - 2.0 ha)      (2.0 - 10.0 ha)             (10.0 ha &                Land-
                                                                                                                  above)                 holding
                                                Number   Area   Number     Area   Number           Area       Number Area                  Size
                                                 (%)     (%)     (%)       (%)     (%)             (%)         (%)       (%)               (ha)
        1        Adilabad                         49.8   16.9     27.7     28.3          22.1      50.1              0.4        4.8           1.40
        2        Nizamabad                        67.5   33.9     23.8     36.1           8.6      28.5              0.1        1.5           0.92
        3        Karimnagar                       67.5   30.9     21.9     31.8          10.5      34.7              0.2        2.6           0.96
        4        Medak                            67.9   29.9     21.7     31.3          10.0      34.4              0.3        4.4           0.97
        5        Hyderabad                         0.0    0.0      0.0      0.0           0.0       0.0              0.0        0.0           0.00
        6        Rangareddy                       58.3   23.5     25.7     29.4          15.6      42.0              0.4        5.1           1.22
        7        Mahabubnagar                     57.9   22.0     25.4     29.5          16.3      44.0              0.4        4.5           1.23
        8        Nalgonda                         58.8   23.1     25.3     29.9          15.6      43.4              0.3        3.6           1.19
        9        Warangal                         67.1   28.6     21.4     29.7          11.2      37.0              0.3        4.7           1.01
       10        Khammam                          62.2   25.6     22.6     27.6          14.9      42.6              0.3        4.3           1.14
                   Total                          62.0   25.3     23.9     30.2          13.9      40.5              0.3        4.0          1.12
Source: Socio Economic Outlook 2016, Pg No.30, Planning Department, Government of Telangana

Landholding pattern in Telangana is more evenly distributed compared with all India level, While 85
percent of total landholdings in India are marginal and small landholdings, farmers possess only 44 percent
of total land as against, 86 percent of total landholdings in Telangana are marginal and small possessing 55
percent of total landholdings. Figure 6.2 shows the percentage distribution of landholdings and area in
Telangana 2010-11.

                         Source: Socio economic outlook 2016, Pg No.30, Planning Department, Government of Telangana
                     Figure.6.2 Percentage distribution of landholdings and area in Telangana 2010-11

6.2.3        Rainfall pattern
The Normal average rainfall in Telangana State is about 905.3 mm as against India's normal average rainfall
of 1083 mm. About 80 percent of the total rainfall in the State is received during the South-West monsoon
(June to September). There has been an acute deficiency of rainfall in the previous two years, i.e., 2014-15
and 2015-16. The actual rainfall received during South-West monsoon of 2014-15 was 494.7 mm as against
the normal rainfall of 713.6 mm, recording a deficit of –31%. There was a deficit in rainfall in nine out of ten
districts in the State (except in Mahabubnagar) during this period. The State received an average rainfall of

                                                                                                                                             Chp.18
                                                                                                                                             Chp. 6
State of Environment Report, Telangana - 2015                        119
                                                                     22
Ministry of Environment, Forest & Environment Protection Training & Research Institute, Hyderabad
Climate Change, Govt. of India
611.2 mm during the South West Monsoon (June - September), as against the normal rainfall of 713.6 mm
in 2015-16 resulting in a deficiency of -14%. Figure 6.3 shows the rainfall during south-west monsoon in
Telangana from 2009-10 to 2015-16.
The rainfall in the State is erratic and uncertain and distribution of the rainfall is uneven in various mandals,
thus, making agriculture a proverbial gamble in monsoon. Of the rainfall received during the period from
2009-10 to 2014-15, the annual actual rainfall was lowest in 2011-12 with 661 mm, where as it was the
highest in 2013-14 with 1212 mm as against normal rainfall of 905.3 mm in the state. Year wise details of
actual and normal rainfall are depicted in Figure 6.4. (Socio economic outlook, pg 27)
1000
800
Rainfall in mm
600
400
200
0
2009-10 2010-11 2011-12 2012-13 2013-14 2014-15 2015-16
Normal rainfall 713.6 713.6 713.6 713.6 713.6 713.6 713.6
Actual rainfall 494.9 894.4 601.1 707.2 851.5 494.7 611.2
Source: Socio Economic Outlook 2016, Pg.No.27. Planning Dept. Govt. of Telangana
Fig 6.3 Rainfall during South-West Monsoon in Telangana
1400
Rainfall in mm
1200
1000
800
600
400
200
0
2009-10 2010-11 2011-12 2012-13 2013-14 2014-15
Normal rainfall 905.3 905.3 905.3 905.3 905.3 905.3
Actual rainfall 682 1101 661 917 1212 682
Source: Socio Economic Outlook 2016, Pg.No.27. Planning Dept. Govt. of Telangana
Fig 6.4 Normal and Actual Rainfall in Telangana
Chp.18
Chp. 6
State of Environment Report, Telangana - 2015 120
22Ministry of Environment, Forest & Environment Protection Training & Research Institute, Hyderabad
Climate Change, Govt. of India
6.2.4 Cropping Intensity
The cropping intensity (the ratio of gross cropped area to net cropped area) is one of the indicators for
assessing the efficiency of the agriculture sector. The cropping intensity for the year 2013-14 increased to
1.27 from 1.22 in 2012-13. The cropping intensity is highest (1.67) in Nizamabad District and lowest (1.09)
in Adilabad district. The cropping intensity is expected to increase with increasing area under irrigation in
the state. Mission Kakatiya and redesigning of irrigation projects undertaken by the government may
increase the cropping intensity and production of food grains substantially in the state. Table 6.7 shows
District wise cropping intensity in 2013-14. Highest Cropping Intensity of 1.67 was recorded by
Nizamabad district in the year 2013-14 followed by Karimnagar and Warangal at 1.53 and 1.36
respectively. (Statistical year book 2015, pg. 88)
Table 6.7 District wise cropping intensity in 2013-14
S. No. Districts Cropping intensity
1 Mahabubnagar 1.11
2 Rangareddy 1.14
3 Medak 1.23
4 Nizamabad 1.67
5 Adilabad 1.09
6 Karimnagar 1.53
7 Warangal 1.36
8 Khammam 1.16
9 Nalgonda 1.27
State 1.27
Source: Compiled by author
6.2.5 Irrigation sources
Irrigation is the artificial application of water to the land or soil. It assists in the growth of agricultural crops,
maintenance of landscapes, and re-vegetation of disturbed soils in dry areas and during periods of drought.
Irrigation is one of the most critical inputs for enhancing the productivity of the land that is required at
critical stages of plant growth. One cannot imagine agriculture without irrigation in dry and uncertain
rainfall distribution regions. Two important rivers of India the Godavari and Krishna are flowing through
the state to increase area under irrigation. Major sources of irrigation in the state are canals, tanks, tube
wells, dug wells etc. Irrigation is being done with the use of various techniques such as surface irrigation,
localized irrigation, drip irrigation, sprinkler irrigation, sub-irrigation depending upon the availability of
source, accessibility and others to increase the productivity of the crop grown. Source wise distribution
reveals that wells are main source of irrigation in the State, irrigating about 82% of the total net irrigated
area in 2014-15. The share of canal and tank irrigation is confined to a mere 10 percent and 4 percent
respectively.
6.2.6 Gross and net irrigated areas
The Gross irrigated area in the State during 2014-15 was 25.29 lakh hectares as compared to 31.54 lakh
hectares in the previous year, showing a negative growth of 20%. Similarly, Net area irrigated came down
from 22.8 lakh hectares (2013-14) to 17.26 lakh hectares (2014-15), showing a negative growth of about
24%.
Chp.18
Chp. 6
State of Environment Report, Telangana - 2015 121
22Ministry of Environment, Forest & Environment Protection Training & Research Institute, Hyderabad
Climate Change, Govt. of India
35
30
25
20
15
10
5
0
2009-10 2010-11 2011-12 2012-13 2013-14 2014-15
Gross Area Irrigated 21.31 29.99 28.64 25.57 31.54 25.29
Net Area Irrigated 14.93 20.04 19.85 17.74 22.8 17.26
Source: Statistical Year Book 2016, pg.No.120 DES, Government of Telangana
Figure 6.5 Gross and Net area Irrigated (in Lakh hectares)
Table 6.8 Gross area irrigated by different sources in Telangana (in '000' hectares)
S. No. Source 2009-10 2010-11 2011-12 2012-13 2013-14 2014-15
1. Tanks 67.17 305.22 207.54 179.48 281.46 113.13
2. Canals 169.06 503.88 431.82 120.52 469.35 243.05
3. Wells (Tube & Dug) 1841.98 2110.95 2156.83 2207.41 2333.87 2115.78
4. Other Sources 53.05 78.72 67.83 49.68 69.62 56.98
Total 2131.26 2998.77 2864.02 2557.09 3154.3 2528.94
Source: Statistical Year 2016, Pg No.120, DES, Government of Telangana
Table 6.9 Net area irrigated by different sources in Telangana (in '000' hectares)
S.No. Source 2009-10 2010-11 2011-12 2012-13 2013-14 2014-15
1 Tanks 56.85 237.96 182.7 157.66 228.17 96.78
2 Canals 137.45 315.75 325.31 90.29 288.8 173.68
3 Wells (Tube & Dug) 1259.38 1395.6 1423.25 1485.84 1710.65 1413.09
4 Other Sources 39.13 54.65 53.34 40.31 52.02 42.73
Total 1492.81 2003.96 1984.6 1774.1 2279.64 1726.28
Source: Statistical Year 2016, Pg No.120, DES, Government of Telangana
Irrigation intensity [ratio of gross irrigated area (GIA) to net irrigated area (NIA)] under all sources of
irrigation is given in Table 6.10. Irrigation intensity under wells is 1.50 in 2014-15. Expansion in Gross and
Net area irrigated has taken place due to the rise in well irrigation.
Chp.18
Chp. 6
State of Environment Report, Telangana - 2015 122
22Ministry of Environment, Forest & Environment Protection Training & Research Institute, Hyderabad
Climate Change, Govt. of India
Table 6.10 Gross and Net Irrigated Area and Irrigation Intensity from 2009-10 to 2014-15
Irrigation Irrigation
GIA under all NIA under all intensity GIA under NIA under intensity
Year source (lakh ha.) sources (lakh ha.) (all sources) wells(lakh ha.) wells (lakh ha.) (wells)
2009-10 21.31 14.93 1.43 18.42 12.59 1.46
2010-11 29.99 20.04 1.50 21.11 13.96 1.51
2011-12 28.64 19.85 1.44 21.57 14.23 1.52
2012-13 25.57 17.74 1.44 22.07 14.86 1.49
2013-14 31.54 22.80 1.38 23.34 17.11 1.36
2014-15 25.29 17.26 1.47 21.16 14.13 1.50
Source: Socio Economic Outlook, Pg.No.35, Planning Department, Govt. of Telangana
The source-wise net area irrigated from 2009-10 to 2014-15 is shown in Table 6.11. Net area irrigated by
wells has been increasing, especially in last two years as a coping up strategy against the drought
conditions. Net irrigated area through wells have increased from 74.83 percent in 2013-14 to 81.87 percent
in 2014-15, while the area irrigated by canals has increased from 5.07 percent in 2012-13 to 12.68 percent
in 2013-14 and decreased to 10.08% in 2014-15.
Table 6.11 Percentage of Net Area Irrigated by source of Irrigation
Source-wise Net Area Irrigated (%)
Net Area Irrigated
Year (Lakh Ha.) Canals Tanks Wells
2009-10 14.93 9.18 3.82 84.33
2010-11 20.04 15.76 11.87 69.63
2011-12 19.85 16.37 9.22 71.69
2012-13 17.74 5.07 8.91 83.77
2013-14 22.89 12.67 10.05 74.83
2014-15 17.26 10.08 5.62 81.87
Source: Socio Economic Outlook, Pg.No.35, Planning Department, Govt. of Telangana
Looking at the above table it is clear that over a period of last 6 years in Telangana there is significant change
in the usage pattern of major source of irrigation. While the tank and canal irrigation shows a declining
trend over the years, well irrigation shows a faster growth rate. This is a clear indicator of deliberate neglect
of thousands of tanks built during the Kakatiya's period. High dependency on wells has adverse effect on
groundwater levels, therefore there is a need to increase tank and canal irrigation sources in the State.
Hence, the Government has launched “Mission Kakatiya” to revive and rejuvenate tank irrigation.
Government has also proposed to reengineer the canal irrigation projects and has allocated substantial
portion of budget for the same.
However, increasing tapping of groundwater is leading to the lowering of the level of groundwater. There is
going to be proportionate increase in the power consumption and running of pumps for longer duration.
This may adversely impact the environment.
There is a severe stress on groundwater due to deficit as well as abnormal distribution of rainfall pattern in
the state, causing further depletion of groundwater levels in the areas where there is no sufficient rainfall.
The average groundwater level for the State in the month of March - 2016 is 14.88 m, where as it was
12.27mduring March 2015. The deep water levels during March2016 when compared to the last year
water levels is due to 32% deficit rainfall received during 2014-15 and 25% during 2015-16 resulting in a
net fall of 2.61m during this year.
Chp.18
Chp. 6
State of Environment Report, Telangana - 2015 123
22Ministry of Environment, Forest & Environment Protection Training & Research Institute, Hyderabad
Climate Change, Govt. of India
6.2.7 Agricultural Labour Force
Along with the structural changes in the economy, a corresponding change is observed in the employment
pattern. Over a period of time, there has been a shift of employment from primary to the secondary and
tertiary sectors, both in terms of output and employment. However, the shift in employment is not as rapid
as changes observed in sectoral output.
The share of agriculture sector in total GSDP has been declining steeply as compared to decline in
employment in agriculture sector. As per the 2011-12 prices, agriculture & allied activities share in total
Gross Value Added (GVA) was 12.9 percent, whereas about 55.6 percent of total workforce is dependent
on it.
In terms of nature of employment, 45.8 percent of the total workforce is reported to be self employed; 35.4
percent as casual labour and about 16.1 percent as wage/salaried earners and about 2.7 percent as
contract workers. Area wise analysis shows that, the largest number of workforce (48.8 percent) is
reported to be self employed in rural areas, where as a majority of the workforce in urban areas is working
as wage-salary earners.
Table 6.12 Details of Cultivators and Agricultural Labour (main working) in Telangana
Year Total Rural Cultivators Agricultural labour
population population Number Percent Number Percent
(in lakhs) (in lakhs) (in lakhs) change over (in lakhs) change over
preceding preceding
census census
1951 107.52 85.02 38.42 - 16.44 -
1961 127.12 102.63 28.50 -25.82 17.19 +4.56
1971 158.18 124.97 23.69 -16.88 22.03 +28.16
1981 201.81 150.82 30.86 +30.27 28.33 +28.60
1991 260.89 182.15 34.36 +11.34 40.02 +41.26
2001 309.87 211.34 33.30 -3.08 32.10 -19.79
2011 350.04 213.95 29.94 -10.09 45.90 +42.99
Source: Socio Economic Outlook 2016, Pg.No.147, Planning Dept, Govt. of Telangana
As per the data given in Table 6.12, the number of cultivators in the state is gradually decreasing while the
number of agricultural labourers is increasing. The total number of cultivators and agricultural labourers
account for 29.94 lakhs and 45.90 lakhs respectively according to 2011 census as against 33.3 lakhs and
32.1 lakhs respectively as per 2001 census.
The number of cultivators who were 38.42 lakhs as per 1951 census was reduced by 22% and remained as
29.94 lakhs as per 2011 census. In contrary to this, the number of agricultural labour has increased by
179% i.e., from 16.44 to 45.9 lakhs as per 1951 and 2011 census respectively. This kind of trend in number
of cultivators and agricultural labour indicates a negative effect on both the environment and rural
economy of the state.Decline in the number of cultivators indirectly indicates the conversion of agricultural
lands to non-agricultural lands.
6.2.8 Livestock and poultry population
Animal Husbandry sector consists of bovine, ovine, pig and poultry population. Bovine population is
further classified into cattle and buffaloes and ovine population into sheep and goat. It provides an
additional income and employment to the farmers, especially in times of drought. It is an established fact
that with the economic progress, consumption pattern shifts from cereal-based foods to protein based
foods, implying a potential for the growth of the sector. At present, this sector provides direct livelihood
opportunities to about 29 lakh families in Telangana. The value of livestock produce is estimated to be
Rs.25293 crores at constant prices and the livestock sector contribution is likely to be 5.9% to GVA in 2015-
16.
Chp.18
Chp. 6
State of Environment Report, Telangana - 2015 124
22Ministry of Environment, Forest & Environment Protection Training & Research Institute, Hyderabad
Climate Change, Govt. of India
Telangana is blessed with rich livestock resources, especially cattle and sheep population accounting for
th
5.52 percent of the Country's population. As per the Livestock Census, 2012, Telangana stands 10 in
nd th th th
livestock population, 2 in sheep population, 13 in goat population, 4 in poultry, 13 in bovine population
th
and 15 in pig population. The State has 92.28 lakh bovines according to Livestock Census of 2012. Cattle
account for 50.34 lakhs and buffaloes 41.94 lakhs. The State had a total ovine population of 175.49 lakh, of
which 128.75 lakh are sheep and 46.76 lakh are goats according to Livestock Census 2012. Table 6.13
shows the Livestock and Poultry population.
Table 6.13 Livestock and poultry population (Number in lakhs)
Category As per 1999 Census As per 2003 Census As per 2007 Census As per 2012 Census
Cattle 55.09 48.71 57.50 50.34
Buffaloes 33.55 37.58 50.42 41.94
Sheep 46.67 114.40 133.57 128.75
Goat 25.39 32.36 48.01 46.76
Pigs 3.35 2.98 2.32 2.52
Poultry 254.22 405.46 494.48 691.59
Source: Statistical Year Book, 2016, Pg.No.132, DES, Govt. of Telangana
The increasing number of different livestock and poultry over years definitely demands for increasing
fodder and feed. However, as the majority of farmers are small and marginal, they should be recommended
to adopt integrated farming systems such that the recycling of byproducts among the components of the
system not only lessens the adverse effect on environment but also raises the income of the farmer and
make him move towards sustainable agriculture.
6.2.9 Fisheries
Fisheries sector is one of the fast growing sectors contributing to GSDP of the State as well as generating
income and employment. Fisheries sector contributes 3.47% of GSDP from agriculture and 0.6% to the
rd
GSDP during 2014-15 at current prices. Telangana state ranks 3 in inland resources of 5.87 lakh hectares
th
and 8 in fish production with 2.2 lakh tonnes in the country. The sector aims at exploitation of all the
possible resources under capture and culture fishery base for increasing fish production and productivity
through sustainable development. The sector is contributing considerably for food security, nutrition and
health, livelihood security to rural population and welfare of fishermen. There are 19.04 lakh fishermen in
the State. More than 65 percent of fishermen are concentrated in Warangal, Mahabubnagar, Nalgonda and
Karimnagar districts.
Among the total 78 reservoirs in the State, the water spread area is below 1000 hectares in 53 reservoirs,
between 1000 and 5000 hectares in 17 reservoirs and 8 percent of reservoirs have water spread area of
more than 5000 hectares. Out of the total 35031 tanks in the State, more than 600 are found in Warangal,
Medak, Karimnagar and Mahabubnagar districts, thus, these districts have high potential for fisheries
development through tanks and reservoirs.
6.3 State
6.3.1 Area, production and productivity of major agricultural crops
Net Cropped Area (NCA) in Telangana in the year 2014-15 was 43.8 lakh hectares, while Gross Cropped
Area (GCA) was about 53.2 lakh hectares. Out of the total GCA, 30.7 lakh hectares (58%) was under food
crops and 22.5 lakh hectares (42%) was under non-food crops. The important food grains cultivated in the
State are rice, maize, jowar, bajra, pulses, etc. Cotton is an important non-food crop accounting for 32
percent of total GCA in the State.
The area brought under food crops during 2014-15 was 30.68 lakh hectares as against 38.97 lakh hectares
in 2013-14, showing a decrease of 21.27 percent over previous year. The area under non-food crops was
also decreased to 22.47 lakh hectares as against 23.47 lakh hectares in 2013-14, showing a decrease of 4.26
percent.
Chp.18
Chp. 6
State of Environment Report, Telangana - 2015 125
22Ministry of Environment, Forest & Environment Protection Training & Research Institute, Hyderabad
Climate Change, Govt. of India
The area under food grains decreased to 26.13 lakh hectares during 2014-15 as against 34.31 lakh hectares
in 2013-14 the decrease being 23.84% over previous year's area (Figure 6.7). The decrease in area under
food grain crops is due to lack of availability of sufficient water in irrigation sources and untimely rains.
This has led to decrease in the production of food grains by 32.45% in 2014-15 as compared to the previous
year.
120
100
80
60
40
20
0
2009-10 2010-11 2011-12 2012-13 2013-14 2014-15
Area (in lakh hectares) 26.49 34.44 31.09 28.36 34.31 26.13
Production (in lakh tonnes) 51.90 92.60 75.01 82.42 106.86 72.18
Source: Statistical year book 2016, pg.No.89, DES, Govt. of Telangana
Fig.6.6 Area and Production of food grains in Telangana
The area, production and productivity (yield) of major agricultural crops grown in Telangana state from
2012-13 to 2014-15 is presented in Table 6.14. The area under cereals & millets has decreased by 6.70 lakh
hectares in 2014-15 over the previous year, and area under pulses has decreased by 1.48 lakh hectares in
2014-15 when compared with that of 2013-14. Rice, the major staple food grain crop of the state accounts
for 26.63% of the total cropped area in the state during 2014-15. Its area over the period is also fluctuating
with monsoon / rainfall. The area and production of jowar, which is predominantly grown in
Mahabubnagar, Adilabad and Medak districts has been continuously decreasing over last six years in the
state, though there is marginal raise in its productivity because of availability of hybrids and improved
management practices.
Area, production and productivity of maize, a major millet crop of the state grown predominantly in
Mahabubnagar, Medak, Warangal and Karimnagar districts has also reduced to 6.92 lakh hectares, 23.08
lakh tonnes and 3338 kg/ha in 2014-15 as compared to 7.5 lakh hectares, 35.12 lakh tonnes and 4681
kg/ha in 2013-14 due to adverse seasonal conditions.
Redgram, Bengalgram, Greengram, Blackgram and a few other pulses are also being raised in the state. The
area under these pulses accounted for 7.68% of the total cropped area and 15.62% of the total area under
food grain crops in the state during 2014-15. 2.63 lakh tonnes of pulses were produced in the state during
2014-15.
The area under oilseeds excluding coconut crop during 2014-15 was 5 lakh hectares which constituted
9.41% of the total cropped area in the state. The area under groundnut alone accounted for 30.95% of the
total area under oilseeds crops during 2014-15. Out of 7.21 lakh tonnes of production of oilseeds,
groundnut and soybean accounted for major production in the state. The increase in productivity of
groundnut, sesame, castor, sunflower and soybean can be attributed to the research and extension efforts
made by the State Agricultural University and Agriculture Department in the state.
Amongst commercial crops, area under cotton cultivation has increased tremendously over the years
although its productivity remained stable.
Chp.18
Chp. 6
State of Environment Report, Telangana - 2015 126
22Ministry of Environment, Forest & Environment Protection Training & Research Institute, Hyderabad
Climate Change, Govt. of India
Cereals, millets and pulses occupy more than 50 percent of total GCA in Nizamabad, Karimnagar, Medak,
Rangareddy and Mahabubnagar districts. Nalgonda (with 44% GCA) and Karimnagar districts (with 40%
GCA) stand at the top in terms of area and production of rice in the state. With 2.10 lakh hectares area under
coarse cereals, Mahabubnagar stands first in terms of area under coarse cereals and Karimnagar district
stands first in terms of production of coarse cereals with 5.46 lakh tonnes. Cotton is a major non-food crop
in Warangal, Karimnagar, Nalgonda, Adilabad and Mahabubnagar districts.
Table 6.14 Area, production and yield of major crops in Telangana
Crop 2012-13 2013-14 2014-15
A P Y A P Y A P Y
Rice 14.18 46.48 3277 19.95 65.81 3300 14.15 45.45 3211
Jowar 1.23 1.34 1094 1.07 1.09 1016 0.79 0.83 1054
Bajra 0.10 0.12 1233 0.13 0.12 942 0.11 0.11 937
Maize 6.63 29.44 4440 7.50 35.12 4681 6.91 23.08 3338
Ragi 0.02 0.03 1358 0.02 0.02 1470 0.01 0.02 1145
Total cereals 22.25 77.51 3484 28.75 102.21 3556 22.05 69.56 3155
& millets
Greengram 1.5 1.1 735 1.24 0.85 689 0.87 0.45 513
Blackgram 0.56 0.51 913 0.41 0.36 852 0.28 0.16 583
Redgram 2.76 1.53 554 2.63 1.40 530 2.21 1.09 495
Bengalgram 1.12 1.64 1464 1.14 1.95 1716 0.59 0.81 1370
Cowgram 0.12 0.08 815 0.11 0.07 734 0.10 0.10 972
Total pulses 6.11 4.91 804 5.56 4.65 835 4.08 2.62 642
Groundnut 1.87 3.35 1789 2.10 3.55 1691 1.55 2.95 1907
Sesame 0.23 0.09 400 0.24 0.09 360 0.23 0.10 405
Safflower 0.1 0.16 1657 0.08 0.06 708 0.04 0.03 746
Sunflower 0.28 0.32 1129 0.2 0.19 949 0.18 0.26 1397
Soybean 1.58 2.87 1817 2.42 3.9 1610 2.43 2.62 1081
Castor 0.98 0.53 535 0.80 0.57 707 0.51 0.29 578
Total 5.09 8.07 1587 5.86 8.79 1500 5.00 7.20 1442
oilseeds
Chillies 0.83 3.00 3628 0.75 2.60 3463 0.73 2.53 3456
Turmeric 0.50 2.87 5780 0.50 2.52 5078 0.43 2.16 4975
Sugarcane 0.41 35.74 87430 0.39 33.76 85898 0.38 33.43 87654
Cotton (lint)* 18.13 40.57 380 17.03 42.35 423 16.93 35.83 360
Tobacco 0.05 0.13 2830 0.06 0.14 2246 0.06 0.16 2749
(A – Area in lakh hectares, P – Production in lakh tones and Y – Yield in kg/ha)*Cotton production in lakh bales (@170 Kg/bale)
Source: Statistical year book 2016, DES, Govt. of Telangana
6.3.2 Changes in cropping pattern
Food crops consisting of cereals, coarse cereals, pulses, and others occupy a major share in total cropped
area in the State. Research studies on the State's cropping pattern reveals that more than one-third of the
area was under food crops during 1980's. Cropping pattern from 1980's onward shifted to non-food crops
in the State.
The innovation of new production technologies, changing attitude of farmers towards market oriented
production, supporting government policies, etc., has led to the changing cropping pattern in the state.
6.3.3 Area and production of major horticultural crops
Horticulture is identified as one of the growth engines in the farm sector. It has been identified as one of the
“focus areas” for development of the state. Being traditionally rich with horticulture resources, the State
Chp.18
Chp. 6
State of Environment Report, Telangana - 2015 127
22Ministry of Environment, Forest & Environment Protection Training & Research Institute, Hyderabad
Climate Change, Govt. of India
has favorable climatic conditions suiting various horticulture crops. Usage of the latest technology and the
ability to meet the global demand for qualitative produce, makes the state a favorable destination for global
sourcing in horticulture.
Horticulture is a significant contributor to the Telangana State GSDP by generating employment to
unskilled and semiskilled rural poor. Total area under Horticulture crops during 2014-15 (final estimates)
is 7.39 lakh hectares with a total production of 91.70 lakh MTs. Major fruit crops in the state are Mango,
Citrus, Banana, Guava and Papaya while vegetables like Tomato, Brinjal, Bhendi and various varieties of
Gourds are predominant. Chillies, Turmeric and Corriander are important spices. Coconut, Cashew and Oil
palm constitute major plantation crops. The targeted area under Horticulture for the next five years (2013-
19) Action Plan is 14.48 lakh Ha, with an estimated production of 152.31 lakh MTs. In India, under
cultivated area Telangana ranks 3rd in fruits and 1st in Turmeric.
Among the 10 districts of Telangana, Mahabubnagar, with 1.38 lakh hectares of land stands largest in terms
of Gross Cropped Area under horticulture crops in 2014-15, followed by Khammam and Warangal with
1.32 and 1.18 lakh hectares, respectively.
As per the 1st Advanced Estimates, horticulture crops are grown in an area of 7.01 lakh hectares in 2015-16
producing about 74.79 MTs output. Of the total horticulture cultivated area, fruits constitute around
54.39%, followed by vegetables and spices with 22.2% and 19.05% respectively. Floriculture constitutes
about 0.4% of area under horticulture. Out of the total production of horticulture in 2015-16, fruits
constitute around 54.54% followed by vegetables, spices and flowers with 35.68%, 8.51% and 0.17%
respectively.
Out of the total horticulture area, the highest area is covered by mango – 29.07% followed by mosambi –
18.99%. Amongst vegetable crops, tomato and onion cover around 32.97% and 14.65% of the area
respectively and 38.79% and 16.22% of production under vegetables. Among spices, the turmeric and red
chilli cover around 41.37% and 55.42% of the area and 54.66% and 36.73% of production respectively.
Among flowers, marigold covers around 49.16% of the area and 65.24% of production.
A. Area under Horticulture Crops in Telangana
(2015 - 2016) (1st AE)
1% 4%
Flower
19%
Plantation crops
Spices
54%
Vegetables
22%
Fruits
A. Production of Horticulture Crops in Telangana
(2015 - 2016) (1st AE)
1%
8%
Flower
Plantation crops
Spices
55% 36% Vegetables
Fruits
Source: Socio Economic Outlook 2016, Pg No. 41 Planning Department,
Govt. of Telangana
Figure 6.7 Distribution of area and production among horticulture
crops during 2015-16
Chp.18
Chp. 6
State of Environment Report, Telangana - 2015 128
22Ministry of Environment, Forest & Environment Protection Training & Research Institute, Hyderabad
Climate Change, Govt. of India
6.3.4 Area under Fodder Crops, Agro-Forestry and Organic Agriculture
Forests play a major role in supporting livelihood activities of rural poor and tribals, mitigating the threat of
global warming besides, conserving the fertile soil and vulnerable wildlife. For the year 2015-16, forestry
and logging contribution is 0.4 percent to State GVA and 3.3% to agriculture & allied sector's GVA. Forest
area in Telangana is 27292 sq. km. accounting for 24.35 percent of total geographical area. Out of 27292
sqkm, reserved forest area is 19696.23 sq. km, protected forest is 6953.47 sq. km and 642.30 sq. km is
unclassified.
2%
26%
Unclassified
Protected forest
Reserved forest
72%
Source: Socio Economic Outlook 2016, Pg No.49 Planning Department,
Govt. of Telangana
Figure 6.8 classification of forest area in Telangana
In terms of district-wise forest cover, Adilabad has the largest area under forests, followed by Khammam.
However, in terms of percentage area under forest, Khammam stands first with 48.9 percent of total
geographical area under forests, followed by Adilabad with 44.9 percent and Warangal with 28.88 percent.
District - wise geographical area and forest area in Telangana is shown in Table 6.15
Table 6.15 District-wise Geographical Area and Forest Area in
Telangana State (Area in Sq Km)
S. No. Name of the District Geographical Forest % of Forest Area to the
Area Area Total Geographical Area
1 Adilabad 16105 7232 44.90
2 Karimnagar 11823 2545 21.52
3 Khammam 13266 6487 48.90
4 Mahabubnagar 18432 3033 16.45
5 Medak 9699 906 9.34
6 Nalgonda 14240 837 5.88
7 Nizamabad 7956 1812 22.78
8 Rangareddy& Hyderabad 7710 731 9.48
9 Warangal 12846 3710 28.88
Telangana State Total 112077 27292 24.35
Source: Socio Economic Outlook, 2016, Pg. No.50 Planning Dept., Govt. of Telangana
Chp.18
Chp. 6
State of Environment Report, Telangana - 2015 129
22Ministry of Environment, Forest & Environment Protection Training & Research Institute, Hyderabad
Climate Change, Govt. of India
The National Forest Policy of India envisages a minimum of 33% of the total geographical area under
forest/tree cover to maintain environmental stability and ecological balance; that are vital for sustenance
of all life-forms including human, animal and plants. The role of forests as carbon sinks provides an
additional important environmental factor. However, except in two districts, area under forest cover is less
than the desired 33% which is of high concern.
6.3.5 Organic farming
Organic farming is promoted with the main objective to encourage use of organic manures instead of
expensive chemical fertilizers.
6.3.5.1 Benefits of the Program
The need for organic farming arises from the un-sustainability of agriculture production and the damage
caused to ecology through the conventional farming practices. The practice of organic farming is based on
the similar principles underlying our traditional agriculture said to be the best known alternative to the
conventional method. Organic agriculture aims at the human welfare without any harm to the environment
which is the foundation of human life itself.
The philosophy of organic agriculture is to feed the soil rather than the crops to maintain soil health and is a
means of giving back to the nature what has been taken from it. Organic farming is not technology but a
system close to nature where in problems of farming aremanaged using local resources alone. Table 6.16
shows the Organic farming schemes proposed in Telangana.
Table 6.16 Organic farming schemes proposed in Telangana
S.No Scheme Objective Project Central State
Outlay Share Share
(crores) (crores) (crores)
1 Paramparagath To promote Organic Farming in cluster 21.2022 10.530 10.530
KrishiVikasYojana approach of 50 acres each with PGS
(PKVY) Certification
2 Promotion of 1. To protect consumer rights of getting
Certified Organic the product of appropriate quality as
Farming (Ongoing per the claims.
scheme under 2. To protect the interests of the organic 1.70 0.850 0.850
RKVY farmers by assigning their product a
clear distinction.
3. To develop the economical status of
farmers
Scheme for promotion of certified organic farming is an ongoing scheme being implemented under RKVY
since 2013-14. The main objective is to develop the land / agriculture into organic area rather than the crop.
Deputy Director of Agriculture, Farmers Training Centres in each district are the scheme implementing
agencies for the area expansion under organic farming.
Certification of Organic Farming scheme was implemented with a financial allocation of Rs.5.00 crores
during 2014-15. An area of 2305 ha spread over 8 districts in the state covering crops like Paddy, Redgram,
Bengalgram, Maize, Jowar, Groundnut, Vegetables etc. were registered for organic certification. Organic
inputs worth Rs. 5000/ha were given to the registered farmers as decided by the district level committee
wherein the representative farmers are also the members.
Free organic certification is provided involving APEDA accredited agencies i.e., APOF Organic certification
Agency (AOCA) Bangalore & Vedic Organic Certification Agency (VOCA) Hyderabad, in addition to the
capacity building of the registered farmers through trainings and organizing exposure visits. Further to
facilitate availability of sufficient organic inputs locally, assistance for establishment of Vermi compost
units, Vermi hatcheries & BIS mark (IS15907:2010) specifications High Density Polyethylene (HDPE)
Woven beds for Vermiculture were also provided.
Chp.18
Chp. 6
State of Environment Report, Telangana - 2015 130
22Ministry of Environment, Forest & Environment Protection Training & Research Institute, Hyderabad
Climate Change, Govt. of India
In view of the Paramparagath Krishi Vikas Yojana Scheme being initiated by the GoI for promotion of
Organic farming in cluster approach with PGS certification it is proposed to scale down the project of area
expansion under certified farming to the extent of the areas that are already registered with the
department and are in conversion stages.
It is proposed to promote certified organic farming in an area of 1685 ha which was already registered with
the department of agriculture during 2013-14 and are continued for 2014-15 & 2015-16.Table 6.17
showsthe district wise area under organic farming in Telangana.
Table 6.17: District-wise area under organic farming in Telangana
S.No. District Area under Area under Total area
C2 stage (ha) C1 stage (ha) (ha)
1 Rangareddy 236 0 236
2 Nizamabad 190 80 270
3 Warangal 22 50 72
4 Khammam 162.4 30.4 192.8
5 Karimnagar 88.8 56 144.8
6 Nalgonda 182.8 50 235
7 Medak 254 40 294
8 Mahabubnagar 160 80 240
Total 1296 386.4 1684.6
Source: Department of Agriculture, 2016 Government of Telangana
It is proposed to implement the scheme with a holistic approach by providing incentives to the farmers for
adopting organic farming, capacity building of farmers through trainings & exposure visits and also
extending assistance for on farm generation of organic inputs.
An amount of Rs.119.46 lakhs is proposed to be allocated for providing incentives to the organic producers
for supply of organic inputs, honorarium to coordinators for ICS, organizing trade fairs, certification
charges etc. It is planned for facilitation of implementation through engaging of coordinators for internal
control system and maintenance of farm diaries, etc.
6.3.6 Milk, Meat and Eggs Production
With an annual output of 1061 crore eggs, Telangana stands 3rd in egg production in the country. Every 8th
egg in the country comes from Telangana. With an annual meat production of 5.05 lakh MT, Telangana
th th
stands 6 in the country and with an annual production of 42.07 lakh MT of milk, Telangana occupies 13
position in the country in milk production during 2014-15. Production of milk, eggs, meat and wool in
Telangana from 2009-10 to 2014-15 is presented in Table 6.18. There is an increase in production of milk,
eggs, meat and wool in Telangana over the years indicating the potential of respective livestock units.
Table 6.18 Production of milk, eggs, meat and wool in Telangana
Year Milk Eggs Meat Wool
(in million metric (in billion numbers) (in lakh metric (in million kgs)
tonnes) tonnes)
2009-10 3.19 8.00 3.30 3.91
2010-11 3.47 8.49 3.63 4.10
2011-12 3.69 8.97 3.84 4.18
2012-13 3.95 9.42 4.29 4.26
2013-14 3.92 10.06 4.46 4.27
2014-15 4.21 10.62 5.05 4.42
Source: Directorate of Animal Husbandry, Govt. of Telangana.
Chp.18
Chp. 6
State of Environment Report, Telangana - 2015 131
22Ministry of Environment, Forest & Environment Protection Training & Research Institute, Hyderabad
Climate Change, Govt. of India
6.3.7 Inland fish and prawn production
Fisheries are a traditional and important occupation in Telangana State apart from being an important
source of food nutrient. Fisheries sector is contributing about 0.6 percent to the State GVA in 2015-16. The
Government aims at (i) increase in fish production and productivity through increasing fishery base (ii)
achieving self-sufficiency in fish seed (iii) supply of fish at an affordable price and in hygienic conditions
and (iv)improve the living condition of people depending on fisheries through welfare programs.
During 2015-16, 1.71 lakh tonnes of fish and prawn were produced in Telangana as against a target of 3.20
lakh tonnes. The production of fish and prawn which was 1.36 lakh tonnes in 2009-10 has increased to 2.68
lakh tonnes in 2014-15 in Telangana (Table 6.19).
Table 6.19 Fish and Prawn production in Telangana (in tonnes)
Year Inland fish Fresh water prawn Total
2009-10 133613 2008 135621
2010-11 133587 2206 135793
2011-12 196708 3774 200482
2012-13 214591 5037 219628
2013-14 243037 6596 249633
2014-15 260010 8352 268362
Source: Statistical Year Book 2016, Pg.No.135, DES,Govt. of Telangana
The average productivity of a tank is 300 to 400 kg per hectare of water spread area. Similarly, in reservoirs,
the productivity is 30 kg per hectare of water spread area as compared to the actual potential of 150 kg per
hectare. Thus, more attention needs to be given to reservoir and tank fisheries of Telangana to improve
their productivity.
The culture fishery of Telangana is not developed as compared to tank and reservoir fishery. A major
proportion of aquaculture farms are concentrated in Khammam district. Farmers from Mahabubnagar,
Nalgonda, Karimnagar and Adilabad districts are engaged in prawn culture.
The following table describes the requirement and gap in fish seed production.
Table 6.20 District wise requirement of Fish Seed
S.No. District Total No.of Total water Effective Fish seed Present Gap
water spread area water spread requirement fish seed
bodies in Ha. area in Ha. (Fry) production
in the
district
1 Adilabad 6667 76971.00 28545.00 1410.41 75.00 1335.41
2 Hyderabad 1 40.00 20.00 1.00 10.00 -9.00
3 Karimnagar 1843 46584.00 27001.50 1348.9575 625.00 723.96
4 Khammam 2156 40311.29 16732.41 744.4175 66.00 708.42
5 Medak 6082 92575.58 48234.39 955.60 75.00 880.60
6 Mahabubnagar 5987 110562.00 41983.75 2099.18 95.00 2004.18
7 Nalgonda 4629 71798.00 38529.00 1799.00 14.00 1785.00
8 Nizamabad 2797 62768.23 39206.61 1160.00 65.00 995.00
9 Rangareddy 1412 11467.80 5735.40 286.77 50.00 236.77
10 Warangal 3535 78412.27 30706.54 1535.33 410.00 1125.33
Total 35109 591490.4 276694.6 11371.16 1585.00 9786.16
Source: Agriculture & Cooperation Department, Government of Telangana
Chp.18
Chp. 6
State of Environment Report, Telangana - 2015 132
22Ministry of Environment, Forest & Environment Protection Training & Research Institute, Hyderabad
Climate Change, Govt. of India
6.4 Impact
6.4.1 Fertilizer consumption
The total consumption of fertilizers in Telangana state was highest in 2010-11 (29.42 lakh MT) and has
reduced to 23.89 lakh MT in 2012-13 and again rised to 28.54 and 26.54 lakh MT in 2013-14 and 2014-15
respectively (Table 6.21). Consumption of fertilizers by nutrients was the highest in 2010-11 at 14.81 lakh
MTs which has been falling there after to 13.39 lakh MTs in 2013-14 and to 12.48 lakh MTs in 2014-15. This
quantity of fertilizers consumption may have a positive correlation with area cultivated during the above
period. Among the different fertilizers consumed by different crops in the state, urea forms the major one
followed by complex fertilizers and DAP. Among the districts, Karimnagar followed by Nalgonda,
Rangareddy and Warangal are the major fertilizer consuming districts in the state as these are the principal
crop growing areas like paddy, cotton, maize, etc. However, Medak district is found to be the lowest in per
hectare consumption of fertilizers (Table 6.22).
Table 6.21 Fertilizer consumption in Telangana (in lakh metric tonnes)
Year Urea DAP MoP Complexes SSP Total
2010-11 14.11 4.17 2.45 8.16 0.53 29.42
2011-12 13.21 4.21 1.23 9.28 0.77 28.70
2012-13 13.14 2.51 1.09 6.71 0.46 23.89
2013-14 16.81 2.44 1.03 7.71 0.55 28.81
2014-15 13.67 1.89 1.09 8.12 0.48 25.25
Source: Statistical Year Book, 2016, Pg.No.116, Government of Telangana
Table 6.22 District-wise fertilizer consumption in Telangana (in lakh metric tonnes)
District 2010-11 2011-12 2012-13 2013-14 2014-15
Adilabad 2.26 2.64 2.03 2.18 1.92
Karimnagar 4.55 4.63 3.63 4.50 3.93
Khammam 3.07 2.60 2.16 2.44 2.54
Warangal 3.96 3.67 3.53 3.77 3.43
Nalgonda 4.69 4.22 3.23 4.47 3.64
Mahabubnagar 2.77 2.76 2.19 2.99 2.81
Medak 1.82 1.84 1.59 1.95 1.78
Nizamabad 3.36 3.57 3.13 3.16 2.89
Rangareddy 2.94 2.64 2.41 3.07 3.60
The below mentioned are some major effects of using fertilizers on the environment.
Depletes the Quality of the Soil
?
Alters the Biology of Water Bodies
?
Effects Human Health
?
Climate Changes Across the Globe
?
6.4.2 Pesticide consumption
The consumption has reduced due to the increased awareness created among farmers on Integrated Pest
Management practices by conducting Polambadi programmes in farmers' fields, hybrids in cotton, usage of
bio-pesticide. The pesticide consumption in the state is shown in Table 6.23.
Chp.18
Chp. 6
State of Environment Report, Telangana - 2015 133
22Ministry of Environment, Forest & Environment Protection Training & Research Institute, Hyderabad
Climate Change, Govt. of India
Table 6.23 Pesticide Consumption in Telangana
S. No. District 2007-08 2008-09 2009-10 2010-11 2011-12
1 Mahabubnagar 639 635 618 673 348
2 Ranga Reddy 180 179 174 190 154
3 Hyderabad 0 0 0 0 0
4 Medak 416 409 397 433 473
5 Nizamabad 365 363 353 385 457
6 Adilabad 522 510 505 550 589
7 Karimnagar 512 519 496 540 617
8 Warangal 641 639 620 675 674
9 Khammam 475 473 460 501 470
10 Nalgonda 486 483 474 512 625
Total 4236 4210 4097 4459 4407
Source: Commissioner of Agriculture, 2016 Government of Telangana
There is not much variation in the total Pesticide consumption by the State during 2007-08 to 2010-2011
except in the year 2011-12. There is an increase in consumption in Khammam and Mahabubnagar districts
by8 and 37 lakh metric tonnes respectively.
However, the environmental impact of pesticides consists of the effects of pesticides on non-target species.
Over 98% of sprayed insecticides and 95% of herbicides reach a destination other than their target species,
because they are sprayed or spread across entire agricultural fields. Runoff carries pesticides into aquatic
environments while winds carry them to other fields, grazing areas, human settlements and undeveloped
areas, potentially affecting other species. Other problems emerge from poor production, transport and
storage practices. Over time, repeated application increases pest resistance, while its effects on other
species can facilitate the pest's resurgence.
During the year 2015-16, the following schemes or activities are taken up in the Plant Protection section
under RKVY by Telangana state. Table 6.24 is showing Plant Protection schemes under RKVY in Telangana.
Table 6.24 Plant protection schemes under RKVY in Telangana
S.No. Particulars Amount Proposed
(Rs. in lakhs)
Strengthening of Pesticide testing laboratories of
1 Rajendranagar,Warangal, BPTL, Hyderabad and 60.00
PTL coding centre, SAMETI Hyderabad with sophisticated equipments
2 Establishment of pesticide residue laboratory at SAMETI, Hyderabad. 750.00
3 Establishment of new State Pesticide Testing Laboratories at Karimnagar and
150.00
Mahabubnagar.
Total 960.00
Source: Department of Agriculture,2016 Government of Telangana
6.5 Response
6.5.1 Seed production and supply
Telangana is endowed with excellent climatic conditions which are suitable for seed production of paddy
varieties, pulses, oil seeds and hybrids of cotton, sorghum, maize, bajra, sunflower, fodder sorghum and
vegetable crops. Best quality seed is produced due to congenial climate prevailing for seed production and
the farmers have become experts in seed production of different crops over a period of four decades of seed
production in Telangana State.
Chp.18
Chp. 6
State of Environment Report, Telangana - 2015 134
22You can also read