Retail Market Analysis - SouthSide Arts District - City of Bethlehem, Pennsylvania
←
→
Page content transcription
If your browser does not render page correctly, please read the page content below
SouthSide Arts District
Retail Market Analysis
           Bethlehem, Pennsylvania

                               Prepared For:

        City of Bethlehem, Pennsylvania
                                Prepared By;

                 Gibbs Planning Group

                       03 January 2020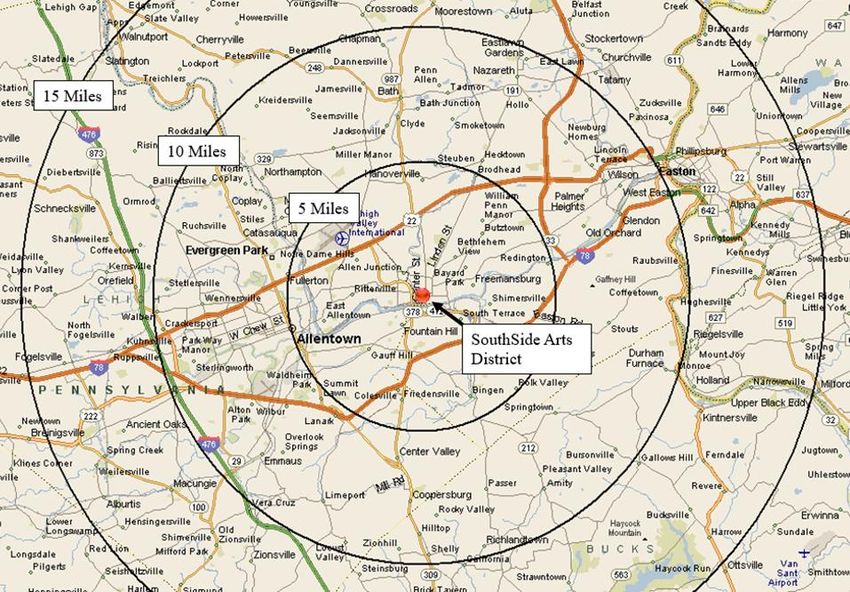
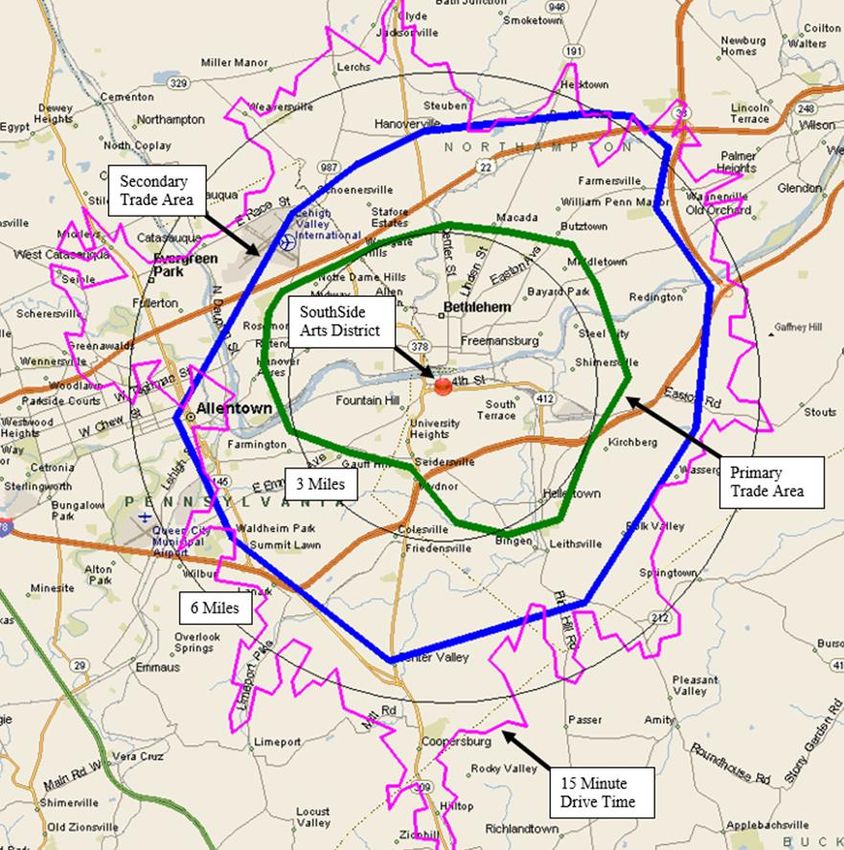
TABLE OF CONTENTS

INTRODUCTION ...............................................................................................................                 1
Executive Summary .............................................................................................................              1
Background ..........................................................................................................................        2
Methodology ........................................................................................................................         3

RETAIL TRADE AREAS ................................................................................................... 4
Primary Trade Area .............................................................................................................. 4
Secondary Trade Area .......................................................................................................... 5
Tapestry Lifestyles ............................................................................................................... 7
Employment Base ................................................................................................................ 11

SOUTHSIDE ARTS DISTRICT AREA CHARACTERISTICS ........................................                                                       14
Location ...............................................................................................................................    14
Access ..................................................................................................................................   15
General Retail Market Conditions .......................................................................................                    16
Zoellner Arts Center ............................................................................................................           16
SteelStacks ...........................................................................................................................     16
National Museum of Industrial History ...............................................................................                       17
Historic Hotel Bethlehem ....................................................................................................               18
Christmas City Tourism .......................................................................................................              19
Wind Creek Bethlehem .........................................................................................................              19
Lehigh University ................................................................................................................          20
DeSales University ...............................................................................................................          21
Northamption Community College ......................................................................................                       21
Moravian College .................................................................................................................          21

AREA SHOPPING CENTERS ............................................................................................ 23

RETAIL AND RESTAURANT DEMAND .........................................................................                                      27
2019 & 2024 Supportable Retail Table ................................................................................                       28
Recommended Retailers .......................................................................................................               28
Analysis Assumptions...........................................................................................................             29
Rationale ...............................................................................................................................   30
Retail Category Definitions ..................................................................................................              30
Shopping Center Definitions.................................................................................................                34
Limits of Study .....................................................................................................................       34

APPENDIX ...........................................................................................................................        37
Exhibit A: Primary Trade Area Business Summary .............................................................                                37
Exhibit B: Primary Trade Area Community Profile .............................................................                               39
Exhibit C: Primary Trade Area Housing Profile ...................................................................                           46
Exhibit D: Primary Trade Area Dominant Tapestry Descriptions ........................................                                       48

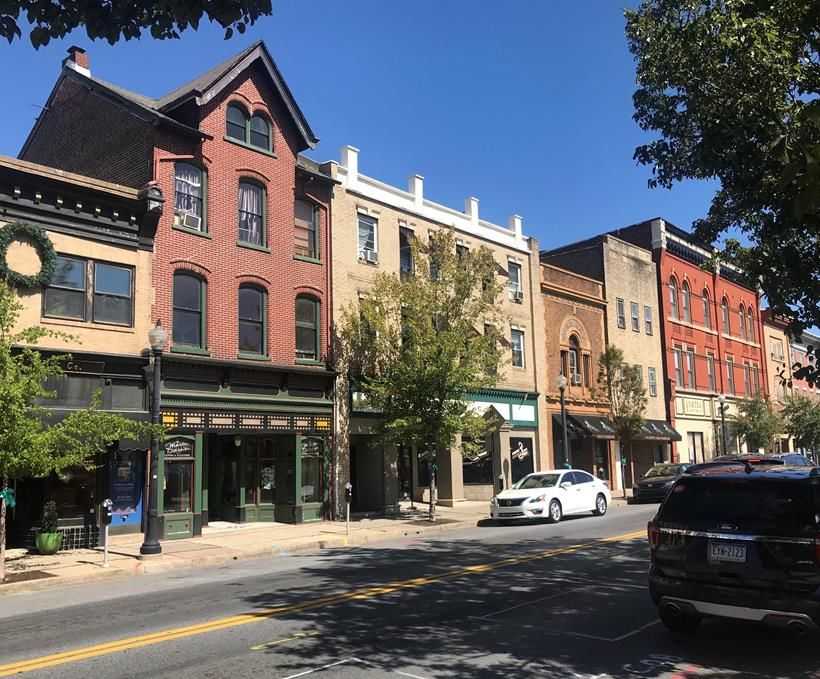
INTRODUCTION

Figure 1: The SouthSide Arts District is a revitalized downtown area that is now a popular destination for shopping,
dining and entertainment.

Executive Summary
This study finds that Bethlehem’s SouthSide Arts District can presently support up to 180,000
additional square feet (sf) of retail and restaurant development, generating as much as $66.0
million in new sales by 2024. This new commercial development could include 30 to 40 new
retail stores totaling 120,000 sf and 20 to 25 new restaurants and a brew pub totaling 60,000 sf.
The 180,000 sf of additional supportable retail and restaurant space represents a 45 percent
increase in the SouthSide Arts District’s existing 400,000 sf of first floor commercial area.

The SouthSide Arts District in Bethlehem is a recently revitalized downtown area that has
continued to receive substantial private and public investment. Its study area has an estimated 29
square mile primary trade area. The primary trade area includes 104,000 year-round residents and
41,000 households with an average income of $71,000 per year. Many trade area residents are
gainfully employed, and the median age is 38.6 years. Just over 28 percent of the trade area’s
residents have a four-year college degree and 33.3 percent earn over $75,000 per year.

Bethlehem SouthSide Arts District Retail Market Study                                                                  1
Gibbs Planning Group, Inc.
03 January 2020
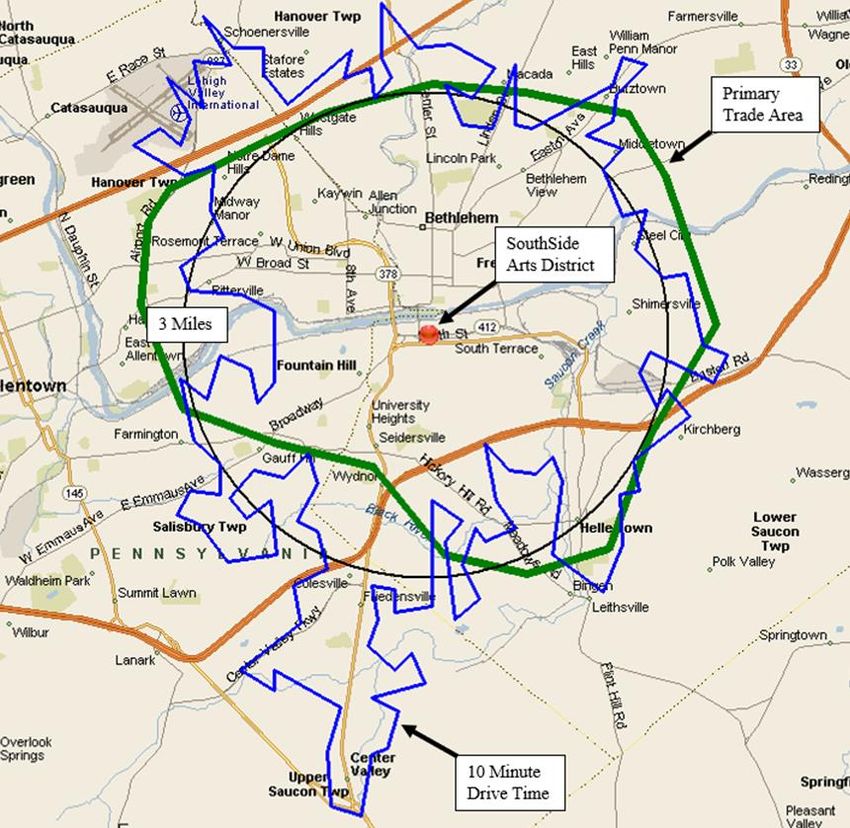
Figure 2: Bethlehem is in eastern Pennsylvania, roughly 50 miles north of Philadelphia and 70 miles west of New
York City.

Background
Gibbs Planning Group, Inc. (GPG) has been retained by the City of Bethlehem to conduct a retail
feasibility analysis to determine how much additional retail and restaurant development (if any) is
supportable in the city’s SouthSide Arts District.

GPG addressed the following issues in this study:
  • What is the existing and planned retail market in the SouthSide Arts District and
      surrounding areas?
  • What are the existing and potential trade areas for the SouthSide Arts District?
  • What are the population, demographic and lifestyle characteristics in the SouthSide Arts
      District currently and projected for 2024?
  • What is the current and projected growth for retail expenditures in the area, now and in
      2024?
  • How much additional retail square footage is supportable in the area and what retailers
      may seek to deploy a new business there?
  • What retail sales volumes can potentially be achieved in the SouthSide Arts District by
      these new businesses?

2                                                              Bethlehem SouthSide Arts District Retail Market Study
                                                                                        Gibbs Planning Group, Inc.
                                                                                                    03 January 2020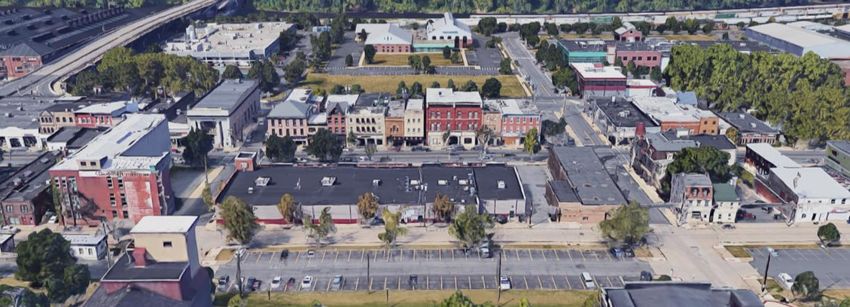
Methodology
To address the above issues, GPG defined existing and potential trade areas that would likely serve
the existing and new retail development in the SouthSide Arts District based on geographic and
topographic considerations, traffic access/flow in the area, relative retail strengths, concentrations
of daytime employment and the retail gravitation in the market, as well as our experience defining
trade areas for similar markets. Population, consumer expenditure and demographic
characteristics of trade area residents were collected by census tracts from the U.S. Bureau of the
Census, U.S. Bureau of Labor Statistics and Environmental Systems Research Institute (ESRI).

Figure 3: Map showing the location of Bethlehem’s SouthSide Arts District within the Lehigh Valley region.

Finally, based on the projected consumer expenditure capture (demand) in the primary trade area
of the gross consumer expenditure by retail category, less the current existing retail sales (supply)
by retail category, GPG projects the potential net consumer expenditure (gap) available to support
existing and new commercial development. The projected net consumer expenditure capture is
based on household expenditure and demographic characteristics of the trade areas, existing and
planned retail competition, traffic and retail gravitational patterns and GPG’s qualitative
assessment of the SouthSide Arts District.

Net potential captured consumer expenditure (gap) is equated to potential retail development
square footage, with the help of retail sales per square foot data provided by Dollars and Cents of
Shopping Centers (Urban Land Institute and International Council of Shopping Centers),
qualitatively adjusted to fit the urbanism and demographics of the study area.
Bethlehem SouthSide Arts District Retail Market Study                                                        3
Gibbs Planning Group, Inc.
27 December 2019
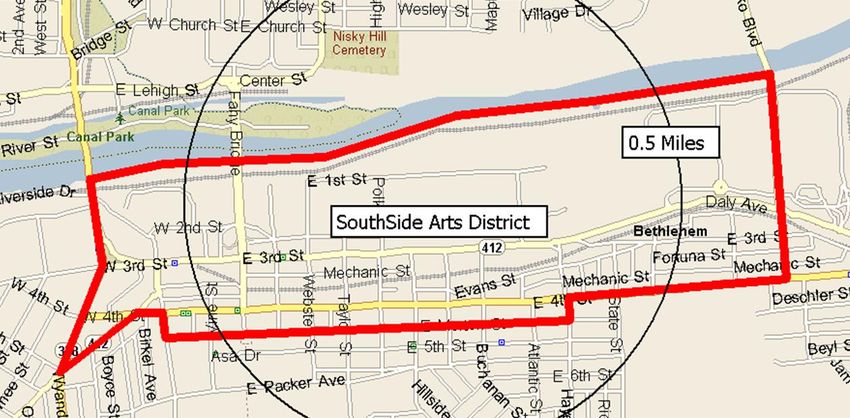
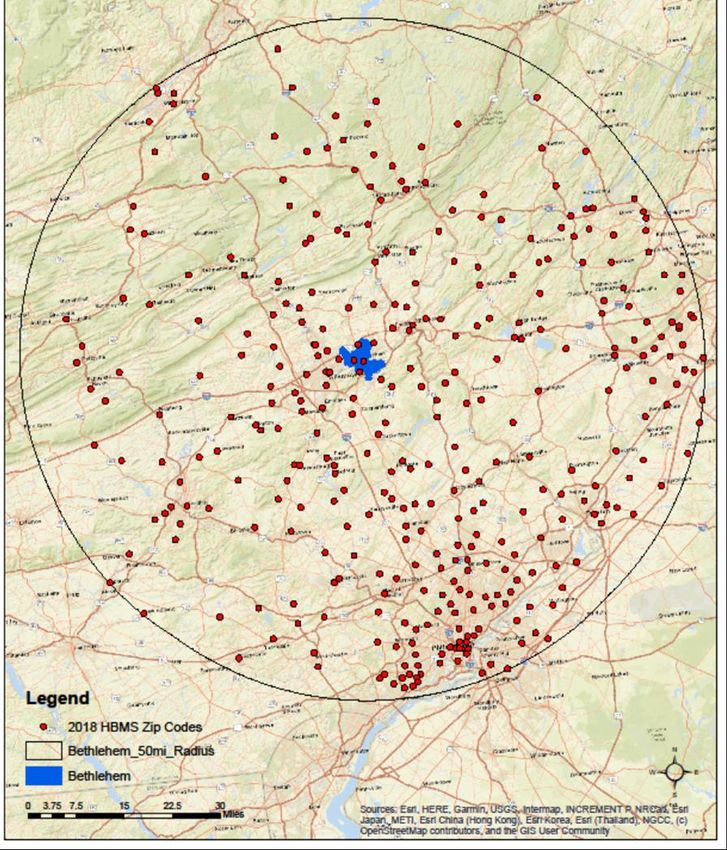
Figure 3: Map showing the boundaries of Bethlehem’s SouthSide Arts District.

RETAIL TRADE AREAS
Based on GPG’s analysis of the existing SouthSide Arts District’s commercial centers, population
clusters, employment, visitors, highway access and the retail gravitation in the market, this study
estimates that the SouthSide Arts District has two trade areas, a primary and a secondary. Using
data from ESRI and the U.S. Census Bureau, GPG obtained the most recent population and
demographic characteristics (2019), and those projected for 2024 for the defined trade area, the
Allentown-Bethlehem-Easton MSA and the Commonwealth of Pennsylvania.

Primary Trade Area
The SouthSide Arts District’s primary trade area includes 104,000 year-round residents and covers
29 square miles of area. It is bordered on the north by Macada Road and Broder Street, on the
south by Seidersville Road and Walnut Street, on the east by 6th Street, 12th Street and Ringhoffer
Road, and on the west by Airport Road, North Irving Street and East Side Reservoir Park. By
2024, the primary trade area’s population is estimated to grow by 2,000 people, or 1.92 percent.
This growth rate is lower than that for the secondary trade area and MSA, but higher than the
growth rate for the Commonwealth of Pennsylvania generally. The number of households in the
primary trade area will increase from 41,000 to 41,400 and will include an average of 2.37 people
per household.

The SouthSide Arts District primary trade area’s median household income is $52,000 and is
expected to increase to $58,000 by 2024. Its average household income is $71,500, with over 33
percent of households earning over $75,000 per year – lower than the MSA and Pennsylvania.
Over 28 percent of primary trade area residents over the age of 25 have earned a bachelor’s degree
or higher, compared to 32.2 percent for Pennsylvania. Residents living in the primary trade area
have a median age younger than that of the state at 38.6.

Approximately 93.5 percent of the primary trade area’s homes are occupied year-round, and the
median home value is estimated to be $180,000. Of all the primary trade area’s households, 55.9
4                                                              Bethlehem SouthSide Arts District Retail Market Study
                                                                                         Gibbs Planning Group, Inc.
                                                                                                  27 December 2019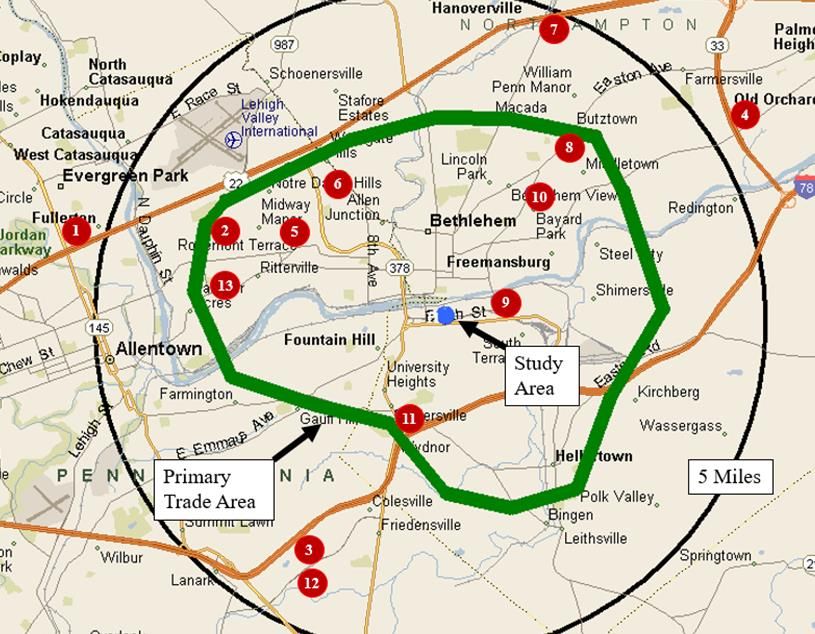
percent are owner-occupied, a number that has decreased 2.3 percent since 2010 and is expected to
decrease to 55.7 percent by 2024. Renter-occupied households have increased from 41.8 percent in
2010 to 44.1 percent in 2019 and are expected to increase to 44.3 percent by 2024. The primary
trade area’s current residential vacancy rate is 6.5 percent, a number that has increased 0.4 percent
since 2010 and is projected to continue to increase to 6.8 percent by 2024. The percentage of
housing units valued at over $250,000 is expected to increase from 22.1 percent to 27.2 percent –
coinciding with an increase in the median home value to $192,000 by 2024.

Figure 4: The SouthSide Arts District’s estimated primary trade area shown above in green and estimated 10 minute
drive time shown inside the blue line.

Secondary Trade Area
The SouthSide Arts District’s estimated secondary trade area is roughly 80 square miles and
includes 186,000 year-round residents and nearly 71,000 households. GPG estimates that
residents, workers and visitors in the area between the primary and secondary trade area will only
account for a minimal amount of SouthSide Arts District’s retail and restaurant commerce due to
Bethlehem SouthSide Arts District Retail Market Study                                                               5
Gibbs Planning Group, Inc.
27 December 2019
other more convenient commercial centers. However, SouthSide Arts District businesses that offer
unique, exceptional goods and services could potentially attract customers from this area on a
regular basis.

The secondary trade area demonstrates a higher household growth rate (0.39% percent annually)
than that for the primary trade area, MSA and Commonwealth of Pennsylvania. The number of
households is 70,800, increasing to 72,200 by 2024. The population is expected to grow by 0.42
percent annually to 190,000 by 2024. This rate is also higher than the annual growth rate for the
primary trade area, MSA and Commonwealth of Pennsylvania.

Figure 5: The SouthSide Arts District’s estimated secondary trade shown above in blue and primary trade area in
green. The SouthSide Arts District’s estimated 15 minute drive time is shown inside the pink line.

The median household income in the secondary trade area is $54,600 and the average household
income is $78,600, both of which are lower than the state’s figures. The Median household income
6                                                               Bethlehem SouthSide Arts District Retail Market Study
                                                                                          Gibbs Planning Group, Inc.
                                                                                                   27 December 2019
is expected to increase to $61,000 by 2024, while average household incomes will have grown by
2.6 percent to $89,000. Educational attainment of a bachelor’s degree or higher is at 36.5 percent
and 28 percent of households earn more than $75,000 annually. The secondary trade area’s median
age is 39.3 years, which is 2.2 years lower than the state’s 41.5 years.
Figure 6: SouthSide Arts District Demographic Comparisons
Allentown-
Primary Secondary Commonwealth
Demographic Characteristics Bethlehem-
Trade Area Trade Area of Pennsylvania
Easton MSA
2019 Population 104,000 186,000 856,000 13,000,000
2024 Population 106,000 190,000 872,000 13,160,000
2019-24 Projected Annual Growth Rate 0.25% 0.42% 0.38% 0.23%
2019 Households 41,000 70,800 327,000 5,142,400
2024 Households 41,400 72,200 333,000 4,048,000
2018-2024 Projected Annual HH Growth Rate 0.19% 0.39% 0.37% 0.22%
Persons Per Household 2019 2.37 2.49 2.55 2.45
Median Age 38.6 39.3 42.2 41.5
2019 Median Household Income $52,000 $54,600 $64,000 $59,000
2019 Average Household Income $71,500 $78,600 $88,000 $83,900
2024 Median Household Income $58,000 $61,000 $73,000 $67,000
2024 Average Household Income $81,600 $89,000 $101,000 $95,400
% Households w. incomes $75,000+ 33.3% 36.5% 43.7% 40.4%
% Bachelor’s Degree or higher 28.3% 28.4% 30.4% 32.2%
Figure 6: This side-by-side table compares the primary trade area demographic statistics with those of the secondary
trade area, MSA and Commonwealth of Pennsylvania.
LIFESTYLE TAPESTRY DEMOGRAPHICS
As a part of this analysis, GPG purchased third-party demographic research prepared by ESRI.
The ESRI data includes tapestry lifestyles, which creates 65 classifications, or lifestyle segments,
that help determine purchasing patterns. These segments are broken down to the U.S. Census
Block Group level and used by many national retailers to help determine future potential locations.
The most prevalent ESRI lifestyle groups in Bethlehem’s SouthSide Arts District are Parks and
Rec, Front Porches, Fresh Ambitions, Old and Newcomers and Midlife Constants.
Parks and Rec: The primary trade area’s most prominent lifestyle group is “Parks and Rec,”
which represent 17.9 percent of SouthSide Arts District primary trade area households. These
residents live in lower-density and well-established neighborhoods throughout the country. The
average household size is 2.51, and many are two-income married couples approaching retirement
age.
They tend to live in mostly older neighborhoods with homes built before 1970 and are primarily
homeowners with about 30 percent renters. The median home value for this group is $198,500.
Bethlehem SouthSide Arts District Retail Market Study 7
Gibbs Planning Group, Inc.
27 December 2019Parks and Rec residents place a high importance on practicality and are budget-conscious
consumers. The workforce among this group is diverse and includes professionals in health care,
retail trade, education and skilled workers in manufacturing and construction. Their median
household income ($60,000) is higher than the US median and their net worth is $125,500, which
is also higher than the US median of $93,300.
Figure 7: The relative proportions of the Tapestry Lifestyle groups found in the primary trade area.
Members of this group frequently visit local parks and engage in recreation activities. They tend to
pass time at home watching documentaries. For an outing, they choose to dine at family-style
restaurants and attend movies. In terms of purchasing patterns, these consumers are financially
shrewd and carefully research big-ticket purchases. Convenience is important in the kitchen; they
regularly use frozen or packaged main course meals. Parks and Rec residents also tend to stock up
on staples at warehouse clubs.
Front Porches: Front Porches are a blend of household types, with more young families with
children and single households than average. This group is composed of a blue-collar work force
with a strong labor force participation rate, but unemployment is slightly high at 7.1 percent.
8 Bethlehem SouthSide Arts District Retail Market Study
Gibbs Planning Group, Inc.
27 December 2019Most Front Porches residents live in older established neighborhoods. Many of their homes are duplex, triplex or quad and three-quarters of them were built before 1980. These residents have a $43,700 median household income and $24,800 net worth. With limited incomes they are not adventurous shoppers and price is more important than brand names or style. They go online for gaming, watching movies, employment searches and posting pics on social media. About 14 percent of Bethlehem’s SouthSide Arts District primary trade area households are defined as Front Porches. Fresh Ambitions: Nearly 10 percent of primary trade area households are classified as Fresh Ambitions. This group is composed of young families who focus life and work around their children. Nearly one in four Fresh Ambitions residents is foreign-born, supporting a large family on little income. They live on the edge of poverty and unemployment is high for these recent immigrants. The average household size for this group is large (3.17 people per household), and the proportion of multigenerational families living in one household is twice that of the US. They primarily live in row houses or 2 to 4 unit buildings, many of which were built before 1950. Fresh Ambitions residents earn a $26,700 median household income and their median net worth is $11,000. As shoppers, they are price-conscious and budget around their children and families. When their budget permits, they wire money back home. Half of these residents have owned or used a credit or debit card within the past year, and roughly a third maintain a savings account. Nearly half of these households subscribe to a cable service, and Spanish TV networks, BET and children’s shows are popular with them. Old and Newcomers: Representing 7.6 percent of existing trade area households, this group is predominantly composed of single households with a mix of married couples without children. Most Old and Newcomers residents are metropolitan city dwellers who are just beginning their careers or retiring. While 45 percent live in single-family dwellings, 45 percent also live in multiunit buildings in older neighborhoods. Thirty-one percent have a college degree, 33 percent have some college education and 9 percent are still enrolled in college. Old and Newcomers residents earn a $44,900 median household income and have a median net worth of $30,900. This group has an average labor force participation rate of 62.6 percent despite the increasing number of retired workers. In terms of purchasing behavior, they are price aware and coupon clippers, but open to impulse buys. They are also attentive to environmental concerns and recycle, volunteer for charities and help fundraise. Midlife Constants: This group accounts for 7.4 percent of primary trade area households. These residents are seniors, and about 42 percent of Midlife Constants residents are receiving Social Security. Their median household income ($53,200) is below average but their median net worth ($138,300) is above average. Sixty-three percent have a high school diploma or some college. Unemployment is lower in this market at 4.7 percent, but so is the labor force participation rate. As consumers, they are attentive to price but not at the expense of quality. Midlife Constants residents like to contribute to arts/cultural, educational, health and social service organizations and belong to clubs. Technology has its uses, but bells and whistles are a bother. Midlife Constants opt for convenience and comfort, not the cutting-edge. Bethlehem SouthSide Arts District Retail Market Study 9 Gibbs Planning Group, Inc. 27 December 2019
Figure 8: SouthSide Arts District Trade Area Tapestry Lifestyles
                                SouthSide Arts District
 Lifestyle Group                 Primary Trade Area                          Lifestyle Summary
                                      Statistics

                              Population                  These practical suburbanites have achieved the
                              14,300                      dream of home ownership. They have purchased
                                                          homes that are within their means. Their homes are
                              Households
                                                          older, and town homes and duplexes are not
                              7,000                       uncommon.
                              Median HH Income
                                                          Many of these families are two-income married
                              $60,000
                                                          couples approaching retirement age; they are
                              SouthSide Households        comfortable in their jobs and their homes, budget
 Parks and Rec                17.9 %                      wisely, but do not plan on retiring anytime soon or
                                                          moving. Neighborhoods are well established, as are
                              US Market Share             the amenities and programs that supported their now
                              2.0%                        independent children through school and college.

                              Population                  Front Porches blends household types, with more
                              11,200                      young families with children or single households
                                                          than average. This group is also more diverse than
                              Households
                                                          the US. More than half of householders are renters,
                              5,700                       and many of the homes are older town homes or
                                                          duplexes.
                              Median HH Income
                              $43,700
                                                          Friends and family are central to Front Porches
                              SouthSide Households        residents and help to influence household buying
 Front Porches                14.2 %                      decisions. Households tend to own just one vehicle
                                                          but used only when needed. Income and net worth of
                              US Market Share             these residents are well below the US average
                              1.6 %

                              Population                  These young families, many of whom are recent
                              8,200                       immigrants, focus their life and work around their
                                                          children. Fresh Ambitions residents are not highly
                              Households
                                                          educated, but many have overcome the language
                              3,900                       barrier and earned a high school diploma. They
                                                          work in a variety of occupations and spend what
                              Median HH Income
                                                          little they can save on their children.
                              $26,700
                              SouthSide Households        Multigenerational families and close ties to their
                              9.6 %                       culture support many families living in poverty;
 Fresh Ambitions                                          income is often supplemented with public assistance
                                                          and Social Security. Residents budget wisely not
                              US Market Share
                                                          only to make ends meet but also to save for a trip
                              0.6 %
                                                          back home.

10                                                              Bethlehem SouthSide Arts District Retail Market Study
                                                                                         Gibbs Planning Group, Inc.
                                                                                                  27 December 2019
SouthSide Arts District
Lifestyle Group Primary Trade Area Lifestyle Summary
Statistics
Population This market features singles’ lifestyles, on a budget.
5,400 The focus is more on convenience than
consumerism, economy over acquisition. Old and
Households
Newcomers is composed of neighborhoods in
3,000 transition, populated by renters who are just
beginning their careers or retiring. Some are still in
Median HH Income
college; some are taking adult education classes.
$44,900
They support charity causes and are environmentally
SouthSide Households conscious. Age is not always obvious from their
Old and Newcomers choices.
7.6 %
US Market Share
2.3 %
Population Midlife Constants residents are seniors, at or
5,800 approaching retirement, with below average labor
force participation and above average net worth.
Households
3,000 Although located in predominantly metropolitan
areas, they live outside the central cities, in smaller
Median HH Income
communities. Their lifestyle is more country than
$53,200
urban. They are generous, but not spendthrifts.
SouthSide Households
Midlife Constants 7.4 %
US Market Share
2.5 %
Figure 8: The top five Tapestry Lifestyle groups profiled above portray a mostly middle-class population of varying
ages.
EMPLOYMENT BASE
The employment picture found in the SouthSide Arts District primary trade area reflects a
concentrated services and retail trade sector foundation, comprising 78.5 percent of total
employment. As shown in Figure 9, the services sector employs the single largest percentage (67.4
percent) of people in the SouthSide Arts District’s primary trade area. This proportion of workers
engaged in the services sector is higher than that for the secondary trade, MSA and
Commonwealth of Pennsylvania. Within the primary trade area’s services sector, the largest
percentage (26.8 percent of total employment in the primary trade area) work in other services,
followed by 23.5 percent in health services and 10.4 percent in education institutions and libraries.
Bethlehem SouthSide Arts District Retail Market Study 11
Gibbs Planning Group, Inc.
27 December 2019As the second leading category of employment, retail workers account for 11.1 percent of
employment within the primary trade area. Within this category, eating & drinking places is the
leading subcategory of employment comprising 4.9 percent of total employment, followed by
miscellaneous retail (2.3 percent) and food stores (1.1 percent). However, the fact that retail is the
second largest employment sector in the primary trade area does not necessarily mean that there is
an oversupply of retail in the area; the size and scale of retailers may require a significant number
of workers, but this is not indicative of how well these retailers are supplying goods and services
to the surrounding community.
Figure 9: Employment Comparison by Sector (SIC)
Allentown-
Primary Trade Secondary Trade Commonwealth
Employment Sector Bethlehem-
Area Area of Pennsylvania
Easton MSA
Agriculture and Mining 0.5% 0.6% 1.0% 1.3%
Construction 2.3% 2.8% 3.7% 3.9%
Manufacturing 4.9% 5.9% 8.8% 9.0%
Transportation 1.4% 2.7% 2.9% 3.0%
Communication 0.5% 0.8% 0.8% 0.7%
Utility 0.3% 0.3% 0.4% 0.5%
Wholesale Trade 4.8% 5.7% 4.2% 4.1%
Retail Trade 11.1% 12.5% 18.6% 19.0%
Finance, Insurance & Real Estate 3.7% 5.0% 4.5% 6.1%
Services 67.4% 59.7% 50.0% 46.7%
Government 3.0% 3.7% 4.5% 5.2%
Unclassified 0.2% 0.2% 0.6% 0.5%
Figure 9: Services and retail trade comprise the bulk of primary trade area employment.
Daytime employment plays a large role in supporting retail. The primary trade area is estimated to
have 62,500 employees; an estimated 22,000 of them are office employees who are known to
expend at much higher rates, often eating out for lunch and shopping on the way to and from work.
The mix of employees throughout the ten-minute drive time varies from the primary trade area
most noticeably in the services industry sector, with an additional 3,000 employees within the 10-
minute drivetime compared to the primary trade area.
Services, retail trade, and manufacturing employ the most people by industry inside the ten-minute
drivetime with 45,000, 7,000 and 3,200 jobs, respectively. With over 66,000 workers within a ten-
minute drive time, there appear to be many captive daytime consumers close to the SouthSide Arts
District.
12 Bethlehem SouthSide Arts District Retail Market Study
Gibbs Planning Group, Inc.
27 December 2019Figure 10: Drive Time and Trade Area Employment by Industry Sector
5-Minute 10-Minute Primary
Employment Sector
Drive Time Drive Time Trade Area
Agriculture & Mining 70 260 320
Construction 400 1,500 1,500
Manufacturing 800 3,200 3,100
Transportation 300 800 900
Communication 70 500 300
Utility 50 100 100
Wholesale Trade 400 3,900 3,000
Retail Trade 2,600 7,000 7,000
Home Improvement 100 300 300
General Merchandise Stores 40 300 300
Food Stores 200 700 700
Auto Dealers, Gas Stations, Auto Aftermarket 80 600 600
Apparel & Accessory Stores 70 300 200
Furniture & Home Furnishings 50 200 200
Eating & Drinking Places 1,400 3,100 3,100
Miscellaneous Retail 500 1,400 1,400
Finance, Insurance & Real Estate 1,200 2,500 2,300
Banks, Savings, & Lending Institutions 200 400 400
Securities Brokers 200 300 300
Insurance Carriers & Agents 200 600 600
Real Estate, Holding, Other Investment Offices 500 1,000 1,000
Services 31,000 45,000 42,000
Hotels & Lodging 800 2,300 2,500
Automotive Services 100 500 500
Movie & Amusements 300 800 800
Health Services 11,000 17,000 15,000
Legal Services 300 400 400
Education Institutions & Libraries 5,000 6,000 6,000
Other Services 13,000 16,000 17,000
Government 1,500 2,000 1,900
Unclassified Establishments 30 80 100
Total Employment 38,420 66,840 62,520
Figure 10: The SouthSide Arts District primary trade area’s employment by sector.
Consumer expenditure from daytime employment complements that captured in the evenings and
on weekends by households in the trade area. “Office Worker Retail Spending in a Digital Age,”
published by the International Council of Shopping Centers in 2012, provides insight into the
impact of office worker employment. Weekly office worker expenditure, adjusted for 2019 dollars,
Bethlehem SouthSide Arts District Retail Market Study 13
Gibbs Planning Group, Inc.
27 December 2019is estimated at $180. Weekly non-office worker expenditure is estimated at 37 percent of office
workers.
Figure 11: Ten Minute Drive-Time Worker Expenditure
Non-Office
Weekly Annual Office Worker
Category Worker Total Expenditure
Expenditure Expenditure Expenditure
Expenditure
Prepared Food & Beverage
Limited & Full-Service
$40 $2,300 $56,340,000 $36,300,000 $92,640,000
Restaurants
Drinking Places $20 $800 $20,490,000 $13,200,000 $33,690,000
Retail Goods
General Merchandise, Apparel,
$70 $3,600 $89,630,000 $57,750,000 $147,380,000
Home Furnishings, Electronics
Grocery $30 $1,600 $38,410,000 $24,750,000 $63,160,000
Convenience Items $20 $1,000 $25,610,000 $16,500,000 $42,110,000
Total $180 $9,300 $230,480,000 $148,500,000 $378,980,000
Figure 11: Employees within ten minutes of the study area expend $379 million dollars annually.
Non-office workers are estimated to have slightly less disposable income, to have multiple work
locations including at home, and typically are on the road more during their work-week. Retail
purchases (general merchandise, apparel, home furnishings, electronics, grocery and convenience
items) make up most of the office worker dollars, at $120 per week. Restaurant expenditures (full
service, limited service and drinking places) account for the balance at $40 per week. Annualized,
each office worker expends $9,300 before, during and after work.
The annual impact of 66,800 workers within ten minutes of the SouthSide Arts District is $379.0
million. This expenditure breaks down to include $126.3 million in prepared food and beverage
establishments, $63.2 million in grocery purchases, $147.4 million in retail sales and $42.1 million
in convenience items.
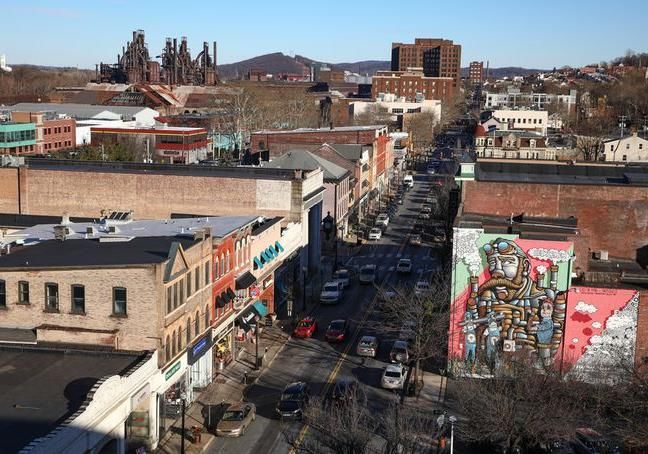
Figure 12: Birdseye view of the SouthSide Arts District.
SOUTHSIDE ARTS DISTRICT AREA CHARACTERISTICS
Location
The City of Bethlehem, of which the SouthSide Arts District is a part, is roughly 19 square miles.
14 Bethlehem SouthSide Arts District Retail Market Study
Gibbs Planning Group, Inc.
27 December 2019It is in eastern Pennsylvania, 50 miles northwest of Philadelphia and 90 miles west of New York
City. Bethlehem has a rich colonial and industrial heritage and historically served as the
headquarters of the Bethlehem Steel Corporation, once the country’s second-largest steel producer.
The SouthSide Arts District is located just south of the Lehigh River in southern Bethlehem. It
roughly stretches east to the Wind Creek Bethlehem Casino, west to Broadhead Avenue, north to
SteelStacks and south to the Zoellner Arts Center and Lehigh University. Most of the SouthSide
Arts District’s retail and restaurants are located on Third Street and Fourth Street, which are the
main east-west thoroughfares that run through the area. Additionally, the SouthSide Greenway is
in the middle of the SouthSide Arts District. This linear park follows the former Norfolk southern
rail, beginning just north of Lehigh University and stretching about 2 miles east to just outside
Saucon Park. The trail parallels State Route 412 (Daly Avenue) and has become popular with
bikers, walkers and runners. The SouthSide Arts District has an impressive Walk Score of 95 (out
of 100), which classifies it as a “walker’s paradise.”
Lastly, it should be noted that the SouthSide Arts District is in a food desert. According to the
United States Department of Agriculture, a food desert is an area where there is a substantial
number or share of residents with low levels of access to outlets selling healthy and affordable
food.
Figure 13: Traffic Counts
Road AADT (2018)
U.S. Route 22 83,000
I-78 51,000
PA 378 38,000
Schoenersville Road north of Catasauqua Road 29,000
Stefko Blvd between 3rd Street and Broad Street 20,000
8th Avenue 18,000
Union Boulevard 15,000
3rd Street 14,000
Linden Street 14,000
Center Street north of Elizabeth Avenue 13,000
Easton Avenue 10,000
Broad Street 9,300
4th Avenue 7,000
Figure 13: The traffic chart shows the heaviest traffic on U.S. 22 and I-78 (source: Pennsylvania Department of
Transportation).
Access
Regional linkage is strong in the primary trade area. The North Side Historic District and
SouthSide Arts District are connected by three bridges across the Lehigh River; Hill to Hill
Bridge, Fahy Bridge and Minsi Trail Bridge. Significant traffic enters the study area from the
north via U.S. 22 and Schoenersville Road, from the south via I-78 and Hellertown Road, and
from the east and west via PA 378, Union and Stefko Boulevards. Furthermore, there is a dense
Bethlehem SouthSide Arts District Retail Market Study 15
Gibbs Planning Group, Inc.
27 December 2019urban grid and network of streets and sidewalks surrounding the downtown Bethlehem study areas
that make them easily accessible.
General Retail Market Conditions
According to CoStar, Bethlehem has a total of 5.3 million sf of retail space. The city’s current
retail market rent/sf is $14.35/sf, a figure that has decreased by 1 percent from one year ago. Its
current retail vacancy rate is 6.5 percent, which has decreased by 1.1 percent over the last year and
is just slightly above its 10 year average vacancy rate of 6.5 percent. While no retail space was
delivered over the past year, currently 14,300 sf of retail space is under construction. The city’s
twelve-month retail real estate sales volume reached $22.9 million, and these properties sold at an
average cap rate of 9.2 percent (unchanged from the prior period) and for $121/sf (up 2.1 percent
from the prior period).
Zoellner Arts Center
Figure 14: A renown performing arts center, the Zoellner Arts Center features three theaters, a large art gallery, a
recording studio, music library, classrooms and meeting space.
Designed by Philadelphia architects Dagit Saylor, the Zoellner Arts Center opened in 1997. It has
been voted the best performing arts center in the Lehigh Valley and houses a 1,000-seat
auditorium (Baker Hall), a 300-seat theater (Diamond Theater) and a 125-seat black box theater.
Additionally, it features a two-story art gallery, recording studio, music library and various
classrooms. In the 2017-2018 season, the Zoellner Arts Center held 242 events, which included
over 350 artists from 10 countries, and more than 50 campus and community events, lectures,
business meetings, recitals, conventions and concerts. Its Guest Artist Series has presented a wide
array of multi-disciplinary performers including the New York Philharmonic, The Boston Pops,
Itzhak Perlman, Garrison Keillor, John Lithgow, Moscow Festival Ballet and Ani DiFranco. Also,
Lehigh University Campus events presented at the center have included lectures with Reverend
Jesse Jackson, Janet Reno, Salman Rushdie and Benazir Bhutto.
SteelStacks
Located adjacent to Wind Creek Bethlehem on the site of the now non-operational Bethlehem
Steel plant, the SteelStacks is the largest revitalized brownfield in the country. Throughout the
year, this 10-acre arts and cultural campus hosts hundreds of concerts, films, family programs,
dance programming, tours and community celebrations. At the heart of the campus is the
ArtsQuest Center which offers daily programing including art exhibits, independent and foreign
16 Bethlehem SouthSide Arts District Retail Market Study
Gibbs Planning Group, Inc.
27 December 2019and documentary films, live music, dance and comedy. The ArtsQuest Center also has several restaurants such as the Mike & Ike Bistro, Musikfest Café, Town Square Grill and the Mack Truck Stop. Together, the ArtsQuest Center and other venues at SteelStacks host numerous festivals throughout the year including Musikfest (the largest free music festival in the nation), RiverJazz, Christkindlmarket Bethlehem, the Greater Lehigh Valley Filmmaker Festival and the SouthSide Arts & Music Festival. Figure 15: Located at the former Bethlehem Steel plant, SteelStacks is a ten-acre arts and entertainment district that hosts festivals, concerts and community events. National Museum of Industrial History The National Museum of Industrial History, a Smithsonian affiliate, occupies the former Bethlehem Steel building’s electric repair shop. It houses a large collection of industrial machinery (on loan from the Smithsonian’s National Museum of American History), over 200 artifacts from the textile, steel, iron and propane gas industries and a plethora of archival material from Bethlehem Steel. Figure 16: Pictured above is the country’s longest commercially operated portable steam engine (on the left) and the Jacquard loom (on the right), both of which are displayed at the National Museum of Industrial History. The museum has four permanent exhibits: Machinery Hall, Iron and Steel, Silk Gallery Hall and Propane Gallery. Machinery Hall displays the then state-of-the-art technology that was on display in the original Machinery Hall at the 1876 World’s Fair in Philadelphia. This includes the country’s longest commercially operated portable steam engine (a mammoth Corliss steam engine), an overhead crane from Milwaukee’s Pawling & Harnischfeger Company and an original Bethlehem SouthSide Arts District Retail Market Study 17 Gibbs Planning Group, Inc. 27 December 2019
Bethlehem Steel H-beam. Iron and Steel celebrates the history of Bethlehem Steel and presents
insight into the daily lives of Bethlehem Steel’s workers. This exhibit includes miniature plant
models which were used to train employees, a commemorative anvil that was made from the first
steel rail rolled at the Bethlehem Iron Company and a “Rail Evolution” display which shows how
rail became stronger over the decades. Silk Gallery Hall tells the story of the Lehigh Valley silk
boom, which began in the 1880s. The exhibit walks visitors through an interactive process
showing how silk is made, and showcases the Jacquard loom, which was utilized to produce the
fabric for the White House for nearly 80 years. Lastly, the Propane Gallery focuses on Walter
Snelling, the chemist who discovered how to distill propane. This exhibit pays tribute to
Snelling’s accomplishments with a display of his laboratory equipment and photos and marketing
materials of the company he founded, American Gasol Company.

Historic Hotel Bethlehem
The historic Hotel Bethlehem, on Main Street in the North Side Historic District, traces its roots
back to the 18th century. The hotel is on the same site where, in 1741, the first house in Bethlehem
was built. In the early 19th century, as the city grew and traffic increased, the house was converted
to an inn (the Eagle Hotel). The Eagle Hotel operated in that incarnation until 1919 when the
building started housing convalescing soldiers returning from World War I. Then in the early
1920s, a group of Bethlehem businessmen led by Charles Schwab organized a project that led to
the construction of an $800,000, 200-room building they called Hotel Bethlehem. Schwab built
the hotel to cater to the clients of the Bethlehem Steel Company, and from the beginning Hotel
Bethlehem featured amenities equivalent to modern day luxuries, such as a fitness center, barber
shop, shoeshine and coffee shop. The hotel became the center of the city’s social life, and as
Bethlehem Steel rose to prominence as the nation’s second largest producer of steel the Hotel
Bethlehem prospered. Therefore, it should not be surprising that over the years the hotel has had a
slew of famous guests including Winston Churchill, John F. Kennedy, Muhamad Ali, Bill Clinton
and Bernadette Peters.

Figure 17: In 2019, the Hotel Bethlehem was named the third-best historic hotel in the United States by USA Today
readers.

Today, the Hotel Bethlehem is one of the downtown’s primary anchors. It has 125 restored guest
rooms and suites, which range from 200 sf “traditional rooms” to 850 sf suites. All rooms have
complimentary fiber optic Wi-Fi, 24-hour room service, and suites have multiple LCD TVs, living
rooms and French doors. The hotel has two restaurants (1741 on the Terrace and the Tap Room),

18                                                               Bethlehem SouthSide Arts District Retail Market Study
                                                                                          Gibbs Planning Group, Inc.
                                                                                                   27 December 2019
a full-service business center and an on-site fitness center. The historic Hotel Bethlehem is also a popular wedding and event venue, featuring 19,000 sf of meeting and banquet space including the Mural Ballroom (which seats up to 250 people) and the Grand Ballroom (which seats up to 140 people). Both ornate spaces have 1920s décor, and while the Grand Ballroom features stunning balconies and large arched mirrors, the Mural Ballroom is decorated with seven large murals painted by Gregory Gray in 1936 that retell the story of Bethlehem. Figure 18: Photos of Christkindlmark (pictured on left) and Weihnachtsmark (pictured on right). Christmas City Tourism Bethlehem is known as “The Christmas City” and the holiday is central to the city’s identity. In fact, it was on Christmas Eve in 1741 that the community was christened “Bethlehem.” Every year, from November 22nd to December 22nd, the North Side Historic District and South Arts District host Christmas markets filled with artisan craft and retail vendors. The largest and most popular of these is Christkindlmark. Christkindlmark in the South Arts District is a German-style holiday market that features 125 vendors. Not surprisingly, around the holidays the city is replete with decorations. In the 1960’s the Citizens Christmas City Committee was formed to help dignify the look of Christmas in the city and the Committee continues to raise over $15,000 every year to purchase over 800 trees. White lights decorate the trees on the city’s north side (including the North Side Historic District) while colored lights adorn trees on the south side. Also, around the holidays Hotel Bethlehem has a display of over 35,000 Christmas lights, a myriad of uniquely decorated Christmas trees, 36 wreaths, six 7-foot-tall toy soldiers, two life-sized nutcrackers and a gingerbread house modeled after the hotel. Wind Creek Bethlehem What is now Wind Creek Bethlehem originally opened as Sands Casino Resort Bethlehem in 2009. Today the Wind Creek Bethlehem resort features a casino, hotel, shopping, restaurants, a spa and family entertainment. More specifically, the 180,000 sf casino floor has over 3,000 slot machines and 200 table games. The resort’s hotel is a 282-room AAA Four Diamond Hotel with over 12,000 sf of meeting space and a wide range of eateries that include three signature restaurants from celebrity chef Emeril Lagasse – Emeril’s Chop House, Burgers and More by Emeril and Emeril’s Fish House. Wind Creek Bethlehem also includes the Steel Magnolia Spa & Bethlehem SouthSide Arts District Retail Market Study 19 Gibbs Planning Group, Inc. 27 December 2019
Salon and a family entertainment and childcare facility (Kids Quest and Cyber Quest).

Additionally, an indoor shopping center (The Outlets at Wind Creek Bethlehem) connects the
casino and hotel. Opened in 2011, The Outlets at Wind Creek Bethlehem features 130,000 sf of
retail space and includes retailers such as Coach, DKNY, GUESS Factory Store, Kay Jewelers
Outlet, Michael Kors, Tommy Hilfiger and Van Heusen. This shopping center, as well as the
larger Wind Creek Bethlehem resort, is owned by Wind Creek Hospitality.

Figure 19: In May 2019 Wind Creek Hospitality purchased Wind Creek Bethlehem for $1.4 billion.

The owners have announced plans to expand the resort and in 2020 Wind Creek Bethlehem will
begin construction on two new projects. The first will be a $90 million hotel with 276 guest rooms
and 42,000 sf of meeting space, and the second will be a 300,000 sf adventure and water park.

Lehigh University

Figure 20: Lehigh University’s picturesque campus (pictured on the left) spans 2,300 acres. Farrington Square
(pictured on the right) is a recent addition to the northern section of campus and includes housing, local shops and fast
casual eateries.

Located on the southern edge of the Southside Arts District, Lehigh University is home to 7,000
undergraduate and graduate students. Its scenic campus is on the wooded slope of South Mountain
and spans 2,300 acres. Lehigh University has four colleges (the P.C. Rossin College of
Enginerring and Applied Science, the College of Arts and Sciences, the College of Business and
Economics and the College of Education) and offers over 100 degree programs. In its most recent
edition of school rankings, U.S. News & World Report ranked Lehigh as the tied for 50th among
national universities, 26th for “Best Value Schools” and 30th for “Best Undergraduate Teaching.”

20                                                                  Bethlehem SouthSide Arts District Retail Market Study
                                                                                             Gibbs Planning Group, Inc.
                                                                                                      27 December 2019
Recently, the university opened Farrington Square, a project to help facilitate downtown revitalization and blur the boundary between campus and City of Bethlehem. Farrington Square is home to the Bethlehem Farmer’s Market, the university bookstore, the university postal office, an ice cream shop and a café. DeSales University This private Catholic university of 3,500 students is situated 4.5 miles south of the Southside Arts District. DeSales University was established in 1964 and today offers 40 bachelor’s degrees, seven graduate degrees and two doctoral programs. The 2020 edition of Best Colleges from US News & World Report ranked DeSales University as 59th in “Regional Universities North,” 36th in “Best Value Schools,” and 33rd in “Best Colleges for Veterans.” Priding itself on its small class size, DeSales University has a student/faculty ratio of 15:1 and an average class of just 18 students. Northampton Community College Northampton Community College (NCC) is a community college with campuses in Bethlehem Township and Tannersville, Pennsylvania. It was founded in 1967 and serves more than 34,000 students in over 100 fields. NCC’s main Bethlehem campus encompasses 208 acres and is located 5 miles northeast of the North Side Historic District. Additionally, NCC’s Fowler Center is situated in the former Bethlehem Steel Corporation headquarters in the Southside Arts District. The Fowler Center is an educational facility that is home to several of the school’s programs, including its hospitality, dental hygiene, leadership and executive development institutes. Moravian College Figure 21: Moravian College’s Priscilla Payne Hurd Campus occupies a portion of the North Side Historic District in downtown Bethlehem, including several historic buildings such as the Brethren’s House (right), built in 1748. Founded in 1742, this small liberal arts college of 1,700 full-time students is the sixth-oldest college in the country and the first to educate women. Moravian College offers degrees in more than 50 areas of study, and the school has over 80 clubs and organizations. The Princeton Review has ranked Moravian College among the top 13 percent of four-year colleges, and the Bloomberg Business Week has ranked the school among the top 25 percent of four-year colleges. Moravian College’s south campus (Priscilla Payne Hurd Campus) is in Bethlehem’s North Side Historic District. Bethlehem SouthSide Arts District Retail Market Study 21 Gibbs Planning Group, Inc. 27 December 2019
Figure 22: The above maps display sample data that GPG received for one store in in the North Side Historic District.
Each data point represents a customer that visited the store within the last month. This data illustrates that the North
Side Historic District is visited by shoppers from across the Bethlehem-Philadelphia area and country generally.

22                                                                 Bethlehem SouthSide Arts District Retail Market Study
                                                                                            Gibbs Planning Group, Inc.
                                                                                                     27 December 2019
AREA SHOPPING CENTERS
Figure 23: Bethlehem Area Shopping Centers
Distance to
Retail
Retail Center Name Shopping Center Type SouthSide Arts
Size (sf)
District
1. Lehigh Valley Mall Lifestyle Center 1.2 million sf 5.5 miles
2. Airport Shopping Center Power Center 510,000 sf 3 miles
3. The Promenade Shops Lifestyle Center 480,000 sf 3.5 miles
4. Southmont Plaza Power Center 390,000 sf 5.5 miles
5. Lehigh Shopping Center Community Center 370,000 sf 2 miles
6. Westgate Mall Community Center 300,000 sf 2.5 miles
7. Bethlehem Square Power Center 300,000 sf 4.5 miles
8. Easton Commons Community Center 170,000 sf 3 miles
9. Outlets at Wind Creek Outlet Mall 130,000 sf < 1 mile
10. Stefko Blvd. Shopping Center Neighborhood Center 130,000 sf 2.5 miles
11. Saucon Valley Square Neighborhood Center 80,000 sf 1.5 miles
12. Shoppes at Old Saucon Lifestyle Center 80,000 sf 4 miles
13. Allentown Commons Neighborhood Center 70,000 sf 3 miles
Figure 23: Map and table of the competing lifestyle, power, community, outlet and neighborhood shopping centers.
Bethlehem SouthSide Arts District Retail Market Study 23
Gibbs Planning Group, Inc.
27 December 20191. Lehigh Valley Mall
Figure 24: In terms of square footage, the Lehigh Valley Mall is the largest shopping center in Pennsylvania’s Lehigh
Valley region.
Lehigh Valley Mall is in the City of Whitehall, 5.5 miles northwest of the SouthSide Arts District.
Totaling 1.2 million sf of retail space, it consists of a super-regional, two-level enclosed shopping
center combined with an outdoor lifestyle center. The original enclosed mall was opened in 1976,
underwent major renovations in 1995, and expanded with the 110,000 sf lifestyle center in 2007.
Today the Lehigh Valley Mall is anchored by Macy’s, JC Penney, Barnes & Noble and Boscov’s
and has nearly 150 other retailers that include Apple, Chico’s, Express, lululemon, Pottery Barn,
Sephora, Williams Sonoma and Vera Bradley. Additionally, it features various dining options
including Bonefish Grill, Bravo! Cucina Italiana and Pocono Brewing Co. The Lehigh Valley Mall
is owned by Simon Property Group.
2. Airport Shopping Center
Figure 25: Sam’s Club (at 155,000 sf) and Target (at 130,000 sf) are the largest anchor tenants at the Airport Shopping
Center
Located in the City of Allentown, at the corner of Route 22 and Airport Road, Airport Shopping
Center is a 510,000 sf power center. It is anchored by Sam’s Club, Target, Ross Dress for Less,
Ulta and DSW and has a total of 34 stores. Currently, it is 99 percent occupied. Airport Shopping
Center opened in 2009 and is currently owned by Goodman Properties. It is approximately 3
miles northwest of the SouthSide Arts District.
24 Bethlehem SouthSide Arts District Retail Market Study
Gibbs Planning Group, Inc.
27 December 20193. The Promenade Shops at Saucon Valley The Promenade Shops at Saucon Valley is a 480,000 sf outdoor lifestyle center located in southern Allentown, approximately 3.5 miles southwest of the SouthSide Arts District. Some of the major retailers that can be found here are American Eagle Outfitters, Banana Republic, Barnes & Noble, Brooks Brothers and the first L.L. Bean in the Commonwealth of Pennsylvania. This shopping center also features upscale restaurants that include Top Cut, Melt, Torre, Kome Fine Japanese Cuisine and White Orchids Thai Cuisine, and more casual restaurants like Red Robin and Bar Louie. Additionally, The Promenade Shops has a Fresh Market and 16-screen AMC Theatre. The landscaped “Main Street” at the Shops provides outdoor gathering areas and event space and includes an interactive pop-jet fountain. This shopping center allows dogs in the common outdoor areas as well as inside participating stores. Lastly, the Promenade Shops is owned by Poag Shopping Centers (who was also its developer). Figure 26: Last fall The Promenade Shops at Saucon Valley welcomed new tenants Bath & Body Works (pictured on left) and Playa Bowls (pictured on right). 4. Southmont Plaza Southmont Plaza is a 390,000 sf power center located at the intersection of Freemansburg Avenue and Route 33, which is 5.5 miles northeast of the SouthSide Arts District. This shopping center has a number of outparcels and includes tenants such as Lowe’s, Michaels, Dick’s Sporting Goods, Best Buy, Bed Bath & Beyond and Barnes & Noble. Currently, it enjoys a 98 percent occupancy rate. Southmont Plaza is a joint venture between SITE Centers and Blackstone Real Estate Partners VII. 5. Lehigh Shopping Center Owned by Brixmor Property Group, the Lehigh Shopping Center is a 375,000 sf community center. It is located at the intersection of Pennsylvania Avenue and Union Road (just south of U.S. Route 22), roughly 2 miles northwest of the SouthSide Arts District. It is anchored by a 60,000 sf Giant Food supermarket, and its other retailers and restaurants include Marshalls, Big Lots, PetSmart, Staples, Citi Trends and Border Line Family Restaurant. Additionally, this shopping center is home to an 85,000 sf Aetna corporate office. The Lehigh Shopping Center opened in 1955, expanded over time and was last renovated in 2003. Bethlehem SouthSide Arts District Retail Market Study 25 Gibbs Planning Group, Inc. 27 December 2019
6. Westgate Mall
Located in northwest Bethlehem, 2.5 miles northwest of the SouthSide Arts District, Westgate
Mall is a 300,000 sf community center. It began as an outdoor strip mall in 1965 and expanded
into an enclosed mall in 1973, giving Westgate its current configuration as a combined open strip
and enclosed shopping center. Westgate Mall is anchored by Weiss Markets and has 20 other
shops including Rite Aid, Kay Jewelers, GNC and Subway. In August 2015, Westgate Mall
underwent a $5 million dollar renovation to update its façade and add a Sky Zone Trampoline
Park. The Westgate Mall was acquired by a joint venture between Onyx Equities and PCCP, LLC,
in 2018. Recently, CBRE (the mall’s leasing agent) announced plans to re-brand the mall, which
is currently 77 percent occupied.

Figure 27: Built in 1973, the Westgate Mall underwent a $5 million renovation in 2015, the same year Sky Zone
Trampoline Park opened a 20,000 sf facility in the shopping center.

7. Bethlehem Square

Developed by Rosenshein Associates, Bethlehem Square is a 390,000 sf power center. It opened in
1987 and was renovated in 1994. It is anchored by Walmart, Home Depot, T.J. Maxx, Home
Goods and Giant Food Stores and has about 20 additional tenants. The Walmart opened in 2002
and replaced a Bradlees department store. In February 2019, Brixmor Property Group sold this
shopping center to The Klein Group. Bethlehem Square is located 4.5 miles north of the
SouthSide Arts District.

8. Easton Commons

Built in 1982, Easton Commons is located on Easton Avenue in the Middletown residential
neighborhood of Bethlehem. This 170,000 sf community center is anchored by a Giant Food
supermarket, Petco and Maxx Fitness Clubzz, and its other tenants include Vic’s Bagels, T&M
Nails, Sport Clips and Family Dollar. Easton Commons is currently 95 percent occupied. It is
owned by Urban Edge Properties and is situated 3 miles northeast of the SouthSide Arts District.

9. Outlets at Wind Creek
Formerly The Shoppes at Sands Bethlehem, The Outlets at Wind Creek is an indoor shopping mall
located inside the Wind Creek Bethlehem resort. It connects the resort’s casino and the hotel and
has 130,000 sf of retail space. There are 27 retailers at this outlet center, which include businesses
that offer clothing, electronics, household goods, jewelry and specialty items. Additionally, The
Outlets at Wind Creek features a European spa and salon, Kids Quest/Cyber Quest (a childcare

26                                                              Bethlehem SouthSide Arts District Retail Market Study
                                                                                         Gibbs Planning Group, Inc.
                                                                                                  27 December 2019
You can also read