SAN JOAQUIN COUNTY - REDISTRICTING MANUAL June 18, 2021
←
→
Page content transcription
If your browser does not render page correctly, please read the page content below
SAN JOAQUIN COUNTY

REDISTRICTING MANUAL

                       June 18, 2021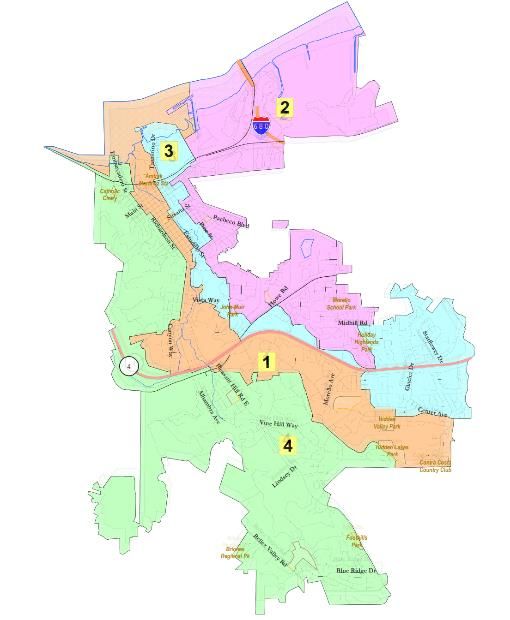
Contents
What is Redistricting? ................................................................................................................................... 2
  Public Opinions on Local Redistricting ...................................................................................................... 2
Federal Voting Rights Act .............................................................................................................................. 3
  Section 2 .................................................................................................................................................... 3
  Section 5 .................................................................................................................................................... 5
The Traditional Criteria ................................................................................................................................. 6
  Equal Population ....................................................................................................................................... 6
  Compactness ............................................................................................................................................. 8
  Contiguity .................................................................................................................................................. 9
When is a Redistricting Plan a Gerrymander? ............................................................................................ 11
  Tools of Gerrymandering ........................................................................................................................ 11
  Types of Gerrymanders ........................................................................................................................... 12
Community Engagement ............................................................................................................................ 14
  Communities of Interest (COI) ................................................................................................................ 14
  Phase 1 – Community of Interest (COI) Testimony ................................................................................. 16
  Phase 2 – Plan Development and Feedback ........................................................................................... 16
Census Data................................................................................................................................................. 17
  Public Law 94-171 File ............................................................................................................................. 17
  American Community Survey (ACS) ........................................................................................................ 17
  Census Geographies ................................................................................................................................ 19
Redistricting Software ................................................................................................................................. 20
  Desktop Programs ................................................................................................................................... 20
  Online Programs...................................................................................................................................... 20
Advanced District Analysis .......................................................................................................................... 22
  Measuring Racial Polarization ................................................................................................................. 22
  Measuring a Gerrymander ...................................................................................................................... 23
California-Specific Laws............................................................................................................................... 25
  Statewide Redistricting Reform .............................................................................................................. 25
  California Voting Rights Act .................................................................................................................... 25
  California FAIR MAPS Act ........................................................................................................................ 26
  Redistricting in Other CA Jurisdictions .................................................................................................... 26
Additional Redistricting Topics ................................................................................................................... 27
  Accelerations and Deferrals .................................................................................................................... 27
  Prisoner Reallocation .............................................................................................................................. 27
  Differential Privacy .................................................................................................................................. 28
Redistricting Glossary.................................................................................................................................. 29

Version 1 |6.18.2021                                                                                                                             1|Page

What is Redistricting?
At its most basic level, redistricting is the adjustment of election boundaries to create fairer
representation, equalize voting strength, and create equitable distribution of political power. The task is
conducted for any state, county, city, or other local government with districted elections. In the United
States, this commonly occurs once a decade, after the release of new population numbers from the U.S.
Census.

Redistricting is not just a quantitative exercise that can be solved by a computer, mathematical
computation, or algorithm, although these are tools can be helpful in presenting options or creating or
evaluating redistricting plans.

Within redistricting, there are laws, best practices and norms that drive the process. These are
continually changing, with the last decade seeing some of the most dramatic retooling of our processes
with a series of legal rulings, new state and local laws, and a shift in public attitudes.

The effect has been to put more power in the hands of the public – either through specific laws
mandating more community engagement, the increased availability of mapping tools that a lay-person
can utilize, a media that has become more adept at covering these issues, and the strong public belief
that redistricting is not a task to be left to backrooms and political deal-making.

This manual goes through many of the elements of the redistricting process, with a focus on local
redistricting. As the law and practice of redistricting change, some of the descriptions and definitions of
terms may need updating.

Public Opinions on Local Redistricting
Over the past two decades the public has been increasingly pushing for redistricting reform and
transparency. California’s voters passed Propositions 11 and 20 in order to shift redistricting away from
the Legislature to an independent bipartisan commission. This viewpoint that redistricting should no
longer be controlled by politicians has only increased since the passage of these statewide ballot
measures. In a recent poll conducted for Open California, 97% of California voters agree with the
statement “local government should be required to have transparent, open redistricting.”

Looking more closely, 96% of the public supports the new state requirement that all proposed
redistricting maps for local governments be made publicly available before being voted on, 91% believe
local governments should have five or more hearings, 90% believe lines should not be drawn for
incumbent protection, and 97% believe lines should not be drawn to favor political parties.

Version 1 |6.18.2021                                                                             2|Page
Federal Voting Rights Act
One key criterion that must be followed in all redistricting is the Federal Voting Rights Act of 1965.

The Act was passed on the heels of the Civil Rights Act of 1964 and sought to remedy racial
disenfranchisement in southern states – specifically Jim Crow laws such as literacy tests, poll taxes, and
other restrictions that were unconstitutional, but hard for the Department of Justice to block without
specific legislation.

The primary impacts on redistricting are found in Section 2, which requires majority-minority districts as
a remedy for vote dilution when a state, county, city, or other agency has racially polarized voting and
the sufficient concentration of that protected class to create a district where the minority population
can effectively use their voting power to elect a candidate of choice, and Section 5, which requires
covered states and local governments to receive pre-clearance on redistricting plans.1

Section 2
In 1982, Congress responded to a Supreme Court case2 which held that Section 2 prohibited only
“purposeful” discrimination by passing a ban on any voting practice that had a discriminatory effect,
irrespective of whether the practice was enacted or operated for a discriminatory purpose. This
amendment defined a method for determining violations of Section 2 utilizing the following factors:

    •   A history of official voting-related discrimination in the state or political subdivision;
    •   The extent to which voting in the elections of the state or political subdivision is racially
        polarized;
    •   The extent to which the state or political subdivision has used voting practices or procedures
        that tend to enhance the opportunity for discrimination against the minority group, such as
        unusually large election districts, majority-vote requirements, or prohibitions against bullet
        voting;
    •   The exclusion of members of the minority group from candidate slating processes;
    •   The extent to which minority group members bear the effects of discrimination in areas such as
        education, employment, and health, which hinder their ability to participate effectively in the
        political process;
    •   The use of overt or subtle racial appeals in political campaigns; and,
    •   The extent to which members of the minority group have been elected to public office in the
        jurisdiction.
Shortly after these amendments, a 1986 Supreme Court decision3 further shaped how the VRA interacts
with redistricting by establishing rules for when race and ethnicity can take a greater role in the process
of drawing districts.

1
  Preclearance was invalidated recently in Shelby v. Holder (2013)
2
  Mobile v. Bolden (1980)
3
  Thornburg v. Gingles (1986)

Version 1 |6.18.2021                                                                                 3|Page
The eponymous “Gingles factors” are three preconditions that a minority group must meet to establish
a violation of Section 2 of the Voting Rights Act. These preconditions are the following:
1) A minority group must be sufficiently large and geographically compact to comprise a
majority of the district;
2) The minority group must be politically cohesive (it must demonstrate a pattern of voting for
the same candidates, also known as “bloc voting”); and,
3) A majority of voters vote sufficiently as a bloc usually to defeat the minority group’s preferred
candidate.
This set of factors helps an agency that is undergoing redistricting know when Section 2 is operative
regarding a protected class in their community, but there are significant additional factors that may be
considered.
These factors could also be extended beyond race and applied to other protected classes, such as
religious affiliation, gender and sexual orientation, and national origin in cases where that population is
geographically defined and can be protected through the redistricting process.
Agencies under Section 2 requirements must still draw majority minority districts that are compact and
contiguous, and they must be drawn in a way that is improving their ability to affect the outcome of an
election. If a majority minority district is drawn at just 50%, that may not be deemed an effective
minority district based on registration and voting patterns of the effected minority group.
Agencies may be required to look at options to increase the percentage of the minority population or
even look at the election cycle in which that district would be coming up for election in order to place
the election for that majority minority district within an election cycle in which that minority group
shows historic higher turnout.
One outstanding question in the implementation of Section 2 is if it requires coalition majority minority
districts, which can exist when two separate protected classes act as one politically cohesive, bloc vote
and are subject to bloc voting against their interests. Courts have split on this question, although the
majority of decisions have come down on the side of preferring coalition districts when they can be
drawn, but not as a replacement for traditional majority minority districts.
Crossover districts in which the minority population can be drawn in a district with a similarly-minded
majority group can have the impact of allowing that minority community to more effectively elect a
candidate of choice, but this is not a requirement of Section 2 of the Voting Rights Act.
Version 1 |6.18.2021 4|PageSection 5
IMPORTANT VRA
The Voting Rights Act covers several elements of election protections for
minority communities, but the most powerful tool in its arsenal is the
RULINGS FOR
preclearance requirements under Section 5. These requirements, imposed on REDISTRICTING
jurisdictions based on past minority voting patterns, require the state or local
jurisdiction to delay implementation of any election law, such as a redistricting, There are dozens of
but also polling locations, ballot design, voter purges, voter ID and other laws, important VRA
until cleared by the Federal Department of Justice. decisions. These are
There were five counties in California that operated under Section 5 during the some of the most
2011 redistricting: Kings, Kern, Monterey, Merced and Yuba. Following the last critical:
decennial redistricting, Merced earned a bailout from the Department of Thornburg v. Gingles
Justice in 2013 allowing them to be taken off the Section 5 list. Created the Majority-
During the statewide redistricting in 2011, Section 5 served to freeze much of Minority standard under
the existing legislative and congressional districts in place. A primary goal of the Section 2.
Citizens Redistricting Commission was to not cause retrogression in the Baker v. Carr
minority populations of any district that touched these Section 5 counites. This Finding: Federal courts
resulted in fewer Latino seats in one area, in order to maintain the share of have the jurisdiction to
Latino population in districts that overlapped Section 5 counties. cover state legislative
redistricting plans.
A 2013 Supreme Court ruling4 invalidated the VRA’s Section 4, which included
the provisions that created the coverage formulas for what states and counties Reynolds v. Sims
would be required to comply with preclearance requirements in Section 5. Finding: Decennial
These coverage formulas were designed more than 50 years ago and are largely redistricting is required
based on voting patterns in the 1968, 1970 and 1972 elections – a fact that the for legislative districts
court found resulted in a policy that did not have any relationship to modern- and new boundaries
day voting rights concerns. should achieve
population equality.
While Section 5 is now inoperative, there are legislative actions being taken to
reestablish the coverage formula provisions of Section 4 and revive the full Gaffney v. Cummings
force of the act, potentially in time for the 2021 redistricting. Established the 10%
deviation standard.
Legislative action to restore Section 5 is not without precedent. There has been
a history of legal challenges to this section of the VRA and a number of course- Karcher v. Daggett
corrections by the U.S. Congress to explicitly expand the law and reestablish the Congressional districts
powers within that section. In 2006, Congress passed changes to respond to must be equal in
one legal decision5 that interpreted Section 5 as only prohibiting retrogressive population – functionally
discriminatory purposes, rather than any discriminatory purpose, and another no more than a 1-person
legal ruling6 that found this section of the act only applied to redistricting deviation.
outcomes where there was an inability for a minority group to elect their
Wesberry v Sanders
preferred candidate.
Congressional districts
must be approximately
4
Shelby v. Holder (2013)
equal in population.
5
Reno v. Bossier Parish School Board (2000)
6
Georgia v. Ashcroft (2003)
Version 1 |6.18.2021 5|PageThe Traditional Criteria
No matter where redistricting is being done, there are a set of traditional criteria that are used. Each has
its own legal basis, and states or agencies may use different definitions for achieving or measuring each,
but they are key universal elements of the process in both state and local redistricting.
Equal Population
Districts are redrawn primarily to equalize population. There are two subparts to this idea of equality:
representation and voting power.
Equal Representation – In practical terms, this speaks to how effective any resident can be at
advocating for themselves or being represented within a jurisdiction.
Imagine a town with 150,000 residents, and just two districts. If one district has 10,000 residents
and the other has 140,000, a complaint by the person in the smaller district would represent
1/10,000 of that representative’s constituents. In the larger district, the same complaint would
be only 1/140,000 of the representative’s constituents. In the second district, it would take 14-
times the residents to have the same voice as just one resident in the smaller district.
Equal Voting Power – This is the “one-person-one-vote” principle, and effectively measures the
equal ability to elect a candidate. In the fictional town above, there might be 100,000 voters. If
there are 8,000 in one district and 92,000 in the other, then the voting power of the resident in
the smaller district would be 11.5-times greater than that of a voter in the larger district.
These criteria can sometimes be in conflict because districts with equal populations do not always have
equal numbers of voters, or equal turnout of their registered population. One district may have more
residents under 18 or more non-citizens, thereby creating an imbalance in the eligible voting age
populations.
This can be exacerbated when districts have differing rates of young people, renters, or other
socioeconomic groups with lower registration or voting performance. There are many examples of
districts that are equally sized, yet have massive differences in the number of voters. In California, all
congressional districts are drawn nearly perfectly equal, however in the 2020 General Election, the 4th
Congressional District had turnout of 455,000 voters, while the 21st Congressional District had only
175,000.
There has been movement to try to use voter registration, eligible voters, or other datasets for
determining population because of this friction between the two concepts, but the latest Supreme Court
decision on this issue7 reinforced the use of total population from the decennial census. However, it did
not absolutely close the door to the use of other datasets, making this something that will likely
continue to be litigated.
Due to the delay in the 2020 Census release, there is some discussion on using the 2015-2019 American
Community Survey’s projected population to begin drawing district lines, with the 2020 Census data to
balance the final district lines submitted to County Registrars. This, however, is unlikely to be allowed for
7
Evenwel v. Abbott, 136 S. Ct. 1120 (2016)
Version 1 |6.18.2021 6|Pagecities and counties doing redistricting under the Fair Maps Act as the law requires use of a final dataset
provided by the state, after reallocation of the state prison population.
Even after agreeing on what dataset to use, and who to count, quantifying the equality of population is
another element which can be done with different methodologies based on state law and best practices.
The deviation of a district is a measure of how equally sized it is to the ideal population of perfectly
divided election districts. If a jurisdiction has 100,000 residents, the ideal population of each district is
20,000. If District A, in the example below, is at a population of 21,000, that district would have an
absolute deviation of 1,000, and a percentage deviation of 1,000/20,000 or +5%.
District Population Deviation Percentage
Deviation
A 21,000 1,000 5%
B 20,200 200 1%
C 19,800 -200 -1%
D 19,250 -750 -4%
E 19,750 -250 -1%
Individual district deviations must be calculated to determine the total plan deviation, which can be
done in one of three ways:
• Overall Range: The sum of all the deviations. In the five-district plan above the percentage
deviations are 5%/1%/-1%/-4%/-1%, the sum of the absolute values of all those percentage
deviations is 5+1+1+4+1=12, which would be the overall range.
• Mean Deviation: The Overall Range, divided by the number of districts. In the scenario above
where there are five seats and an overall range of 12, the mean deviation would be 12/5 or
2.4%.
• Deviation Range: The sum of the absolute values of the largest and smallest district. In the
scenario above the smallest district is -4%, the largest is +5%, so the range is |-4%| + |5%| for a
deviation range of 9%.
In California, we utilize the deviation range to quantify the equal population of a districting plan.
The acceptable total plan deviation range can vary based on federal case law, state laws, local
regulation, or a decision by a board or commission conducting the redistricting. The most common
standards are:
• One Person – congressional plans are generally drawn to a one-person standard. This can
appear to be an arbitrary standard as line-drawers hunt-and-peck around a redistricting plan to
reach that nearly perfect calculation in each district.
• 10% - a relatively wide deviation standard set for local and state government redistricting. This is
the default if there is no narrower state or local requirement.
Version 1 |6.18.2021 7|Page• Other ranges from 2.5% to 1% are commonly used as acceptable ranges in a redistricting plan,
pointing to precedents set by judicial redistricting or utilizing statutes, ordinances, or a decision
by the entity conducting the redistricting.
One fallacy in redistricting is that a narrower deviation is always better. This is an easy trap to get caught
in because a single numeric value is something that can be easily understood by the public. However, a
decision to have a specific deviation requirement before drawing lines could inadvertently harm other
parts of a plan by prioritizing an arbitrary numeric goal ahead of other more important criteria.
As an example, imagine a plan that has a 1.05% deviation, and in order to move under 1% you had to
split a neighborhood – clearly, the utility in keeping voters in that block with their neighbors would be
higher than the utility of an agency being able to say their plan was under 1% deviation.
Like many criteria, total plan deviation is one which should be considered among a family of other
sometimes competing criteria.
Compactness
Compactness is the principle that a district should be drawn in a way that minimizes the distortions of a
district, making it more circular or square, with fewer strange shapes, protrusions, indentations or other
oddities.
One of the most popular mathematical calculations of
compactness is Polsby-Popper, which is a measurement of the
ratio of the length of the perimeter of the shape of the district,
compared to a perfect circle of the same size.
There are dozens of different metrics for compactness. It is a bit
of a niche piece of redistricting academia. However, one failing
of compactness scores is that they are not absolute – they are
relative to other options for districts drawn in the same area.
Scores can be heavily impacted by the shape of the agency itself,
or other competing criteria, such as the need to draw districts
that meet federal Voting Rights Act requirements, maintain other in Polsby-Popper the length of all the lines,
governmental boundaries, or follow contours of existing natural including twists and bends of the district, is
structures like mountains and rivers. compared to the size of a circle with the
same length circumfurence.
Another approach to compactness is to move away from
criticizing the roughness and spikes of external boundaries, but instead looking for the dispersion of
population within a district. How does a district, as an example, bridge together nearby populations
versus one that stretches around a geography to connect two less-connected populations. An election
district boundary could, under this metric, be considered mathematically compact because of its smooth
edges, but upon inspection be found to be non-compact because it is twisting in on itself, being
distorted like an amoeba around some nearby populations to capture something else further away.
In California, there is a history of moving away from the pure mathematical demonstrations of
compactness. The Report and Recommendations of Special Masters on Reapportionment in 1992
described it this way:
Version 1 |6.18.2021 8|Page“A district would not be sufficiently compact if it was so spread
out that there was no sense of community, that is, if its members
FUNCTIONAL
and its representatives could not effectively and efficiently stay in CONTIGUITY
touch with each other; or if it was so convoluted that there was
no sense of community, that is, if its members and its
representative could not easily tell who actually lived in the Catalina Island
district.” Los Angeles County has an
island with around 4,000
In recent legislation, the state has officially eschewed the mathematical residents that is 20 miles off
calculations for compactness, instead going with a qualitative measure the coast. It is not contiguous
which states that districts “shall be drawn to encourage geographical and does not have a bridge
compactness in a manner that nearby areas of population are not connecting it to the
bypassed in favor of more distant populations.” mainland.
It is functionally contiguous
Contiguity to four ports in Dana Point,
This can appear to be the simplest criteria. Districts should encompass an Newport, Long Beach, and
area that is comprised of contiguous geographic areas – without any San Pedro.
unconnected pieces. Anyone can see from a map if an area is one In redistricting, Catalina
contiguous unit, or it has portions that are not touching. Island has always been drawn
as contiguous with Long
This criterion seems less clear when one realizes that many cities and
Beach.
other local governments are non-contiguous. Many cities have annexed
property that are separated by areas of unincorporated county. Agencies South Davis
such as water districts often have dozens of areas which are not In Davis, California, the city is
contiguous to their primary boundaries but are within their district bisected by the Union Pacific
because they provide services to them. In some cases, this can be one or Railroad tracks that connect
two city streets, miles from the core of the agency. commuters from the State
Capitol to the Bay Area.
Other states or agencies have islands that are physically disconnected and Throughout the 2.5-mile
are joined only by miles of ocean, or geographic barriers where two span, there are only three
populations are connected as seen from a satellite photo, but divided by ways to cross, one road at
an impassable barrier, such as a mountain range or major waterway. each end, and one footbridge
This is something we at Redistricting Partners have come to describe as at the mid-point.
functional contiguity, a term that encapsulates two concepts to describe For purposes of redistricting,
how a geographic area is used in order to determine its ability to be it was considered functionally
considered one unit for the purposes of redistricting. contiguous only on the
Another term for one aspect of functional contiguity is travel contiguous, eastern and western ends
which means that you can travel from one side of the district to the other where one could drive from
without having to leave the district. At least one redistricting program has one side of the city to the
a measure of travel contiguity that can be utilized as a plan metric. other.
Redistricting sometimes attempts to push the bounds of what is
contiguous, and one example is treating two areas that are catty-corner
from each other as a contiguous unit. The result is a map where the
district has two points that touch and create a boundary that is point
Version 1 |6.18.2021 9|Pagecontiguous. State law does not allow this for cities or counties, stating “areas that meet only at the points of adjoining corners are not contiguous.” One final contiguity term that has been utilized in some questionable plans is string contiguous, where two parts of a district are joined by unpopulated census blocks or split census blocks taking a connector like a freeway or a river to force a connection between two otherwise separate areas. This would not be justifiable unless the agency itself had this as a geographic feature or there was a necessity under the Voting Rights Act. Version 1 |6.18.2021 10 | P a g e
When is a Redistricting Plan a Gerrymander?
Gerrymandering is the act of manipulating the redistricting process to achieve political gain, at the
expense of other groups or individuals.
The process was named after Governor Elbridge Gerry, a signor
of the Declaration of independence, produced a map for state
senate districts in Massachusetts that would reward his political
allies. This map was parodied in a political cartoon as looking like
a salamander, thus the “Gerry-mander.”
Historically, the gerrymandering process has been seen as a
binary war between Democrats and Republicans. The original
gerrymander was an attempt to maximize Republican districts,
but Democrats have also taken advantage when they hold the
power to draw lines.
Recent Supreme Court decisions8 have removed the legal process
from being able to adjudicate this kind of gerrymandering,
The Original Gerrymander – March 1812
finding that such partisan claims are nonjusticiable. At the same
time, states have increased policymaking on restrictions to partisan
manipulation, either through rules imposed on lawmakers that
have the power to draw their own lines, or by removing that power
and transferring it to judges or independent bodies and
commissions that conduct the redistricting. Current legislation in
the House of Representatives would create a national mandate for
nonpartisan redistricting commissions in all 50 states.9
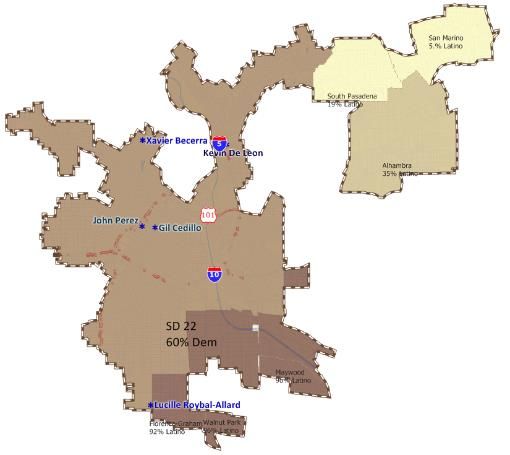
Even though the Gerrymander is seen as a relic of more than 200
years ago, the formation of the 20th Senate District in the 2001
redistricting plan bore a striking resemblance to the original
Gerrymander, just 10 years before the first Citizens Redistricting
Commission was charged with drawing California’s legislative
California Senate District 20 (2001-2011)
boundaries. However, in the heart of heavily Democratic Los
Angeles County this was not necessary to gain partisan advantage, but likely a result of other political
intent.
Tools of Gerrymandering
The purpose of redistricting is to bring communities together, and allow them to be able to elect a
candidate of their choice. But when drawing these lines, experts can manipulate the outcome of
elections utilizing some tools that empower some communities at the expense of others, causing a
gerrymander.
8
Common Cause v. Rucho (2019) and Gil v. Whitford (2018)
9
House Resolution 1 - https://www.congress.gov/116/bills/hr1/BILLS-116hr1pcs.pdf
Version 1 |6.18.2021 11 | P a g eThe primary tools in this are cracking and packing, essentially two sides of the gerrymandering coin. But
there are additional methods of using the manipulation of districts to achieve political means.
Cracking – when a defined population is split into several districts to dilute their political power
and deny them the opportunity to elect a candidate of their choice in any of the districts.
Packing – when a cracking cannot be used because a population is too large, it can instead be
drawn in a way that gives the community one seat, but with as many members of that group as
can be put into one district, and diluting any possibility that the remaining population can elect
their preferred candidates in the remaining seats.
Stacking – taking a minority population and pushing them into one district with a concentration
of majority population voters in a way to dilute their voting power.
Hijacking – drawing districts in a way to purposefully place two incumbents in the same district
in order to deny one of them from being able to be reelected.
Kidnapping – drawing a member into a neighboring district or purposefully removing their
political base.
The work of packing and cracking, and other manipulations of redistricting, have become easier as
computing power has increased, and data on partisan performance, ethnicity, and other factors has
become more detailed and readily available. At the same time, it has also become easier to identify
gerrymandering by utilizing these same tools. For more on these methods of identifying these tools in
action, see the section titled “Measuring a Gerrymander.”
Types of Gerrymanders
While gerrymandering was borne with one intention, the tools have been applied to many other
purposes, spawning a number of different terms for different kinds of manipulations
Partisan Gerrymander – the most commonly thought of gerrymandering is one in which the line
drawing process is used to bolster the prospects of one political party and dilute the voting
strength of another. While this is the type of gerrymandering that policymakers and good
government groups have made the most strides in abating, the courts have given this kind of
gerrymandering a pass.10
Racial Gerrymander –gerrymandering by race, ethnicity and national origin is unconstitutional.
This is where courts show the most willingness to intervene.
Many of the laws regarding redistricting have come out of post-reconstruction history in the
South, where redistricting, among other election structures, were used to weaken the political
power of Black voters. As one court decision would disallow a manipulation of lines to weaken
the minority voting strength, a new scheme would come up, and that would have to be
addressed by the courts. Through a series of “whack-a-mole” lawsuits, remedies to racial
gerrymandering in the South essentially formed most of current redistricting legal doctrine.
10
Rucho v. Common Cause. “We conclude that partisan gerrymandering claims present political questions beyond
the reach of the federal courts” - Chief Justice John Roberts, for the Majority.
Version 1 |6.18.2021 12 | P a g eDespite the growth in redistricting laws and large number of court rulings, racial gerrymandering
has not stopped. We have seen districts that deny Black, Latino and Asian voters effective voting
power in California’s local and statewide redistricting, with court interventions as recent as last
year.
Incumbent Gerrymander – it is very common in states
and local governments for there to be more pressure to
preserve stability than make partisan gains. This has
happened several times in California history, the most
recent being the 2000 redistricting in which Democratic
leaders traded votes from Republicans on key policy
issues for agreements on those members being able to
keep their seats intact.
Incumbent gerrymanders have been very common in
local government, with an example coming out of the
City of Martinez in a redistricting that the courts11 called
a self-parody of the original gerrymander and the League
of Women Voters stated “the map which was adopted
reflects the City Councilmembers’ primary
City of Martinez – 2018 Districting
consideration…to protect their own seats.”
Another example of Incumbent Gerrymandering comes from Kern High School District, where
the plan neatly divided three incumbents to remain in their seats. Those three trustees lived
within three miles of one another in California’s geographically largest high school district. And
the gerrymander wasn’t without consequence – it caused a division on the other end of the
district, splitting up the voting power of Latinos.
This kind of manipulation is also called Sweetheart Gerrymandering and Handshake
Gerrymandering.
Dummymander – when a partisan gerrymandering fails, it is sometimes called a
Dummymander. Often this is a result of a redistricting which is seeking to maximize the number
of partisan seats by achieving the largest number of districts that can be won by a political party.
But if that strategy is overstretched, the elastic can snap and the gerrymandering fails, with the
opposite party gaining in seats that they were not supposed to be able to win.
While gerrymandering is generally focused on partisan or ethnic manipulation of the districting process,
the local government reality is that it is more often about more trivial matters such as drawing a district
to capture more affluent voters who are key to fundraising, drawing districts to split a college student
population to deny them representation on a local council or board, or drawing districts in a way to
weaken the power of a community that has not been favored by the elected body.
11
Sanchez v. City of Martinez
Version 1 |6.18.2021 13 | P a g eCommunity Engagement
COMMUNITIES OF
The process of obtaining public engagement in redistricting allows for
new election boundaries to have a rational basis that is built upon local
INTEREST VARY BY
communities, not factors such as partisanship, incumbency, or other AGENCY
disallowed factors. These are important to maintaining public confidence
Communities of interest can
in the redistricting process, and they are the best protection against
vary based on the agency
potential litigation.
conducting the districting.
Communities of Interest (COI) Almond/Walnut Growers
Redistricting should build up electoral boundaries from the underlying During statewide drought
conditions, Solano County’s
communities – using the process to empower groups that have similar
farmers have benefited
backgrounds, experiences, and viewpoints in order to allow them to unify
from the availability of
and elect candidates of their choice. water for their crops.
Developing communities of interest for a redistricting process is the most In this process, two groups
important part of public outreach. Listening to residents allows us to of high water usage farmers
develop knowledge about what communities exist, and how they interact became a recognized
with the agency. community of interest:
Almond and Walnut
Communities of interest are not just those which can be found by growers.
objective means, from a census file or other dataset. It is important to
allow community members themselves define their communities, how Horse People
they are geographically based, and what makes them cohesive. In Los Angeles city and
county redistricting, the
The California Citizens Redistricting Commission was provided this “horse people” live in
definition to guide their understanding of communities of interest: northern San Fernando
Valley communities with
“A contiguous population which shares common social and
desires for large lots, low
economic interests that should be included within a single district
traffic, and more horse
for the purposes of its effective and fair representation. Examples
paths than sidewalks.
of such shared interests are those common to an urban area, a
rural area, an industrial area, or an agricultural area, and those Fishermen
common to areas in which the people share similar living In the San Mateo County
standards, use the same transportation facilities, have similar Harbor District, the agency
work opportunities, or have access to the same media of was building communities
communication relevant to the electoral process.” of interest. It became clear
that a key community of
These communities can be bound by immutable characteristics, values, or
interest was the
circumstances. Examples of these include:
populations that use the
Immutable characteristics: unchangeable attributes in the two harbors in the county:
population, such as race, age, disability, and national origin. Fishermen, and the
commercial businesses that
Shared Values: like an area that values urban diversity, education
rely on access to the
opportunities, transportation needs, specific governmental
facilities.
policies, land use, outdoor recreation, access to specific services,
etc…
Version 1 |6.18.2021 14 | P a g eCircumstances: these are factors that are consistent across a region, but often not by choice,
such as a low-income community, high rates of pollution and asthma, traffic congestion,
homelessness or crime rates.
These characteristics are not mutually exclusive – many areas are defined by two or three of these
elements which make them cohesive and a defined community of interest.
It is also important to note that communities of interest will vary by agency. A school board should have
more focus on education-related communities of interest, a city will receive more community of interest
testimony from residents who rely on city services, and a water district may be looking at things such as
variation in water rates, or types of consumers.
Communities of interest can also be defined by underlying political geographies. One example of this is
the requirement in California state and local redistricting that the geographic integrity of cities, counties
and neighborhoods be protected in redistricting along with other communities of interest.
These political geographies are useful as communities of interest because they are a result of individuals
defining themselves. Individuals can share some of their circumstances if, as an example, they live in an
incorporated city or an unincorporated county, and their boundaries, for the most part, are easily
identifiable. The community of interest in political geographies can be compounded when there are
distinct and sometimes very large differences in the governance based on living within or outside of a
specific political geography. One example would be the difference in tax rates paid by city residents
versus those who live outside of an incorporated city while, at the same time, those in a city might
receive greater services and amenities that are denied to unincorporated county residents. It is very
common in California to find a road that goes in and out of the incorporated city, showing very clearly
the variation in services afforded to residents on each side of that boundary.
Neighborhoods can be more fluid, with most agencies having different neighborhood boundaries based
on what source is used. But neighborhoods also can benefit from their self-selection. While many
residents may have little say over what city or county they are going to live in, the selection of a
neighborhood as expressive of their values and desire for specific attributes is a real factor in decisions
about where someone will rent an apartment or buy a home. It is no surprise that the greatest use of
neighborhoods is on Realtor and property-related websites.
Other physical geography can define communities of interest. The saying “other side of the tracks” can
have a real meaning in some communities where a physical location of a railway line, freeway, river or
other element can serve as a demarcation point between two sides of a community.
In other cases, the physical location of an airport, golf course, hillside, or valley can define a community.
This can be caused by the physical element – like the negative externalities of living near a railroad track,
freeway, or dairy farms, or the positive benefits of living near the ocean, on a golf course, or up in the
hillsides away from crime and urban congestion.
While communities of interest can be constructed by a seemingly unending number of attributes, state
law does prohibit the state, cities and counties from considering partisanship or the residences of
candidates and incumbents as communities of interest.
There are two general phases of community engagement, and they can somewhat overlap.
Version 1 |6.18.2021 15 | P a g ePhase 1 – Community of Interest (COI) Testimony
This is the initial phase of building public input and testimony to develop the basis upon which eventual
districts will be constructed. This testimony can come from organizations or individuals, through online
mapping, paper/online forms, or verbal/video testimony.
Importantly, this testimony should identify:
• What is the community of interest that is being described through the testimony?
• What is the geographic area of that community of interest?
• What data can be utilized to help identify that community of interest?
• How does that community of interest relate to the city, county, or agency?
It is important to note that some communities of interest may be very important in one districting
effort, but not in another, even within the same geography. For example, a city may have a strong set of
neighborhoods that form key communities of interest, but for a K-12 redistricting, the campuses may be
more important.
Phase 2 – Plan Development and Feedback
Once census data is available local governments can begin the mapping process. Initial maps for cities
and counties, per the FAIR MAPS Act, may have a required waiting period before releasing draft maps,
but local mapping tools should be updated for the community immediately.
Outreach at this point should focus on how the public can submit draft plans and feedback on any plans
created by the staff, consultants, or the body in charge of the local redistricting process.
To inform this process, the public should receive information on the current districts with their new
deviations under the 2020 Census data so the public can understand how much current maps would
need to be adjusted if they are used as the basis for a new redistricting plan, and there should be an
update of any online mapping software to include the new population data.
During this time the body conducting the redistricting should not forget the importance of communities
of interest as a building block of new plans. The Phase 1 COI testimony should continue as it will help
inform any changes to the plans and provide ways for the new districting plan to be justified by these
elements rather than disallowed criteria.
Version 1 |6.18.2021 16 | P a g eCensus Data
The census is a snapshot of the population once every decade based on where each resident resides on
April 1st. The count is mandated by the Constitution and conducted by the U.S. Census Bureau, a non-
partisan government agency. In 2020, each home in the United States received an invitation to respond
to a short questionnaire online, by phone, or by mail.
Even before a determination of the quality of the 2020 Census enumeration, we already know the
process was marred by significant structural and political problems. Including:
1. The introduction of the online census survey, which the Census Bureau failed to sufficiently
test and that was launched before the conclusion of the department’s full evaluation plan.
2. The census was caught in a political fight over the inclusion of a citizenship question,
inserted into the census through a process that was intended on using the data to
disenfranchise minority communities. This effort was ultimately rejected by the Supreme
Court.
3. The COVID-19 pandemic caused a massive disruption in the traditional door-to-door process
of enumeration, causing delays and considerable challenges with the self-reporting phase of
the census data collection.
4. Additional political moves to remove non-citizen population from the statewide counts used
for reapportionment and attempts to use other statewide data to identify non-citizens in
the decennial redistricting file continued to cause disruptions and delays in the processing of
data.
There are many products of the census, two of which are critical for conducting redistricting. Those two
data sets are the PL 94-171 File and the American Community Survey.
Public Law 94-171 File
Public Law 94-171 directs the Census Bureau to make special preparations to provide redistricting data
needed by the 50 states.
Required by law, the Redistricting Data Program provides population and demographic data in small
geographic areas called census blocks which can then be used as the basis for redrawing election district
boundaries.
The PL file is required to be released within a year of the April 1 decennial census and has traditionally
been delivered in six waves leading up to March 31 of years ending in 1. In this redistricting cycle, the
data is expected to be six months late, significantly curtailing the time available in the 2021-2022
redistricting cycle. The impact of this late census is still unknown, but several states and municipalities
are already considering conducting their upcoming 2022 elections using their existing lines.
American Community Survey (ACS)
The American Community Survey, previously known as the Long Form Census, is sent to a small subset
of the population and used to create a wider picture of individual and household characteristics.12 The
survey asks questions about housing, income, education and other factors, including citizenship and it is
12
https://www2.census.gov/programs-surveys/acs/methodology/questionnaires/2020/quest20.pdf
Version 1 |6.18.2021 17 | P a g eused by researchers, the federal government, commercial enterprise, and demographers conducting
redistricting for jurisdictions.
Data is released at different geographies, based on different methodologies.
- ACS 1-year estimates are data that have been collected over a 12-month period and available
for geographic areas with at least 65,000 people.
- The Census Bureau combines 5 consecutive years of ACS data to produce multiyear estimates
for geographic areas with fewer than 65,000 residents.
- The smallest release is 5-year estimates at the census block group level produced for the
Department of Justice to allow for the analysis of voting age citizens and their ethnic
breakdown. These are known as Citizen Voting Age Population or CVAP counts. This data is
further disaggregated down to the block level in order for it to be used in the redistricting
process.
CVAP is an important and required part of the census data when conducting redistricting as it acts as the
“eligible voter” population when determining VRA compliance.
For the 2014-2018 CVAP Special Tabulations the following categories are included:
• Total
• Not Hispanic or Latino
• American Indian or Alaska Native Alone
• Asian Alone
• Black or African American Alone
• White Alone
• American Indian or Alaska Native and White
• Asian and White
• Black or African American and White
• Asian and White
• Black or African American and White
• American Indian or Alaska Native and Black or African American
• Remainder of Two or More Race Responses
• Hispanic or Latino
Within California, it is most common to utilize the Hispanic/Latino, Asian and African American total
CVAP population groups, without combining the mixed ethnicity populations for Section 2 Voter Rights
Act analysis. In other states, we find it more common to combine groups, particularly African American
and each of the Black and Other categories.
When a district is determined to be at 50% of a protected class, and a majority minority district under
Section 2 of the Federal Voting Rights Act, that calculation is made from the CVAP data.
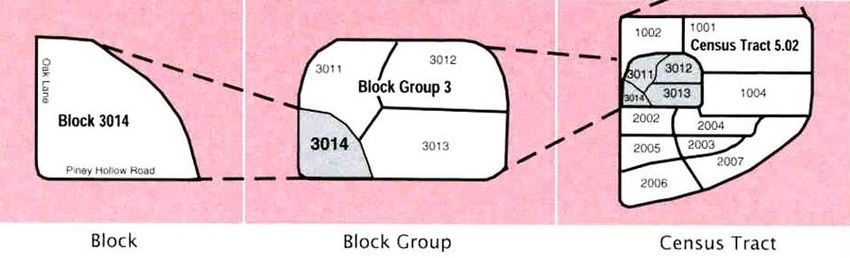
Version 1 |6.18.2021 18 | P a g eCensus Geographies
The census data is generally thought of as the counts of population, but it also includes the geographies
in which the data is provided. These begin with small geographic units which have population, then are
built up in a hierarchical fashion. The architecture of these geographic datasets is called Topologically
Integrated Geographic Encoding and Referencing, or TIGER files.
Building up from the smallest unit, the shapes start with census blocks, then those are combined to
make block groups, which are combined to make Tracts.
Census blocks are the basic building blocks of all geographic boundaries. They are the smallest
level of geography where census data is available, including total population, age, sex and race.
They are often the size of a city block, but in an unpopulated are they can encompass many
square miles. In California there were over 700,000 blocks, but for 2021 many of the blocks with
no population were consolidated, with the final 2021 file having just over 500,000 blocks.
Census block groups are the next level above census blocks in the geographic hierarchy. A block
group consists multiple blocks and can average around 1,500 residents. The block group is the
smallest geographic area where ACS data is made available.
Census tracts are the next level above bock groups. Census tracts have an average population of
around 4,000 people. Some census data comes in the Tract level, such as household
demographics.
Version 1 |6.18.2021 19 | P a g eRedistricting Software
Redistricting Partners has used multiple GIS programs in both desktop and online platforms in different
redistricting jurisdictions. We are not endorsing a specific program but instead leave that up to the
jurisdictions to evaluate their budget, targeted users, and needs.
In the time of COVID and inability to host in-person paper-based mapping workshops, online meetings
and web-based mapping platforms are a way for the public to be engaged in a more meaningful way.
Desktop Programs
These are programs used by professionals and academics in order to draw or evaluate redistricting
maps. They are built out of the same software used by other professionals to manage everything from
traffic patterns for civil engineering projects to student attendance for school sites.
The three primary desktop programs are ESRI, Maptitude and QGIS.
ESRI - Started as the Environmental Systems Research Institute, ESRI is a private mapping
company with more than a billion dollars in revenue from private industry, academia and state
and local governments. Their primary application is ArcGIS and it is used in multiple fields, with
redistricting being but a small share of its business.
Within redistricting ESRI shapefiles are a standardized format that can be read by any legitimate
redistricting software.
Maptitude - Caliper Corporation created Maptitude as a program mostly for traffic and
municipal analysis, but it quickly specialized into its popular Maptitude for Redistricting
software. This software has been credited as the primary new tool in the advancement of
redistricting and GIS in 2000 and 2010, helping shape lines in more states and localities than any
other software.
QGIS – The QGIS system is a free open-source desktop GIS software that supports viewing,
editing, and analysis of mapping data. There have been multiple programs built by redistricting
enthusiasts and academics to run in the QGIS platform. These are not consumer products but
will appear in redistricting discussions, generally by outside organizations that cannot afford
expensive GIS programs.
Online Programs
There are multiple online programs designed to allow the public to interact with the redistricting
process. Some of these are commercial programs often purchased by states and local governments to
allow for public engagement in an environment where those maps and data are submitted to the agency
doing the redistricting. In these commercial platforms there are controls over what data is presented.
There are also online programs created by nonprofits which they can control, and are being used to help
outside groups organize and interact with the redistricting process.
The first set of online programs are those which can be commercially obtained by a state or agency and
run on their own servers, or connected to their redistricting in a way that all public comment is funneled
Version 1 |6.18.2021 20 | P a g eYou can also read