NEVADA OFFICE OF FOOD SECURITY - NUTRITION PROGRAMS FOR OLDER NEVADANS AND PRELIMINARY RECOMMENDATIONS - Nevada Division of ...
←
→
Page content transcription
If your browser does not render page correctly, please read the page content below
NUTRITION PROGRAMS FOR OLDER NEVADANS AND PRELIMINARY RECOMMENDATIONS

    NEVADA OFFICE OF
     FOOD SECURITY
NUTRITION PROGRAMS FOR OLDER
  NEVADANS AND PRELIMINARY
      RECOMMENDATIONS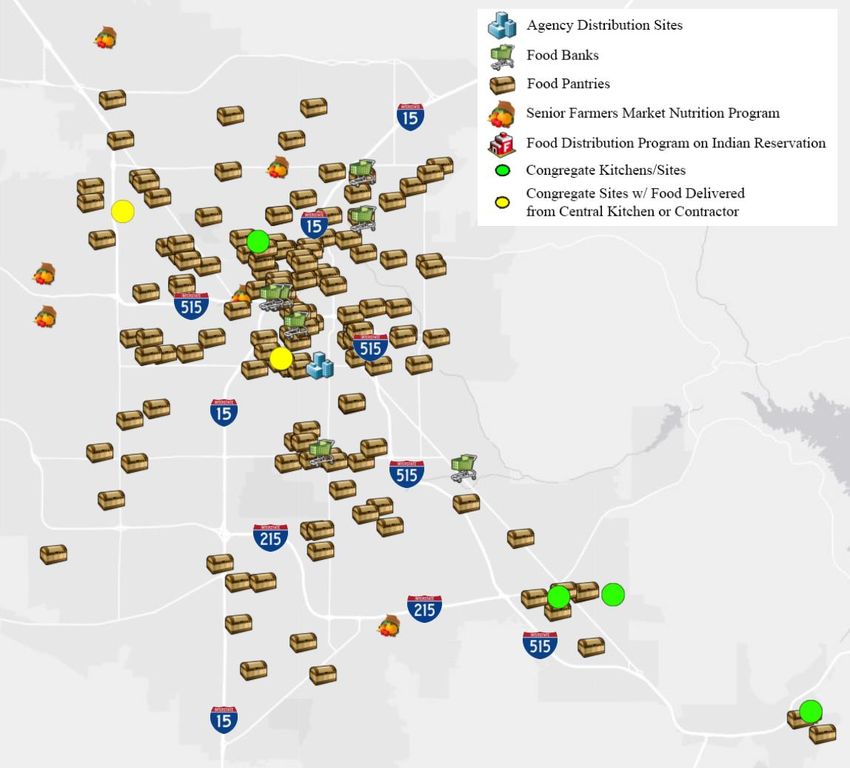
NUTRITION PROGRAMS FOR OLDER NEVADANS AND PRELIMINARY RECOMMENDATIONS

ACKNOWLEDGEMENTS
The Nevada Office of Food Security would like to thank the following individuals for their contributions
to this publication.

                              Stakeholder Study Group Members
               Darlene Dougherty,                                         Colleen Duewiger,
    Division of Welfare and Supportive Services                 Catholic Charities of Southern Nevada

                 Jeffrey Duncan,                                           Cherie Jamason,
       Aging and Disability Services Division                       Food Bank of Northern Nevada

                    Travis Lee,                                             Mary Liveratti,
         Nevada Senior Center Association                            AARP Nevada State President

                  Karissa Loper,                                           Wendy Madson,
      Division of Public and Behavioral Health                      Healthy Communities Coalition

                   Kristi Martin,                                           Angela Owings,
       Aging and Disability Services Division                       Washoe County Senior Services

                  Dana Serrata,                                               Jodi Tyson,
           Helping Hands of Vegas Valley                                Three Square Food Bank

                   Laura Urban,                                            Michelle Walker,
              Office of Food Security                            Women, Infants and Children (WIC)

This material was partially funded by Nevada’s SNAP-Ed allotment from the United States Department
of Agriculture’s (USDA) Supplemental Nutrition Assistance Program (SNAP). Please call 1-800-992-0900
for more information. This institution is an equal opportunity provider and employer.

                 Social Entrepreneurs, Inc., a company dedicated to improving the lives of people by helping
                 organizations realize their potential, provided support in the development of this analysis.

                                                                   NEVADA OFFICE OF FOOD SECURITY               i
NUTRITION PROGRAMS FOR OLDER NEVADANS AND PRELIMINARY RECOMMENDATIONS

TABLE OF CONTENTS
Acknowledgements........................................................................................................................................ i
Executive Summary....................................................................................................................................... 1
   Data Summary........................................................................................................................................... 2
   Recommendations .................................................................................................................................... 2
Introduction .................................................................................................................................................. 4
   Methods of the Study ............................................................................................................................... 5
       Research and Data Collection ............................................................................................................... 0
       Key Informant Interviews...................................................................................................................... 4
   Context of the Study ................................................................................................................................. 5
Profile of Older Nevadans ............................................................................................................................. 6
   Nevada Landscape .................................................................................................................................... 6
   Demographic Profile of Older Nevadans .................................................................................................. 7
       Gender .................................................................................................................................................. 9
       Race/Ethnicity ....................................................................................................................................... 9
   Health and Health Care ........................................................................................................................... 11
   Social and Community Context ............................................................................................................... 17
   Education ................................................................................................................................................ 18
   Economic Stability ................................................................................................................................... 19
   Neighborhood and Built Environment .................................................................................................... 29
Trends Within the Aging Population ........................................................................................................... 37
   Disability Trends...................................................................................................................................... 37
   Food Insecurity........................................................................................................................................ 38
Food and Nutrition Programs for Older Nevadans ..................................................................................... 39
Current Senior Nutrition Service System .................................................................................................... 49
   Service System Ability to Meet Client Needs .......................................................................................... 49
   Key Informant Analysis ........................................................................................................................... 49
Financial Profile of Nevada Senior Nutrition Programs .............................................................................. 55
   Financial Profile ....................................................................................................................................... 57
   Forecast of Older Nevadan Needs .......................................................................................................... 61
Research-Based Strategies to Address Senior Nutrition............................................................................. 64

                                                                                               NEVADA OFFICE OF FOOD SECURITY                                ii
NUTRITION PROGRAMS FOR OLDER NEVADANS AND PRELIMINARY RECOMMENDATIONS

   Streamlining SNAP Enrollment ............................................................................................................... 64
Situational Analysis ..................................................................................................................................... 65
Recommendations ...................................................................................................................................... 68
Appendix A. Key Informant Interview Questions ....................................................................................... 70
Appendix B. Additional Maps...................................................................................................................... 72
References .................................................................................................................................................. 81

                                                                                               NEVADA OFFICE OF FOOD SECURITY                             iii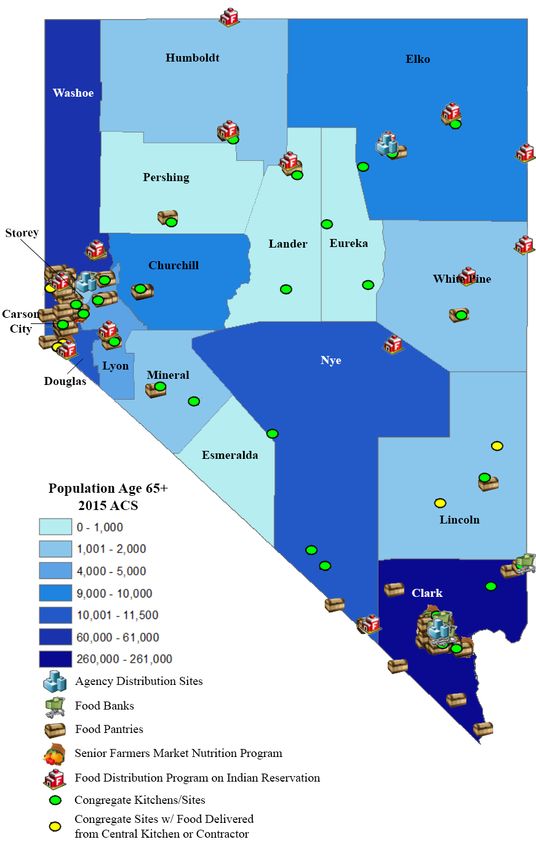
NUTRITION PROGRAMS FOR OLDER NEVADANS AND PRELIMINARY RECOMMENDATIONS
EXECUTIVE SUMMARY
Food insecurity affects Nevadans of all ages but older adults face a significant health impact when they
lack consistent access to enough food. Food insecurity is a condition that is assessed and represented in
USDA reports. It is a household-level economic and social condition of limited or uncertain access to
adequate food (1).
On February 12, 2014, Governor Brian Sandoval established the Governor’s Council on Food Security
(GCFS) per Executive Order 2014-03. The GCFS was established within the Department of Health and
Human Services' (DHHS) Office of Food Security (OFS) and tasked with effectively improving the quality
of life and health of Nevadans by increasing food security
throughout the state. GCFS is the recognized advisory
board on strategies to improve food security, whereas the QUICK FACTS
Governor’s Commission on Aging (CoA) is the recognized
advisory body on strategies to improve the health and About 80,000 older
wellbeing of older adults in Nevada. Nevadans (ages 60 years
and older) were food
To better understand how the current food system works insecure in 2016
in addressing the needs of food insecure older Nevadans, Nevada will see a 36%
how funding for these programs is distributed, and what increase in the older adult
the trends and projections are for the population, the OFS population over the next
commissioned this analysis, previously known as the ten years
Nutrition Programs Gap Analysis for Older Nevadans. To Therefore, it is estimated by
oversee the development of this analysis, a Stakeholder 2025, 17,000 more older
Study Group (SSG) was convened and included members Nevadans will need
from food banks, state and local government, nonprofit nutrition services than
organizations, and local coalitions. The SSG was those today, totaling almost
responsible for approving research questions, identifying 100,000 older Nevadans
key informants, and developing strategies and preliminary One in three older
recommendations. The GCFS and OFS will issue Nevadans had a disability in
subsequent reports identifying additional services, service 2015
gaps, and additional recommendations to continue to Over 40% of older
promote food security among this population. Nevadans lived alone in
2015
Social Entrepreneurs, Inc. (SEI) conducted research to
Two out of three older
understand the current and projected environmental
Nevadans were considered
factors facing older Nevadans in the context of food
burdened or very burdened
insecurity. Data was collected from state sources, sponsors
with the cost of housing in
of food programs that reach older Nevadans, and
2013
independent research was conducted on demographics,
Nearly 90% of older
projections, and trends. SEI mapped food security
Nevadans rely on Social
resources by county, and SSG members provided
Security benefits
additional data and maps. Finally, budgets and other
funding data were collected. Key informant interviews
NEVADA OFFICE OF FOOD SECURITY 1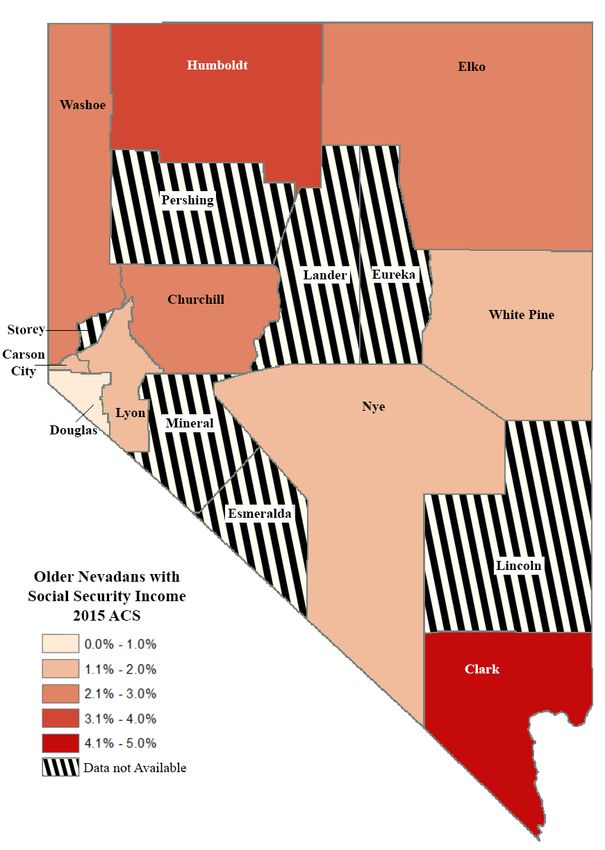
NUTRITION PROGRAMS FOR OLDER NEVADANS AND PRELIMINARY RECOMMENDATIONS
with individuals identified by the SSG as having specialized knowledge about the food service spectrum
in Nevada were conducted to gather insight regarding the critical issues facing older Nevadans who do
or may suffer from food insecurity.
DATA SUMMARY
In 2015, the total population in Nevada of those 65 years and older was 380,706, representing 13.6% of
the state’s total population. Population estimates by the Nevada State Demographer show that by 2025,
Nevadans who are 65 years or older will make up approximately 16.5% of the population (2). Nevada’s
older adult population is anticipated to increase by 36% over the next 10 years. Currently, 14.8% of
older Nevadans are food insecure. While trends in food insecurity have improved in recent years, the
percentage will continue to rise as the population grows unless strategies are implemented to address
the concern.
Research and data from SSG members illustrated several barriers to addressing the needs of food
insecure older Nevadans:
Federal nutrition benefits are under-utilized by eligible older adults in Nevada.
Pantries cover the largest percentage of food insecure older Nevadans served through
charitable means, which will likely increase disproportionately to the growth of other nutrition
services due to program requirements, caseload restrictions, and program costs; yet pantries do
not receive any dedicated funds for food purchases or services such as home delivery.
Meal sponsors are burdened by expenses that far exceed the per meal reimbursement provided
by state, local, and federal government funds resulting in wait lists, reduced days of meal service
(or fewer delivered meals), and threatens the very existence of program providers/sponsors.
Cost per meal reductions won’t fully satisfy the gap between operational costs and
reimbursement. Although the Nevada Legislature raised per meal reimbursements for sponsors
for new meals provided to clients previously on the waiting list, additional increases may be
needed and warranted.
RECOMMENDATIONS
Based on the research and key informant interviews, the SSG developed recommendations under three
broad categories of Policy, Operations, and Funding.
POLICY
Establish the Governor’s Council on Food Security as a permanent advisory committee, board,
or commission.
Maximize food access by encouraging utilization of all available food programs for which older
Nevadans and their dependents are eligible.
Provide these preliminary recommendations to the Governor’s Council on Food Security and
the Governor’s Commission on Aging for review, adoption, and implementation as
appropriate.
Support person-centered planning and service delivery through a “no wrong door” approach
for all providers of nutrition services and create a continuum of nutrition services.
NEVADA OFFICE OF FOOD SECURITY 2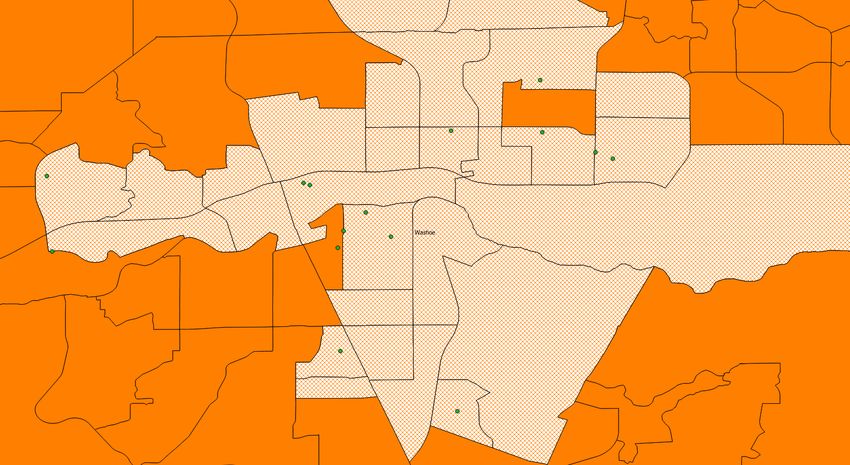
NUTRITION PROGRAMS FOR OLDER NEVADANS AND PRELIMINARY RECOMMENDATIONS
Collaborate with transportation services to promote access to food.
The Governor’s Council on Food Security should regularly review food and nutrition state plan
proposals to make recommendations related to senior nutrition.
Provide the Aging and Disability Services Division’s (ADSD) Meal Cost Study (Fall 2018) to the
Governor’s Council on Food Security and the Governor’s Commission on Aging to develop
recommendations based on the study’s results.
Request the Governor’s Council on Food Security and the Governor’s Commission on Aging
support advocacy efforts to oppose changes to SNAP that increase stigma and eliminate
entitlement.
OPERATIONS
Implement strategies to encourage and reduce barriers to SNAP participation among eligible
older adults.
o Lengthen certification period to promote participation
o Work with the Division of Welfare and Social Services (DWSS), Senior Famers’ Market
Coupon Program, EBT access at Farmers’ Markets, and ADSD to implement new
practices
o Promote a SNAP enrollment drive among older Nevadans
Support innovative approaches for home delivered groceries and meals through:
o Reimbursable services (Medicaid and Medicare)
o Food insecurity grant funds/success contracts through DHHS
o SNAP redemptions via online grocery ordering
o SNAP redemptions to support senior nutrition non-profit sponsors
o Increase the number of programs and amount of funding for offering home-delivered
groceries for self-prepared meals
o Connect food delivery to social engagement
Utilize banquet meals rescue for non-reimbursable meals for congregate settings.
Support partnerships and capacity building to create greater efficiencies in programs that
would allow for a greater number of older Nevadans to be served.
Expand diversity of foods available through food banks and commodity foods to address
client needs for animal protein and dairy as part of a balanced diet.
FUNDING
Support all efforts to secure Medicaid and Medicare funding for the reimbursement of
nutrition related services.
Request the Governor’s Council on Food Security and the Governor’s Commission on Aging
support advocacy efforts to increase meal reimbursement rates based on the findings of the
ADSD Rates Study to create parity between children and senior meal programs.
NEVADA OFFICE OF FOOD SECURITY 3
NUTRITION PROGRAMS FOR OLDER NEVADANS AND PRELIMINARY RECOMMENDATIONS
Request the Governor’s Council on Food Security and the Governor’s Commission on Aging
support advocacy efforts to Congress to increase funding for senior meal programs through
the Older Americans Act and provide states greater flexibility in administration rules to meet
local needs.
INTRODUCTION
On February 12, 2014, Governor Brian Sandoval established the Governor’s Council on Food Security
(referred to as “Council”) per Executive Order 2014-03. The GCFS was established within the
Department of Health and Human Services' (DHHS) Office of Food Security (OFS) and tasked with
effectively improving the quality of life and health of Nevadans by increasing food security throughout
the state. The Council is charged with implementing the statewide strategic plan: Food Security in
Nevada: Nevada's Plan for Action. This plan of action outlines the priorities for the state, which include:
Lead
Goal 1- Establish the systems and positions necessary to implement a permanent,
sustainable, accountable state leadership structure for food security to increase all Nevadans’
understanding, value, and support of food security solutions.
Goal 2- Promote a policy agenda to increase food security in Nevada.
Feed
Goal 1- Maximize participation in each federal nutrition program available to the state.
Goal 2- Establish and integrate an actual or virtual “one-stop-shop” system to increase access
to food and other services for food-insecure Nevadans.
Grow
Goal 1- Increase the number of servings of nutritious foods consumed by Nevadans – with
emphasis on foods that are produced in Nevada.
Reach
NEVADA OFFICE OF FOOD SECURITY 4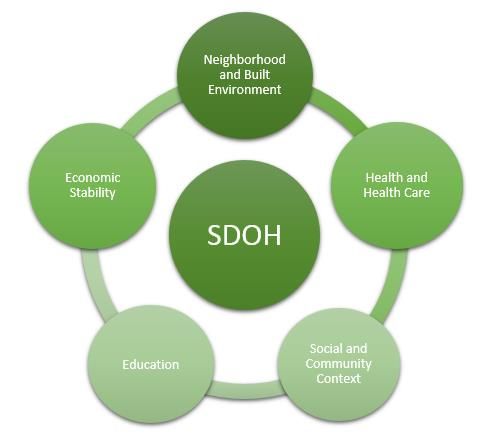
NUTRITION PROGRAMS FOR OLDER NEVADANS AND PRELIMINARY RECOMMENDATIONS
Goal 1- Change the current models of purchase (commodities) and distribution of nutritious
foods to increase economies of scale, and link frequency of deliveries and availability of local
food to the specific needs of communities throughout the state (rural, urban, and food
deserts).
Goal 2- Develop the technology to connect and share data among multiple state agencies,
regional food banks, community agencies, and faith-based organizations for efficient and
effective targeting of services and populations.
The mission of the Office of Food Security is to, “IMPROVE THE QUALITY OF LIFE AND HEALTH OF
NEVADANS BY INCREASING FOOD SECURITY THROUGHOUT THE STATE.”
The guiding principles for the OFS are:
1. Incorporate economic development opportunities into food Food insecurity is
security solutions. defined as the state
2. Use a comprehensive, coordinated approach to ending hunger of being without
and promoting health and nutrition, rather than just providing reliable access to a
emergency short-term assistance. sufficient quantity of
3. Focus on strategic partnerships between all levels of government,
affordable,
communities, and nonprofit organizations including foundations,
nutritious food.
private industries, universities, and research institutions.
4. Use available resources in a more effective and efficient way. United States Department
5. Implement research-based strategies to achieve measurable of Agriculture
results.
One area of importance to the OFS is ensuring older Nevadans are food secure with the resources
needed to remain healthy and independent. Nevada’s shifting demographics and population projections
indicate the likelihood of an increased need for nutrition services for older Nevadans that may strain the
service delivery system charged with meeting that need. At the same time research and surveys from
Nevada’s Food Security Plan (2013) indicate that stigma and lack of awareness of nutrition programs and
services can be barriers to accessing services when in need. Finally, differences in funding of services in
rural versus urban areas, coupled with stagnant federal funding for nutrition programs may exacerbate
the issue, making underserved areas more vulnerable to a fragile delivery system.
The OFS commissioned an analysis to better understand how the current food system works in
addressing the need of food insecure older Nevadans, how funding for these programs is distributed,
and what the trends and projections are for the population.
METHODS OF THE STUDY
To oversee the development of this analysis, a Stakeholder Study Group (SSG) was convened. The group
included members of the following agencies:
NEVADA OFFICE OF FOOD SECURITY 5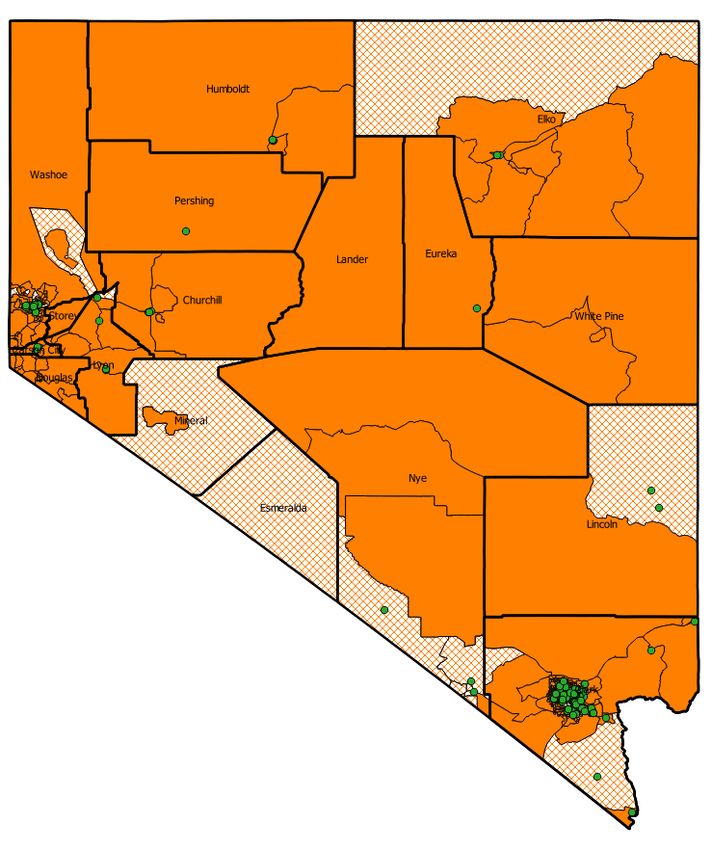
NUTRITION PROGRAMS FOR OLDER NEVADANS AND PRELIMINARY RECOMMENDATIONS
Aging and Disability Services Division AARP Nevada
(ADSD) Division of Public and Behavioral Health
Food Bank of Northern Nevada (FBNN) (DPBH)
Three Square Food Bank Healthy Communities Coalition (HCC)
Division of Welfare and Supportive Services Washoe County Senior Services
(DWSS) Helping Hands of Vegas Valley
Catholic Charities of Southern Nevada Nevada Office of Food Security (OFS/DHHS)
Nevada Senior Center Association Nevada Women, Infants, and Children (WIC)
The SSG was responsible for approving research
questions, identifying key informants, providing data, and
developing recommendations.
RESEARCH AND DATA COLLECTION Food Insecurity Risks
Research was conducted to understand current and
projected environmental factors facing older Nevadans in Food insecurity has been linked to:
the context of food insecurity. The research sought to Poorer self-reported
answer the following questions: health
1. What financial resources are available to support Lower quality of life
food programs for older Nevadans? Cardiovascular disease
2. What is the projected need for food services for Diabetes
older Nevadans?
Anemia
3. What are the variances by county?
4. What trends have been forecasted for older Obesity
Nevadans? Functional impairment
5. What are the non-food social determinants of Anxiety and depression
health for older Nevadans? Cognitive function
6. Are programs accessible to meet the needs of
Environmental factors such as
older Nevadans? (Where are we opening doors to
food cost, availability, distance to
food services for older Nevadans?)
obtain food, walkability, safety,
7. What gaps exist?
and available transportation all
8. What are innovative approaches to serving older
influence dietary intake.
adults in other states?
When one of these factors is
SEI was contracted by the OFS to conduct the analysis and
compromised, it can have a
facilitate the SSG discussions. SEI is a privately held
detrimental impact on the
corporation whose mission is to improve the lives of
nutritional status of an older
people by helping organizations realize their potential. SEI
individual (7).
collected data from state sources, sponsors of food
programs that reach older Nevadans, and conducted
independent research on demographics, projections, and
trends. SEI mapped food security resources by county, and SSG members provided additional data and
maps. Finally, budgets and other funding data were collected to help identify gaps.
NEVADA OFFICE OF FOOD SECURITY 0NUTRITION PROGRAMS FOR OLDER NEVADANS AND PRELIMINARY RECOMMENDATIONS
For the purposes of this report, Fiscal Year (FY) is reported as the period of July 1 to June 30.
KEY INFORMANT INTERVIEWS
SEI conducted key informant interviews to gather insight regarding the critical issues facing older
Nevadans who do or may suffer from food insecurity. Interviews focused on identifying barriers,
challenges, and system strengths and weaknesses. Twenty-one interviews were conducted between
June 26 and July 21, 2017 with individuals identified by the SSG as having specialized knowledge about
the food service spectrum in Nevada. SEI staff conducted the one-hour interviews by telephone.
NEVADA OFFICE OF FOOD SECURITY 4NUTRITION PROGRAMS FOR OLDER NEVADANS AND PRELIMINARY RECOMMENDATIONS
CONTEXT OF THE STUDY
During the Governor’s Council on Food Security meeting on January 11, 2017, the issue of older
Nevadans who are food insecure was presented to the Council. While much of the work in Nevada to
date has focused on child and adult food insecurity, food insecurity for older adults is equally important
as 18.8% of older Nevadans were deemed food insecure in 2014 (3). It is anticipated the prevalence of
food insecurity will increase nationally through 2025, when the youngest baby boomers turn 60 years of
age (4). The impact will be even more pronounced in rural counties, which tend to have a higher
percentage of older adults when compared to urban counties (5). This means rural Nevada will face
extreme challenges in providing needed services to the older population. Urban areas will also face
barriers in serving older Nevadans due to the significant size of the older adult population base (6).
The older adult population faces unique challenges compared to other age groups. Those living at home
are at an increased risk of hunger due to poor health conditions; lack of reliable social support and
transportation; low fixed incomes; and disability or functional limitations that impact their ability to
obtain or prepare food (7) (8). Low socioeconomic status is a known cause of food insecurity in older
adults due in part to the limited financial resources available for purchasing food; often, money goes
toward cheaper and less nutritious foods so other life necessities can be paid, such as housing, utilities,
and prescriptions.
The older population is not limited to just those who are 65 years and older. Aging trends indicate this
population consists of three generations (6):
Pre-retirement (ages 50-64)
Retirement qualified (ages 65-84)
Oldest old (85 and older)
Because many sources, including the U.S. Census Bureau and the Nevada State Demographer, report
population breakouts in five-year age increments, the pre-retirement group consists of ages 55-64 years
for the purposes of this analysis. Nutrition-related services in Nevada for older adults serve the
population aged 60 years and older.
STUDY LIMITATIONS
There were several limitations that should be considered:
The analysis is limited in outlining the tribal perspective of older American Indian food
insecurity. The Nevada Department of Agriculture (NDA) provided input about the Food
Distribution Program on Indian Reservations (FDPIR); however, researchers were unable to
secure an interview with a tribal representative.
The analysis does not address food insecurity among older Nevadans who are veterans.
Some data sets were not available at the county level, which impacted the ability to provide
some statewide comparisons.
Interviews on the strengths, weaknesses, and opportunities are focused on people already
receiving services from public and private entities in the food system. Individuals who are not
being reached by those systems were not represented by those interviewed.
NEVADA OFFICE OF FOOD SECURITY 5NUTRITION PROGRAMS FOR OLDER NEVADANS AND PRELIMINARY RECOMMENDATIONS
PROFILE OF OLDER NEVADANS
Food insecurity is not a direct result of any one factor. It is a culmination of several medical, social,
economic, and cultural constraints. For this reason, it is important to understand not only the
population projections of older Nevadans, but also their social determinants of health.
Social determinants of health (SDOH)
are the conditions in which people FIGURE 1 HEALTHY PEOPLE 2020 SOCIAL DETERMINANTS OF HEALTH
are born, grow, live, work, and age.
These conditions affect a wide range
of health risks and outcomes,
particularly in older adults (10). SDOH
can affect the well-being, functional
independence, and quality of life for
older Americans.
The following sections provide a
comprehensive profile of the older
Nevadan population. Geographical
information about Nevada, as well as
demographic data for the older
population, is presented followed by
data categorized by the SDOH
framework.
NEVADA LANDSCAPE
Nevada encompasses 110,567 square miles, making it the seventh
largest state by area. Nevada is roughly 492 miles long and 322
miles wide and consists of mostly mountainous and desert terrain.
Altitudes vary widely from 500 feet to over 13,000 feet.
Approximately 86% of Nevada’s land is owned by the U.S. federal
government under various jurisdictions both civilian and military. Much of this land mass is found in
Nevada’s 15 rural counties (11).
NEVADA OFFICE OF FOOD SECURITY 6NUTRITION PROGRAMS FOR OLDER NEVADANS AND PRELIMINARY RECOMMENDATIONS
DEMOGRAPHIC PROFILE OF OLDER NEVADANS
More people are living beyond their 80s due to advances in medicine and technology. According to U.S.
Census Bureau population estimates, the nation’s median age rose from 35 years in 2000 to 38 years in
2016. This rise is attributed to the baby-boomer generation. Residents aged 65 years and older grew
from 35 million in 2000 to 49 million in 2016, a 40% increase (12). Nevada also experienced an increase
in median age during this period, and projections anticipate this trend will likely continue over the
decade.
In 2015, the population in Nevada of those 65 years and older was 380,706, representing 13.6% of the
state’s total population. Approximately 32.3% of these seniors (or 123,124) had incomes at or below
200% of the federal poverty level (FPL) (13). Population estimates from the Nevada State Demographer
show by 2025, Nevadans who are 65 years or older will make up approximately 16.5% of the population
(2).
Figure 2 shows the 2015 population FIGURE 2 NEVADA POPULATION AGE 65+: 2015
estimates for older Nevadans by
county (ages 65 years and older).
Urban areas, such as Clark and
Washoe Counties, have the largest
older Nevadan population, consistent Older Nevadan Population Composition: 2015
with those areas having the highest 42% 48% 5%
population base throughout the
state. Nye County has the largest
population of older Nevadans when
compared to the remaining frontier
and rural counties.
When breaking down the older Pre- Retirement Oldest Old
Nevadan population by the three Retirement Qualified 85 and older
generations (including ages 55 years Ages 55-64 Ages 65-84
and older), the 2015 U.S. Census
Bureau shows:
47% or Are pre-retirement
(age 55-64 years)
339,203
48% or Are retirement
qualified (65-84
344,490 years)
5% or Are oldest old (age
85+ years)
36,216
NEVADA OFFICE OF FOOD SECURITY 7NUTRITION PROGRAMS FOR OLDER NEVADANS AND PRELIMINARY RECOMMENDATIONS
Population projections indicate there will be considerable changes between 2015 and 2025 within the
three populations of older Nevadans. The following changes are presented in the table below,
categorized by both county and the generation of older Nevadan (Table 1).
TABLE 1 POPULATION PERCENT CHANGE BETWEEN 2015 AND 2025
County Age 55-64 Age 65-84 Age 85+
2015 2025 % 2015 2025 % 2015 2025 %
Pop. Pop. Change Pop. Pop. Change Pop. Pop. Change
Urban Clark 233,501 276,893 18.6% 236,458 324,593 37.3% 24,065 34,335 42.7%
Washoe 57,304 57,118 -0.3% 54,082 77,653 43.6% 6,572 7,649 16.4%
Rural Carson 7,823 7,778 -0.6% 8,472 8,556 1.0% 1,546 1,631 5.5%
Churchill 3,184 3,110 -2.3% 3,730 4,170 11.8% 400 565 41.3%
Douglas 8,264 7,686 -7.0% 10,179 13,782 35.4% 917 1,854 102.2%
Elko 6,145 6,591 7.3% 4,267 7,150 67.6% 366 583 59.3%
Esmeralda 151 111 -26.5% 261 194 -25.7% 38 52 36.8%
Eureka 249 285 14.5% 196 380 93.9% 47 39 -17.0%
Humboldt 2,339 1,868 -20.1% 1,560 2,329 49.3% 125 227 81.6%
Lander 875 594 -32.1% 743 937 26.1% 74 101 36.5%
Lincoln 549 605 10.2% 966 1,045 8.2% 35 155 342.9%
Lyon 7,646 6,902 -9.7% 8,868 10,481 18.2% 867 1,496 72.5%
Mineral 796 441 -44.6% 913 865 -5.3% 119 147 23.5%
Nye 7,315 6,001 -18.0% 10,488 11,537 10.0% 860 1,867 117.1%
Pershing 780 657 -15.8% 926 962 3.9% 48 141 193.8%
Storey 889 981 10.3% 1,004 1,529 52.3% 917 105 250.0%
White 1,393 629 -54.8% 1,377 1,575 -14.4% 107 272 154.2%
Pine
Nevada 339,203 378,250 11.5% 344,490 467,738 35.8% 36,216 51,219 41.4%
Figure 3 demonstrates the shift between the three age categories of older Nevadans at a statewide level
between 2015 and 2025. It is significant to note while there is only a one percentage point change for
those 85 years and older over the decade, as a proportion of Nevada’s total population, the actual
numbers represent a growth from 36,216 people in 2015 to 51,219 in 2025.
FIGURE 3 OLDER NEVADAN POPULATION BY AGE: 2015 & 2025
NEVADA OFFICE OF FOOD SECURITY 8NUTRITION PROGRAMS FOR OLDER NEVADANS AND PRELIMINARY RECOMMENDATIONS
GENDER FIGURE 4 RACE/ETHNICITY OF OLDER NEVADANS AGES 55+ -
A nationwide trend shows 2015 (NEVADA, CLARK, WASHOE, AND BALANCE OF STATE)
older women tend to
outnumber older men as they
have a longer life expectancy.
Nevada follows this trend;
most older Nevadans (65 years and older) are
female and represent 53% of the older
Nevadan population, while males make up
47% of the population.
RACE/ETHNICITY
Figure 4 shows the breakdown of
race/ethnicity according to each age category
of older Nevadans. Nevada’s older population
is primarily White (71%), followed by Hispanic
(13%), and Asian or Pacific Islander (eight
percent).
Washoe County’s older population is primarily
White (82%), followed by Hispanic (nine
percent), and Asian or Pacific Islander (six
percent).
Clark County has the most diverse
racial/ethnic population in Nevada. Almost
two thirds (65%) are White, followed by
Hispanic (15%), and Asian (10%). Clark County
also has the highest percentage of older
Nevadans who are Black (nine percent).
The “balance of state” has the highest
percentage of older Nevadans who are White
(88%), followed by Hispanic (seven percent)
and American Indian (three percent).
Figure 5 on page 10 demonstrates among the
three categories of older Nevadans, the racial
make-up is largely White. This is especially
pronounced within the 85+ years age
category, in which 81% of individuals are
White. Individuals who are Hispanic are the
next largest ethnic group; they make up 16%
of the 55-64 years age group. There is some
NEVADA OFFICE OF FOOD SECURITY 9NUTRITION PROGRAMS FOR OLDER NEVADANS AND PRELIMINARY RECOMMENDATIONS
representation of Black and Asian or Pacific Islander within the three age categories. Individuals who are
American Indian represent only one percent within the three categories (14).
FIGURE 5 OLDER NEVADANS RACE BY AGE GROUP - 2015
Considering the projected increase in Nevada’s population and that by 2030 more than half of all
Americans are projected to belong to a minority group (any group other than non-Hispanic White), it is
anticipated the racial composition of older Nevadans will shift in the future (15) (6).
NEVADA OFFICE OF FOOD SECURITY 10NUTRITION PROGRAMS FOR OLDER NEVADANS AND PRELIMINARY RECOMMENDATIONS
HEALTH AND HEALTH CARE
Healthy People 2020 has identified several conditions which contribute to a strong health and health
care environment within the SDOH framework. Each of the conditions applicable to this study’s target
population are explored briefly with information specific to Nevada. Other determinants such as
disability status and chronic health conditions, which are not included in the Healthy People 2020
framework but that impact this category for Nevadans, are also presented.
MEDICAL COVERAGE Healthy People 2020 tracks the proportion of persons with medical
insurance and the proportion of persons with a usual primary care provider.
Figure 6 shows many older Nevadans in 2015 were covered by Medicare
(49%) or private insurance (44%). Medicaid covered a small percentage of
older Nevadans (seven percent), and less than one percent were uninsured
(16).
FIGURE 6 HEALTH INSURANCE COVERAGE FOR OLDER NEVADANS - 2015
In addition to health insurance coverage, another important indicator of
health is having a primary health care provider. In 2015, 90.9% of older
Nevadans (ages 65 years and older) reported they had either one or more
than one dedicated health care provider (17).
NEVADA OFFICE OF FOOD SECURITY 11NUTRITION PROGRAMS FOR OLDER NEVADANS AND PRELIMINARY RECOMMENDATIONS
CHRONIC HEALTH
CONDITIONS Chronic health conditions explored for this analysis include:
Disability
Obesity and Physical Activity
Self-Reported Health
Diabetes
DISABILITY
Disability is an important characteristic to consider when addressing food
insecurity for older Nevadans. According to the U.S. Census Bureau, over a
third of Nevadans ages 65 years and older had a disability in 2015 (36%).
Figure 7 depicts older Nevadans with any disability by county.
FIGURE 7 OLDER NEVADANS WITH ANY DISABILITY BY COUNTY - 2015
NEVADA OFFICE OF FOOD SECURITY 12NUTRITION PROGRAMS FOR OLDER NEVADANS AND PRELIMINARY RECOMMENDATIONS
Older Nevadans who are disabled may face mobility challenges which make
it difficult to leave their home; however, identifying and counting the
number of homebound seniors in Nevada is difficult. One strategy is to
utilize the Centers for Medicare and Medicaid Services’ (CMS) definition of
“confined to the home” to determine an estimate of homebound older
Nevadans. “Confined to the home” means having either a self-care or
independent living difficulty (18). In 2015, the number of older Nevadans
with either of those difficulties was 50,360 persons. Another potential
method for identifying homebound older Nevadans is to determine the
number who have an ambulatory disability (serious difficulty walking or
climbing stairs). In 2015, 59,920 (23%) older Nevadans (ages 65 years and
older) had an ambulatory difficulty (19), and it is likely many of these
individuals may be homebound.
Additionally, a requirement of the home delivered meals program (HDM) is
for clients to be demonstrably home-bound. In 2016, a total of 16,622 clients
(approximately four percent of the older Nevadan population) were served
through the HDM program in Nevada.1 This number is likely only a small
percentage of the actual population of homebound older Nevadans.
OBESITY & PHYSICAL ACTIVITY
The Centers for Disease Control and Prevention (CDC) administers the
Behavioral Risk Factors Surveillance System (BRFSS), which reports the
percentage of older adults with obesity and those who report no physical
activity within the past month. Both are indicators of poor nutritional health
status and may point to food insecurity risk.
Over a five-year period, the percentage of older Nevadans who are obese
increased for all age categories (Figure 8). The largest increase is
demonstrated in the category of those ages 50-54 years in which 25.6% were
obese in 2011, which increased to 37.2% in 2015.
1
A requirement of the program is for the individual to be homebound due to illness, disability, or geographic
isolation.
NEVADA OFFICE OF FOOD SECURITY 13NUTRITION PROGRAMS FOR OLDER NEVADANS AND PRELIMINARY RECOMMENDATIONS
FIGURE 8 BRFSS - PERCENT OF OLDER NEVADANS WHO ARE CURRENTLY OBESE
BMI OF 30 OR HIGHER
MORE)
The percentage of older Nevadans reporting no leisure time physical activity
varied among the age categories. Fewer Nevadans ages 50-54 and 65 years
and older reported having leisure time physical activity in 2015 as compared
to 2011 (Figure 9).
FIGURE 9 BRFSS - PERCENT OF OLDER NEVADANS WHO HAVE NOT HAD ANY LEISURE TIME
PHYSICAL ACTIVITY
NEVADA OFFICE OF FOOD SECURITY 14NUTRITION PROGRAMS FOR OLDER NEVADANS AND PRELIMINARY RECOMMENDATIONS
SELF-REPORTED HEALTH
Another data set in BRFSS which may indicate a risk of food insecurity is self-
reported
health: FIGURE 10 BRFSS - PERCENT OF OLDER NEVADANS REPORTING POOR
OR FAIR HEALTH: 2011-2015
Over a five-year
period, the
percentage of
older Nevadans
self-reporting
poor or fair
health
decreased for
all age groups,
except those
between the
ages of 50-54
years, which
increased by four percent.
DIABETES
BRFSS also includes a question regarding diabetes diagnosis.2 The
percentage of older Nevadans reporting a diabetes diagnosis decreased
slightly from 2011 to 2015 (Figure 11). However, the more notable finding is
the greater percentage of older Nevadans reporting diabetes in the 65 years
and older age FIGURE 11 BRFSS - PERCENT OF OLDER NEVADANS REPORTING
group as DIABETES DIAGNOSIS: 2011-2015
compared to
the other age
groups.
Because food
insecurity is
associated
with chronic
health
conditions
such as
obesity, fair
and poor
2
This question differs from the others, as it includes adults 45 and older.
NEVADA OFFICE OF FOOD SECURITY 15NUTRITION PROGRAMS FOR OLDER NEVADANS AND PRELIMINARY RECOMMENDATIONS
health, and diabetes (20) (21), these indicators from BRFSS may point to
older populations in Nevada who are at risk of becoming or are food
insecure.
When people experience difficulties accessing food, ensuring their food
selection fits with their diabetes or weight management regimen is even
more difficult. In addition, older Nevadans with health conditions such as
diabetes may find themselves in a situation with competing priorities such
as buying food while also purchasing medicine and supplies for treating
diabetes and managing other living expenses (21).
NEVADA OFFICE OF FOOD SECURITY 16NUTRITION PROGRAMS FOR OLDER NEVADANS AND PRELIMINARY RECOMMENDATIONS
SOCIAL AND COMMUNITY CONTEXT
Many of the conditions under Healthy People 2020 SDOH related to social and community context are
specific to younger populations or are outside the boundaries of this analysis. Presented below is the
one Healthy People 2020 SDOH condition that is applicable, which is social and emotional support. In
addition to the Healthy People 2020 data, the number of older Nevadans who live alone is also
presented to give a better sense of those who may be at risk of social and emotional isolation.
SOCIAL AND EMOTIONAL Studies have shown increased levels of social support are associated with
SUPPORT a lower risk for physical disease, mental illness, and death (22). Older
adults can be at high risk for suicide if they experience depression and
social isolation. In 2014, Nevada’s suicide rate for individuals ages 65 and
older was nearly double the national average (33 per 100,000 compared to
17 per 100,000 nationally) (23).
HOUSEHOLD U.S. Census Data shows in 2015 that 265,684 households in Nevada
CHARACTERISTICS included one or more people ages 65 years and older.
Older Nevadans who live alone are more likely to be isolated and lack
socialization. In 2015, 41.3 percent of Nevada’s older adult (ages 65 or
older) population lived alone. While this does not necessarily mean all
individuals living alone are isolated, it does put them at risk of loneliness.
Loneliness has been associated with earlier mortality, increases in
depressive symptoms, and greater than normal cognitive decline (24).
Older Nevadans, like many
others, prefer to “age in Table 2 depicts the number of older Nevadans who lived alone, by county,
place,” meaning stay in their in 2015.
homes and neighborhoods.
The extent to which older TABLE 2 PERCENT OF OLDER NEVADANS LIVING ALONE BY COUNTY – 2015
Nevadans can age in place
depends on their level of County Older Nevadans Living Alone
ability or disability, as well
as the availability and Number Percent
affordability of services, Carson City 5,350 53.4%
conveniences, and products
Clark 106,554 40.9%
that allow them to modify
their home environment to Douglas 3,439 30.9%
meet their health needs or Lyon 3,164 32.5%
to obtain services that allow
Nye 3,881 34.2%
them to remain in their
home (4). Washoe 27,476 45.3%
Churchill No data available
Elko No data available
Esmeralda No data available
Eureka No data available
Humboldt No data available
NEVADA OFFICE OF FOOD SECURITY 17NUTRITION PROGRAMS FOR OLDER NEVADANS AND PRELIMINARY RECOMMENDATIONS
Lander No data available
Lincoln No data available
Mineral No data available
Pershing No data available
Storey No data available
White Pine No data available
EDUCATION
Healthy People 2020’s SDOH characteristics for education are aimed at early intervention for youth and
are not applicable to older Nevadans. However, AARP’s study of food insecurity among older adults
demonstrates that food insecurity decreases consistently with education (25). Due to this association,
the educational attainment for this population is presented in this section.
EDUCATIONAL Like other older Americans, most older Nevadans (ages 65 years and older) had
ATTAINMENT their high school diploma in 2015 (84.4%). A smaller percentage of older
Nevadans had a Bachelor’s degree (23.5%) as compared to the US average of
24.1% (26).
FIGURE 12 EDUCATIONAL ATTAINMENT FOR OLDER NEVADANS AND US (65
AND OLDER) - 2015
NEVADA OFFICE OF FOOD SECURITY 18NUTRITION PROGRAMS FOR OLDER NEVADANS AND PRELIMINARY RECOMMENDATIONS
ECONOMIC STABILITY
Economic stability can impact a person’s health. Healthy People 2020 measures this characteristic by
examining the proportion of persons living in poverty, the proportion of households experiencing
housing cost burden (including those who spend more than 30% and more than 50% of their income on
housing), and food insecurity.
This section will present data on the number of older Nevadans living in poverty, housing cost burden,
and food insecurity. While not part of the Healthy People 2020 framework, it will also include data on
employment and income for older Nevadans.
ECONOMIC Economic characteristics explored for this study include:
CHARACTERISTICS Food Insecurity
Labor Force
Poverty
Household Income
Social Security Income
Supplemental Security Income
FOOD INSECURITY AND NUTRITION BEHAVIORS
One in seven older Nevadans ages 60 years and older (14.8%) were estimated to
be food insecure in 2016 (27). Studies have documented the link between food
insecurity and poor health. Food insecurity is a strong predictor of poor health
and disease, such as heart disease, stroke, lung disease, and diabetes, and
impacts the ability of the individual to age in place (3).
14.8% or 1 in 7 older Nevadans (ages 60 and older) were food
insecure in 2016 (27)
The nutrition behaviors of older Nevadans may be an indicator of their food
security. BRFSS includes data on fruit and vegetable consumption and shows
over a four-year period, the percentage of older Nevadans indicating they
consumed the recommended daily servings of fruits decreased in all age
populations (Figure 13).
NEVADA OFFICE OF FOOD SECURITY 19NUTRITION PROGRAMS FOR OLDER NEVADANS AND PRELIMINARY RECOMMENDATIONS
FIGURE 13 BRFSS - PERCENT OF OLDER NEVADANS WHO CONSUME 2 OR MORE
FRUITS DAILY: 2011-2015
Conversely, BRFSS data shows over the same four-year period, the percentage of
older Nevadans indicating they consumed the recommended daily servings of
vegetables increased slightly in all age populations, with the exception of the 55-
59 years age group, in which it remained unchanged (Figure 14).
FIGURE 14 BRFSS - PERCENT OF OLDER NEVADANS WHO CONSUME 3 OR MORE
VEGETABLES DAILY: 2011-2015
NEVADA OFFICE OF FOOD SECURITY 20NUTRITION PROGRAMS FOR OLDER NEVADANS AND PRELIMINARY RECOMMENDATIONS
Nevada 2-1-1 is an information and referral resource available statewide to all
residents. 2-1-1 services include identifying places to find emergency food,
providing information on housing and emergency shelter locations, support for
older Nevadans and people with disabilities, and mental health and counseling
services, among many others.
In FY 2016-2017, 2-1-1 received a total of 10,821 calls from Nevadans ages 55
years and older and provided a total of 58,664 referrals. 2-1-1 typically provides
callers with multiple referrals for each requested service. The majority of
referrals were for basic needs, including food (5,177 referrals), housing and
shelter (12,000 referrals), utilities (6,078 referrals), and transportation (3,188).
Raising grandchildren is a trend more older adults in the U.S. are facing. AARP
conducted a study about grand families and found that one in 10 grandparents
have grandchildren living in their home and 43% indicated they are the primary
caregiver of at least one grandchild. The cost of raising a child can be
burdensome to an older adult who may already be living on a fixed income, and
is now incurring additional expenses such as food, housing, healthcare, school
expenses, childcare, and clothing (28).
In Nevada, 25,653 grandparents are responsible for grandchildren who live with
them. Of these:
6,695 (26.1%) do not have the child’s parents present
4,284 (16.7%) are in poverty
5,886 (23.0%) of the grandparents have a disability (29)
LABOR FORCE
The U.S. has seen an increase in the number of older Americans, ages 65 years
and older, working in the labor force (30). Eighteen percent of older Americans
were employed in the labor force in 2015.
Figure 15 shows there are fewer older adults employed in the labor force in
Nevada compared to the national rate. Only 16% of older Nevadans were active
in the labor force in 2015. Most of Nevada’s older adult population (83%) was
not active in the labor force (19). This proportion is forecasted to change as
retirement ages are delayed for Social Security benefits to 67 and 70 years of
age.
NEVADA OFFICE OF FOOD SECURITY 21NUTRITION PROGRAMS FOR OLDER NEVADANS AND PRELIMINARY RECOMMENDATIONS
FIGURE 15 EMPLOYMENT STATUS FOR OLDER NEVADANS AND U.S. ADULTS 65 YEARS
AND OLDER - 2015
Employment rates when broken into age categories are presented in Table 3:
TABLE 3 NUMBER AND PERCENT OF EMPLOYED OLDER NEVADANS
Age Employed Older Nevadans
Number Percent
55-59 109,460 65.0%
60-64 77,075 49.7%
65-69 33,735 27.3%
The Senior Community Service Employment Program (SCSEP) is the nation's
oldest program to help low-income, unemployed individuals ages 55 years and
older find work. AARP Foundation first matches eligible older job seekers with
local nonprofits and public agencies so they can increase skills and build self-
confidence, while earning a modest income. Based on their employment
interests and goals, participants may also receive supportive services and skills
training through an educational institution. Their SCSEP experience most often
leads to permanent employment (31). Wages earned through SCSEP are exempt
from income eligibility determinations for federal housing programs and SNAP
(32).
In Fiscal Year (FY) 2016-17, SCSEP had a total of 188 participants and 23
vacancies in Nevada. These participants provided a total of 135,922 hours, or
724 hours per participant worked, in service to the general community (33).
NEVADA OFFICE OF FOOD SECURITY 22NUTRITION PROGRAMS FOR OLDER NEVADANS AND PRELIMINARY RECOMMENDATIONS
POVERTY
The U.S. Census Bureau uses a set of income thresholds varying by family size
and composition to determine who is in poverty. If a family’s total income is less
than the family’s threshold, then that family and every individual in it is
considered in poverty (34).
Poverty guidelines are the other version of the federal poverty measure. The
guidelines are issued each year in the Federal Register by the U.S. Department of
Health and Human Services. The guidelines are a simplification of the poverty
thresholds used for administrative purposes — for instance, determining
financial eligibility for certain federal programs. In 2017, the guideline for a one-
person household was $12,060 per year ($1,005 per month) and was $16,240
per year ($1,353 per month) for a two-person household (35).
In 2015, 8.4% of older Nevadans (ages 65 years and older) lived below 100% FPL,
which is slightly lower than the U.S. rate of 9.4% (27). An additional 10.1% of
older Nevadans lived between 100% to 149% FPL. The percentage of older
Nevadans living in poverty varies by county, with some counties experiencing
much higher levels. Table 4 shows the percent of older Nevadans living below
100% FPL and between 100-149% FPL by county:
TABLE 4 PERCENT OF OLDER NEVADANS LIVING IN POVERTY - 2015
County Older Nevadans Below Older Nevadans between
100% Poverty 100-149% poverty level
Number Percent Number Percent
Carson City 982 9.8% 1,433 14.3%
Clark 22,926 8.8% 25,531 9.8%
Douglas 555 5.0% 810 7.3%
Lyon 234 7.4% 964 9.9%
Nye 1,021 9.0% 1,350 11.9%
Washoe 4,610 7.6% 6,551 10.8%
Total 31,979 8.4% 38,451 10.1%
Nevada*
Total US 4,493,200 9.4% 5,066,800 10.6%
Churchill No data available
Elko No data available
Esmeralda No data available
Eureka No data available
Humboldt No data available
NEVADA OFFICE OF FOOD SECURITY 23NUTRITION PROGRAMS FOR OLDER NEVADANS AND PRELIMINARY RECOMMENDATIONS
Lander No data available
Lincoln No data available
Mineral No data available
Pershing No data available
Storey No data available
White Pine No data available
*Total for Nevada is the entire state, including those where county-level data is not
available.
HOUSEHOLD INCOME
The median household earnings for older Nevadans, ages 65 years and older, in
2015 was $50,195, slightly lower than the overall median income for all ages in
Nevada ($51,847). Older Nevadans earned more income compared to the U.S.
average for households with adults ages 65 years and older who earned $47,432
in 2015 (36).
SOCIAL SECURITY INCOME
The Old Age, Survivors and Disability Insurance program (OASDI, and more
commonly known as Social Security) is a major source of income for most older
Americans, as nine out of ten individuals ages 65 years and older receive Social
Security benefits.
In Nevada, 86.2% of individuals ages 65 years and older received OASDI benefits
in 2015 (14).
SUPPLEMENTAL SECURITY INCOME
Supplemental Security Income (SSI) is a cash assistance program providing
monthly benefits to low-income aged, blind, or disabled persons.
The Social Security Administration 2015 data indicates 26% of those receiving SSI
are older Nevadans ages 65 years or older (37). Of the disabled older Nevadan
population (137,054 in 2015), it is estimated only 10% receive SSI.
Figure 16 displays a map detailing the percent of the senior population receiving
SSI by county.
NEVADA OFFICE OF FOOD SECURITY 24NUTRITION PROGRAMS FOR OLDER NEVADANS AND PRELIMINARY RECOMMENDATIONS
FIGURE 16 OLDER NEVADANS WITH SSI: 2015
HOUSING Older adults have a variety of housing choices. Senior retirement communities,
age-restricted apartments, manufactured housing communities, assisted living
facilities, congregate housing, skilled nursing facilities, residential group homes,
and low-income housing units give seniors a variety of options depending on
their physical health and economic circumstances (6).
Despite such variety, Nevada’s ongoing affordable housing shortage has limited
the options for older adults. The shortage for extremely low income (ELI) renters
NEVADA OFFICE OF FOOD SECURITY 25NUTRITION PROGRAMS FOR OLDER NEVADANS AND PRELIMINARY RECOMMENDATIONS
of all ages is 15 affordable and available homes for every 100 ELI households
(38). This shortage is more pronounced for the older Nevadan population.
The Nevada Housing Division’s 2016 Annual Affordable Apartment Survey
identified that out of all the low-income housing tax credit (LIHTC) properties in
Nevada reported, only 39 percent were either senior or senior/disabled units
(9,223). These senior units had an average vacancy rate of 2.3 percent (about
212 vacant units). The low availability of affordable senior housing and low
vacancy rates puts a burden on older Nevadans and increases their risk of food
insecurity.
The cost of housing can burden households, especially those of older adults who
may be on a fixed income. Households paying more than 30% of their income for
housing are considered cost burdened and may have difficulty affording
necessities such as food, clothing, transportation, and medical care (39).
In 2013, 44% of older Nevadans were burdened with the cost of
housing, in that more than 30% of their income was spent on housing.
Another 19.5% of older Nevadans were very burdened with the cost of
housing, in that more than 50 percent of their income was spent on
housing (16).
Some nonprofit organizations in Nevada, such as Nevada HAND, have programs
available for older adults where no more than 30 percent of their income is
spent on rent.
Over 24,000 low-income households in Nevada used federal rental assistance in
2016 to rent housing at an affordable cost. Approximately 32% of these were
older Nevadan households (40).
The Southern Nevada, Rural Nevada, and Reno Housing Authorities administer
voucher programs for which older Nevadans may be eligible. These are:
Public Housing – Provides decent and safe rental housing for eligible
low-income families, older adults, and persons with disabilities.
Housing Choice Voucher Program (Section 8) – a Federal program for
assisting low and very low-income families, older adults, and the
disabled to afford decent, safe, and sanitary housing (that they choose)
in the private market.
In addition to the rental assistance and voucher programs, the Housing
Authorities in Nevada also own several developments designated for older
adults.
Southern Nevada Regional Housing Authority has six (6) designated
developments for older adults, four (4) designated older adult/disabled
NEVADA OFFICE OF FOOD SECURITY 26You can also read