Population Genetic Structure and Gene Expression Plasticity of the Deep-Sea Vent and Seep Squat Lobster Shinkaia crosnieri - Frontiers
←
→
Page content transcription
If your browser does not render page correctly, please read the page content below
ORIGINAL RESEARCH
                                                                                                                                     published: 02 November 2020
                                                                                                                                  doi: 10.3389/fmars.2020.587686

                                            Population Genetic Structure and
                                            Gene Expression Plasticity of the
                                            Deep-Sea Vent and Seep Squat
                                            Lobster Shinkaia crosnieri
                                            Yao Xiao 1† , Ting Xu 1,2† , Jin Sun 1 , Yan Wang 1 , Wai Chuen Wong 1 , Yick Hang Kwan 1 ,
                                            Chong Chen 3 , Jian-Wen Qiu 2* and Pei-Yuan Qian 1*
                                            1
                                              Department of Ocean Science and Hong Kong Branch of the Southern Marine Science and Engineering Guangdong
                                            Laboratory (Guangzhou), The Hong Kong University of Science and Technology, Hong Kong, China, 2 Department of Biology,
                                            Hong Kong Baptist University, Hong Kong, China, 3 X-STAR, Japan Agency for Marine-Earth Science and Technology
                           Edited by:       (JAMSTEC), Yokosuka, Japan
                          Yong Wang,
        Institute of Deep-Sea Science
        and Engineering (CAS), China        Shinkaia crosnieri (Decapoda: Munidopsidae) is a squat lobster that dominates both
                     Reviewed by:           deep-sea hydrothermal vent and methane seep communities in the Western Pacific.
                     Yong-Jin Won,
                                            Previous studies comparing S. crosnieri living in these two types of habitats have
            Ewha Womans University,
                        South Korea         suffered from methodological and/or sample size limits. Here, using transcriptome-wide
                     Yun-wei Dong,          single nucleotide polymorphisms (SNPs) markers from 44 individuals of S. crosnieri,
             Xiamen University, China
                                            we reveal the extent of genetic connectivity between a methane seep population
                   *Correspondence:
                         Jian-Wen Qiu       in the South China Sea and a hydrothermal vent population in the Okinawa
                    qiujw@hkbu.edu.hk       Trough, as well as their signatures of local adaptation. Analysis of differentially
                         Pei-Yuan Qian
                                            expressed genes (DEGs) between these two populations and population-specific
                      boqianpy@ust.hk
     † These   authors have contributed
                                            genes (PSGs) revealed that a large number of unigenes, such as cytochrome
                    equally to this work    P450 (CYP), glutathione S-transferase (GST) and peroxiredoxin 6 (Prdx6) related to
                                            oxidoreductase, and sulfur dioxygenase (ETHE1) and chondroitin 4-sulfotransferase
                   Specialty section:
         This article was submitted to
                                            11 (CHST11) related to sulfur metabolism, showed opposite expression patterns in
            Marine Molecular Biology        these two populations. Data subsampling in this study revealed that at least five
                          and Ecology,
                                            individuals of S. crosnieri per site are required to generate reliable results from the
               a section of the journal
          Frontiers in Marine Science       differential gene expression analysis. Population genetic analyses based on 32,452
            Received: 27 July 2020          SNPs revealed clear genetic differentiation between these two populations with an
      Accepted: 22 September 2020           FST value of 0.07 (p < 0.0005), and physical oceanographic modeling of the ocean
      Published: 02 November 2020
                                            currents in middle and deep layers also suggests a weak connection between
                             Citation:
         Xiao Y, Xu T, Sun J, Wang Y,
                                            these two sites. Analysis of outlier SNPs revealed 345 unigenes potentially under
      Wong WC, Kwan YH, Chen C,             positive selection, such as sarcosine oxidase/L-pipecolate oxidase (PIPOX), alanine-
        Qiu J-W and Qian P-Y (2020)
                                            glyoxylate transaminase/serine-glyoxylate transaminase/serine-pyruvate transaminase
        Population Genetic Structure
and Gene Expression Plasticity of the       (AGXT), and Cu-Zn superoxide dismutase (SOD1). Among the differentially expressed
    Deep-Sea Vent and Seep Squat            genes and genes with amino acid substitutions between the two sites are those related
           Lobster Shinkaia crosnieri.
           Front. Mar. Sci. 7:587686.
                                            to oxidation resistance and xenobiotic detoxification, indicating local adaptation to
   doi: 10.3389/fmars.2020.587686           the specific environmental conditions of each site. Overall, exploring the population

Frontiers in Marine Science | www.frontiersin.org                                1                                      November 2020 | Volume 7 | Article 587686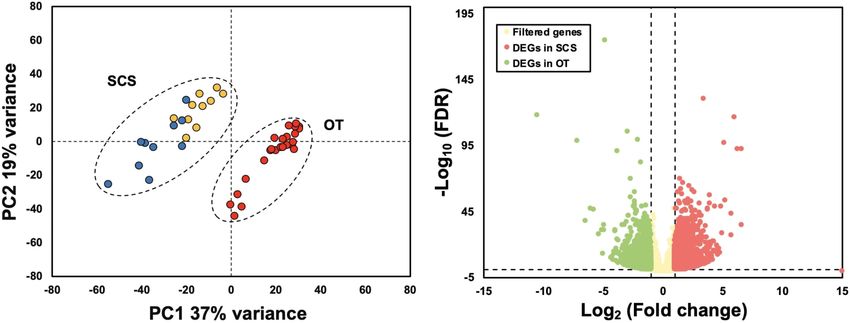
Xiao et al.                                                                                                Population Connectivity and Deep-Sea Adaptation

                                            structure of S. crosnieri using transcriptome-wide SNP markers resulted in an improved
                                            understanding of its molecular adaptation and expression plasticity in vent and
                                            seep ecosystems.
                                            Keywords: deep sea, gene expression, population connectivity, RNA-seq, single-nucleotide polymorphism

INTRODUCTION                                                                     or three mitochondrial genes (COI, cytochrome b gene (Cytb),
                                                                                 and 16S rRNA) (Shen et al., 2016) have revealed clear genetic
Deep-sea hydrothermal vents, often distributed along active mid-                 differentiation between a methane seep population in the SCS
ocean ridges and back-arc spreading centers, are well known                      and hydrothermal vent populations in the OT. Nevertheless, due
for discharging sulfur-rich geofluids into the water column                      to limited genomic coverage, a single to a few gene markers can
(Corliss et al., 1979; German et al., 2000). Methane seeps, usually              hardly reflect the population divergence at the genome level and
found along the continental margins and in trenches, typically                   do not allow for the effective discovery of signatures of natural
release methane-rich geofluids from the seabed more slowly (Van                  selection. Genome-wide single-nucleotide polymorphism (SNP)
Dover et al., 2002). These two types of ecosystems share some                    markers have the potential to resolve these issues (Xu et al., 2012).
similar features, such as lack of light to support photosynthesis,               Recently, Cheng et al. (2020) obtained 12,963 genome-wide SNPs
high pressure, and high concentration of chemically reduced                      using restriction site associated DNA sequencing (RAD-Seq). By
compounds as well as heavy metals (Levin, 2005; German et al.,                   using these markers, they also revealed clear genetic divergence
2011). Nevertheless, a great number of macrobenthos flourish                     between a seep population of S. crosnieri in the SCS and a
in these ‘extreme’ environments, forming high-biomass hotspots                   vent population in the OT. Nevertheless, RAD-Seq can only
powered by chemosynthesis in the deep ocean. Over 700 species                    capture a reduced representation of the genome, and numerous
of macrobenthos have been recorded in the global hydrothermal                    SNP markers are located in non-coding regions (Pegadaraju
vents and more than 600 in the methane seeps (German et al.,                     et al., 2013; Houston et al., 2014). Indeed, Cheng et al. (2020)
2011). However, only a small fraction of them inhabit both                       identified 54 outlier SNPs potentially under positive selection,
hydrothermal vents and methane seeps (Watanabe et al., 2010;                     but only five were in the protein-coding regions. More recently,
Vrijenhoek, 2013), indicating that thriving in both types of                     Cheng et al. (2019) compared the transcriptomes of S. crosnieri
environments requires specific adaptation and gene expression                    collected from the same seep and vent populations, but with
(Watanabe et al., 2010).                                                         only three individuals from each population. They detected 545
   The Western Pacific is an ideal region for a comparative                      differentially expressed genes (DEGs) and 82 protein-coding
study of vent and seep populations due to their close proximity                  genes (PCGs) that have potentially undergone positive selection.
and the presence of 20% of all the recorded macrobenthos                         However, the small sample size may have limited the statistical
in both types of habitats (Watanabe et al., 2010). Kiel (2016)                   power for the detection of DEGs and PCGs.
reported the Western Pacific as having the highest number of                        In the present study, we sequenced the transcriptomes of a
active, sedimentary back-arc vents in the world, which might                     total of 44 S. crosnieri individuals, including 20 from a methane
provide a vital biogeographic link between vent and seep animals.                seep in the SCS and 24 from a hydrothermal vent in the OT.
Previous population genetic studies of deep-sea macrobenthos in                  We identified DEGs between the two populations, population-
the Western Pacific have mainly focused on macrobenthos with                     specific genes (PSGs), transcriptome-wide SNP markers, and
a planktotrophic larval stage, such as bathymodioline mussels                    outlier SNP markers. We also conducted subsampling analyses
(Kyuno et al., 2009; Miyazaki et al., 2010; Xu et al., 2017,                     to determine the number of individuals required to generate
2018) and the deep-sea limpet Shinkailepas myojinensis (Yahagi                   representative data for a meaningful population comparison. Our
et al., 2017). In this study, we aim to understand the population                results not only provide new insights into the local adaptation
connectivity and local environmental adaptation of the squat                     and population genetics of S. crosnieri inhabiting both types
lobster Shinkaia crosnieri (Decapoda: Munidopsidae), whose                       of habitats, but also demonstrate how different techniques and
larvae are lecithotrophic and likely have a limited dispersal ability            sample sizes may affect these results.
(Nakajima et al., 2018). Shinkaia crosnieri was initially discovered
on the Edison Seamount vent field in the Bismarck Archipelago
(Baba and Williams, 1998), and was later found in methane seeps                  MATERIALS AND METHODS
in the South China Sea (SCS) and hydrothermal vents in the
Okinawa Trough (OT), with a known bathymetric range between                      Sample Collection
700 and 2,200 m (Chan et al., 2000; Watanabe et al., 2010;                       A total of 44 S. crosnieri individuals were used in this study.
Miyazaki et al., 2017a). The distribution pattern of S. crosnieri                Among them, 10 were collected by the manned submersible
in terms of both habitat types and life-history trait makes it a                 Jiaolong from Jiaolong Ridge (also known as the F site), a
suitable model for studies of population divergence and local                    methane seep (22◦ 06.9210 N, 119◦ 17.1310 E; 1,122 m deep) in the
adaptation under different environmental conditions.                             SCS in June 2013. Another set of 10 individuals were collected
   Previous studies of S. crosnieri using the mitochondrial                      using the remotely operated vehicle (ROV) ROPOS on board
cytochrome c oxidase submit I (COI) gene (Yang et al., 2016)                     the research vessel (R/V) Tan Kah Kee from the same site in

Frontiers in Marine Science | www.frontiersin.org                            2                                   November 2020 | Volume 7 | Article 587686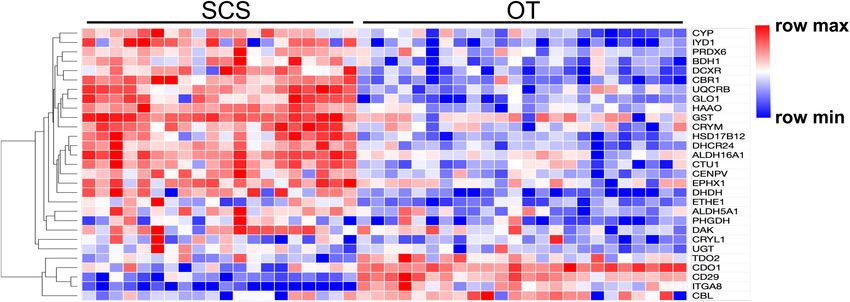
Xiao et al.                                                                                                Population Connectivity and Deep-Sea Adaptation

April 2018. In addition, 24 individuals were collected using the            10−5 and the online annotation KAAS-KEGG server3 applying
ROV KAIKO (with vehicle Mk-IV) from the Sakai hydrothermal                  the single-directional best hit method was used to search
field (27◦ 31.47490 N, 126◦ 59.0210 E; 1,550 m deep) (Nakamura              for the Kyoto Encyclopedia of Genes and Genomes (KEGG)
et al., 2015) in the OT during the Japan Agency for Marine-Earth            annotation.
Science and Technology (JAMSTEC) R/V Kairei cruise KR15-17
in November 2015. Samples were frozen at −80◦ C upon recovery               Differentially Expressed Genes (DEGs)
or fixed with RNAlater, and then shipped to the laboratory and              and Population-Specific Genes (PSGs)
stored at −80◦ C until use.
                                                                            Analyses
                                                                            Kallisto (Bray et al., 2016) was used to quantify abundances of
RNA Extraction and Sequencing
                                                                            the assembled unigenes with a bootstrap value of 100. The gene
The gill, hepatopancreas, ovary, and abdominal muscle from
                                                                            expression level in transcripts per kilobase million (TPM) was
one vent individual (OT_1), testis, and abdominal muscle from
                                                                            further normalized with the TMM method in edgeR (Robinson
another vent individual (OT_2) and the abdominal muscles of
                                                                            et al., 2010). The correlation between individuals and normalized
the other 42 individuals (from SCS_1 to 20 and OT_3 to 24) were
                                                                            TPM was determined by principal component analysis (PCA)
dissected for total RNA extraction using the TRIzol kit (Thermo
                                                                            implemented in the R package DESeq2 (Love et al., 2014). Genes
Fisher Scientific, United States) according to the manufacturer’s
                                                                            without expression were removed, and the average TPM of each
protocol. The quantity and quality of RNA were examined using
                                                                            contig was calculated individually within each sampling site. The
1% agarose gel electrophoresis and NanoDrop 2000 (Thermo
                                                                            Differential expression analysis was conducted via the web portal
Fisher Scientific, United States), respectively. RNA libraries were
                                                                            RNA-seq 2G (Zhang et al., 2017) using the DESeq2 method with
constructed individually and sequenced on an Illumina HiSeq
                                                                            a minimal read count of 10. Unigenes with an absolute value of
2500 platform (PE150) by Novogene Bioinformatics Technology
                                                                            fold change greater than 2 and a false discovery rate (FDR) less
Co., Ltd., Beijing, China1 .
                                                                            than 0.05 were considered as DEGs. Partial DEGs were visualized
                                                                            by Morpheus4 .
Transcriptome Assembly, Completeness                                            Quantitative real-time reverse transcription-PCR (qRT-PCR)
Assessment, and Functional Annotation                                       was performed to validate the expression levels of selected genes.
The quality of raw sequencing data was controlled using                     Primers for qRT-PCR were designed utilizing the online NCBI
FASTQC2 and filtered using TRIMMOMATIC v.0.36 (Bolger                       Primer-BLAST tool5 with sequences given in Supplementary
et al., 2014). The parameters were leading: 10; trailing: 10; sliding       Table 1. Total RNA of two individuals (SCS_23 and OT_3)
window: 4:15; minlen: 25, and adapters: ILLUMINACLIP:                       were extracted with the TRIzol kit (Thermo Fisher Scientific,
TruSeq3-PE.fa:2:30:10. The resultant clean reads of the                     United States) and reverse transcription from RNA to single-
four tissues from OT_1, testis from OT_2 and abdominal                      stranded cDNA was conducted using the High Capacity
muscle from SCS_3 (with maximum sequence data size                          cDNA Reverse Transcription Kit (Thermo Fisher Scientific,
of SCS individuals) were de novo assembled using Trinity                    United States). The SYBR Green PCR Master Mix (Thermo
v.2.8.3 (Grabherr et al., 2011) under default settings except               Fisher Scientific, United States) was utilized with synthesized
the min_contig_length parameter was set to 300 and the                      cDNA to conduct qPCR reaction on a LightCycler 480
min_kmer_cov was set to 2. The longest isoform of each                      Instrument II (Roche, Switzerland). The relative fold change in
gene cluster was selected using a custom Python script as a                 the expression of selected genes was calculated by the 2−11Ct
unigene. CD-HIT-EST (Fu et al., 2012) was used to remove                    method using actin as an internal standard gene. The correlation
redundant unigenes based on a similarity threshold of 95%.                  coefficient (r2 ) between expression of qRT-PCR and that of RNA-
TransDecoder v.5.5.0 (Haas et al., 2013) was then applied                   Seq was analyzed in Excel.
to predict candidate open reading frames (ORFs) with the                        Gene Ontology enrichment analysis of DEGs was performed
single_best_only option. BUSCO v.3.0 (Simão et al., 2015)                   with Fisher’s Exact Test in OmicsBox v1.3.116 . KEGG pathway
was utilized to evaluate the completeness of the final assembly             enrichment analysis was performed via Enrichr (Chen et al.,
based on the metazoa_odb9 database, and the Perl script                     2013). In both enrichment analyses the significant enrichment
assemblathon_stats.pl (Bradnam et al., 2013) was run to evaluate            level was set to 0.05.
the final assembly. The transcriptome from each individual was                  The transcriptome data for individuals collected from the
also assembled separately using the same Trinity parameters and             two sampling sites were compared, adopting the same Kalisto
CD-HIT was applied thereafter.                                              and RNA-seq 2G parameters as mentioned above. The groups
    All obtained unigenes were searched against the NCBI                    of orthologous genes of each individual transcriptome were
non-redundant (NR) protein database using BLASTp v.2.7.1                    detected using Proteinortho v.6.0b (Lechner et al., 2011). PSGs
(Altschul et al., 1990) with an E-value of 10−5 , a word size               were defined as the unigenes shared among at least 90% of
of 3, a minimum alignment of 20, and max hsps of 20, and                    the individuals from one site but among less than 10% of the
the resultant .xml file was fed into OmicsBox (Götz et al.,                 individuals from the other site (Parra et al., 1998; Belcaid et al.,
2008) to search for the Gene Ontology (GO) function. The
                                                                            3
UniProt database was scanned using BLASTp with an E-value of                  https://www.genome.jp/kegg/kaas/
                                                                            4
                                                                              https://software.broadinstitute.org/morpheus/
1                                                                           5
    www.novogene.com                                                          https://www.ncbi.nlm.nih.gov/tools/primer-blast/
2                                                                           6
    https://www.bioinformatics.babraham.ac.uk/projects/fastqc/                https://www.biobam.com/download-omicsbox/

Frontiers in Marine Science | www.frontiersin.org                       3                                        November 2020 | Volume 7 | Article 587686
Xiao et al. Population Connectivity and Deep-Sea Adaptation
2019). PSGs were annotated according to the NCBI NR and Detection and Annotation of Outlier
KEGG databases. The KEGG pathway of PSGs was reconstructed SNPs
using KEGG Mapper7 .
Two methods were adopted to detect outlier SNPs. First, a
Statistical power of different sample sizes used for
coalescent method implemented in Arlequin v.3.5 (Excoffier and
the identification of DEGs was tested by a subsampling
Lischer, 2010) was used for outlier detection by running 20,000
approach. In brief, a total of 3, 5, 10, and 15 individuals
simulations with 100 simulated demes per group, and SNPs with
were randomly selected from each habitat to identify DEGs
a p-value < 0.05 were considered as the Arlequin outliers. Second,
using the methods detailed in this section. Afterward,
a multivariate analysis was implemented in the R package pcadapt
comparison was conducted to determine an appropriate
(Luu et al., 2017) for outlier identification, and SNPs with an
sample size for the reliable DEGs. In addition, DEGs obtained
adjusted p-value < 0.1 from the Benjamini–Hochberg procedure
in our study were also compared with those reported in
were considered as the pcadapt outliers. Outliers detected by
Cheng et al. (2019).
both methods were retained and used for GO enrichment and
KEGG enrichment analyses using the same approaches described
Identification of Transcriptome-Wide in the Section “Differentially Expressed Genes and Population-
SNP Markers Specific Genes”.
Raw reads of each individual were trimmed using Trimmomatic
v.0.36 (see section “Transcriptome Assembly, Completeness Population Genetic Analyses Based on
Assessment, and Functional Annotation” for the settings). the Entire and the Outlier SNP Dataset
Filtered reads of each individual were mapped to the assembled and Physical Oceanographic Modeling
transcriptome using Bowtie2 (Langmead and Salzberg, 2012)
Genetic differentiation was evaluated using the pairwise Fst
with a maximum fragment length of 1,200 (–maxins 1200), a
statistic via Arlequin v.3.5.2.2 with the default settings based on
seed of 20 (−D 20), re-seed reads twice (−R 2), a mismatch
both the entire and the outlier SNP datasets. Population structure
number of 1 (−N 1), a seed length of 18 (−L 18), and an
was examined using the maximum-likelihood estimation method
interval between seeds of S,1,0.50. The generated .sam files were
implemented in ADMIXTURE v1.3 (Alexander et al., 2009) and
converted to the .bam format and sorted by SAMtools v.1.8
PCA implemented in the R package SNPRelate (Zheng et al.,
(Li et al., 2009). PCR duplicates were removed using Picard
2012) using single SNP per locus of both the entire and the outlier
MarkDuplicates8 . Then, the mpileup function implemented
SNP datasets. The .ped, .map, and .bed format files (Alexander
in SAMtools was applied to generate .bcf files with the
et al., 2015) required by the ADMIXTURE analysis were
following settings: 10 for minimum mapping quality for an
transformed based on the combined .vcf file of all the individuals
alignment (−q 10) and 20 for minimum base quality (−Q
using PLINK v.2.00a2LM (Purcell et al., 2007) with the –allow-
20). SNPs were identified using the call function implemented
extra-chr option. The number of ancestral populations (i.e., the
in BCFtools v.1.9 (Li, 2011) with the default settings along
K value) in ADMIXTURE was predefined from 1 to 3. When
with the options −mv and −Ov. The obtained .vcf file
K was set to 2, the divergence was between sites. Population
for each individual was then sorted using VCFtools v.0.1.13
structure was visualized using the function bar plot in R based
(Danecek et al., 2011) and the .vcf files of all the individuals
on the best K value. The relative migration pattern of all samples
were combined into a single file using the merge function
was estimated via divMigrate in the R package diveRsity (Keenan
in BCFtools v.1.9.
et al., 2013) using the DJost statistic as a measure of genetic
Filtering of SNPs was carried out using VCFtools v.0.1.13 with
distance and a bootstrap value of 1,000. To validate population
the following criteria: (1) retaining only bi-allelic sites (–min-
genetics results against physical oceanographic model of larval
alleles 2 –max-alleles 2); (2) with a minor allele frequency (MAF)
drift, we inferred the annual-mean lateral ocean currents from
greater than or equal to 0.02 (–maf 0.02); (3) excluding sites with
the HYCOM + NCODA Global 1/12◦ Reanalysis (experiment
indels (–remove-indels); (4) excluding sites not conforming to
sequence: 53.X) data9 , which has assimilated multiple sources of
Hardy–Weinberg equilibrium with a p-value threshold of 0.01;
available observational records of the ocean.
(5) retaining SNPs successfully genotyped in at least 50% of all
individuals (–max-missing 0.5); and (6) retaining SNPs with a
sequencing depth greater than 3 and less than 120 (–minDP 3 RESULTS
and –maxDP 120).
Statistical power of different sample sizes selected to identify
Transcriptome Assembly, Completeness,
SNPs was tested via a subsampling approach as well. In brief,
a total of 3, 5, and 10 individuals were randomly selected from and Annotation
each habitat to identify SNPs using the methods described above. A total of 3.93 Gb of paired-end clean reads of abdominal
Afterward, the SNP numbers were compared to evaluate the muscle from one SCS individual (SCS_3) and 10.96 Gb of paired-
impact of sample sizes on SNP detection. end clean reads of five tissues (gill, ovary, abdominal muscle,
hepatopancreas, and testis) from two OT individuals (OT_1 and
OT_2) (Supplementary Table 2) were obtained after quality
7
https://www.genome.jp/kegg/tool/map_pathway.html
8 9
http://picard.sourceforge.net https://www.hycom.org/
Frontiers in Marine Science | www.frontiersin.org 4 November 2020 | Volume 7 | Article 587686Xiao et al. Population Connectivity and Deep-Sea Adaptation
FIGURE 1 | (A) Principal component analysis (PCA) based on gene expression matric of all individuals shows complete separation between individuals from the
South China Sea (SCS) and the Okinawa Trough (OT). Red dots indicate samples collected from the OT, and yellow and blue dots indicate samples collected from
SCS in 2013 and 2018, respectively. (B) Relationship between FDR and fold change. Red and green dots represent up-regulated genes in the SCS and the OT,
respectively. Yellow dots indicate non-DEGs. Vertical dotted lines: log2 (Fold change) = 1 and –1; horizontal dotted line: –log10 (FDR) = 0.05.
control and were used for transcriptome reference assembly. metabolism’ (ko00640), ‘spliceosome’ (ko03040), and ‘focal
The detailed sequencing statistics of the abdominal muscle from adhesion’ (ko04510). Meanwhile, 13 OT-PSGs were mapped to 26
these individuals are summarized in Supplementary Table 3. De KEGG pathways, such as ‘drug metabolism – cytochrome P450’
novo assembly and data filtering resulted in 29,273 unigenes. The (ko00982), ‘peroxisome’ (ko04146), and ‘glycosaminoglycan
assembled transcriptome had a contig N50 of 2,690 bp and a biosynthesis - chondroitin sulfate/dermatan sulfate’ (ko00532).
mean contig size of 1,615 bp. The contig length ranged from 301 Results of PCA based on the unigene expression matric
to 29,765 bp. BUSCO analysis revealed that the transcriptome revealed that all the SCS seep individuals were separated from all
contained 89.7% complete plus 3.1% fragmented conserved the OT vent individuals along the first eigenvector (Figure 1A).
metazoan genes. Further analyses showed that a total of 4,854 (16.6%) unigenes
A total of 19,743 (67.44%) unigenes had at least one significant were differentially expressed between S. crosnieri from the SCS
hit in the NR, UniProt, KEGG, or GO database. In total, 7,044 and the OT. Among them, 2,597 (8.87%) unigenes showed
(24.06%) unigenes were annotated according to the GO database higher expression levels in the SCS than in the OT, whereas
and assigned to three major GO categories according to GO level 2,257 (7.71%) had higher expression levels in the OT than in
three in OmicsBox: biological process (BP, 707, 2.42%), molecular the SCS. Relationship between the FDR and fold change for
function (MF, 1,394, 4.76%), and cellular component (CC, 1,589, all DEGs is illustrated in Figure 1B. Expression heatmap and
5.43%) (Supplementary Figure 1A). Specifically, in the category hierarchical clustering analysis of 29 DEGs involved in oxidative
of BP, MF, and CC, ‘organic substance metabolic process’ (GO: activity, metabolism of xenobiotics by cytochrome P450, sulfur
0071704), ‘organic cyclic compound binding’ (GO: 0097159), metabolism, and methane metabolism are presented in Figure 2
and ‘organelle’ (GO: 0043226) were the top most abundant and their mean expression levels in the SCS and OT as well
subcategories, respectively. Furthermore, 8,707 (29.7%) unigenes as functional annotations are given in Supplementary Table 6.
were mapped to 295 KEGG pathways, with ‘thermogenesis,’ Furthermore, qRT-PCR and RNA-Seq data are highly correlated
‘endocytosis,’ and ‘RNA transport’ being the top three most (R2 = 0.97) (Supplementary Figure 2), indicating the robustness
abundant pathways (Supplementary Figure 1B). of our DEG analyses.
There were 40 and 32 subcategories enriched in the SCS
seep population and the OT vent population, respectively, by
PSGs and DEGs Between the SCS and GO enrichment analysis (Supplementary Figure 3A). The
OT Populations top three enriched categories in the seep population were
De novo transcriptome assembly for each individual produced ‘translation’ (GO: 0006412), ‘structural constituent of ribosome’
an average of 38,707 transcripts with statistical details presented (GO: 0003735), and ‘polymeric cytoskeletal fiber’ (GO: 0099513);
in Supplementary Table 4. Specifically, a total of 61 (0.16%) and those in the vent population were ‘adenyl ribonucleotide
and 51 (0.13%) SCS and OT PSGs were identified in our binding’ (GO: 0032559), ‘motor activity’ (GO: 0003774), and
study and their KEGG and NR annotations are presented ‘myosin complex’ (GO: 0016459). Additionally, more (40
in Supplementary Table 5. Among them, 10 SCS-PSGs vs. 32) subcategories were enriched in the seep population
were mapped to 18 KEGG pathways, such as ‘propanoate than in the vent population. For instance, ‘oxidoreductase
Frontiers in Marine Science | www.frontiersin.org 5 November 2020 | Volume 7 | Article 587686Xiao et al. Population Connectivity and Deep-Sea Adaptation
FIGURE 2 | Heatmap and hierarchical clustering analysis of 29 DEGs between the SCS and the OT. The color code represents the gene expression level based on
the Log-transformed values. Red color indicates higher expression, whereas blue color indicates lower expression.
TABLE 1 | KEGG enrichment analysis of all DEGs between S. crosnieri individuals from the SCS and those from the OT.
Term Overlap* p-value
DEGs from SCS individuals Glycosaminoglycan biosynthesis 8/53 1.05E-04
Pentose and glucuronate interconversions 5/34 2.40E-03
RNA transport 10/165 1.80E-02
Mannose type O-glycan biosynthesis 3/23 2.55E-02
Spliceosome 8/134 3.50E-02
Ubiquinone and other terpenoid-quinone biosynthesis 2/11 3.64E-02
DEGs from OT individuals Vitamin digestion and absorption 3/24 1.43E-02
Mineral absorption 4/44 1.45E-02
Axon guidance 9/180 1.61E-02
Amino sugar and nucleotide sugar metabolism 4/49 2.09E-02
Bacterial invasion of epithelial cells 5/74 2.15E-02
ECM-receptor interaction 5/83 3.33E-02
Starch and sucrose metabolism 3/33 3.34E-02
ErbB signaling pathway 5/84 3.48E-02
Mitophagy 4/63 4.65E-02
*Significant terms overlap with the input list.
activity, oxidizing metal ions, NAD or NADP as acceptor’ (GO: vent population including ‘axon guidance’ (ko04360), ‘amino
0016723) was one of the representative subcategories in the sugar and nucleotide sugar metabolism’ (ko00520), and ‘bacterial
seep population, which included metalloreductase (STEAP3). invasion of epithelial cells’ (ko05100) (Table 1).
procollagen-lysine,2-oxoglutarate 5-dioxygenase (PLOD),
tryptophan 2,3-dioxygenase (TDO2), 4-hydroxyphenylpyruvate
dioxygenase (HPPD), cysteine dioxygenase (CDO1), and SNP Identification and Outlier SNP
prolyl 4-hydroxylase (P4HA) belonged to the ‘dioxygenase Characterization
activity’ (GO: 0051213) subcategory that was enriched in After genotyping and stringent data filtering (Table 2), a
the vent population. A total of 692 unigenes upregulated total of 32,452 transcriptome-wide SNPs located in 8,667
in the seep population had KEGG annotations, while 589 unigenes were obtained and subjected to downstream analyses.
unigenes upregulated in the vent population were annotated. Outlier screening tests resulted in 1,065 Arlequin outliers and
The results of KEGG pathway-enriched analysis showed 1,307 pcadapt outliers, with 504 outliers identified by both
six significantly enriched pathways in the seep population approaches (Figure 3A). These 504 outlier SNPs (Figure 3B)
including ‘glycosaminoglycan biosynthesis – chondroitin were located in 345 unigenes and GO enrichment analysis of
sulfate/dermatan sulfate’ (ko00532), ‘pentose and glucuronate these unigenes resulted in the discovery of 27 enriched categories
interconversions’ (ko00040), and ‘RNA transport’ (ko03013), (Supplementary Figure 3B). Among them, the top category
while eight significantly enriched pathways were detected in the for all, as well as molecular function, was ‘ATP binding’ (GO:
Frontiers in Marine Science | www.frontiersin.org 6 November 2020 | Volume 7 | Article 587686Xiao et al. Population Connectivity and Deep-Sea Adaptation
TABLE 2 | Number of filtering SNP candidates retained after each step of filtering. protein 1 (CREB1), succinate dehydrogenase cytochrome b560
subunit (SDHC), succinate dehydrogenase (SDHD), NAD-
Category Count
dependent protein deacetylase Sirt6 (SIRT6), and succinate
Bi-allelic 1,059,632 dehydrogenase [ubiquinone] iron-sulfur subunit (SDHB). Genes
Overall minor allele frequency (MAF ≥ 0.02) 800,814 from environment-related pathways such as sulfur dioxygenase
Without an indel 800,814 (ETHE1) in the ‘sulfur metabolism’ (ko00920) pathway and
Hardy–Weinberg equilibrium (p ≥ 0.01) 683,175 dihydrodiol dehydrogenase (DDH) in the ‘metabolism of
Genotyped in 50% of individuals 36,705 xenobiotics by cytochrome P450’ (ko00980) pathway were
Coverage depth ≥3 and ≤120 32,452 identified in the outlier SNP dataset and the results of amino
acid substitutions of 27 outlier SNPs with annotation are given
in Table 5. Overall, 74 unigenes were found in both the outlier
0070403), and the second and third categories of MF were SNP dataset and the DEG dataset (42 in the SCS and 32 in the
‘calcium ion binding’ (GO: 0005509) and ‘zinc ion binding’ (GO: OT) (Supplementary Table 7), such as ETHE1 and DDH in
0008270), respectively. The category of ‘calcium ion binding’ the SCS population, suggesting a link between mutation and
includes myosin light chain 6 and 12 (MYL6 and MYL12), expressional change.
chloride intracellular channel protein 2 (CLIC2), Plastin-2
(PLSL) and serine/threonine-protein phosphatase 2A regulatory
subunit B” subunit alpha (PPP2R3A); the category of ‘zinc ion Population Structure Based on the Entire
binding’ includes NAD-dependent protein deacylase 2 and 5 and the Outlier SNP Dataset
(SIRT2 and SIRT5), glycine hydroxymethyltransferase (GlyA) Pairwise Fst calculated based on the entire SNP dataset was 0.07
and chitin deacetylase 1 (CDA1). The annotations and partial (p < 0.0005), and pairwise Fst value estimated based on the outlier
functions of the nine metal ion binding related genes using the SNP dataset was 0.43 (p < 0.0005), much higher than that based
published literature are presented in Table 3. on the entire SNP dataset as expected. ADMIXTURE analyses
KEGG enrichment analysis revealed that 180 of the 345 and PCA based on both all the (Figures 4A,B) and just the
outlier-containing unigenes were significantly enriched in 15 outlier SNPs (Figures 4C,D) clearly revealed two genetic groups
pathways (Table 4). Specifically, a number of pathways may be of S. crosnieri, with one formed by all the individuals from the
related to the adaptation of S. crosnieri to local environments, SCS and the other formed by all the individuals from the OT.
although it is not possible to pinpoint the specific environmental Nevertheless, eight individuals in the OT showed a signature
condition shaping the adaptation. For example, three unigenes of admixture of two genetic groups (Figure 4A), indicating a
were enriched in the ‘peroxisome’ (ko04146) pathway: sarcosine stronger gene flow from the SCS to the OT. A similar result
oxidase/L-pipecolate oxidase (PIPOX), alanine-glyoxylate was also obtained via the divMigrate analysis where a higher
transaminase/serine-glyoxylate transaminase/serine-pyruvate migration rate was detected in the SCS to OT direction (1.00
transaminase (AGXT), and Cu-Zn superoxide dismutase for SCS to OT vs. 0.21 for OT to SCS). Figure 5A shows the
(SOD1); and five unigenes were enriched in the ‘thermogenesis’ lateral velocity vectors at 500 m depth laid upon the bathymetry
(ko04714) pathway: cyclic AMP-responsive element-binding in our study region. The Kuroshio Current is visible at this level
A B
FIGURE 3 | (A) Locus-specific Fst is plotted against observed heterozygosity (Heterozygosity) with black circles indicating neutral SNPs, red circles indicating outlier
SNPs only identified by Arlequin, yellow circles indicating outlier SNPs only identified by PCAdapt and blue circles indicating overlapped outlier SNPs identified by two
methods. (B) A total of 504 outlier SNPs is plotted based on observed heterozygosity and locus-specific Fst value with seven genes highlighted with different colors.
Frontiers in Marine Science | www.frontiersin.org 7 November 2020 | Volume 7 | Article 587686Xiao et al. Population Connectivity and Deep-Sea Adaptation
TABLE 3 | Nine enriched outlier-associated unigenes related with metal ion binding.
GO term Gene name Annotation Partial function References
Calcium ion binding MYL6 Myosin light chain 6 MYL6 belongs to MLC1, calcium binding proteins. Leclerc et al., 2016
MYL12 Myosin regulatory light chain 12 MYL12 regulates activity of the myosin ATPase, inhibits Kendrick-Jones et al.,
interactions between myosin and actin. Calcium binding to 1976
myosin activates the myosin ATPase and provokes muscle
contraction.
PPP2R3A Serine/threonine-protein PPP2R3A catalyzes the removal of phosphate groups from Swingle and Honkanen,
phosphatase 2A regulatory serine and/or threonine residues with the requirement of 2019
subunit B00 subunit alpha manganese ions.
PLSL Plastin-2 PLSL binds for Ca2+ originally, also a candidate for binding Bucher et al., 2016
U ions with a low pH of 5.2; involved in the formation of
cross-linked actin filaments.
CLIC2 Chloride intracellular channel CLIC2 inhibits cardiac ryanodine receptor (RyR) calcium Cromer et al., 2007
protein 2 release channels, regulates calcium release from
intracellular stores in the heart and skeletal muscles.
Zinc ion binding SIRT2 NAD-dependent deacetylase SIRT may be related to minerals deficiency; correlated with Ha et al., 2019
sirtuin 2 Zn2+ binding; SIRTs in skeletal muscle regeneration and
survival under catabolic stress (esp. 2 and 5); SIRT2 can
extend lifespan; influence metabolism, circadian rhythms,
and potentially life span through their function as protein
deacetylase.
SIRT5 NAD-dependent deacetylase
sirtuin 5
GlyA Glycine GlyA catalyzes the reversible cleavage of serine to form Rubin-Blum et al., 2017
hydroxymethyltransferase glycine and monocarbonic groups
CDA1 Deacetylation reaction for Deacetylation reaction for insoluble chitin; convert chitin into Trimukhe and Varma,
insoluble chitin 1 water-soluble chitosan; metal ions such as Sr2+ , Mg2+ , 2008; Chai et al., 2020
Na+ , Ca2+ , and K+ simulate the activity rate of CDA and
further inhibited by Co2+ , Ba2+
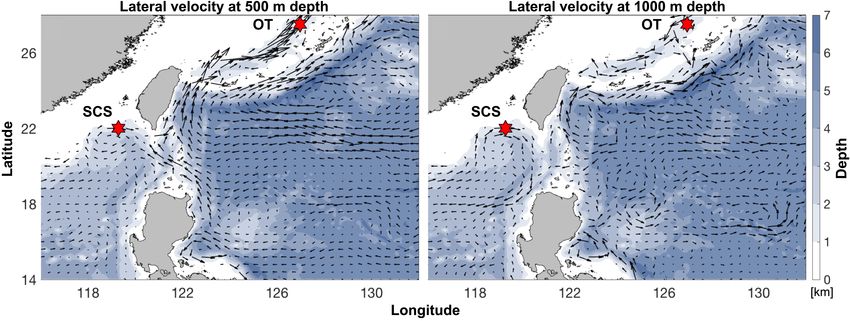
and turns anticyclonically at the Luzon strait, allowing for water TABLE 4 | KEGG enrichment analysis of outlier SNPs.
exchange between the Pacific Ocean and the SCS. At 1,000 m
Term Overlap* p-value
depth, however, much less connectivity is revealed between the
Pacific and the South China Sea SCS (Figure 5B). Alanine, aspartate, and glutamate metabolism 4/35 2.05E-04
Glycine, serine, and threonine metabolism 4/40 3.47E-04
Mismatch repair 3/23 9.11E-04
Subsampling Analyses and Comparison
Citrate cycle (TCA cycle) 3/30 2.00E-03
With Previous Studies Valine, leucine, and isoleucine degradation 3/48 7.63E-03
Although the samples we used were different from those used in Axon guidance 5/181 1.85E-02
Cheng et al. (2019), some DEGs identified in our study showed Lysosome 4/123 2.02E-02
the same expression patterns as in Cheng et al. (2019), including Bacterial invasion of epithelial cells 3/74 2.44E-02
cystathionine gamma-lyase (CSE) and heat shock protein 22 RNA degradation 3/79 2.89E-02
(HSP) (Table 6), indicating they might reflect true differences Peroxisome 3/83 3.28E-02
between the two populations. Nevertheless, subsampling of our ErbB signaling pathway 3/85 3.48E-02
data clearly revealed a requirement of a larger sample size to Thermogenesis 5/231 4.57E-02
capture the DEGs of the two populations (Figure 6A). From our
*Significant terms overlap with the input list.
data, the total number of DEGs increased sharply from 2,142
when using data from three individuals to 4,353 when using data from RAD-Seq. Another advantage is that SNPs detected from
from five individuals. But the number of DEGs did not increase transcriptome are all located in protein coding sequences
further when data from even more individuals were included in while markers from RAD-Seq were sometimes out of protein-
the analysis. coding regions which is degermed by restriction enzymes
The SNP markers detected using the subsampling strategy (Cheng et al., 2020).
showed a basically consistent trend when 3, 5, and 10 individuals
were chosen from each habitat (Figure 6B), and all three
subsampling groups under transcriptome sequencing obtained DISCUSSION
more SNPs than the number of loci obtained under RAD
sequencing. Moreover, more outlier SNP sequences were detected By using the RNA-Seq technique, a total of 112 PSGs, 4,854
from transcriptome-wide SNP dataset compared with the results DEGs, and 32,452 SNPs were detected in this study, which
Frontiers in Marine Science | www.frontiersin.org 8 November 2020 | Volume 7 | Article 587686Xiao et al. Population Connectivity and Deep-Sea Adaptation
TABLE 5 | Functional classification and amino acid substitution of the 27 annotated outlier SNPs.
Function Outlier SNP ID ALT AA Change Annotation
Iron incorporation into TRINITY_DN23438_c2_g1_i3_1730 AAG R/K iscS, NFS1; cysteine desulfurase [EC:2.8.1.7]
metallo-sulfur cluster
Lysosome TRINITY_DN893_c2_g2_i2_1077 GTT T/V CTSB; cathepsin B [EC:3.4.22.1]
TRINITY_DN5263_c0_g1_i7_1262 GTC I/V SLC17A5; MFS transporter, ACS family, solute carrier family
17 (sodium-dependent inorganic phosphate cotransporter),
member 5
TRINITY_DN1916_c0_g2_i2_2889 CCC – SCARB2, LIMP2, CD36L2; lysosome membrane protein 2
TRINITY_DN8085_c0_g1_i3_150 GGG E/G NPC1; Niemann-Pick C1 protein
TRINITY_DN8085_c0_g1_i3_2302 CAC – NPC1; Niemann-Pick C1 protein
TRINITY_DN3521_c0_g1_i14_2372 CCC – BTS, CLN3; battenin
TRINITY_DN3521_c0_g1_i14_2392 GCG V/A BTS, CLN3; battenin
TRINITY_DN6522_c0_g1_i2_1819 TTC – AP1S1_2; AP-1 complex subunit sigma 1/2
Endocytosis TRINITY_DN2898_c0_g1_i3_1076 CAC – ARPC3; actin related protein 2/3 complex, subunit 3
TRINITY_DN47762_c0_g1_i1_2457 GCG – VPS36, EAP45; ESCRT-II complex subunit VPS36
TRINITY_DN5968_c0_g1_i23_1932 GCA V/A VTA1, LIP5; vacuolar protein sorting-associated protein
VTA1
TRINITY_DN5968_c0_g1_i23_2234 TGT R/C VTA1, LIP5; vacuolar protein sorting-associated protein
VTA1
Phagosome TRINITY_DN5194_c3_g1_i1_115 GCC T/A ATPeV1A, ATP6A; V-type H+-transporting ATPase subunit
A [EC:3.6.3.14]
TRINITY_DN229_c1_g1_i3_3160 TTC – ITGB1, CD29; integrin beta 1
TRINITY_DN229_c1_g1_i3_4608 GTC L/V ITGB1, CD29; integrin beta 1
TRINITY_DN1849_c0_g1_i1_1404 ATG L/M CANX; calnexin
Peroxisome TRINITY_DN3834_c0_g1_i2_1142 CCA S/P PIPOX; sarcosine oxidase/L-pipecolate oxidase [EC:1.5.3.1
1.5.3.7]
TRINITY_DN2705_c1_g1_i5_943 AGC R/S AGXT; alanine-glyoxylate transaminase/serine-glyoxylate
transaminase/serine-pyruvate transaminase [EC:2.6.1.44
2.6.1.45 2.6.1.51]
TRINITY_DN12145_c0_g1_i3_479 GGC D/G SOD1; superoxide dismutase, Cu-Zn family [EC:1.15.1.1]
Methane metabolism TRINITY_DN31417_c0_g2_i1_152 CGG W/R glyA, SHMT; glycine hydroxymethyltransferase [EC:2.1.2.1]
TRINITY_DN2705_c1_g1_i5_943 AGC R/S AGXT; alanine-glyoxylate transaminase/serine-glyoxylate
transaminase/serine-pyruvate transaminase [EC:2.6.1.44
2.6.1.45 2.6.1.51]
TRINITY_DN664_c1_g1_i1_829 CCG S/P FBP, fbp; fructose-1,6-bisphosphatase I [EC:3.1.3.11]
Sulfur metabolism TRINITY_DN595_c1_g1_i9_1123 GTG – ETHE1; sulfur dioxygenase [EC:1.13.11.18]
C-type lectin receptor TRINITY_DN474_c0_g1_i5_967 GAA I/Z PPP3C, CNA; serine/threonine-protein phosphatase 2B
signaling pathway catalytic subunit [EC:3.1.3.16]
TRINITY_DN474_c0_g1_i5_968 PPP3C, CNA; serine/threonine-protein phosphatase 2B
catalytic subunit [EC:3.1.3.16]
ALT, alternate codon and marked with boldness; AA, amino acid; “–”, synonymous substitution.
provided the basis for investigating the population differentiation Luzon Strait. The Luzon Strait is the only deep channel that
and environment-specific local adaptation of S. crosnieri from a connects the semi-enclosed SCS with the deeper Pacific Ocean
methane seep and a hydrothermal vent in the Western Pacific. for water transportation via a sandwiched vertical structure
(Tian et al., 2009). Seawater flows into the SCS from the
Pacific Ocean in both the upper (1,500 m) layers and exits the SCS through the Luzon Strait
Shinkaia crosnieri Between SCS and OT in the intermediate layer (700–1,500 m) (Tian et al., 2006; Yuan
Previous population genetic studies (Shen et al., 2016; Yang et al., et al., 2009). The eastward spread is stronger in both winter
2016; Cheng et al., 2020) using different molecular markers have and spring (You et al., 2005). Previously, by using genome-
consistently shown that the seep population of S. crosnieri in the wide SNP markers, Xu et al. (2018) revealed a limited gene
SCS and the vent population in the OT form two distinct genetic flow of the deep-sea mussel Gigantidas platifrons (previously
groups. By using 32,452 transcriptome-wide SNPs markers, our known as Bathymodiolus platifrons) between the SCS and the
study also uncovered the same pattern of population structure. OT. However, G. platifrons and S. crosnieri have different life-
One of the abiotic factors that may have contributed to such history traits. Bathymodioline mussels produce planktotrophic
population subdivision is the physical barrier formed by the larvae that take almost a year to develop, and their dispersal
Frontiers in Marine Science | www.frontiersin.org 9 November 2020 | Volume 7 | Article 587686Xiao et al. Population Connectivity and Deep-Sea Adaptation
A B
C D
FIGURE 4 | Population structure analyses based on ADMIXUTRE (A,C) and PCA (B,D) using entire SNP for (A,B) and the outlier SNP dataset for (C,D), showing the
population genetic structure of S. crosnieri (K for optimal genetic group number).
FIGURE 5 | Annual-mean lateral velocity vectors, denoted by black arrows, at (A) 500 m depth and (B) 1,000 m depth laid upon the bathymetry (color contours;
unit: km) in our analysis region. Sampling sites of the SCS and the OT are indicated by the red hexagrams. Datasets are based on the HYCOM + NCODA Global
1/12◦ Reanalysis (experiment sequence: 53.X).
ability is largely influenced by the upper or surface currents and exits via the northern part of the Luzon Strait (Nan et al.,
(Arellano and Young, 2009). Consequently, the limited larval 2011), as well as by the North Pacific Intermediate Water (NPIW;
exchange of G. platifrons between the two sides of the Luzon Xu et al., 2018). In contrast, S. crosnieri produces large (2 mm)
Strait is suggested to be achieved by the looping path of the oil-rich eggs and equally oil-rich lecithotrophic larvae (Miyake
Kuroshio Current, which flows into the SCS via the middle part et al., 2010; Nakajima et al., 2018), and its dispersal is expected
Frontiers in Marine Science | www.frontiersin.org 10 November 2020 | Volume 7 | Article 587686Xiao et al. Population Connectivity and Deep-Sea Adaptation
to mainly occur within the middle and deep layers. Its larval in our outlier SNP dataset, and sulfur dioxygenase (ETHE1),
dispersal between the two sides of the Luzon Strait could be a homodimeric Fe-containing sulfur dioxygenase (SDO), was
greatly restricted by the effect of the NPIW widely distributed a DEG in the seep population as well as an outlier SNP with
between a depth range of 300–800 m (Watanabe and Wakatsuchi, synonymous substitution. Natural gas hydrate on the seafloor
1998), approximately 300 m above the SCS methane seep and of the Formosa Ridge (also known as the Jiaolong Ridge) in
approximately 700 m above the OT hydrothermal vent. The the SCS contained significant amounts of H2 S (Zhang et al.,
physical oceanographic modeling results also revealed limited 2017). These results indicate activation of mitochondrial sulfur
water connection between these two sites at the middle (500 m) detoxification in the seep population to cope with the local
and deep (1,000 m) layers. physicochemical condition. One PSG in the vent population,
chondroitin 4-sulfotransferase 11 (CHST11), belongs to the
Local Adaptation of Shinkaia crosnieri family of sulfotransferases that catalyze the conversion of sulfate
Results of DEGs, PSGs, and outlier SNP detection revealed that to chondroitin 40 -sulfate, a sulfated polysaccharide usually found
several functional groups such as oxidoreductase activity, sulfur in the matrix of animal cells (Suzuki and Strominger, 1960;
metabolism and metal ion binding may be involved in the Helbert, 2017).
local adaptation and expression plasticity of S. crosnieri under Apart from cellular organelles, the mixed-function oxygenase
the varying environmental conditions of methane seeps and (MFO) system also contributes to xenobiotic detoxification
hydrothermal vents. in all organisms (Ramos and Garcia, 2007). The first phase
Mitochondria are a target of pollutant-induced toxicity, as of MFO is mainly controlled by biotransformation enzymes
reflected by the expressional changes of mitochondria-related like CYP and glutathione S-transferase (GST) that introduce
proteins as well as oxidative enzymes in response to exposure a functional group to transform and metabolize toxicants.
to toxicants (Gobe and Crane, 2010). Iron plays a role in many Superoxide dismutase (SOD), catalase (CAT), and glutathione
cellular processes as well as the generation of harmful reactive peroxidase (GPx) catalyze subsequent reactions (second phase)
oxygen species (ROS). Extracellular iron is taken up by cells and and generate more polar products which are more easily
transported to mitochondria which form a major center of iron excreted by the organisms (Lee, 1981). CYP and GST were
utilization and accumulation. In this process, metalloreductase upregulated unigenes in the seep population, while the
(STEAP3), an endosomal membrane enzyme, can convert iron alternative hydroperoxide of GPx, the peroxiredoxin 6 (PRDX
from an insoluble ferric (Fe3+ ) to a soluble ferrous (Fe2+ ) form 6) that also uses glutathione (GSH) as an electron donor
(Martinez-Finley et al., 2012). Then, Fe2+ is transported directly (Deponte, 2013), was upregulated in the seep population.
from the endosome to mitochondria (Paul et al., 2017). STEAP3 Cu-Zn superoxide dismutase (SOD1), a major antioxidant
was unigene upregulated in the SCS seep population, which defense enzyme in charge of the detoxification of superoxide
may be a strategy against comparatively higher level of dissolved radicals and the generation of H2 O2 , was identified as an
Fe concentration in the SCS than in the OT (Hu et al., 2015; outlier SNP. The different expression levels of MFO system-
Miyazaki et al., 2017a,b). related enzymes may suggest varying toxicant accumulation
Hydrogen sulfide (H2 S) is an important energy source patterns between the two studied populations. Besides SOD1,
driving carbon fixation and other critical metabolic processes sarcosine oxidase/L-pipecolate oxidase (PIPOX) and alanine-
in deep-sea thiotrophs, which then supply energy and nutrients glyoxylate transaminase/serine-glyoxylate transaminase/serine-
to many macrobenthos living in hydrothermal vents and pyruvate transaminase (AGXT) were two other unigenes
methane seeps. However, this gas is also a potent toxin enriched under the ‘peroxisome’ pathway from the outlier
to cytochrome c oxidase. Therefore, animals living in these SNP dataset. PIPOX catalyzes the oxidation of sarcosine and
chemosynthesis-based ecosystems are expected to be able to l-pipecolate with the production of H2 O2 and it was also
detoxify sulfide (Julian et al., 2005). Organisms inhabiting H2 S- identified as a PSG in the vent population. AGXT takes part
rich environments have evolved many strategies for coping with in glyoxylate detoxification and prevents the generation of
continuous exposure to H2 S (Tobler et al., 2016). Eukaryotes toxic oxalate from glyoxylate. All three unigenes underwent
usually possess a mitochondrial sulfur detoxification pathway, amino substitutions. Differential gene expression and allele
which converts sulfide into sulfite. Two key enzymes in the frequency changes of all these oxidoreductase-related genes may
sulfide detoxification system, sulfide:quinone oxidoreductase suggest different extents of local adaptation to the extreme
(SQR) and sulfur dioxygenase (SDO), have been identified in environmental conditions.
this study. SQR is a mitochondrial membrane-bound enzyme. Plastin is involved in the formation of cross-linked actin
It converts sulfide to persulfides and transfers electrons to filaments, which are also responsible for the structural solidity
the pool of ubiquinone, which is then oxidized by SDO to of certain cells (Shinomiya, 2012). Plastin is a protein known for
generate sulfite with the consumption of molecular oxygen binding metals including Ca and could therefore be a candidate
and persulfide molecules (Hildebrandt and Grieshaber, 2010). for binding uranium (U) with a low pH of 5.2 (Bucher et al.,
A previous study of the mussel G. platifrons from the SCS 2016). If the alteration in plastin occurs in the presence of U,
methane seep discovered the expression of the same sulfide it may contribute to the structural damage previously observed
detoxification pathway in the symbiont-hosting gill (Wong et al., in gill tissues of zebrafish (Barillet et al., 2010). Hu et al. (2015)
2015; Sun et al., 2017). Succinate dehydrogenase [ubiquinone] reported that cold seeps of the northern SCS contained enriched
iron-sulfur subunit (SDHB), a subunit of SQR, was identified authigenic U in sediments, which may explain its influence on
Frontiers in Marine Science | www.frontiersin.org 11 November 2020 | Volume 7 | Article 587686Xiao et al. Population Connectivity and Deep-Sea Adaptation
TABLE 6 | Comparison of DEGs involved in antioxidation and detoxification, heat shock proteins, and immune defense with those in the study of Cheng et al. (2020).
Gene category Gene ID Expression level Fold FDR Expression Annotation
change pattern
SCS OT
Antioxidation and detoxification
Peroxidase TRINITY_DN10835_c0_g1_i3 49.46 11.73 4.22 3.77E-04 O Peroxidase
TRINITY_DN66309_c0_g1_i4 24.88 7.16 3.47 9.40E-05 O Peroxidase
CSE TRINITY_DN2459_c1_g1_i4 322.20 819.52 0.39 6.68E-15 S Cystathionine gamma-lyase
DDH TRINITY_DN4130_c0_g1_i1 21.70 1.49 14.60 1.17E-16 O Trans-1,2-dihydrobenzene-1,2-diol
dehydrogenase
GST TRINITY_DN42396_c0_g2_i1 3806.61 524.57 7.26 3.85E-11 O Glutathione S-transferase Mu 5
Heat Shock Proteins
HSP TRINITY_DN3174_c0_g2_i5 135.72 315.51 0.43 2.36E-02 S Heat shock protein 22
Immune defense
CTL TRINITY_DN57189_c0_g1_i1 160.49 13.34 12.03 3.59E-04 C-type lectin containing low-density lipoprotein
receptor domain
TRINITY_DN3217_c0_g1_i6 278.21 30.75 9.05 2.41E-38 C-type lectin domain family 10 member A
TRINITY_DN95076_c0_g1_i1 5.89 0.72 8.13 2.89E-02 C-type lectin superfamily 17 member A
TRINITY_DN6868_c0_g1_i12 4.47 0.87 5.17 1.90E-05 C-type lectin domain family 4 member M-like
TRINITY_DN5535_c0_g1_i1 14.74 3.56 4.14 1.62E-05 C-type lectin 37Db
TRINITY_DN17218_c0_g1_i7 199.88 76.03 2.63 1.45E-02 C-type lectin containing low-density lipoprotein
receptor domain
TRINITY_DN11643_c0_g1_i2 13.63 36.57 0.37 3.32E-07 C-type lectin domain family 4 member M-like
TRINITY_DN19395_c0_g1_i3 1.26 3.79 0.33 8.46E-05 C-type lectin domain family 4 member C-like
TRINITY_DN799_c0_g1_i4 7.02 22.12 0.32 1.04E-02 C-type lectin domain family 4 member M
TRINITY_DN347_c1_g1_i1 99.98 482.65 0.21 2.05E-09 C-type lectin
TRINITY_DN3728_c0_g1_i2 5.09 34.93 0.15 2.19E-04 C-type lectin domain family 17, member A
TRINITY_DN3401_c0_g1_i3 0.49 187.91 0.00 6.68E-03 C-type lectin
TFPI TRINITY_DN1673_c0_g2_i1 6700.80 1805.69 3.71 6.90E-04 O Tissue factor pathway inhibitor 2
Serine protease TRINITY_DN1726_c0_g1_i5 179.85 22.97 7.83 2.89E-03 O Serine proteinase stubble
TRINITY_DN4588_c0_g1_i2 22.85 48.87 0.47 5.42E-03 S Serine proteinase stubble
TRINITY_DN62208_c0_g1_i2 2.20 5.96 0.37 6.35E-03 S Serine proteinase stubble
Ig TRINITY_DN27402_c1_g1_i4 2.62 10.60 0.25 4.19E-03 S Immunoglobulin domain-containing protein
oig-4
A2M TRINITY_DN3_c0_g1_i7 2170.77 704.60 3.08 4.78E-02 S Alpha-2-macroglobulin
Expression pattern: S, same/similar; O, opposite. DEGs from SCS population are bold.
the genetic variation of plastin. Chitin deacetylases may convert study of gene expression profiling to prognose lymphoma, breast
chitin into chitosan by enzymatic deacetylation of the amino cancer, head cancer, and neck cancer, all data sets showed that
group of chitin (Raval et al., 2017). Chitin and chitosan both predictive inaccuracy was reduced by increasing the sample
play a role in metal ions absorption (Kurita, 2006). Previous size (Dunkler et al., 2007). Our empirical experience showed
study found metal ions such as Sr2+ , Mg2+ , Na+ , Ca2+ , and K+ that, based on ∼3 Gb of 150-bp data per sample, at least
simulate the activity rate of CDA and further inhibited by Co2+ , five samples would be required to detect sufficient DEGs for
Ba2+ (Chai et al., 2020). Trace metals such as Sr2+ , Mg2+ , and comparing transcriptomes from two different populations. When
Ca2+ have been detected in the seawater of both the SCS seep and only three replicates were used in a simulation with our data,
OT vent sites, with Sr2+ being more abundant in the SCS site than only about half of the DEGs were detected. Moreover, when
in the OT site (Hu et al., 2015; Miyazaki et al., 2017a,b). Plastin-2 less data per sample were available (2.3 Gb of 100-bp data)
(PLSL) and chitin deacetylase 1 (CDA1) were enrichened under (Cheng et al., 2019), even fewer DEGs (545) could be detected.
GO term from the outlier SNP dataset. Our results are consistent with the results of another study that
indicated at least six replicates should be used in order to obtain
Sample Size Advantages sufficient DEGs for a study of the treatment effects (Schurch
Transcriptome sequencing data are able to reveal gene expression et al., 2016). Meanwhile, our subsampling indicated the need to
patterns in different sample tissues or in samples under different choose up-to-date methodology in order to detect transcriptome-
conditions. Nevertheless, an appropriate sample size should be wide SNPs. Our empirical results will thus be useful when
applied for transcriptome-based studies as it will affect the planning population genetic studies of not only the squat lobster
results obtained (Aach and Church, 2001). For example, in a S. crosnieri, but also other invertebrates.
Frontiers in Marine Science | www.frontiersin.org 12 November 2020 | Volume 7 | Article 587686Xiao et al. Population Connectivity and Deep-Sea Adaptation
A
B
FIGURE 6 | (A) Number of DEGs identified based on the subsampling approach by random selecting 3 (T3), 5 (T5), 10 (T10), and 15 (T15) individuals from each
local population and comparing with Cheng et al. (2019), with yellow, red, and blue dots indicating DEGs in SCS, OT, and total DEGs number, respectively.
(B) Number of SNPs identified based on the subsampling approach by random selecting 3 (T3), 5 (T5), and 10 (T10) individuals from each local population and
comparison with Cheng et al. (2020).
CONCLUSION of DEGs between the two populations. Altogether, our study
provide new insights into the genetic structure of S. crosnieri and
Using transcriptome sequencing, we identified DEGs and PSGs molecular mechanisms that have enabled it to thrive in both vents
between two Shinkaia crosnieri populations, one from a methane and seeps. A broader sampling involving more localities with
seep in the SCS and another from a hydrothermal vent field in contrasting environmental conditions including both different
the OT. These genes were found to be involved and enriched temperatures and depths is desired in the future to further
in metabolic pathways including oxidoreductase activity and improve our understanding of the population dynamics and local
sulfur metabolism that may be important in adaptation to adaptation of this widespread species in the Western Pacific.
different environmental conditions. Using transcriptome-wide
SNP markers, we confirmed clear genetic subdivision between
S. crosnieri from the SCS and the OT, and suggested the Luzon
Strait as an important physical barrier to the larval dispersal DATA AVAILABILITY STATEMENT
between the two populations. Moreover, our outlier analysis
revealed the involvement of genes related to metal ion binding The datasets generated from this study can be found in
and energy metabolism in shaping the genetic divergence of the online repositories. The names of the repository/repositories and
two populations. Using a subsampling strategy, we found that at accession number(s) can be found below: https://www.ncbi.nlm.
least five replicates were required to capture the full spectrum nih.gov/, PRJNA612951.
Frontiers in Marine Science | www.frontiersin.org 13 November 2020 | Volume 7 | Article 587686You can also read