Invasive Plants Are a Valuable Alternate Protein Source and Can Contribute to Meeting Climate Change Targets - Frontiers
←
→
Page content transcription
If your browser does not render page correctly, please read the page content below
ORIGINAL RESEARCH
                                                                                                                                          published: 15 February 2021
                                                                                                                                      doi: 10.3389/fsufs.2021.575056

                                            Invasive Plants Are a Valuable
                                            Alternate Protein Source and Can
                                            Contribute to Meeting Climate
                                            Change Targets
                                            Ajay Iyer, Charles S. Bestwick, Sylvia H. Duncan and Wendy R. Russell*

                                            Gut Health, Rowett Institute, University of Aberdeen, Aberdeen, United Kingdom

                                            Agriculture has come under pressure to meet global food demands, whilst having to
                                            meet economic and ecological targets. This has opened newer avenues for investigation
                                            in unconventional protein sources. Current agricultural practises manage marginal lands
                                            mostly through animal husbandry, which; although effective in land utilisation for food
                                            production, largely contributes to global green-house gas (GHG) emissions. Assessing
                                            the revalorisation potential of invasive plant species growing on these lands may help
                                            encourage their utilisation as an alternate protein source and partially shift the burden
                           Edited by:       from livestock production; the current dominant source of dietary protein, and offer
                    Rakesh Bhardwaj,        alternate means of income from such lands. Six globally recognised invasive plant
      National Bureau of Plant Genetic
               Resources (ICAR), India
                                            species found extensively on marginal lands; Gorse (Ulex europaeus), Vetch (Vicia
                         Reviewed by:
                                            sativa), Broom (Cytisus scoparius), Fireweed (Chamaenerion angustifolium), Bracken
                            Aida Turrini,   (Pteridium aquilinum), and Buddleia (Buddleja davidii) were collected and characterised
 Council for Agricultural Research and      to assess their potential as alternate protein sources. Amino acid profiling revealed
                       Economics, Italy
                       Sapna Langyan,       appreciable levels of essential amino acids totalling 33.05 ± 0.04 41.43 ± 0.05,
    National Bureau of Plant Genetic        33.05 ± 0.11, 32.63 ± 0.04, 48.71 ± 0.02 and 21.48 ± 0.05 mg/g dry plant
              Resources (ICAR), India
                                            mass for Gorse, Vetch, Broom Fireweed, Bracken, and Buddleia, respectively. The
                   *Correspondence:
                      Wendy R. Russell
                                            availability of essential amino acids was limited by protein solubility, and Gorse was
                  w.russell@abdn.ac.uk      found to have the highest soluble protein content. It was also high in bioactive
                                            phenolic compounds including cinnamic- phenyl-, pyruvic-, and benzoic acid derivatives.
                     Specialty section:
                                            Databases generated using satellite imagery were used to locate the spread of invasive
           This article was submitted to
       Nutrition and Sustainable Diets,     plants. Total biomass was estimated to be roughly 52 Tg with a protein content of 5.2
                 a section of the journal   Tg with a total essential amino acid content of 1.25 Tg (∼24%). Globally, Fabaceae was
Frontiers in Sustainable Food Systems
                                            the second most abundant family of invasive plants. Much of the spread was found
            Received: 22 June 2020
         Accepted: 18 January 2021
                                            within marginal lands and shrublands. Analysis of intrinsic agricultural factors revealed
        Published: 15 February 2021         economic status as the emergent factor, driven predominantly by land use allocation,
                             Citation:      with shrublands playing a pivotal role in the model. Diverting resources from invasive
 Iyer A, Bestwick CS, Duncan SH and
                                            plant removal through herbicides and burning to leaf protein extraction may contribute
Russell WR (2021) Invasive Plants Are
   a Valuable Alternate Protein Source      toward sustainable protein, effective land use, and achieving emission targets, while
       and Can Contribute to Meeting        simultaneously maintaining conservation of native plant species.
              Climate Change Targets.
Front. Sustain. Food Syst. 5:575056.        Keywords: plant protein, marginal lands, sustainable agriculture, net zero emissions, nutritional characterisation,
      doi: 10.3389/fsufs.2021.575056        invasive plants, essential amino acids, cyclic economy

Frontiers in Sustainable Food Systems | www.frontiersin.org                       1                                          February 2021 | Volume 5 | Article 575056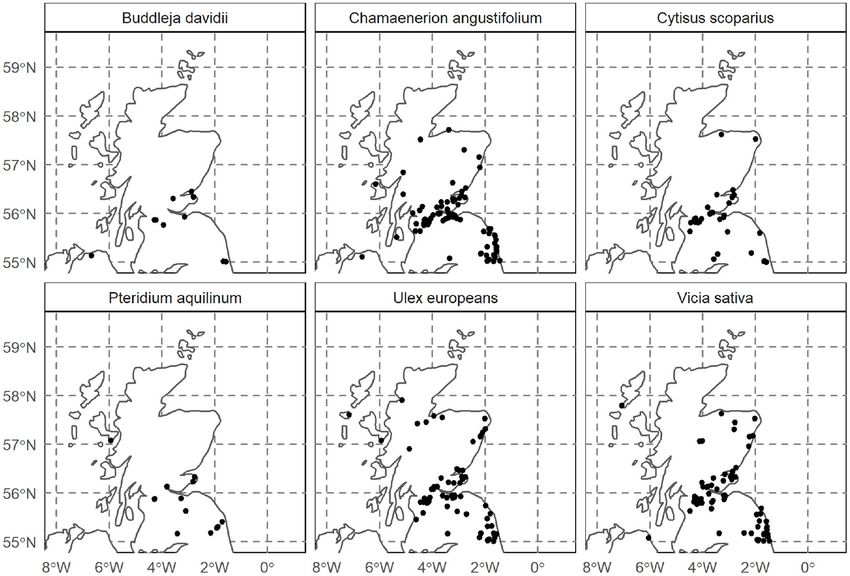
Iyer et al.                                                                                                     Invasive Plants as Protein Alternatives

INTRODUCTION                                                                and costs are borne entirely by local farmers, impinging on their
                                                                            income margins. Additionally, these plants pose a threat to local
Existing mainstream food supply systems are capable of                      diversity if not kept in check (Parker, 2000; Dassonville et al.,
surpassing global nutritional requirements and yet, we find                 2008; Shiferaw et al., 2019).
about 12.3% of the human population living with chronic                        Characterisation of these plants as a potential source of
malnutrition (FAO et al., 2020). Increased atmospheric CO2                  nutrition may help provide impetus for their effective utilisation
and malnutrition can be causally attributed to inefficiencies               and limit or decrease their spread in their non-native locations
along the food supply chain primarily through wastage and                   or stimulate interest for their conservation in native lands.
poor resource allocation (Bajželj et al., 2014; Sabaté et al., 2015;        Extraction methods for obtaining leaf proteins have been well-
Xue et al., 2017). The high-energy input required for modern                studied; particularly by Pirie (1977) who pioneered the use of
agriculture is mostly sourced from fossil fuels, which directly             industrial pulping mechanisms to express plant juices. However,
leads to greenhouse gas emissions. This in turn contributes                 contemporary methods for removal of pungent and strong-
to climate change, increasing crop vulnerability due to altered             tasting phenolics were not cost effective and subsequent advances
pest behaviour, temperature eccentricities, and altered seasonal            made in crop genetics, and development of novel cultivars
patterns. Cultivation of crops and plants, which is essentially an          overshadowed the idea. Recent years, however, have seen an
anabolic carbon storing process, is rendered ineffective owing to           increase in the pursuit of leaf protein recovery, particularly from
such intensive cultivation practises to meet global food demand.            agricultural waste. Understanding the total protein content and
One of the major sources of food-based carbon emission is                   the amino acid composition of native Scottish plants may help
animal husbandry. Most of the global protein produced is                    open newer avenues for protein sourcing and allow for more
directed toward animal feed. Currently, animal husbandry enjoys             robust food systems resilient to global policies and environment.
the single largest resource allocation; especially land, in global             Improved utilisation and reallocation of land use for alternate
food production and is the dominant source of protein for most              and sustainable protein production is required to help reduce
people (Day, 2013; FAO, 2019). Justification for the present scale          dependence on animal husbandry and offset part of the
of animal husbandry enumerates reasons such as employment,                  associated emissions. Along with other non-conventional sources
superior essential amino acid profile of animal products, useful            such as insects (Henchion et al., 2017), fungi (Bano et al., 1963),
functional properties and gastronomic preferences. However,                 and seaweed (Tamayo Tenorio et al., 2018), revalorisation of
protein turnover from this enterprise is low, while associated              invasive plants appears to be an abundant and a potentially
greenhouse gas (GHG) emissions are high, making it the single               lucrative route of obtaining protein (Pirie, 1932, 1969a,b; Nagy
largest contributing factor to agricultural emissions (Pragna et al.,       et al., 1978). The work described here assesses the revalorisation
2018).                                                                      potential of invasive plants through comprehensive nutritional
   In the case of Scotland, large parts of the Scottish Highlands           investigation. It considers potential health benefits, and the
are ill suited for arable farming and are primarily used for rough          predicted impact on land resource allocation and associated
grazing. Plants such as Gorse (Ulex europaeus), Vetch (Vicia                GHG emissions.
sativa), Broom (Cytisus scoparius), Fireweed (Chamaenerion
angustifolium), Bracken (Pteridium aquilinum), and Buddleia
                                                                            MATERIALS AND METHODS
(Buddleja davidii) are able to quickly grow in urban as well as
marginal lands owing to their robust physiologies and quicker               World data on land use and green-house-gas emissions were
germination times, allowing them to dominate available land                 obtained from FAOSTAT (FAO, 2019).
and often encroach into farmlands (Eldridgea et al., 2011). Since               All chemicals and kits were purchased from Merck
they can grow in low nutrient conditions, they are known to                 (Darmstadt, Germany), and used without further purification
colonise lands left fallow for rejuvenation. This necessitates the          unless stated otherwise.
investment of resources to remove such plants. While historically,              All experiments and measurements were performed
the excised mass was used for animal fodder during times of                 in triplicate.
famine (Łuczaj, 2010; Pinela et al., 2017), they are currently dried            All colorimetric assays were carried out in 96-well-plates and
and burnt, dug into the soil for increased organic matter or                incubated with film cover (Greiner Bio-One, Kremsmuenster,
discarded into the landfill which contributes to carbon emissions.          Austria). Absorption values were obtained using SpectraMax 190
Investigation into their nutritive value and developing efficient           (Molecular Devices, San Jose, USA).
protein extraction processes may help solve the problem of
resource waste and add potential means of compensation for                  Plant Samples
the investment made toward their active removal. Numerous                   All plant samples were collected between March and July
large-scale leaf protein extraction designs have been proposed,             in the North-East of Scotland at the following GPS co-
although commercial impetus is lacking owing to efforts being               ordinates. Gorse (Ulex europaeus), Broom (Cytisus scoparius),
diverted to crop variety selection and design. However, adopting            and Bracken (Pteridium aquilinum); 57.257, −2.483, Fireweed
such revalorization strategies may mitigate costs generally                 (Chamaenerion angustifolium); 57.157, −2.086, Vetch (Vicia
incurred from raw material sourcing while simultaneously                    sativa); 57.157, −2.139, and Buddleia (Buddleja davidii); 57.158,
dealing with downstream waste-management. Currently, the                    −2.099. Collection procedure was in accordance to guidelines by
resources dedicated to unwanted plant removal is substantial                the Ministry of Forest, CA (British Columbia Ministry of Forest,

Frontiers in Sustainable Food Systems | www.frontiersin.org             2                                   February 2021 | Volume 5 | Article 575056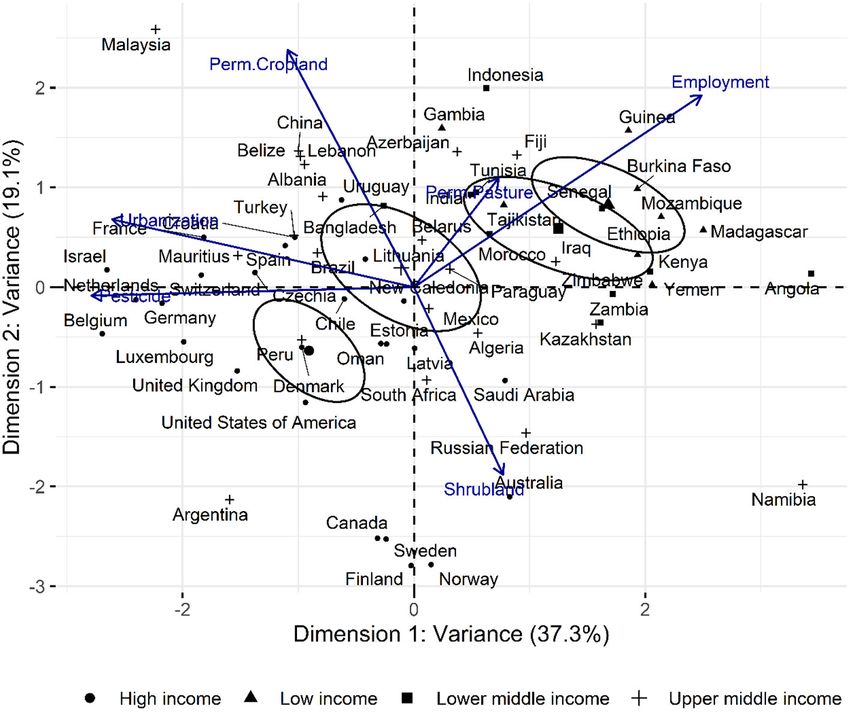
Iyer et al.                                                                                                   Invasive Plants as Protein Alternatives

1996). The sampling design aimed to gather biomass across                 Amino Acid Estimation
numerous plant samples over a unit land area. For each species            Hydrolysis for amino acid profiling was performed as previously
at the site of invasion, leaves were harvested from a random              described for protein estimation with the addition of 10 mg of
number of multiple plants in one-metre-squared plot until one             tryptamine. Essential amino acids were profiled and quantified
kilogramme of leaf mass was obtained. This was performed in               using Gas Chromatography in tandem with Mass Spectrometry
triplicate across adequately spaced one-metre plots. The leaf             (GC-MS) with U13 -C amino acids as internal standards as
samples were separated from stalks and debris and pooled,                 described previously in Calder et al. (1999).
and freeze-dried (Labconco, UK). Samples were freezer-milled
(Centramex, USA), and stored at 4◦ C under vacuum. The whole              Phenolic Characterisation
leaf samples were used to profile amino acids, phenolics, and total       Phenolics were characterised in a three-stage extraction process
NSP (Non-starch Polysaccharide).                                          as previously described (Russell et al., 2007). Briefly, 0.1 g
                                                                          of freeze-dried, freeze-milled leaf samples were sequentially
Plant Homogenisation and Extraction                                       extracted under acidic, alkali, and finally neutral pH conditions
The leaf samples (10 mg) were vortexed in phosphate buffer                using biphasic solvent extraction with ethyl acetate as the organic
(10 mL; 10 mM; pH 7.5) at 25◦ C and kept in an ultrasonic                 layer. The aqueous layer was adjusted to the required pH
bath (Branzen, B12) for 2 min. The supernatant was separated              condition using 1 M HCl or 1 N NaOH.
by centrifugation (4◦ C; 15 min; 4,000 g). A subsample of the                Quantification was performed using LC-MS as previously
aqueous supernatant extract was used for colorimetric estimation          described without modifications (Neacsu et al., 2015). Internal
of soluble phenolics, sugar and protein content. Remainder of             standard used were 13 C benzoic acid; 2 ng/µL in 0.02% acetic acid
the supernatant and precipitate were collected and freeze dried.          in 75% methanol for negative mode MS and 2-amino-3,4,7,8-
Freeze dried precipitate was used to estimate bound proteins.             tetramethylimidazo[4,5-f] quinoxaline; 0.5 ng/µL in acetic acid
                                                                          (0.02% v/v) in methanol (75% v/v) for positive mode MS.

Total Soluble Phenolics
Fast Blue assay was performed to estimate total soluble phenolics
                                                                          Non-starch Polysaccharide (NSP)
as described by Lester et al. (2012). Sample or Standard (100             Determination
µL) was incubated with 2 µL Fast Blue (0.1% w/v) for 30 s on              Non-starch polysaccharides were estimated as described by
a shaker. Sodium hydroxide (NaOH; 2 µL; 5% w/v) was added                 Englyst et al. using GC with inositol as an internal standard
and incubated for 90 min in the dark. Absorbance was measured             (Englyst and John, 1984; Englyst and Hudson, 1996; Bach
at 420 nm.                                                                Knudsen et al., 1997). Briefly, plant samples were hydrolysed in
                                                                          H2 SO4 (7 M) at 100◦ C for 1 h. Monosaccharides were analysed
                                                                          by Gas Chromatography with Flame Ionised Detection (GC-FID)
Total Soluble Sugars                                                      using Inositol as internal standard.
Lever’s assay was used to estimate soluble sugars as previously
described by Lever (1973, 1977). Lever reagent comprised of 4-
hydroxybenzoic acid hydrazide (PAHBAH, 0.76% w/v), bismuth
                                                                          Lignin Content
                                                                          Lignin content was assayed using the Acetyl Bromide method
(III) nitrate pentahydrate (0.48% w/v), potassium sodium tartrate
                                                                          (Barnes and Anderson, 2017). The protocol was modified to
(0.28% w/v), NaOH (2% w/v) in ultrapure Milli-Q water. Sample
                                                                          improve carbohydrate removal using enzymes (Hatfield et al.,
or standard (5 µL) was incubated with 200 µL of Lever reagent
                                                                          1999; Fukushima and Hatfield, 2001; Hatfield and Fukushima,
at 70◦ C for 30 min. The samples were then allowed to cool for
                                                                          2005; Hojilla-Evangelista et al., 2017). Briefly, the freeze-dried
10 min and absorbance was checked at 415 nm.
                                                                          original plant samples (100 mg) were washed with phosphate
                                                                          buffer (10 mM; 10 mL, pH 7.5) at 35◦ C twice and suspended in
Protein Estimation                                                        citric acid buffer (50 mM, 20 mL, pH 4.9) with 20 units each of
Sample hydrolysis was carried out using HCl (6 N) with phenol             cellulase, pectinase and xylanase (all three from Sigma-Aldrich)
(2% w/v) to aid removal of oxygen radicals (Muramoto et al.,              at 40◦ C for 4 h. Samples were centrifuged at 4,000 g for 15 min.
1987). Freeze-dried supernatant and retentate (10 mg) were                Retentate was recovered and resuspended in citric acid buffer and
digested in HCl (6 N; 10 mL, prepared as described above) and             incubated with Visozyme R (Novozymes, Denmark) overnight at
digested using MARS 6 (CEM, US) microwave digester with a                 32◦ C. Samples were centrifuged again under the same condition
temperature ramp to 150◦ C for 20 min. The temperature was                and the supernatant was discarded. Retentate was washed twice
maintained for 60 min and then cooled overnight.                          with 5 mL ethanol at 30◦ C, followed by 10 mL of 90% aq. DMSO
   Protein content was determined by amino acid estimation                at 40◦ C. Sample was finally washed with 10 mL acetone at 30◦ C
using the Ninhydrin Assay based on the work described by                  and allowed to dry overnight in vacuo. Dried sample (5 mg) was
Harding and MacLean (1916). An aliquot (10 µL) of the                     suspended in acetyl bromide (5% v/v) prepared in glacial acetic
supernatant was dried at 60◦ C in a microtiter plate and re-              acid and incubated for 2 h at 70◦ C. Samples were left overnight
suspended in phosphate buffer (10 mM, 100 µL, pH 7.5) to which            in the dark under ambient temperature. The absorbance of the
ninhydrin reagent (75 µL) was added and incubated at 60◦ C for            supernatant was measured at 280 nm. Absorption coefficient was
60 min. The absorbance was measured at 570 nm.                            assumed to be 23.6 g/cm/mL.

Frontiers in Sustainable Food Systems | www.frontiersin.org           3                                   February 2021 | Volume 5 | Article 575056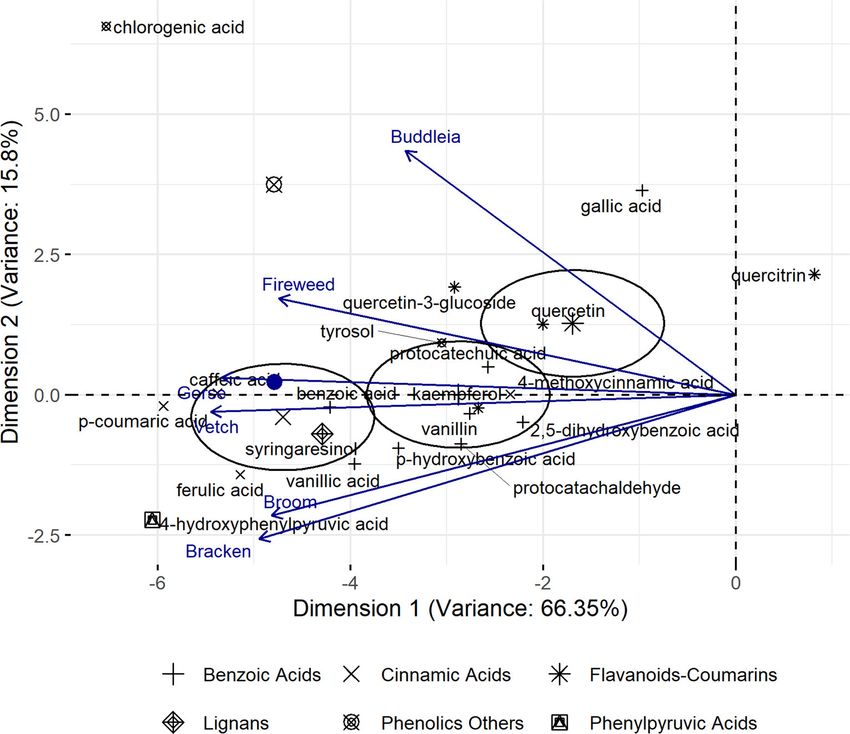
Iyer et al.                                                                                                                   Invasive Plants as Protein Alternatives

Statistics and Data Analysis                                                  TABLE 1 | Total, soluble, and bound protein in Gorse, Vetch, Broom, Fireweed,
Statistical analysis was performed using R (Version 4.0.2) and                Bracken, and Buddleia.

RStudio (Version 1.2.1335). Biological values were tested using               Plant                     Total                    Soluble                 Insoluble
one-way (OW)-ANOVA followed by the Tukey-HSD post-
hoc test at 99% confidence interval. Significance is expressed                Gorse                115.9 ± 0.8b               47.3 ± 1.2c                63.3 ± 0.3
as F(degrees of freedom, residuals) = F-value, p-value as                     Vetch                106.7 ± 0.3a               16.9 ± 0.8                 99.1 ± 0.4
recommended by Field et al. (2012) unless stated otherwise.                   Broom                112.3 ± 1.5b               40.3 ± 0.1                 90.5 ± 0.8
All graphs and visualisation have been made using ggplot2                     Fireweed             105.2 ± 1.4a               24.0 ± 1.0                 78.9 ± 1.1d
(Wickham, 2016).                                                              Bracken              142.8 ± 0.9                45.2 ± 0.5c              107.9 ± 0.6
    GPS location was downloaded from the GBIF database.                       Buddleia              81.4 ± 0.5                  7.1 ± 1.1                78.1 ± 1.4d
Identifier of the dataset used to generate maps and analysis can
                                                                              Data is expressed as mean ± standard deviation in mg/g dry plant mass. Values with same
be found at https://doi.org/10.15468/dl.tgk8j9. Packages used in              superscript were statistically similar for a category across plant species using OW-ANOVA
R were: “dplyr” (Wickham et al., 2020), “ggspatial” (Dunnington,              at 99% confidence interval with Tukey-HSD post-hoc test.
2020), “ggrepel” (Slowikowski, 2020), “sf ” (Pebesma, 2018), and
“rnaturalearth” (South, 2017).
    Principal Component Analysis (PCA) of the phenolic                        were revealed using Tukey-HSD post-hoc test between Gorse
composition was performed on logarithmically transformed                      and Broom (p = 0.10), and Vetch and Fireweed (p = 0.69).
data using packages factoextra (Kassambara and Mundt, 2019)                   Soluble protein represents the protein fraction extractable using
and FactoMineR (Lê et al., 2008). Diagnostics of loadings and                 mechanical grinding and buffer solubilisation which ANOVA
contribution to the PCA analysis was performed with the help                  deemed to have significant overall distinction [F (5,12) = 1,208; p
of the package corrplot (Wei and Simko, 2017).                                = 8.9 × 10⁻¹⁶ ]. A post-hoc test, however, could not distinguish
    The database on world agricultural values, obtained from                  between Gorse and Bracken at a 99% confidence interval (p =
FAOSTAT was subjected to exploratory factor analysis using                    0.03). Gorse had 47.3 ± 1.2 mg/g soluble protein (40.8% total
the package psych (Revelle, 2020). Further confirmatory                       protein), while Bracken had 45.2 ± 0.5 mg/g soluble protein
analysis was performed using lavaan (Rosseel, 2012) and                       (31.6% of total protein). The insoluble protein indicates proteins
lavaanPlot (Lishinski, 2018). Univariant PCA was performed                    which remain bound to the cell wall and require further effort
using factoextra, to visualise overarching trends across countries            for extraction to efficiently use the biomass. ANOVA test found
under reduced dimensions. From the database, general regions                  significant difference across the plants [F (5,12) = 1,356; p = 4.45
such as “OECD,” “South-east Asia,” and similar classifications                × 10−16 ], although a post-hoc test could not distinguish between
in the database were removed. Finally, all measures of land                   Buddleia and Fireweed (p = 0.96).
use were made intrinsic for a country by calculating its                         In Table 2, the amino acid composition of the plants is shown.
percentage coverage relative to its geopolitical land area. A naïve           The difference in amino acid profile was found to be statistically
approach was adopted toward factor selection where percentage                 significant [F (5,318) = 4.645; p = 4.17 × 10⁻⁴ ] across plants, but a
deviation was used as the metric of choice which showed high                  post-hoc test found Buddleia as the influencing component with
variation across individual countries. Factors with a percentage              a difference which was significant at a 99% confidence interval
deviation value >100 were chosen for further exploratory factor               from Broom (p = 0.005) and Bracken (p = 2.1 × 10⁻⁵ ) and at
analysis using maximum likelihood (ML) factor reduction to                    a 95% confidence interval from Fireweed (p = 0.040) and Gorse
understand correlation to the latent factors. Finally, a System               (p = 0.010). Statistical difference was insignificant between the
Equation Mode (SEM) was constructed based on the correlation                  other five plants. Similarities in individual essential amino acid
using confirmatory analysis. Income group classification was                  content at 99% confidence interval is also shown in Table 2. Total
performed according to data from World Bank (2020).                           essential amino acid content of the leaf mass was found to be
                                                                              similar between Gorse and Broom (p = 0.99).
                                                                                 The total essential amino acid content of Gorse, Vetch, Broom,
RESULTS                                                                       Fireweed, Bracken and Buddleia are 33.05 ± 0.04, 41.43 ± 0.05,
Nutritional Characterisation of Six Invasive                                  33.05 ± 0.11, 32.63 ± 0.04, 48.71 ± 0.02, and 21.48 ± 0.05 mg/g
Plant Species                                                                 dry plant mass. When this is presented for % of total protein,
Six invasive plants (Gorse, Vetch, Broom, Fireweed, Bracken, and              the essential amino acid content was the highest for Vetch and
Buddleia) were characterised for total protein content, amino                 appeared to be unique across the plants [F (5,12) = 259.1, p =
acid profile, non-starch polysaccharide (NSP) composition, and                8.67 × 10⁻¹² ] using OW-ANOVA. No statistical difference was
phenolic composition to assess their potential for revalorisation.            found between Bracken and Buddleia (p = 0.015), and Gorse and
                                                                              Bracken (p = 0.013) at 99% confidence interval.
Protein and Amino Acids
Across the plant samples, Bracken was found to have total protein             Non-protein Components
content significantly greater than other plant samples as shown               Additional plant components such as carbohydrate and non-
in Table 1. A one way (OW)-ANOVA test at a 99% confidence                     nutrient plant bio-actives have potential use as food or
interval across plant samples for total protein content was found             feed and could provide health benefits or wider uses as
to be significant [F (5,12) = 725.3; p = 1.88 × 10⁴ ], but similarities       biomaterials contributing to an effective cyclic economy. Table 3

Frontiers in Sustainable Food Systems | www.frontiersin.org               4                                              February 2021 | Volume 5 | Article 575056
Iyer et al.                                                                                                                                    Invasive Plants as Protein Alternatives

TABLE 2 | Amino acid content of Gorse, Vetch, Broom, Fireweed, Bracken, and Buddleia.

                       Gorse                         Vetch                        Broom                        Fireweed                      Bracken                     Buddleia

His                1.54 ± 0.12                   1.85 ± 0.04a                  2.24 ± 0.01                   1.84 ± 0.02a                 2.64 ± 0.03                   1.06 ± 0.11
Ile                2.64 ± 0.01                   3.69 ± 0.02                   1.92 ± 0.01                   1.61 ± 0.00b                 3.42 ± 0.00                   1.72 ± 0.01b
Leu                7.84 ± 0.01c                 10.18 ± 0.01c                  8.03 ± 0.01c                  8.48 ± 0.00                 11.61 ± 0.01                   5.39 ± 0.00
Lys                6.80 ± 0.01d                  6.83 ± 0.02d                  6.97 ± 0.01d                  6.54 ± 0.00                  9.22 ± 0.01                   3.96 ± 0.01
Met                1.36 ± 0.03e                  1.80 ± 0.02                   1.14 ± 0.00f,g                1.25 ± 0.01e,f               2.21 ± 0.02                   1.09 ± 0.02g
Phe                4.53 ± 0.02                   6.10 ± 0.03                   4.86 ± 0.01                   5.27 ± 0.00                  7.02 ± 0.02                   3.07 ± 0.01
Thr                4.17 ± 0.02                   5.34 ± 0.03                   3.45 ± 0.01                   3.28 ± 0.02                  6.20 ± 0.02                   2.66 ± 0.01
Trp                0.42 ± 0.03h                  0.59 ± 0.15h                  1.71 ± 0.33i                  1.65 ± 0.11i                 1.64 ± 0.02i                  0.21 ± 0.10h
                                                                                               j                           j
Val                3.75 ± 0.01                   5.05 ± 0.00                   2.73 ± 0.00                   2.71 ± 0.00                  4.75 ± 0.00                   2.32 ± 0.01
Ala                7.69 ± 0.02                   7.98 ± 0.01                   8.53 ± 0.0                    9.45 ± 0.01                 11.19 ± 0.02                   4.53 ± 0.01
Arg                6.13 ± 0.02                   6.81 ± 0.02                   5.84 ± 0.02                   6.27 ± 0.00                  8.02 ± 0.01                   3.73 ± 0.07
Asp               20.24 ± 0.11                  11.04 ± 0.01                 21.75 ± 0.1                    11.77 ± 0.05                 20.21 ± 0.09                   7.32 ± 0.3
Cys                0.45 ± 0.00                   0.24 ± 0.00                   0.46 ± 0.01                   0.45 ± 0.01                  0.54 ± 0.00                   0.19 ± 0.00
Glu               11.54 ± 0.06                  14.90 ± 0.04                 12.47 ± 0.04                   13.28 ± 0.04                 18.68 ± 0.02                   7.67 ± 0.12
Gly                8.13 ± 0.08                   7.66 ± 0.06                   9.96 ± 0.02                  10.47 ± 0.01                 12.36 ± 0.02                   4.72 ± 0.02
Pro                7.57 ± 0.01                   6.24 ± 0.01                   5.90 ± 0.00                   5.50 ± 0.01                  8.42 ± 0.01                   3.61 ± 0.01
Ser                8.16 ± 0.05                   6.93 ± 0.10                   7.82 ± 0.02                   7.06 ± 0.07                 10.51 ± 0.03                   3.85 ± 0.03
Tyr                4.55 ± 0.01                   5.30 ± 0.01                   4.54 ± 0.01                   4.48 ± 0.01                  7.22 ± 0.01                   2.85 ± 0.01
Total           107.51 ± 0.21                  108.54 ± 0.21                110.32 ± 0.35                  101.35 ± 0.15                145.86 ± 0.11                  59.93 ± 0.37*

Data is expressed as mean ± standard deviation in mg/g dry plant mass. Histidine to Valine represent essential dietary amino acids where values with same superscript were statistically
similar using OW-ANOVA at 99% confidence interval with Tukey-HSD post-hoc test. The * mark represents the significantly lower total amino acid value obtained for Buddleia compared
to other plants.

                                                                                                      Two-way ANOVA test on a model expressing soluble protein
TABLE 3 | Summary of proximate values for phenolic and carbohydrate content.
                                                                                                   content (Table 1) as a function of constituent NSP monomers
Plant                  Carbohydrate                              Phenolic                          (Table 4) showed significant association with Arabinose [F (1,11)
                                                                                                   =437.74, p = 3.29 × 10⁻¹⁰ ], Fucose [F (1,22) = 269.72, p =
                 Soluble               NSP               Soluble            Lignin
                                                                                                   4.37 × 10⁻⁹ ], Rhamnose [F (1,22) = 20.60 p = 8.4 × 10⁻³ ], and
Gorse         26.1 ± 0.7c       172.3 ± 9.0           25.5 ± 6.8b         83.7 ± 4.5a              Galactose [F (1,22) = 10.66 p = 0.008]. A multiple regression
Vetch         53.9 ± 2.0d       129.5 ± 3.2           29.4 ± 4.8b         11.7 ± 1.8               analysis revealed Xylose and Rhamnose content in the leaf mass
Broom         32.5 ± 3.2c       163.3 ± 6.5           96.8 ± 18.1         64.4 ± 1.3               could serve as predictors for soluble protein content which was
Fireweed      54.2 ± 2.3d         82.6 ± 7.5          28.9 ± 3.0b         35.7 ± 1.2               significant at [F (1,15) = 402.16, p = 3.035 × 10⁻¹² ] and [F (1,15)
Bracken       28.4 ± 3.9c       172.1 ± 6.3           26.9 ± 5.1b         78.8 ± 2.8a
                                                                                                   = 34.69, p = 2.97 × 10⁻⁵ ], respectively, with values expressed in
Buddleia      50.0 ± 2.0d       112.3 ± 5.3           54.1 ± 5.7          48.1 ± 7.1
                                                                                                   mg/g dry plant mass in the equation:

Results are presented in mg/g dry plant mass. Values with the same superscript are
statistically similar using OW-ANOVA at 99% confidence interval with Tukey-HSD post-hoc
test. NSP, non-starch polysaccharide.
                                                                                                       Soluble Protein = 0.98 · Xylose − 3.07 · Rhamnose + 22.15

                                                                                                   Goodness of fit of the linear model is shown in
summarises proximate values of non-protein components and                                          Supplementary Figure 1.
their distribution in the aqueous soluble and non-soluble                                             From the perspective of process development, such
fractions measured across the six leaf samples.                                                    associations are particularly important as plants such as
   Correlation analysis across all measurements given in Tables 1                                  Gorse, Broom and Bracken could yield higher dividends with
and 3 revealed a strong relation between soluble carbohydrate                                      simple mechanical extraction, leaving behind substrates rich in
and lignin (r2 = −0.89, p = 5.52 × 10⁻⁷ ), soluble protein and                                     NSP and Lignin. It further highlights the association between
lignin (r2 = 0.78, p = 1.43 × 10⁻⁴ ), lignin and NSP (r2 = 0.70,                                   protein and cell wall and the possible treatment; particularly
p = 1.15 × 10⁻³ ), soluble carbohydrate and NSP (r2 = −0.87,                                       enzymatic, which may be employed to efficiently utilise the
p = 3.64 × 10⁻⁶ ), soluble carbohydrate and soluble protein (r2                                    biomass. Furthermore, the comparable Lignin and NSP values
= −0.89, p = 5.57 × 10⁻⁷ ), and of particular interest, soluble                                    of Gorse, Broom and Bracken to de-pithed bagasse (Hajiha and
protein and NSP (r2 = 0.77, p = 1.58 × 10⁻⁷ ). No significant                                      Sain, 2015) warrants further investigation into their potential use
associations were found with insoluble protein bound to the cell                                   in paper-making or other higher value processing (Rainey and
wall with any measured proximate components.                                                       Covey, 2016).

Frontiers in Sustainable Food Systems | www.frontiersin.org                                5                                              February 2021 | Volume 5 | Article 575056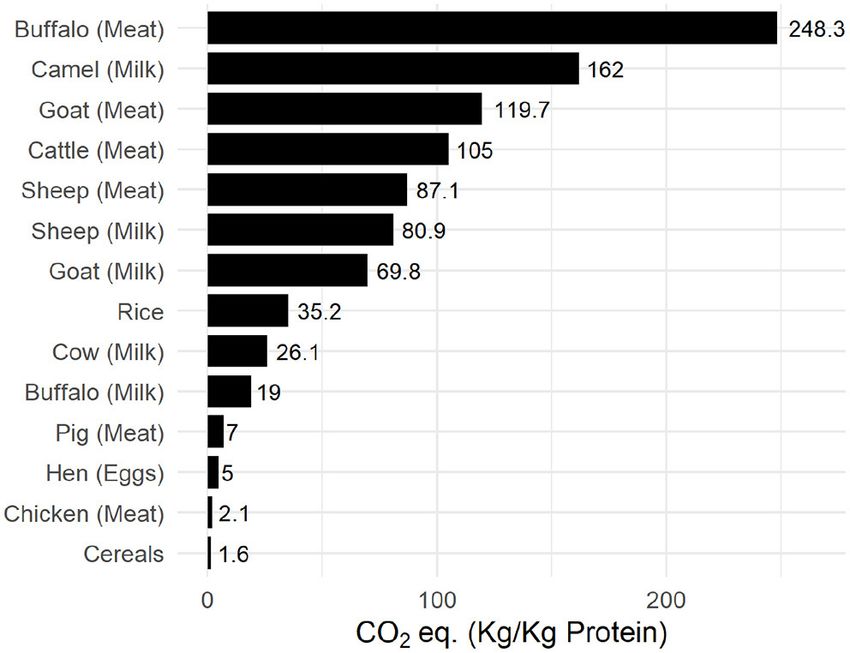
Iyer et al.                                                                                                                                Invasive Plants as Protein Alternatives

TABLE 4 | Neutral sugar composition of non-starch polysaccharide in Gorse, Broom, Fireweed, and Buddleia. Gorse, Vetch, Broom, Fireweed, Bracken, and Buddleia.

Plant             Type           Rhamnose               Fucose              Arabinose               Xylose              Mannose                Galactose            Glucose

Gorse           Insoluble        4.7 ± 0.5a            1.4 ± 0.1c          23.0 ± 0.3           41.1 ± 0.8             4.6 ± 0.4e,f           11.7 ± 0.2g          85.8 ± 1.5
                Soluble               –                0.1 ± 0.0            0.2 ± 0.1                  –                    –                  0.2 ± 0.1            0.1 ± 0.0
Vetch           Insoluble        4.6 ± 0.1a            1.1 ± 0.2           10.1 ± 0.1           10.0 ± 0.1d           16.0 ± 0.2              16.4 ± 0.2           71.3 ± 0.4i
                Soluble               –                0.1 ± 0.0            0.1 ± 0.0                  –                    –                  0.1 ± 0.0            0.1 ± 0.0
Broom           Insoluble        4.0 ± 0.1b            1.0 ± 0.0           28.4 ± 0.5           34.9 ± 1.0             5.2 ± 0.1e             14.4 ± 0.4h          75.4 ± 2.2i
                Soluble               –                0.1 ± 0.0            0.3 ± 0.0             0.1 ± 0.0                 –                  0.3 ± 0.0            0.1 ± 0.0
                                                                   c                                          d                    f
Fireweed        Insoluble        2.6 ± 0.2             1.4 ± 0.0           11.2 ± 0.3             9.8 ± 0.2            4.1 ± 0.1              17.7 ± 0.4           35.8 ± 2.3
                Soluble          0.1 ± 0.0             0.1 ± 0.0            0.3 ± 0.0             0.1 ± 0.0            0.1 ± 0.0               0.3 ± 0.0            0.2 ± 0.0
Bracken         Insoluble        4.2 ± 0.1a,b          1.5 ± 0.0c          18.3 ± 0.2           31.9 ± 0.4             6.3 ± 0.1              12.4 ± 0.0g          97.5 ± 2.9
                Soluble               –                0.1 ± 0.0            0.2 ± 0.0                  –                    –                  0.2 ± 0.1            0.1 ± 0.0
Buddleia        Insoluble        7.3 ± 0.2             0.7 ± 0.1           13.0 ± 0.2             7.7 ± 0.2            8.7 ± 0.3              14.9 ± 0.3h          60.0 ± 3.0
                Soluble          0.1 ± 0.0             0.1 ± 0.0            0.3 ± 0.0                  –                    –                  0.3 ± 0.0            0.1 ± 0.0

Data is presented at mean ± standard deviation in mg/g dry plant mass. Values with the same superscript are statistically similar using OW-ANOVA at 99% confidence interval with
Tukey-HSD post-hoc test. Values with the same superscript indicate similar statistical similarity across corresponding plant samples.

   The free sugars measured in the aqueous extract reflect the                              Global Distribution of Investigated Invasive
moieties undergoing translocation in the leaf fated for catabolism                          Plants
or storage (Goldschmidt and Huber, 1992). The soluble phenolics                             Based on the hits for GPS points classified under a given invasive
were highest for Broom although, Gorse was found to have                                    plant family, their global and Scottish abundance are shown
the highest overall phenolic content of 109.2 ± 8.1 mg/g dry                                in Figure 2. In the global list of family abundance, among 635
plant mass with 76.6% of it bound to the plant cell wall                                    families identified, Fabaceae featured second while Onagraceae
components. Syringaresinol was the most abundant lignan across                              ranked 39, Dennstaedtiaceae ranked 76, and Buddlejaceae ranked
the plants and was particularly high in Gorse (47.4 ± 8.1 mg/Kg),                           245. The Scottish family abundance identified the presence of
Broom (43.3 ± 6.4 mg/Kg), and Bracken (28.7 ± 2.7 mg/Kg)                                    131 families with Fabaceae ranking fourth, Onagraceae ranked
(Supplementary Table 1). Gorse was rich in chlorogenic acid                                 19 Dennstaedtiaceae ranked 52, and Buddlejaceae ranked 62.
(1.5 ± 0.1 g/Kg) and in general showed a higher content of all                                 The expected resolution for such broad, satellite-based
phenolic groups.                                                                            vegetation survey is between 120–250 m. The details are
   Among the 112 phenolic compounds analysed                                                provided in the GPS uncertainty margins available in the GIBF
(Supplementary Table 1), 25 compounds accounted for 90% of                                  database and an account of uncertainties and challenges in
total variance observed across all plants and largely influenced                            remote measurement is provided by Lawrence et al. (2006);
their characterisation. Correlation and contribution of each                                Niphadkar and Nagendra (2016); Baron et al. (2018). At a
component plant and phenolic compound, respectively, to the                                 shrub density between 45 and 70 Kg/m2 (Passioura, 1991),
composite PCA axes is given in Supplementary Tables 2, 3. The                               the mean biomass held in invasive plants is roughly 52.2
plot (Figure 1) revealed that flavonoids as well as cinnamic-                               Tg, which translates to 26.1 Tg of carbon and 5.2 Tg of
and phenylpyruvic acid derivatives largely influenced the profile                           protein. Globally, annual protein requirement is 215 Tg. This
diversity. Relative position of plants as function of their phenolic                        could potentially supply about 2.5% of global annual protein
profiles is provided in the Supplementary Figure 2 which                                    requirements, assuming 1.2 g/Kg body weight of daily protein
shows a loose recapitulation of their phylogenetic grouping.                                intake as recommended by the National Institutes of Health
Gorse, Broom, and Vetch, which belong to the Fabaceae family                                (NIH) (Phillips et al., 2016). In Scotland, the biomass held
are expected to plot closer while distancing themselves from                                in invasive plants is roughly 448.27 Gg, which translates to
Bracken, Fireweed, and Buddleia. However, Gorse and Broom                                   224.14 Gg of carbon and 45 Gg of protein. Scottish annual
appeared to have a rather unique profile while Vetch plots closer                           protein requirements are approximately 118.4 Gg, indicating
to Bracken. Fireweed and Buddleia plot separately, reflecting                               that invasive plants could supply about 25% of annual protein
their distinctive phenolic profiles.                                                        requirements. Interestingly, in terms of minimum essential
   Pearson’s test on cinnamic derivatives against phenylalanine                             amino acids recommended by the World Health Organisation
(Table 2) reveals a strong positive correlation to cinnamic                                 (WHO) (Joint WHO/FAO/UNU Expert Consultation, 2007), the
acid and 3,4,5-trimethoxycinnamic acid content across the six                               estimated protein present in the invasive plant biomass could
investigated plants (R2 = 0.92 and 0.94, respectively). Larger                              potentially satisfy about 3.5% of global annual requirements.
samples sizes may be required to corroborate this observation,                              Comparison of essential amino acids produced from existing
although established biochemical pathways give some support to                              agricultural products to the estimated values in the invasive plant
this observation (Hyun et al., 2011; Vargas-Tah and Gosset, 2015).                          mass is given in Figure 3 using global and Scottish datapoints.

Frontiers in Sustainable Food Systems | www.frontiersin.org                             6                                              February 2021 | Volume 5 | Article 575056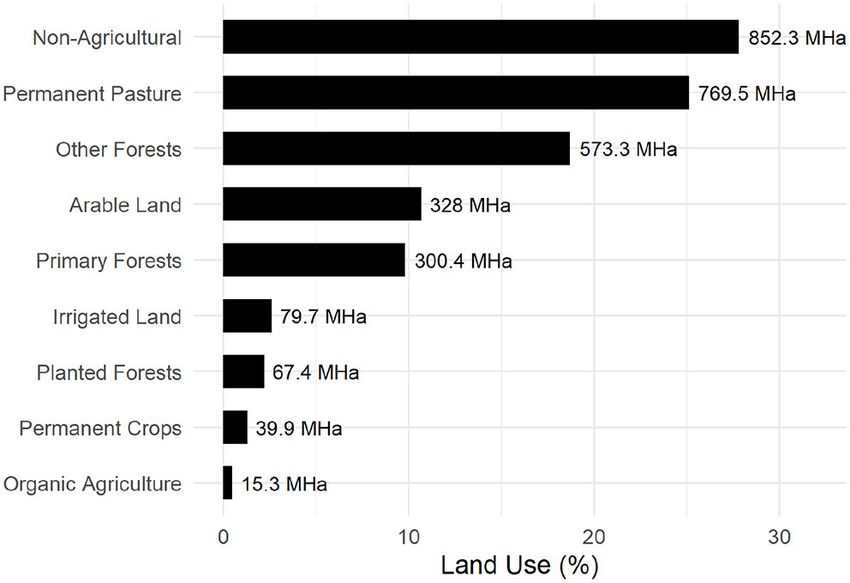
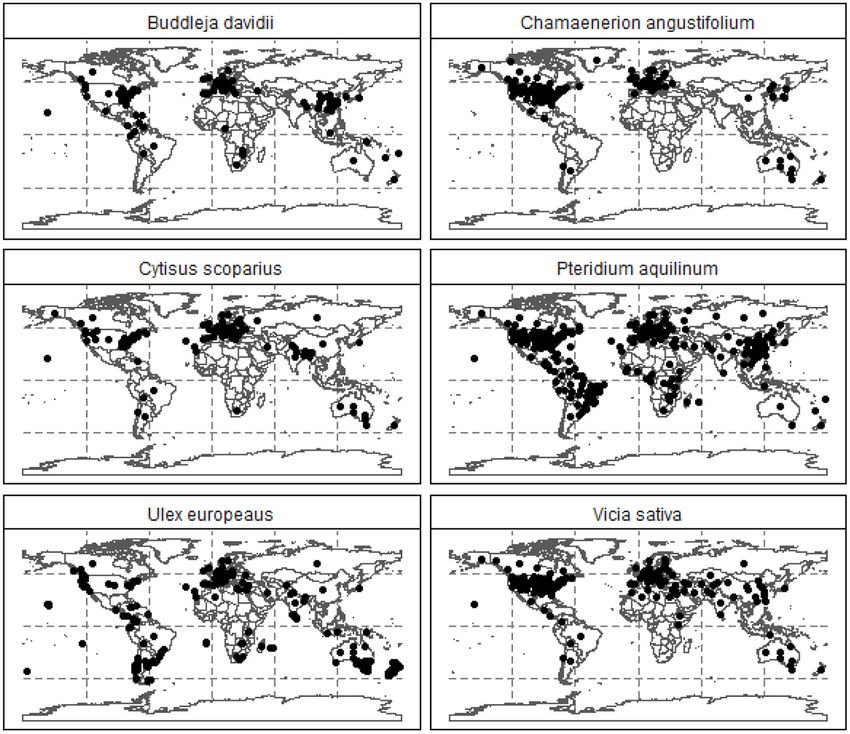
Iyer et al.                                                                                                                             Invasive Plants as Protein Alternatives

  FIGURE 1 | Principal Component Analysis (PCA, univariant-scaled) profile of Gorse, Vetch, Broom, Fireweed, Bracken, and Buddleia across six phenolic groups.
  Ellipses represent 95% confidence intervals beyond which loadings significantly driving plant characterisation are expected to plot. Relative similarity of plants
  represented as resultant vectors of contributing phenolic profile is indicated by their distance from the mean which is indicated as a filled blue circle along Dimension 1.

  FIGURE 2 | Abundance of the top 10 plant families based on their occurrence in the GIBF database. (A) Family abundance globally. (B) Family abundance in
  Scotland. Values express the protein content estimated in the biomass of these plants.

It was observed that the essential amino acid content of all                               provided in Supplementary Figure 4. The essential amino acid
invasive plants could satisfy partial global and Scottish dietary                          content in families to which the six plants investigated is shown
requirements from locally sourced invasive plants. Estimates                               in Figure 4 and the GPS locations were plotted on a map to
of the individual essential amino acid content of commercial                               understand their spread and identify areas most susceptible to
agricultural produce as well as the invasive plant biomass is                              their invasion in Figures 5, 6.

Frontiers in Sustainable Food Systems | www.frontiersin.org                            7                                            February 2021 | Volume 5 | Article 575056
Iyer et al.                                                                                                                         Invasive Plants as Protein Alternatives

  FIGURE 3 | Estimated content of essential amino acid present in invasive plant biomass. (A) Values for global essential amino acid content of agricultural produce and
  invasive plant mass. (B) Values for Scottish essential amino acid content of agricultural produce and invasive plant mass.

  FIGURE 4 | The relative abundance of the families of the plants investigated in this work based on their occurrence in the GIBF database. (A, B) Values represent the
  protein estimated in the invasive biomass.

Implications for Land Allocation                                                        acquisition through “slash-and-burn” cultivation (Uhl, 1987;
Allocation of fertile land for food production and forestry has a                       Kleinman et al., 1995; Brady, 1996) accounts for 17% of
major impact on global carbon storage (Smith et al., 2008). Of the                      agricultural emissions.
available fertile land used for economic agriculture and forestry,                          Effect of increased resource allocation to animal husbandry
25.1% is used exclusively for animal husbandry, predominantly                           and its use as the dominant source of dietary protein can be
as meadows and pastureland (Figure 7). It is the single largest                         observed in the carbon footprint to produce yield. Figure 9
allocation in agricultural land use surpassing the combined value                       illustrates the carbon-cost of common agricultural raw produce.
of all other actively developed land such as irrigated, planted, and                    Cumulative effect of enteric emissions and manure handling on
organic and permanent crop land.                                                        the carbon footprint can be observed for ruminant meat such as
    Despite the landmass available for plant growth shown in                            cattle, goats, and buffalo, which is about 40 times higher than
Figure 7, emissions associated to high-energy agriculture,                              plant based or non-ruminant chicken produce.
potentially offset any anabolic carbon storage. Animal                                      The initial database from FAOSTAT contained factors that
husbandry contributes to 22% of total agricultural emissions                            were converted to intrinsic percentages where applicable. For
through direct enteric fermentation via ruminants and a                                 example agricultural land area was converted to an intrinsic
further 15% through manure management. This involves                                    value relative to the individual country size. Each subset of
soil conditioning of crop and pastureland (Figure 8)                                    agriculture-associated emissions was converted to a percentage of
or disposal, making it the single largest contributor of                                total agricultural emissions. The initial set of factors were: Bovine
agricultural emission. Burning of organic matter, either                                Meat (g/day), Livestock (LSU/ha), Pesticide (Kg/ha), Fertiliser
as a means of crop/plant waste disposal or fresh land                                   (Kg/ha), per capita Emission (t), Agri Employment (% labour

Frontiers in Sustainable Food Systems | www.frontiersin.org                         8                                          February 2021 | Volume 5 | Article 575056
Iyer et al. Invasive Plants as Protein Alternatives
FIGURE 5 | Invasive plant distribution in Scotland, identified using GPS-Satellite imagery.
force), Enteric Fermentation (% agricultural emission), Crop An exploratory factor analysis (EFA) using maximum
Residue Burning (% emission), Agricultural Soils (% emission), likelihood (ML) suggested an optimal number of two latent
Soil Manure (% emission), Pasture Manure (% emission), Manure factors (shown in Supplementary Figure 3) with corresponding
Management (% emission), Synthetic Fertilisers (% emission), correlations shown in Supplementary Table 4. The RMSR (root
Animal Origin Emission (% emission), Grassland (% land area), mean square of residuals) was 0.06. The RMSEA (root mean
Agricultural land (% land area), Arable Land (% land area), square of approximation) index was found to be 0.055 with a 90%
Cropland (% land area), Forest land (% land area), Permanent confidence interval ranging from 0 to 0.205 and a BIC at −11.85.
Pasture (% land area), Permanent Cropland (% land area), The Tucker-Lewis Index (TLI) was 0.88.
Shrubland (% land area), and Urbanisation (% land area). Based on the suggestions provided by EFA, a confirmatory
Among the available factors, only those with a analysis (CA) of a system equation model (SEM) was performed
percentage deviation >100 were chosen as shown in where the first latent factor (ML1) was expressed as an additive,
Supplementary Figure 5. Factor analysis is optimal across non-interactive model comprised of Permanent Cropland,
independent factors with normally distributed data. Within Permanent Pasture, and Shrubland, while the second latent factor
a strict maximum cut-off value of |R2 | > 0.4 and at a 99% was expressed as an additive, non-interactive model comprised
confidence interval, correlation analysis found Livestock to of Employment, Pesticide use, and Urbanisation. The resultant
have strong and significant associations with Urbanisation model is depicted in Figure 10 below. The RMSEA of the model
and Pesticide use (R2 = 0.79 and 0.45, p: 7.54 × 10⁻¹⁵ was 0.064 (10% confidence range: 0.00–0.167) and a comparative
and 1.88 × 10⁻⁴ , respectively). Since Livestock could be fit index (CFI) of 0.925. The standardised root mean square
expressed as an equation of Urbanisation and Pesticide, residual was 0.061.
it was filtered out. Lastly, the values for plant protein as As a complementary assessment, the PCA analysis of the
a percentage of total protein produced (Plant.Production) selected high-variant intrinsic agricultural factors is shown in
failed the Royston test for normality and was filtered out. Figure 11 below. The plot accounts for 56.44% of total observed
The final dataset contained six factors, namely, Permanent variance and it is interesting to note that countries, particularly
Cropland (Perm.Cropland), Shrubland, Urbanisation, Labour the high and upper-middle income countries plot distinctly
force in agriculture (Agri.employment), Pesticide use, and compared to the low and lowering middle income groups. This
Permanent Pasture. suggests that the emergent factor which can be elucidated over
Frontiers in Sustainable Food Systems | www.frontiersin.org 9 February 2021 | Volume 5 | Article 575056Iyer et al. Invasive Plants as Protein Alternatives
FIGURE 6 | Global distribution of the six invasive plants investigated here.
the factor analysis is the overall economic status of a country The principle underpinning the factor analysis described was
although no direct economic parameter such as GDP or per- that the dynamics of a multicomponent system was a function
capita income was fed into the factor analysis steps. Correlation of its most variable factors. In the principal component analysis
and contribution of the factors and variables, respectively, to the (PCA) plot shown in Figure 11, vectors (high variant factors)
composite axes is given in Supplementary Tables 5, 6. drove the relative positioning of individual countries; revealing
characteristic clustering (the emergent factor), which in this case
DISCUSSION reflected economic status. Diagonally opposing vectors function
antithetically while those of similar orient amplify effect. A
The strong association between land use and CO2 emissions was more defined relation between the factors is provided by the
previously demonstrated by Smith et al. (2013) who suggested structural equation model (SEM) depicted in Figure 10 which, in
the reallocation of agricultural resources toward more climate- conjunction with PCA revealed a strong association between the
friendly plant-based cultivation. A detailed account of the carbon economy and land use and by extension, the emissions associated
flow through the agricultural system was reported by Molotoks to agriculture. Shrubland was used a proxy for the marginal
et al. (2018), which provides strong quantitative evidence of lands where native and introduced invasive plants are found.
the contribution of fertiliser use and forest land reclamation The opposing influence between shrubland and permanent
toward emissions associated to food production. Complementary cropland in the PCA plot reveals their contrasting effects in the
to their work, global agricultural data from FAOSTAT was used to characterisation of countries and their role in economic output
identify trends that arise when high variable factors are assessed. as well as local ecology.
Frontiers in Sustainable Food Systems | www.frontiersin.org 10 February 2021 | Volume 5 | Article 575056Iyer et al. Invasive Plants as Protein Alternatives
FIGURE 7 | Global land use for Agricultural and Forestry (FAO, 2019).
FIGURE 9 | Carbon-impact of common agricultural produce. Data was
compiled from FAOSTAT (FAO, 2019).
by invasive plant encroachment to 1 Pg, while according to
estimates here based on satellite surveys, the total biomass
present across all invasive plants is about 52 Tg. It is uncertain
to what extent the biomass has been underestimated. It may be
that recurring loss of agricultural biomass is caused by regular
encroachment of invasive plants from the presently identified
locations, which act as their natural reservoirs. Improved data
collection is required to ameliorate uncertainties and help give
a better estimate of the invasive biomass. Despite the possible
underestimation, it was observed that the essential amino acid
content of these plants may be sufficient to supplement Scottish
and to some extent, global requirements.
Among the invasive plants investigated, Bracken was found
to have the highest protein content (Table 1) and Vetch
FIGURE 8 | Global emissions from agriculture and associated land use
to contain the highest essential amino acid content in its
compiled from FAOSTAT (FAO, 2019). Emission values are expressed in constituent proteins (Table 2). However, in terms of protein
Petagram (Pg). accessibility easily achieved from mechanical grinding, Bracken
and Gorse were found to have the highest soluble protein content
(Table 1). However, the presence of potent carcinogens, namely,
Maps showing the confirmed locations of invasive plants ptaquiloside (Niwa et al., 1983; O’Driscoll et al., 2016) found
chosen for this study were identified using GPS-satellite in Bracken makes it an unsuitable candidate until purification
imagery as shown in Figures 5 and 6. Among the families methods capable of removing these anti-nutrients are developed.
of the invasive plants chosen for this study, Fabaceae was In Vetch, only 15% of total protein was accessible, which was
highly represented in Scottish and global regions followed by less than half that of Gorse, Broom, or Bracken. This may
Onagraceae, Dennstaedtiaceae, and Buddlejaceae. These plant require further enzymatic or chemical extraction methods to
families are in abundance in the North-East of Scotland. While fully realise the nutritional potential, but processes such as this
satellite-imagery has improved over the decades and is invaluable may result in loss of essential amino acids depending on the
in identifying endangered plant species and contributing toward nature of treatment. Traditional alkali-based extraction followed
conservation efforts, the work toward understanding the spread by neutralisation can result in severe loss of lysine and tryptophan
of invasive species remains relative nascent. The GPS locations (Jung et al., 2006) and generate significant effluent volumes, while
from where the plant samples were obtained (see Materials and the enzymatic procedures would substantially increase process
Methods) were not registered in the year 2020 database despite cost (Sari et al., 2015).
the plants having a sizeable coverage within those locations. Physical features differentiating leaves such as their hardness,
Such errors decrease overall plant count and may underreport affect the design used to effectively extract proteins, which is
the severity of the problem faced on account of their spread. primarily governed by the plant cell-wall composition. It is
Molotoks et al. (2018) estimated agricultural carbon losses faced interesting to note that Gorse, Broom, and Bracken are often
Frontiers in Sustainable Food Systems | www.frontiersin.org 11 February 2021 | Volume 5 | Article 575056Iyer et al. Invasive Plants as Protein Alternatives FIGURE 10 | SEM-model constructed using intrinsic agricultural factors. Pesticide, pesticide used in tonnes; Urbanisation, percentage land area converted to artificial surfaces; Employment, percentage labour force in agriculture; PermCropland, percentage land area used as cropland; PermPasture, percentage land used as permanent pasture; and Shrubland, percentage marginal land. FIGURE 11 | Principal component analysis (univariant-PCA) of countries according to permanent pasture (% of total land area), Shrubland/marginal land (% of total land area), LSU/ha, Plant protein production (plant protein produced as a percentage fraction of gross national protein produced), pesticide use (t), Urbanised land (% of total land area), permanent cropland (% of total land area), and Agriculture employment in agriculture (% labour force). subject to herbivory (Tempel, 1981; Broadfield and McHenry, et al., 2018; Wierzbicki et al., 2019). When leaf samples are 2019) and values of high lignin and NSP (Tables 3, 4) may dried, this manifests as a brittle leaf structure making it amenable reflect investment toward defensive mechanisms by toughening to crushing and juicing for protein extraction. Bracken and leaf mass or employing anti-nutrients; as in the case of Bracken Broom leaf samples on the other hand show similar, but lower (Niwa et al., 1983; O’Driscoll et al., 2016). The particularly xylose content compared to Gorse, which in conjunction with a woody nature of Gorse may be attributed to the high xylose relatively lower lignin content and may have resulted in a more content capable of producing branched, interlocking structures flexible leaf structures (Arola et al., 2013; Busse-Wicher et al., in conjunction with the lignin (Grantham et al., 2017; Gericke 2014). Frontiers in Sustainable Food Systems | www.frontiersin.org 12 February 2021 | Volume 5 | Article 575056
Iyer et al.                                                                                                        Invasive Plants as Protein Alternatives

    Gorse has been prolific in more than 16 countries (Broadfield             world, a significant portion is expected to be repurposed marginal
and McHenry, 2019); particularly in Oceania where it was                      land incapable of high-intensity farming (Asner et al., 2004; Peco
introduced as an ornamental plant as well as to build natural                 et al., 2006). These sites tend to retain a considerable part of plant
barriers around private properties (Hoffmann and Broadhurst,                  biodiversity and the native plants found in these sites come under
2016; Figure 6). Downstream process development for protein                   enormous survival pressures from climate change, herbivory, and
extraction using leaves from Gorse appears to be a lucrative                  invasive plants and in many cases have been pushed to extinction
solution of deriving nutrition as it had the highest protein                  (Duncan et al., 2004; Truscott et al., 2008; Lankau, 2012).
recovery using economical methods such as mechanical grinding                     Given the average rise in global temperatures was recorded to
and buffer extraction. Although leaf proteins have previously                 be 1.96◦ C (2018–2019) (FAO, 2019; Roe et al., 2019), vulnerable
faced disregard owing to low essential amino acids such as                    economies, which are primarily agrarian are likely to face
lysine, tryptophan and methionine, which were lost during                     greater impact of adverse climatic conditions which could pivot
traditional alkali extractions (Cuq et al., 1983; Zhang et al., 2017),        them further into distress. A combination of novel, sustainable
improvements in throughput and reliability of ultrafiltration                 nutrition sources introduced through minimum disruption is
technology has since rendered the concern moot, as amino                      essential to ensure continued livelihood and nutrition supply.
acid preservation is greater given the absence of any chemical                The effect of conscious food choice on global carbon emission
treatment. All six plants studied plants exhibit a valuable essential         has been explored by Bajželj (2014) and Bajželj et al. (2014)
amino acid profile (Table 1) suggesting that the final nutrient               and the comparison of scenarios across different food and
yield is a function of protein extractability.                                production choices is quantitatively summarised by the EAT-
    The non-protein residue post-aqueous extraction appears to                Lancet Commission (Willett et al., 2019). This study strongly
be rich in polysaccharides and lignin which could potentially be              indicates the importance of reduction in the consumption
revalorised for use in other industries examples being; enzyme                of animal sources, while simultaneously moving away from
assisted ethanol production (Cheng et al., 2017) or use in paper              intensive cultivation practises and instead focusing on food
industry. Left over marc has previously been demonstrated as an               nutrition quality, rather than production yields. Leaf protein
alternate substrate for edible mushrooms (Mintesnot et al., 2014;             extraction technology could help harness the potential in
Kaszynski, 2016). Overall, the harvest index of such plants is high,          revalorising the biomass of invasive plants, which is currently
as organs such as leaves and parenchyma-rich portions constitute              disposed of inefficiently and help toward production of alternate
about 48–55% of the plant mass (corresponding to Harvest Index                and more sustainable protein sources to complement existing
of 0.48–0.55) compared to cereals with indices of about 0.3–0.45              food production.
(Singh and Stoskopf, 1971).
    Gorse is also rich in soluble phenolics, particularly chlorogenic
acid and major bioactive compounds such as phenylpyruvic-                     CONCLUSIONS
, benzoic-, and cinnamic acids derivatives. These compounds
are commonly associated with health benefits owing to their                   Agriculture in our current economic system carries the burden
anti-inflammatory and free radical-quenching properties (Ozcan                of being a critical occupation for human survival, while having
et al., 2014; Shahidi and Ambigaipalan, 2015) and their role in               to maintain economic viability and now, faces the brunt of
maintaining gut health (Ozdal et al., 2016). The nutraceutical                being a major contributor of anthropogenic GHG emissions.
market is expected to grow to a value of around $10 billion                   Based on the relationship between land resource allocation,
by the year 2026 (Childs, 1999; Bröring and Cloutier, 2008;                   emission and fiscal patterns observed in global agricultural
Research Markets, 2019) and with growing consumer demands                     data, the case is presented for revalorising invasive plants to
and research investment in the plant-based “well-ness” industry,              ameliorate food insecurities. Marginal lands tend to serve as
identification of viable and sustainable sources of bioactives                reservoirs for native plant species, which have now come under
is essential.                                                                 threat from excessive herbivory from unattended grazing, climate
    Invasive plants tend to have robust physiologies and faster               change and added competition from invasive plant species. Using
germination times, which increase turnover and reduce income                  databases cataloguing the location and spread of invasive plants
latency. Plants such as Gorse and Bracken grow rapidly during                 through satellite imagery, Fabaceae species were found to be
periods of spring, allowing harvest in early summer (Conway,                  the second most abundant family globally, with the three most
1957; Bowman et al., 2008). Harvesting and exploiting the                     invasive species in Scotland belonging to this family. Among
nutritional value of such plants may help alleviate some of the               the six invasive plants investigated, Gorse (Ulex europaeus) was
burden on the existing agricultural systems to produce protein.               identified as a good candidate for implementation owing to
Current terrestrial carbon held in vegetation amounts to 302.4                its wide geographical spread, high protein extractability and
Pg (FAO, 2019) which is almost completely offset by animal                    potential of the co-products for further revalorisation efforts.
husbandry industry. Since agricultural emission is a direct result
of land use (Smith et al., 2008; Molotoks et al., 2018; Porter
et al., 2019), land improvement and maintenance of pasture lands              DATA AVAILABILITY STATEMENT
adds to the carbon cost of animal products as seen in Figure 8.
Although classification of grazing land into rough grazing and                The raw data supporting the conclusions of this article will be
maintained meadows is not available for all countries of the                  made available by the authors, without undue reservation.

Frontiers in Sustainable Food Systems | www.frontiersin.org              13                                    February 2021 | Volume 5 | Article 575056
You can also read