Face Coverings, Aerosol Dispersion and Mitigation of Virus Transmission Risk - arXiv
←
→
Page content transcription
If your browser does not render page correctly, please read the page content below

Face Coverings, Aerosol Dispersion and Mitigation of Virus Transmission Risk
                                                     Abstract

The SARS-CoV-2 virus is primarily transmitted through virus-laden fluid particles ejected from the mouth
of infected people. In some countries, the public has been asked to use face covers to mitigate the risk of
virus transmission – yet, their outward effectiveness is not ascertained. We used a Background Oriented
Schlieren technique to investigate the air flow ejected by a person while quietly and heavily breathing,
while coughing, and with different face covers. We found that all face covers without an outlet valve
reduce the front flow through jet by more than 90%. For the FFP1 and FFP2 masks without exhalation
valve, the front throughflow does not extend beyond one half and one quarter of a metre, respectively.
Surgical and hand-made masks, and face shields, generate several leakage jets, including intense
backward and downwards jets that may present major hazards. We also simulated an aerosol generating
procedure (extubation) and we showed that this is a major hazard for clinicians. These results can aid
policy makers to make informed decisions and PPE developers to improve their product effectiveness by
design.

                                                    Author List

I. M. Viola 1,*, B. Peterson 1, G. Pisetta 1, G. Pavar 1, H. Akhtar 1, F. Menoloascina 1, E. Mangano 1, K. E. Dunn1,
R. Gabl1, A. Nila 2, E. Molinari 3,4, C. Cummins 5, G. Thompson 6, C. M. McDougall 7, T. Y. M. Lo 7,8, F. C. Denison
9
  , P. Digard 10, O. Malik 11, M. J. G. Dunn 12, F. V. Mehendale 13

                                                    Affiliations

1
  School of Engineering, University of Edinburgh, Sanderson Building, Robert Stevenson Road, Edinburgh
EH9 3FB, UK
2
  Lavision UK Ltd., 2 Minton Place, Victoria Road, Bicester, OX26 6QB, UK
3
   UKRI Centre for Doctoral Training in Biomedical AI, School of Informatics, University of Edinburgh, 10
Crichton Street, Edinburgh, EH8 9AB, UK
4
  College of Medical, Veterinary and Life Sciences, Wolfson Medical School Building, University of Glasgow,
University Avenue, Glasgow, G12 8QQ, UK
5
  Maxwell Institute for Mathematical Sciences, Department of Mathematics, and Institute for Infrastructure
& Environment, Heriot-Watt University, Edinburgh, EH14 4AS, UK
6
  Centre for Clinical Brain Sciences, Chancellor's Building, Edinburgh BioQuarter, 49 Little France Crescent,
Edinburgh, EH16 4SB, UK
7
  Paediatric Critical Care Unit, Royal Hospital for Sick Children, 9 Sciennes Road, Edinburgh, EH9 1LF, UK
8
  Usher Institute, University of Edinburgh, Nine Edinburgh Bioquarter, 9 Little France Road, Edinburgh, EH16
4UX, UK
9
  The Queen’s Medical Research Institute Edinburgh BioQuarter, 47 Little France Crescent, Edinburgh, EH16
4TJ, UK
10
   The Roslin Institute, University of Edinburgh, Easter Bush, Midlothian EH25 9RG, UK
11
   Department of Anaesthesia, Royal Hospital for Sick Children, 9 Sciennes Road, Edinburgh, EH9 1LF, UK
12
   Dept of Critical Care, NHS Lothian, Royal Infirmary of Edinburgh, 51 Little France Crescent, Old Dalkeith
Road, Edinburgh, EH16 4SA, UK
13
    Global Cleft Lip and Palate Research Programme, Global Health Research Centre, Usher Institute,
University of Edinburgh, Edinburgh, EH8 9AG, UK

*
    Corresponding author: Dr Ignazio Maria Viola, i.m.viola@ed.ac.uk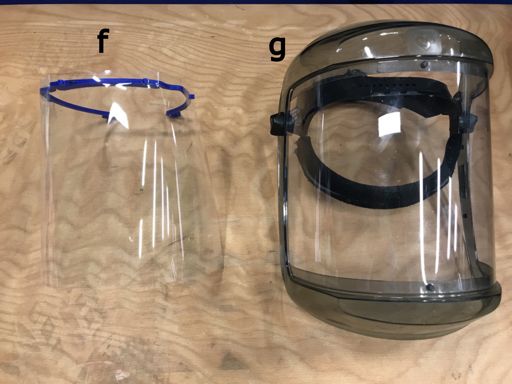
1. Introduction

1.1 Background

The Severe Acute Respiratory Syndrome Coronavirus-2 (SARS-CoV-2) is the name of the virus that led to
the COVID-19 pandemic disease. The virus is transmitted from human to human primarily through virus-
laden fluid particles ejected from the mouth of infected people. The SARS-CoV-2 virus has a diameter of
70–90 nm (Kim et al. 2020) and it is carried by droplets and aerosol (van Doremalen et al. 2020; Y. Liu et al.
2020). Larger droplets (≤100 !m) reach the ground within 1 s without significant evaporation (Wells 1934),
while the smaller the droplet the slower it falls and the faster it evaporates (W. F. Wells 1934; William Firth
Wells 1955; Xiaojian Xie et al. 2009; Bourouiba, Dehandschoewercker, and Bush 2014; Vejerano and Marr
2018). The emitted fluid particles are often categorised as larger droplets from 5 !m to 1 mm in diameter
that have a ballistic trajectory, and aerosol that remain airborne. Droplets smaller than 5 !m and desiccated
droplet nuclei are known as aerosol, which can remain airborne for several hours (Nicas, Nazaroff, and
Hubbard 2005; Tellier 2006; van Doremalen et al. 2020).

Respiratory viruses are transmitted from virus-laden fluid particles to the recipient through (1) aerosol
inhalation; or (2) droplet deposition on the recipient’s mouth, nose or conjunctiva; or (3) droplet deposition
on a surface and successive transmission through physical contact (Jones and Brosseau 2015). The relative
importance of aerosol (1) and droplet (2 and 3) transmission of SARS-CoV-2 is unknown (Leung et al. 2020).
However, counterintuitively, it has been argued that aerosol could be more dangerous than larger droplets.
Smaller droplets (≤5 !m) suspended in aerosol might carry a higher concentration of virus than larger
droplets (>5 !m) (Milton et al. 2013; Lindsley et al. 2015; 2010; Leung et al. 2020). Largest droplets are less
likely to penetrate deeply in the respiratory system and might be deactivated by the effective first structural
and defence barrier of the mucosa (Fokkens and Scheeren 2000). Conversely, aerosolised virus half-life
exceeds one hour (van Doremalen et al. 2020) and can be transported airborne through inhalation deep
into the lungs (J. Atkinson and World Health Organization. 2009; Zayas et al. 2012; Yan et al. 2018; Lindsley
et al. 2010), avoiding the defences of the upper respiratory system. Furthermore, aerosol inoculation has
been shown to cause more severe symptoms than droplets administered by intranasal inoculation and the
dose of influenza required for inoculation by the aerosol route is 2-3 orders of magnitude lower than the
dose required by intranasal inoculation (Lindsley et al. 2015; Bourouiba, Dehandschoewercker, and Bush
2014; Lindsley et al. 2010).

The infectious dose for SARS-CoV-2 is not known, but extrapolating from other enveloped respiratory
viruses where more data are available, may be of the order of a few tens to a few thousand virus particles
(Yezli and Otter 2011). From these data, it is also likely that the larger the dose of virus an individual is
exposed to, the greater the likelihood of infection occurring. A further unknown is whether disease severity
correlates with the size of the infectious dose. Based on animal experiments performed with a variety of
viruses (Watanabe et al. 2010; DeDiego et al. 2008; Tao et al. 2016), it is reasonable to assume that this is
the case.

1.2 Flow Physics

The mechanism of fluid particle ejection during breathing, coughing and sneezing was investigated by, for
instance, Moriarty and Grotberg (1999), Malashenko, Tsuda, and Haber (2009), Almstrand et al. (2010), G.
R. Johnson et al. (2011) and Mittal, Erath, and Plesniak (2013). While talking, a person ejects about tens of
fluid particles per second with diameters between 0.1 !m to 1 mm (Asadi et al. 2019) and with a speed of
the order of 1 m s-1 (Julian W. Tang et al. 2013). Because this is the most frequent source of aerosol, this
accounts for most of the aerosol inhaled by other people (Fiegel, Clarke, and Edwards 2006; M. P. Atkinson
and Wein 2008). Coughing leads to the ejection of 100-1000 fluid particles per second with a speed around
10 m s-1, while sneezing generates 1000-10,000 fluid particles per second with a speed of up to 20 m s-1
(Han, Weng, and Huang 2013). The values presented in this paragraph should be taken as indicative
because there is a significant variability between different experimental studies (Duguid 1945; 1946;
Loudon and Roberts 1967; Papineni and Rosenthal 1997; Morawska 2006; Morawska et al. 2009; S. Yang
et al. 2007; Chao et al. 2009; Scharfman et al. 2016; Stadnytskyi et al. 2020; Xiaojian Xie et al. 2009; G. R.
Johnson et al. 2011; Zayas et al. 2012; Lindsley et al. 2010; 2015; Bourouiba, Dehandschoewercker, and
Bush 2014).

The present work considers the airflow ejected from a person when breathing and coughing. Fluid particles
are ejected within a volume of air at body temperature and thus typically warmer than external air. This jet
transports particles in the range of 50 !m – 150 !m (X. Xie et al. 2007; W. F. Wells 1934), i.e. the aerosol,
while the largest droplets have a ballistic trajectory independent of the surrounding flow (Wei and Li 2015;
X. Xie et al. 2007; Bourouiba, Dehandschoewercker, and Bush 2014). The jet can be either laminar or
turbulent when breathing and speaking, while coughing and sneezing always results in a turbulent jet with
a diameter-based Reynolds number higher than 104 (Bourouiba, Dehandschoewercker, and Bush 2014).

Once ejected, the air jet extends along a straight trajectory; its diameter increases linearly with the travelled
distance, while the mean velocity linearly decreases, and the turbulent statistics remain constant (i.e. the
jet is self similar (Morton, Taylor, and Turner 1956). Once the largest particles with a ballistic trajectory
have left the air jet, the jet bends upwards due to the buoyancy force caused by the temperature and thus
density difference (Bourouiba, Dehandschoewercker, and Bush 2014). Smaller size particles (≤100 !m) are
transported by the jet while they evaporate. When their settling speed (or terminal velocity) is lower than
that of the jet, they fall out of the jet (Bourouiba, Dehandschoewercker, and Bush 2014). The settling speed
of a particle with a diameter of 50 !m and 10 !m is less than 0.06 m s-1 and 0.03 m s-1, respectively, and
they evaporate in less than 6 s and 0.1 s (Holterman 2003; Bourouiba, Dehandschoewercker, and Bush
2014). Once they left the jet, they can still be transported by ambient air currents that have speeds typically
in excess of 0.01 m s-1 (Melikov and Kaczmarczyk 2012).

1.3 Range of contamination

A key issue that is discussed in this study is the extent to which the cloud of droplets and aerosol is displaced
into the neighbouring environment. Previous studies estimated that the overall horizontal range of the
droplets generated while breathing and coughing before they land on the ground is around 1-2 m (W. F.
Wells 1934; X. Xie et al. 2007; Wei and Li 2015). These studies led to the CDC (CDC 2020) and WHO (WHO
2020) social distancing guidelines. Nonetheless, the complex physics involved, which includes knowledge
of the particle size distribution, their speed of evaporation, the viral charge of droplets of different size, the
diffusivity of the virus-laden particles, etc., makes it difficult to assess which is the effective dispersion of
virus-laden fluid particles into the environment once ejected. It was found that the largest droplets
generated by sneezing can reach a distance as high as 8 m (Bourouiba 2020; X. Xie et al. 2007; Bourouiba,
Dehandschoewercker, and Bush 2014), while aerosol dispersion is highly dependent on the temperature,
humidity and air currents. For these reasons, this paper does not aim to provide definitive measures for
the aerosol displacements but contributes to building a body of evidence around this complex question.

1.4 Personal Protective Equipment

The focus of the paper is on the relative effectiveness of different personal protective equipment (PPE) in
mitigating aerosol dispersal. This is, of course, only one element that must be considered to assess the
overall efficiency of PPE to mitigate virus transmission (Feng et al. 2020; Dwyer and Aubrey 2020; Elegant
2020). Certified masks, typically N95, FFP2 and FFP3, are designed for inward protection of the person who
wear them (Chen and Willeke 1992; Weber et al. 1993; Bałazy et al. 2006). The smallest particles are filtered
through electrostatic attraction and diffusion dominate filtration while the largest particles are captured
through impaction and interception (Thomas et al. 2016; Fleming 2020). Therefore, there is an
intermediate range of particle size for which masks are less effective (Chen and Willeke 1992; Weber et al.
1993; Bałazy et al. 2006). However, there is consensus that N95 masks are effective at filtering virus-sized
particles and in mitigating virus transmission (Rengasamy, Eimer, and Shaffer 2009; Gardner et al. 2013; G.
Yang et al. 2014; He et al. 2013; Radonovich et al. 2019; 3MTM 2020; Leung et al. 2020). More controversial
is the effectiveness of the outward protection from the person who wears them (D. F. Johnson et al. 2009;
van der Sande, Teunis, and Sabel 2008; Wood et al. 2018; Howard et al. 2020; Burch and Bunt 2020;
Brainard et al. 2020), which is the subject of this paper. There is evidence, and it is intuitive to consider that
the dispersion of both droplets and aerosol is substantial reduced by wearing face masks (Julian W. Tang
et al. 2009). However, it has been observed that the increased pressure when exhaling, and particularly
coughing and sneezing, displaces the mask from the face leading to air leakage around its perimeter (B. Y.
H. Liu et al. 1993; Lei et al. 2013). Furthermore, it remains unclear which is the airflow and the effectiveness
of a mask that is not correctly worn, and that of different types of masks such as surgical masks (Shakya et
al. 2017; van der Sande, Teunis, and Sabel 2008; D. F. Johnson et al. 2009; Milton et al. 2013; Wood et al.
2018; Leung et al. 2020), home-made masks (Rengasamy, Eimer, and Shaffer 2010; MacIntyre et al. 2015;
Davies et al. 2013; van der Sande, Teunis, and Sabel 2008; Shakya et al. 2017) and shields (Lindsley et al.
2014; Roberge 2016). This paper provides a comparative analysis between these different face protections
to contribute building the scientific evidence that will inform guidelines on the use of PPE.

1.5 Aerosol Generating Procedures

Endotracheal intubation, extubation, tracheostomy, tube changes, potentially including naso-gastric (NG)
tube insertion and removal that notoriously produce coughing (tussigenic), and suctioning are critical parts
of care for patients with COVID-19. Most countries have developed guidelines to modify usual practice for
intubation (insertion of a tube from the mouth into the airway to mechanically assist with breathing) of
COVID-19 patients but these aerosol generating procedures (AGP) continue to expose clinicians to a very
high risk of contamination. For example, while the patient is extubated, often the patient coughs directly
in front of at least two staff personnel undertaking the procedures and whose face is less than 60 cm from
the mouth of the patient. Critical aerosol generating conditions also occur in surgery and dentistry, where
a wide range of powered mechanical tools, such as drills, saws, debriders, irrigators, and dermatomes are
used. Laparoscopic surgery also insufflates the abdomen with positive pressure gases. It is likely that the
COVID-19 pandemic will show that current PPE protection used against these aerosols is no longer
adequate.

The airflow during these procedures has hardly been investigated and only few studies explore the air
exhaled by patients in different postures (e.g. Yin et al. 2011; Lindsley et al. 2012). In this paper, the air flow
generated during an extubation procedure is investigated to foster new research in the development of
new PPE technology for AGP.

The clinical impact of this lack of understanding and adequate PPE is that a number of non-urgent
operations that involve AGPs are currently suspended. Before these can be resumed, clinicians will need
(and expect) better protection during AGPs. Based on our current work, we have developed and are testing
a clinically compatible aerosol extractor (not presented in this work) that will serve as the primary layer of
protection during a wide range of AGPs.

1.6 Aim and Structure of the Paper

In the present study, we use Background Oriented Schlieren (BOS) to visualise the refractive index of the
fluid, which varies with the fluid density through the Gladstone–Dale relation (Gladstone and Dale 1863).
Because the breath is warmer than the air in the environment, the contour of the ejected air cloud has a
high refractive index gradient that can be measured. These measurements build on the pioneering work
presented in a series of papers co-authored by Settles and Tang (Gary S. Settles 2006; Julian W. Tang and
Settles 2008; J.W. Tang et al. 2011; Julian W. Tang et al. 2009; 2013), who used a schlieren optical method
to visualise the airflow emitted by coughing. These measurement techniques provide limited quantitative
measurements but have the advantage over more quantitative techniques, such as particle image
velocimetry, that they do not require class-4 laser illumination, which is hazardous for eye exposure.
Tang et al. (Julian W. Tang et al. 2009) showed the airflow ejected from a human person coughing,
unfiltered as well as with an N95 and a surgical mask. They visualised the turbulent jet of the unfiltered
cough and concluded that the N95 masks block the formation of the jet while the surgical mask redirects it
sideways. This paper confirms these conclusions with a different experimental setup and quantifies the
velocity and direction of the jets. We also extend their investigation for normal breathing and heavy
breathing simulating physical exercise, and we consider seven different types of face protections (FFP1,
FFP2, respirator, surgical mask, hand-made mask, lightweight 3D printed face shield with visor and heavy-
duty commercial face shield). We consider both supine and standing position. Furthermore, by using a
manikin connected to a cough simulator, and with the aid of two Intensive Care Specialists, we simulate
the extubation of a patient and we visualise the ejected cough. We validate the manikin air flow with the
human air flow by comparison of cough peak speed, jet spread and direction, and we characterise the
breathing by spirometry readings.
The remainder of this paper is structured as follows. In Section 2, we present the experimental
methodology, including the schlieren imaging technique (2.1), the experimental procedure (2.2), the data
processing (2.3) and the characterisation of the breathing patterns (2.4). In Section 3, we describe the
results, examining the general flow fields for a person breathing and coughing (3.1), the relative
effectiveness of the different face covers (3.2), the characterisation of the different leakage types (3.3),
and the airflow during a simulated extubation (3.4). Finally, in Section 4, we summarise our key findings
and discuss the limitations of our work. Supplementary material (>250 GB) is available on the Edinburgh
DataShare (https://datashare.is.ed.ac.uk/handle/10283/3636). These include, for each of the 244 tests
undertaken, the measured raw data (camera pictures) and the processed data showing the displacements
for each frame, and a video for ease of visualisation. In addition, for selected tests, including all of those
for which quantitative data is provided in the paper, there are images with annotated measurements.
2. Methodology
2.1 Schlieren Imaging
Schlieren is an optical technique that provides visualisation of density variations within a flowing medium
(G.S. Settles 2001). These density variations yield refractive index gradients, which refract (i.e. bend) light
rays that pass through the medium. A spatial filter is used to segregate the variations of refracted light,
providing visualisation of these optical phase disturbances. Schlieren imaging has been used in the past to
examine airflows associated with human coughs (Khan et al. 2004; Julian W. Tang and Settles 2008; Julian
W. Tang et al. 2009). In these studies, density gradients are produced by temperature differences
between a human’s breath and the surrounding air. Such studies utilised the traditional schlieren
technique described above.
This study utilises a variant of schlieren imaging called Background Oriented Schlieren (BOS), also known
as synthetic schlieren (Dalziel, Hughes, and Sutherland 2000). BOS visualises density gradients as
refracted light rays distort a patterned background within the image (Richard and Raffel 2001). A
reference image without the schlieren object in the field of view provides an image of the stationary
patterned background. The apparent local distortion of the patterned background is determined by
comparing the schlieren object images to the reference image. This apparent distortion or streaks (i.e. the
schlieren), are directly related to the magnitude of the density gradient, and yields a 2D image of the
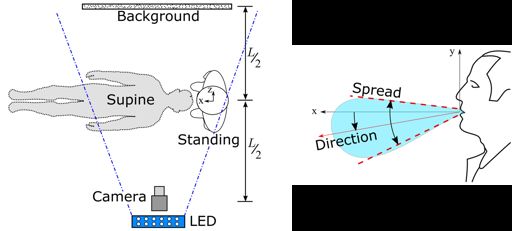
density gradients associated with the schlieren object (Hargather and Settles 2010; Tokgoz et al. 2012).The experimental setup used for BOS imaging is shown in Figure 1. A high-speed CMOS camera (VEO
710L, Vision Research) with 1280 x 800 pixels2 was used for recording. The camera operated in single-
frame mode with a repetition rate of 100 Hz and exposure time of 10000 !s. The camera was equipped
with a 50 mm Nikon lens operating with f# = 11.
The camera imaged onto a patterned background placed at a distance " = 2200 mm from the camera.
The patterned background was printed onto a matte poster-board (1400 x 1000 mm2). The background
was generated using LaVision’s Random Pattern Generator 1.3 software with dot size of 2.2 mm and a
minimum dot distance of 1.1 mm. A blue LED-Flashlight 300 (LaVision) was used to illuminate the
background. This LED unit is comprised of 72 high-power LEDs and operated with a pulse duration of 300
!s. A piece of sanded-down transparent acetate was placed in front of the LED unit to diffuse the
illuminated light. A programmable timing unit (LaVision) was used to synchronize the LED light source
with the high-speed camera. Acquisition and analysis of the BOS images were performed using
commercial software (DaVis 10.1 by LaVision).
Figure 1. Experimental setup and reference system. Experiments were performed for standing and supine
configurations shown.
2.2 Experimental Procedure
Experiments were conducted by first recording reference images of the patterned background. The
subject of interest (human or manikin) was positioned equidistant between the camera and patterned
background. Image sequences were recorded of the subject breathing/coughing. BOS imaging was
performed for a human’s quiet breathing, heavy breathing and cough, and a simulated cough from the
manikin. Each breathing pattern was recorded multiple times and a new set of reference images were
recorded before the start of each experiment. Measurements were performed with the subject in the
standing and supine positions.
Experiments were performed for the subject equipped with and without face protection. Seven types of
face protections were studied (Figure 2): FFP1, FFP2, respirator, surgical mask, hand-made mask, a heavy-
duty commercial face shield, and a lightweight face shield based on a 3D printed headband, made at the
University of Edinburgh’s (UoE) School of Engineering according to an open-source design made available
by other groups (https://3dprint.nih.gov/discover/3dpx-013306, https://open.ed.ac.uk/3d-visor-models/).Figure 2. Different face covers tested: (a) surgical mask; (b) handmade mask; (c) FFP1; (d) FFP2; (e) respirator; (f) university-made lightweight face shield; (g) commercially heavy-duty face shield. Tests were also conducted using the anatomically realistic adult medical simulation manikin (Resusci Anne QCPR) with accurate upper airway anatomy/morphology, specifically designed for training in upper airway procedures. The manikin’s trachea is attached to a plastic tube which connects to a mechanical breath simulator. A computer is attached to the Data Acquisition (DAQ) system, which is controlled using a Matlab script to regulate the timing and duration of the manikin’s breath. The DAQ system sends a signal to a power unit that commands open/close the solenoid valve upstream of the outlet, where the plastic tube is attached. The flow of air is generated by a compressor, to simulate quiet breath, or a cylinder with pressurised air at 4 bar, to simulate cough events 200 ms, in line with (J. K. Gupta, Lin, and Chen 2009). To visualise the manikin’s breath using BOS, the air is heated by wrapping heating tape near the outlet of the breath simulator. The airflow at the manikin’s mouth is heated to about 40 oC before each test. The air temperature within the room was 20-22oC. The plastic tube connecting the manikin to the breath simulator is insulated, to minimise the generation of noise during BOS measurements. The manikin’s mouth has fixed shape and an aperture of about 6.4 cm2, while the real person mouth was open to about 3 cm2. The manikin’s nasal airway is sealed to prevent leakage. 2.3 Data Processing The raw images were processed using the LaVision’s DaVis 10 software. First, a time filter was applied to the raw images in a pre-processing stage to mitigate the effects of shot noise. The filter computes the intensity for each pixel from 5 consecutive images and assigns the maximum value to the pixel in the filtered image. The flow field was then visualised by evaluating the BOS displacement, which follows the motion of the dot pattern in the background on each image with respect to the reference image recorded before the test, where no flow was present (natural airflow in the room was minimised as far as possible). The software computes an average displacement value of the dots within a square window, called a subset, chosen in this case to be of 19 x 19 pixels2. After calculating the displacement in the current subset, the process was repeated by shifting the subset by 5 pixels, until the entire image was scanned. Finally, an additional filter was applied to improve the signal-to-noise ratio of the calculated displacement maps. The image displacement data was fitted with a first order polynomial which is then subtracted from the original BOS displacement map. This allows to eliminate the global bias in the BOS field which might be occurring due to motion and vibration or due to overall illumination variations. The contours of the resulting computed displacement is used to visualise the jet in the following figures. BOS images were used to compute the flow velocity, the spread angle of the air jet and its direction. The jet direction is given by the angle that it forms with the horizon, taken positive rotating anticlockwise from (Fig. 1), i.e. upwards directions are denoted by angles between zero and 180°. The jet direction is the bisector of the spread angle, which is the angle between the visible boundaries of the jet.
2.4 Characterising of Breathing Patterns

Spirometry (Nuvoair Next) were conducted on the person that performed all the tests showed in this
paper, in line with ATS/ERS standards for spirometry (Miller 2005). The person is a co-author of this paper
(GP) and he gave informed consent to undertake these measurements. Measurements of forced expired
volume in 1 second (FEV1) and forced vital capacity (FVC) were recorded. These measurements were
conducted by an Intensive Care Specialist using the Nuvoair Air Next, a CE certified and FDA cleared
portable spirometer (detailed results are available as Supplementary Material, Spirometry Results).

We also perform a reduced-order characterisation of the breathing patterns using BOS. At the beginning
of a cough event, as air exits the subject’s mouth, the schlieren signal is the strongest. Progression of the
leading edge of the gas cloud can be clearly tracked within the first 1-3 frames when the schlieren signal
is first observed near the subject’s mouth. An estimate of the air velocity is calculated by recording the
distance between the leading edge of the signal within successive frames and dividing by the time
elapsed between the frames. This velocity estimation is inherently averaged across the line of sight of the
camera. The velocities measured near the subject’s mouth approximate the average peak velocity at the
beginning of a cough. Conversely, for quiet and heavy breathing, we estimated the velocity as the
maximum distance covered by the leading edge of the gas cloud within the field of view over the time it
took to reach that point. This reduces the global bias in the BOS field, which may occur due to motion and
vibration or due to overall illumination variations.

                                                  3. Results

3.1 Quiet and Heavy Breathing and Coughing without Face Coverings

With our experimental setup we could observe the thermal plume generated by the person. The closest
layer of air to the body is warmer and lighter than the surrounding air and thus it moves upwards as a
thermal plume. The expiration begins with a gentle air jet that has a low momentum and it is thus redirected
upwards together with the plume by the buoyancy. Successively, when the ejected flow has a higher
momentum, it is displaced in a straight direction slightly lower than the horizon. Figure 3 shows this first
stage of the expiration, where there is both the novel straight jet pointing slightly downwards and the
initially exhaled air that has been diverted in a vertical plume and that has been displaced by the front of
the new jet. As the expiration phase progresses, the air jet becomes more horizontal and clearly extends
beyond the boundary of the field of view at 562 mm from the mouth (Table 1, Test 204). The table shows
both the measured distance travelled by the jet and its direction, as well as the computed horizontal and
vertical projection the distance travelled). It was not possible to establish the maximum distance reached
by the jet because, when we moved the field of view further downstream, the difference in temperature
between the air jet and the ambient temperature was already too low to provide a clearly discernible
measurement.

Heavy breathing has a shorter duration and a higher frequency than quiet breathing, with a nine-fold
increase in velocity and a three-fold increase in volume flux (Table 2). The higher inertial force results in a
straight jet that also clearly extends well beyond the boundary of the field of view, 551 mm from the mouth
(Figure 4, Table 3, Test 198).

The airflow generated by coughing generates an airflow that is typically twice as fast as heavy breathing,
where the maximum velocity is experienced at the very beginning of the event due to the explosive
release from the glottis. During coughing, we observed a jet that is similar but less uniform in speed than
for heavy breathing (Figure 3), and that is still well discernible 1 m away from the mouth (Table 4, Tests
253-255). From the observation of the videos (e.g. Supplementary Material, Test 253), it can be observed
that the jet initially travels straight or slightly downwards, driven by inertia (Test 253 Frame 86), and
successively the angle reduces (Test 254, Frame 72) when the buoyancy is no longer negligible compared to the inertia. As noted in the Introduction (Sec. 1.2), this trend is consistent with observations from other authors such as Bourouiba et al. (2014; 2020). We tested both a real person and a manikin coughing, and the differences are summarised in Table 5. The differences are well within the variability observed between different people (VanSciver, Miller, and Hertzberg 2011; Zhu, Kato, and Yang 2006; Jitendra K. Gupta, Lin, and Chen 2010). The main reason for the different jet direction is likely to be the non-natural posture of the manikin. We used the manikin because it ensures repeatability of the tests when comparing different masks in Sec. 3.2. Furthermore, it allowed increasing the temperature of the airflow to measure the displacement of the jet further downstream by moving the field of view (Table 4, Tests 253-255). Figure 3. Initial stage of the quiet breathing Figure 4. Fully developed heavy breathing jet expiration (Test 204, Frame 490). (Test 198, Frame 179). Figure 5. Cough of a real person Figure 6. Cough of the manikin (Test 188, Frame 55). (Test 253, Frame 86). 3.2 Relative Effectiveness of Different Face Covers Tables 1, 3 and 4 summarises, the performances of each face cover for quiet breathing, heavy breathing and coughing, respectively. These include the distance travelled by the front throughflow jet and by the largest leakage jet, which is brow-ward for quiet and heavy breathing, and crown-ward for coughing. The reported distances travelled by the jets are based on the projections of these jets on the focus plane of the camera. Table 6a and 6b summarise the longest travelled distance for each of the observed jet type and each of the face covers. The distances are measured from the edge of the face cover for the crown and side jets, and from the back of the head for the backward jet. These jet types, which are schematically presented in Figure 8, are discussed in detail in the next section (Sec. 3.3), while in this section we focus on the overall performances of each face cover. We found that the exhaled air dispersal of a quiet breath is well mitigated by any face cover (Table 1). The ejected flow is slowed down by the mask filter or is redirected through narrow gaps. When the air flow leaks, it is sufficiently slow to be convected upwards by the thermal plume without being significantly displaced horizontally (Figure 9).
The different types of face covers show different performances in the case of heavy breathing and
coughing. Between those that we tested, the FFP2 mask was the most effective in mitigating all exhaled
air dispersal (Table 3 and 4). Figure 7a shows the same cough by the manikin as in Figure 6 but where the
manikin wears an FFP2 mask. A coherent jet is no longer visible, and the distance travelled by the front
throughflow is reduced to only 110 mm (Table 4). A key issue of the FFP2 mask is that it must be shaped to
the nose to ensure a proper sealing. When a good sealing is not achievable, we observed a crownward
leakage jet displaced for more than 190 mm (Table 4). Conversely, when correctly sealed, a crownward
leakage was not observed (e.g. Supplementary Material, Tests 20, 22, 103, 104, 119, 120, 145, 146).

FFP1 was the second most effective face cover in mitigating leakage and the displacement of the front
throughflow for quiet and heavy breathing (Table 1 and 3), respectively. However, the main weakness of
FFP1 is the poor protection while coughing, as it does not perform better than other masks in reducing
the distance travelled by the front throughflow (Table 4). This is likely to be due to the comparatively
tighter fit of the FFP1 that forces most of the exhaled air through the mask, while the looser fit of the
other face covers allows most of the air to leak out from the sides.

On the other hand of the scale, the respirator did not stop at all the displacement of the front
throughflow (Tables 1, 3, 4, 6a). In fact, it has a valve system that filters the inhaled air, but it does not
filter the exhaled air. The frontal jet is simply redirected downwards, and minimal crown leakage jet is
observed in the case of explosive events such as coughs (Table 6b). This valve system, which is common
to several mask types, is clearly ineffective in preventing virus dispersion when worn by infected people,
and it should only be considered to provide protection for healthy wearers against potentially infected
people, and only when the specific filter is capable to stop virus particles.

The other face covers (surgical and hand-made masks, and the shields) showed mixed performances, but
the hand-made mask was the least effective in stopping air leakage. It is important to remark that there is
a wide range of hand-made masks and thus care must be used in generalising these results. Figure 7b
shows a frontal view of the manikin coughing while wearing the hand-made mask. While the travelled
distance of the front throughflow was effectively reduced as for the other masks (150 mm, Table 4), this
mask led to multiple leaking jets that could extend upwards, downwards and backwards quiet
significantly. The crown-ward leakage jets extended beyond the edge of the field of view, which is 155
mm above the head of the manikin (Table 4).

Face shields typically block the frontal jet but some airflow was found to leak from seams and joints and
be displaced horizontally by few centimetres. This is the case, for example, of the heavy-duty commercial
face shield during heavy breathing (Table 3). Of course, face shields also generate upwards, downwards,
sideway, and particularly strong backwards leakage jets (see Sec. 3.3 for a detailed discussion on these
jets).

With the exception of the remarkable lower protection of FFP1 in comparison to FFP2 while coughing,
our results suggest that the effectiveness of the masks should mostly be considered based on the
generation of secondary jets rather than on the ability to mitigate the front throughflow. In fact, even if
we could not measure the maximum distance travelled by the unfiltered cough, we are confident that all
masks and shields enable a reduction of at least 90% of the distance of the front throughflow.
Figure 7a. Cough airflow dispersion contained by Figure 7b. Cough airflow dispersion partially
an FFP2 mask, which showed the most effective contained by a hand-made mask allowing
prevention of the frontal throughflow (Test 258, significant leakage jets (Test 266, Frame 59).
Frame 75).

Figure 8a. Front view schematic of the main      Figure 8b. Side view schematic of the main
leakage jets generated by the different face     leakage jets generated by the different face
covers.                                          covers
Table 1. Quiet breath, human, sitting at edge of frame, sideways.
                                                                          Front throughflow                               Brow jet
                     Mask                        Test Frame Angle (deg) Distance (mm) H Dist. (mm) Frame Angle (deg) Distance (mm) V Dist (mm)
                     none                         204   557           1         >562          >562                    not discernible
                    surgical                      98     87          48           86           57        232       88          >212       >212
                     FFP1                         101   182          57           85           46                     not discernible
                     FFP2                         103   104         -15           32           31                     not discernible
                  handmade                        105                   not discernible                               not discernible
                   respirator                     107    57         -48          154             103                  not discernible
       heavy-duty commercial face shield          109                   not discernible                               not discernible
UoE lightweight 3DP face shield + opaque cover    133                   not discernible                               not discernible

Table 2. Expiration parameters measured for the quiet and heaving breathing tested conditions.
                        Duration (s) from spirometry           Average speed (m/s) from BOS            Total volume exhaled (ml/breath)
                                                                                                                from spirometry
 Quiet breath                       3.25                                      0.55±0.18                              1290
 Heavy breath                       2.09                                      4.97±0.77                              4640

Table 3. Heavy breath, human, sitting at edge of frame, sideways.
                                                                          Front throughflow                               Brow jet
                     Mask                        Test Frame Angle (deg) Distance (mm) H Dist. (mm) Frame Angle (deg) Distance (mm) V Dist (mm)
                     none                         198   181          -7            >551       >547                    not discernible
                    surgical                      99     80         -24             278        254       67        58          182        154
                     FFP1                         102   197         -18             198        188                    not discernible
                     FFP2                         104    95          12             198        194                    not discernible
                  handmade                        106    41         -11             142        140       32        32          203        107
                   respirator                     36    135         -54            >265       >156                    not discernible
       heavy-duty commercial face shield          110   206         -24             136        124                    not discernible
UoE lightweight 3DP face shield + opaque cover    134                      not discernible                            not discernible
Table 4. Coughing, manikin sitting at edge of frame, sideways.
Front throughflow Crown jet
Mask Test Frame Angle (deg) Distance (mm) H Dist. (mm) Frame Angle (deg) Distance (mm) V Dist (mm)
253,
none 254, 84,72,172 -10 1137 1120 not discernible
255
surgical 256 256 -24 357 326 17 114 >168 >153
FFP1 257 257 16 416 400 64 118 >175 >154
FFP2 258 258 -22 119 110 74 121 >190 >163
handmade 259 259 14 234 227 61 123 >185 >155
respirator 260 260 -61 >309 >150 57 99 >109 >108
heavy-duty commercial face shield 261 not discernible 70 >82 129 >64
UoE lightweight 3DP face shield
262 not discernible 80 >38 92 >38
+ opaque cover
Table 5. Comparison between the cough jets of the real person and the manikin.
Cough peak speed (m/s) from BOS Jet spread (deg) Direction (deg)
Real person 7.75±1.25 29.2±4.3 -5.8±4.8
Manikin 8.31±0.81 32.5±6.1 -16.6±2.8Table 6a. Maximum distance travelled by jets for different masks (front, brow and down jets).
Front throughflow Brow Down
Mask Flow Test Frame Dist. (mm) Flow Test Frame Dist. (mm) Flow Test Frame Dist. (mm)
surgical cough 256 77 >357 heavy 10 186 >274 not discernible
FFP1 cough 257 236 416 heavy 18 56 181 not discernible
FFP2 heavy 104 95 198 not discernible not discernible
handmade cough 259 123 234 heavy 106 32 203 heavy 29 43 >146
respirator cough 260 59 309 not discernible not discernible
heavy-duty commercial face shield heavy 110 206 136 not discernible heavy 88 96 >472
UoE lightweight 3DP face shield
not discernible heavy 132 94 >159 heavy 208 29 >295
+ opaque cover
Table 6b. Maximum distance travelled by jets for different masks (crown, side and back jets).
Crown Side Back
Mask Flow Test Frame Dist. (mm) Flow Test Frame Dist. (mm) Flow Test Frame Dist. (mm)
surgical heavy 99 45 >220 heavy 116 102 189 heavy 99 95 >193
FFP1 cough 257 64 >174 cough 264 146 160.2 not discernible
FFP2 cough 258 74 >190 cough 265 225 135 not discernible
handmade heavy 106 35 >223 cough 266 139 183.6 quiet 105 195 >179
respirator cough 260 57 >109 not discernible not discernible
heavy-duty commercial face shield cough 261 70 >257 heavy 128 66 183.6 heavy 110 70 >198
UoE lightweight 3DP face shield
cough 262 80 >104 cough 269 92 81 heavy 134 90 >154
+ opaque cover3.3 Different Leakage Types The different leakage types are shown in Figures 8a and 8b, and their longest travelled distances are reported in Table 6a and 6b. A potentially dangerous leakage jet that, to the authors knowledge, has not been reported before, is the backward jet from surgical masks. Air escapes from the side of the mask and it is projected backwards at high speed, potentially resulting in a significant displacement. The backward jet in Figure 10 is produced by a person breathing with a surgical mask and it extends beyond the end of the field of view at 193 mm from the back of the head (Table 6b). This jet is produced by every face cover but not by the FFP1 and FFP2 masks, and by the respirator (Table 6b). It is particularly pronounced for surgical masks. This is of relevance given the potential for some wearers of surgical masks to turn their face to the side when they cough, during face to face interactions with a colleague. In doing so, our data show that there is a risk that this backward jet is directed closer to a person standing in front of the wearer. Additionally, clinicians working around a patient, in the confined space around an intensive care bed or an operating table, are likely to be exposed to these side and backward leakage jets from surgical masks. In the videos available in the Supplementary Material (e.g. Tests 99, 105, 106, 110, 134), this backward jet appears later, and it diffuses more rapidly than the other jets. As shown on side views such as in Figure 10, we observe two overlaid backward jets originated from the left and the right side of the person. This explains the comparatively high strength and diffusivity of this jet compared to the other jet types. This jet type is more often observed while heavy breathing than coughing (Table 6b), suggesting that it could be a key hazard from runners. Figure 9. Quiet breath airflow dispersion Figure 10. Heavy breath airflow dispersion effectively contained by a surgical mask and partially contained by a surgical mask allowing airflow expelled upwards within a thermal plume significant leakage jets (Test 99, Frame 57). (Test 98, Frame 217). Another potentially dangerous leakage jet that should be carefully considered is the downward jet. It is generated by all face covers but not by the FFP1 and FFP2 masks, and by the respirator. Figure 11 shows this jet for the lightweight 3D-printed face shield. Different shield shapes would result in different jets but, unless curved below the chin, they are likely to generate an intense and fast downward jet (13 m s-1 in Figure 11). The lightweight 3D-printed face shield is completely open at the bottom permitting free passage of air and it appears (from the signal intensity and initial jet velocity) that most of the ejected air is redirected downwards. The heavy-duty commercial face shield is curved on the four edges, including under the chin, resulting in a less intense downward jet with about half of the initial speed than the lightweight 3D-printed face shield. These results suggest that face shields could be counterproductive in a supine position to reduce outward transmission of pathogens from patients, because virus-laden fluid particles could be redirected over the body of the person and then towards the centre of the room.
Figure 11. Cough with the UoE lightweight 3D-
                                                        printed face shield resulting in a strong
                                                        downwards jet (Test 262, Frame 77).

3.4 Aerosol Generating Procedures

AGPs are common in many medical, surgical and dental procedures. One AGP that is highly relevant to
the current management of patients in intensive care during the COVID-19 pandemic is extubation. We
therefore focused our tests on extubation. This procedure is typically undertaken in hospitals with the
potential of infecting a large number of critical workers at the time that they are most needed. The
patients are intubated to support their airway and ventilation. While intubated, patients are sedated or
anaesthetised, and their aerosol emission is very limited due to capture of gases in a closed circuit with
filtration. On the other hand, during extubation when the tube is removed from the patient’s airway, the
patient coughs repeatedly in a very short period, generating a jet of aerosol and droplets in the direction
of the clinicians.

To investigate, two intensive care specialists mimicked the intubation and extubation of a patient using
the manikin. During the entire procedure, the clinicians are positioned behind the head of the patient,
who lies supine on a bed. The manikin was intubated with a PortexÒ size 6.5 endotracheal tube (internal
diameter 6.5 mm, external diameter 8.9 mm), secured at a depth of 23cm at the lips. The part of the tube
that remains outside of the mouth is secured in place with tape attached to the patient’s face. To prevent
airflow to bypass the tube and displacement, this is equipped with an inflatable balloon cuff attached to
the external face close and inflated at 1.5-2.5 cm from the vocal cords (Varshney et al. 2011; Cavo 1985)
once the tube is in place, sealing the space between the external surface of the tube and the mucosa of
the trachea.

The extubation procedure takes typically between 10 s and 15 s and was fully recorded with BOS. Firstly,
the clinicians remove the tape. While a clinician holds the tube steady, the other deflates the sealing cuff.
The tube is then extracted slowly. The patient typically coughs repeatedly while the tube is pulled out.
Meantime, once the tube is removed, a clinician inserts a small tube down the patient’s throat to vacuum
liquid residuals and retained secretions to minimise aspiration – the contamination of the lower airways
with secretions. The manikin coughs 10 times, each cough lasts 0.2 s spaced by a 0.2 s pause.

We found that when the patient coughs with the tube, the jet of expired air is ejected both from the
mouth and from the disconnected tube. Since the tube can have different orientations and might not be
aligned with the jet emitted from the mouth, the tube increases the directions toward which the cough is
spread. Figure 9 shows that the combined jet through the mouth and the tube during the extubation. The
jet is not directed straight upwards or towards the clinicians, but at an angle (73°) towards the patient’s
feet. However, when the clinicians place their hands through the jet (Fig. 13), the jet spread over a wider
angle (from 32.4°±5.5° to 46.5°±4.7°) in a more upright direction (81.5°) towards the clinicians. This
suggests that as long as the patient does not move their head and the clinician does not obstruct or
redirect the cough jet with their hand during extubation, the extubating clinician positioned behind the
head of the patient is likely to be outside the direct cough jet. While this is achievable during simulations
using manikins, it is not always achievable in real-life clinical settings especially when extubating
uncooperative patients, infants and young children who cannot follow command, or those with cognitive
impairments. Furthermore, extubation in the intensive care unit often involve one clinician standing at
the bedside assisting the extubating clinician at the headend behind the patient. The assisting clinician at
the bedside may be within the direct cough jet. It would, therefore, be desirable to have a reliable and
consistent method to remove the direct cough jet during extubation in real-life clinical setting to
counteract any potential redirections of the cough jet from patient movements etc. We also developed
an aerosol extractor to provide a primary layer of protection for clinicians, performing AGPs and tested it
on the above model. Work is ongoing to provide this aerosol extractor for clinical use.
Figure 12. Cough during the extubation procedure Figure 13. Cough during the extubation procedure
without hands interference (Test 278, frame 738). with hands interference (Test 279, frame 538).
4. Conclusions
We used a Background Oriented Schlieren technique to investigate the air flow ejected by a person quietly
and heavily breathing, and coughing. We tested the effectiveness of different face covers including FFP2
and FFP1 masks, a respirator, a surgical and a hand-made mask, and two types of face shields. Finally, we
simulated an aerosol generating procedure demonstrating the extent of aerosol dispersion.
The airflow generated by a person without face covers showed the same qualitative trends observed by
previous authors (e.g. Tang2009, Bourouiba2014 and Bourouiba2014 2020). A turbulent air jet extends
straight driven by inertia from the mouth of the person in an almost horizontal direction. The jet gradually
increases in size and the velocity decreases, and when the inertial force is comparable to the buoyancy
force, it bends upwards.
We found that all face covers, with the exception of the respirator, allow a reduction of the front flow
through jet by more than 90%. The respirator has a valve system that filters the inhaled air but it does not
filter the exhaled air, and hence it does not protect other people from the exhaled air of the wearer. For
the FFP1 and FFP2 masks, which do not have the valve system, the airflow is pushed through the mask
material and the front throughflow does not extend by more than half a metre for the FFP1 mask and a
quarter of a metre for FFP2 mask. If these masks are not correctly fitted though, leaking jets are formed
but likely to be directed upwards with a negligible horizontal displacement.
Conversely, surgical and hand-made masks, and face shields, generate significant leakage jets that have the
potential to disperse virus-laden fluid particles by several metres. The different nature of the masks and
shields makes the direction of these jets difficult to be predicted, but the directionality of these jets should
be a main design consideration for these covers. They all showed an intense backward jet for heavy
breathing and coughing conditions. It is important to be aware of this jet, to avoid a false sense of security
that may arise when standing to the side of, or behind, a person wearing a surgical, or handmade mask, or
shield. For example, if some wearers of surgical masks turn their face to the side when they cough, there is
a risk that this side or backward jet is directed closer to a person standing in front of the wearer.
Additionally, clinicians working around a patient, in the confined space around an intensive care bed or an
operating table, are likely to be exposed to these side and backward leakage jets from surgical masks.The hand-made mask the face shield opened at the bottom (UoE lightweight 3D-printed face shield),
showed an intense downward jet. This jet could be a significant hazard if the wearer is supine or standing
near a seated person. For example, if the face shield is worn by a supine patient in a hospital bed, it would
lead to an expiration jet travelling over the body of the patient and lifted by their thermal plume, and
eventually reaching the centre of the room at face height.
Our simulation revealed that the air jet generated by a cough during the extubation manoeuvre is directed
almost vertically in front of the clinician faces. However, during the manoeuvre the clinician’s hands may
interfere with the jet, altering its direction towards the clinicians and widening the spread. These results
show the urgent need to develop technology and procedures to mitigate the risks of infection for the
clinicians and other people in the room during and for a period of time after extubation or other AGPs. For
example, this model was used to study the effectiveness of our aerosol extractor, which is not presented
in this document but it is the focus of ongoing work, to manufacture and make it available for clinical use .
A limitation of our experimental setup is that it does not reveal which is the absolute maximum distance
that a virus-laden fluid particle can travel, nor how the concentration of these particles varies spatially and
temporally. Furthermore, we tested only one person and one manikin while coughing. Hence, these results
do not allow to conclusively identify safe distances for different PPEs. However, because droplet
evaporation and aerosol buoyancy vary substantially with temperature and humidity (find ref from Intro),
and human breath and cough characteristics also vary significantly (more refs.), it might not be meaningful
searching for conclusive values. We focussed on the air flow dispersion without specifically distinguish
between large droplets that originate from the respiratory tract and aerosol. Other limitations are that the
measured signal is an integral value along line of sight from the camera and thus there is no information
on the velocity distribution along this line; the signal is correlated with the temperature gradient and thus
its intensity decreases as the jet progresses; the temperature of the masks may affect the temperature of
the jet and thus its signal (e.g. the respirator second breaths was more visible than the first one, suggesting
that it had absorbed heat from first breath). Within the limits of this work, these results revealed some key
relative differences between face covers that can aid policy makers to make informed decisions and PPE
developers to improve their product effectiveness by design.
Acknowledgements
This work received funds from the European Research Council (grant no. 759546), the Engineering and
Physical Sciences Research Council (EP/P020593/1, EP/L016680/1) and the Institute Strategic Programme
Grant support (no. BB/P013740/1) from the Biotechnology and Biological Sciences Research Council UK.
The authors are especially grateful to LaVision for borrowing of further equipment, which enabled the BOS
measurements, to Dr Nandita Chinchankar (Paediatric Intensive Care Unit, Royal Hospital for Sick Children,
Edinburgh) for assisting the simulation of the extraction procedure, and the Resuscitation Department at
the Royal Infirmary of Edinburgh for providing the simulation manikin.
Authors’ Contribution
Peterson, Pisetta, Pavar, Akhtar, Menoloascina, Mangano and Viola designed the experiments. Mangano
and Menolascina developed the cough simulator. Peterson, Pisetta, Pavar, Akhtar undertook the
measurements. Pisetta, Pavar and Nila processed the data. McDougall led the simulation of the extraction
procedure. Viola coordinated the project and, together with Peterson, Pisetta and Pavar wrote the first
draft of the manuscript. All authors advised on the design of experiments, the results interpretation, and
edited and approved the manuscript.References
3MTM. 2020. “Personal Safety Division: Technical Data Bulletin, Respiratory Protection for Airborne
Exposures to Biohazards.”
Almstrand, Ann-Charlotte, Björn Bake, Evert Ljungström, Per Larsson, Anna Bredberg, Ekaterina
Mirgorodskaya, and Anna-Carin Olin. 2010. “Effect of Airway Opening on Production of Exhaled
Particles.” Journal of Applied Physiology 108 (3): 584–88.
https://doi.org/10.1152/japplphysiol.00873.2009.
Asadi, Sima, Anthony S. Wexler, Christopher D. Cappa, Santiago Barreda, Nicole M. Bouvier, and William
D. Ristenpart. 2019. “Aerosol Emission and Superemission during Human Speech Increase with
Voice Loudness.” Scientific Reports 9 (1): 2348. https://doi.org/10.1038/s41598-019-38808-z.
Atkinson, James., and World Health Organization. 2009. Natural Ventilation for Infection Control in
Health-Care Settings. World Health Organization.
Atkinson, Michael P., and Lawrence M. Wein. 2008. “Quantifying the Routes of Transmission for
Pandemic Influenza.” Bulletin of Mathematical Biology 70 (3): 820–67.
https://doi.org/10.1007/s11538-007-9281-2.
Bałazy, Anna, Mika Toivola, Atin Adhikari, Satheesh K. Sivasubramani, Tiina Reponen, and Sergey A.
Grinshpun. 2006. “Do N95 Respirators Provide 95% Protection Level against Airborne Viruses, and
How Adequate Are Surgical Masks?” American Journal of Infection Control 34 (2): 51–57.
https://doi.org/10.1016/j.ajic.2005.08.018.
Bourouiba, Lydia. 2020. “Turbulent Gas Clouds and Respiratory Pathogen Emissions.” JAMA, March, 1–2.
https://doi.org/10.1001/jama.2020.4756.
Bourouiba, Lydia, Eline Dehandschoewercker, and John W. M. Bush. 2014. “Violent Expiratory Events: On
Coughing and Sneezing.” Journal of Fluid Mechanics 745 (April): 537–63.
https://doi.org/10.1017/jfm.2014.88.
Brainard, Julii Suzanne, Natalia Jones, Iain Lake, Lee Hooper, and Paul Hunter. 2020. “Facemasks and
Similar Barriers to Prevent Respiratory Illness Such as COVID-19: A Rapid Systematic Review.”
MedRxiv, 2020.04.01.20049528. https://doi.org/10.1101/2020.04.01.20049528.
Burch, Jane, and Christopher Bunt. 2020. “Can Physical Interventions Help Reduce the Spread of
Respiratory Viruses?” Cochrane Clinical Answers, March. https://doi.org/10.1002/cca.2965.
Cavo, John W. 1985. “True Vocal Cord Paralysis Following Intubation.” The Laryngoscope 95 (11):
1352???1359. https://doi.org/10.1288/00005537-198511000-00012.
CDC. 2020. “Social Distancing.” 2020. https://www.cdc.gov/coronavirus/2019-ncov/prevent-getting-
sick/social-distancing.html.
Chao, C.Y.H., M.P. Wan, L. Morawska, G.R. Johnson, Z.D. Ristovski, M. Hargreaves, K. Mengersen, et al.
2009. “Characterization of Expiration Air Jets and Droplet Size Distributions Immediately at the
Mouth Opening.” Journal of Aerosol Science 40 (2): 122–33.
https://doi.org/10.1016/j.jaerosci.2008.10.003.
Chen, Chih-Chieh, and Klaus Willeke. 1992. “Aerosol Penetration through Surgical Masks.” American
Journal of Infection Control 20 (4): 177–84. https://doi.org/10.1016/S0196-6553(05)80143-9.
Dalziel, S. B., G. O. Hughes, and B. R. Sutherland. 2000. “Whole-Field Density Measurements by ‘Synthetic
Schlieren.’” Experiments in Fluids 28 (4): 322–35. https://doi.org/10.1007/s003480050391.
Davies, Anna, Katy-Anne Thompson, Karthika Giri, George Kafatos, Jimmy Walker, and Allan Bennett.
2013. “Testing the Efficacy of Homemade Masks: Would They Protect in an Influenza Pandemic?”
Disaster Medicine and Public Health Preparedness 7 (4): 413–18.
https://doi.org/10.1017/dmp.2013.43.
DeDiego, Marta L., Lecia Pewe, Enrique Alvarez, Maria Teresa Rejas, Stanley Perlman, and Luis Enjuanes.
2008. “Pathogenicity of Severe Acute Respiratory Coronavirus Deletion Mutants in HACE-2
Transgenic Mice.” Virology 376 (2): 379–89. https://doi.org/10.1016/j.virol.2008.03.005.
Doremalen, Neeltje van, Trenton Bushmaker, Dylan H. Morris, Myndi G. Holbrook, Amandine Gamble,
Brandi N. Williamson, Azaibi Tamin, et al. 2020. “Aerosol and Surface Stability of SARS-CoV-2 asYou can also read


