Rock alteration at the post-Variscan nonconformity: implications for Carboniferous-Permian surface weathering versus burial diagenesis and ...
←
→
Page content transcription
If your browser does not render page correctly, please read the page content below
Solid Earth, 12, 1165–1184, 2021
https://doi.org/10.5194/se-12-1165-2021
© Author(s) 2021. This work is distributed under
the Creative Commons Attribution 4.0 License.

Rock alteration at the post-Variscan nonconformity: implications
for Carboniferous–Permian surface weathering versus burial
diagenesis and paleoclimate evaluation
Fei Liang1 , Jun Niu1,2 , Adrian Linsel1 , Matthias Hinderer1 , Dirk Scheuvens1 , and Rainer Petschick3
1 Material and Geosciences, Institute of Applied Geosciences, Technical University of Darmstadt, Darmstadt 64287, Germany
2 Faculty of Petroleum, China University of Petroleum-Beijing, Karamay Campus, Karamay 834000, China
3 Faculty of Geosciences and Geography, Goethe University Frankfurt, Frankfurt 60438, Germany

Correspondence: Jun Niu (niujunmm@outlook.com)

Received: 29 December 2020 – Discussion started: 25 January 2021
Revised: 17 March 2021 – Accepted: 19 April 2021 – Published: 25 May 2021

Abstract. A nonconformity refers to a hiatal surface located     overall order of element depletion in both basaltic andesite
between metamorphic or igneous rocks and overlying sedi-         and gabbroic diorite during the weathering process is as fol-
mentary or volcanic rocks. These surfaces are key features       lows: large-ion lithophile elements (LILEs) > rare earth ele-
with respect to understanding the relations among climate,       ments (REEs) > high-field-strength elements (HFSEs). Con-
lithosphere and tectonic movements during ancient times. In      cerning the REEs, heavy rare earth elements (HREEs) are
this study, the petrological, mineralogical and geochemical      less depleted than light rare earth elements (LREEs). Our
characteristics of Variscan basement rock as well as its over-   study shows that features of supergene physical and chemi-
lying Permian volcano-sedimentary succession from a drill        cal paleo-weathering are well conserved at the post-Variscan
core in the Sprendlinger Horst, Germany, are analyzed by         nonconformity despite hypogene alteration. Both can be dis-
means of polarization microscopy, and environmental scan-        tinguished by characteristic minerals and geochemical in-
ning electron microscope, X-Ray diffraction, X-ray fluores-      dices. Based on these results, a new workflow to eliminate
cence and inductively coupled plasma mass spectrometry           distractions for paleoclimate evaluation and evolution is de-
analyses. In the gabbroic diorite of the basement, the in-       veloped.
tensity of micro- and macro-fractures increases towards the
top, indicating an intense physical weathering. The overly-
ing Permian volcanic rock is a basaltic andesite that shows
less intense physical weathering compared with the gabbroic      1   Introduction
diorite. In both segments, secondary minerals are dominated
by illite and a mixed-layer phase of illite and smectite (I–     Nonconformities refer to contact surfaces between different
S). The corrected chemical index of alteration (CIA) and         lithologies in the geological record that were produced over
the plagioclase index of alteration (PIA) indicate an inter-     long-lasting periods of non-deposition and/or erosion and
mediate to unweathered degree in the gabbroic diorite and        are of paramount importance for the subdivision and corre-
an extreme to unweathered degree in the basaltic andesite.       lation of stratigraphic successions (Catuneanu, 1996). They
The τ values for both basaltic andesite and gabbroic dior-       also largely control the geometry of reservoirs for oil, gas
ite indicate an abnormal enrichment of K, Rb and Cs that         and water (Gardner, 1940). Moreover, nonconformities play
cannot be observed in the overlying Permian sedimentary          a key role in understanding changes in past interactions of
rocks. Accompanying minerals such as adularia suggest sub-       the atmosphere, hydrosphere and lithosphere as well as in
sequent overprint by (K-rich) fluids during burial diagenesis    elucidating driving mechanism for the adaption and evolu-
which promoted the conversion from smectite to illite. The       tion of life on Earth (Fedo et al., 1995; Nesbitt and Young,
                                                                 1989; Panahi et al., 2000) According to Catuneanu (1996),

Published by Copernicus Publications on behalf of the European Geosciences Union.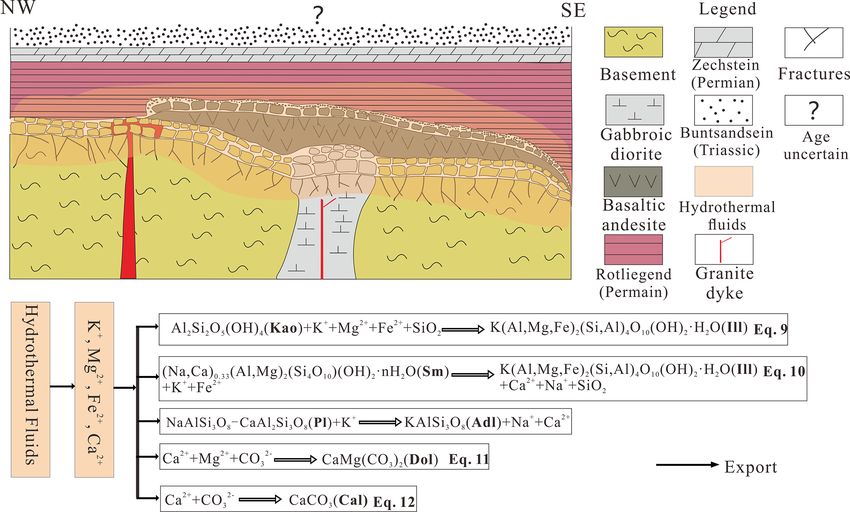
1166                                                       F. Liang et al.: Rock alteration at the post-Variscan nonconformity

stratigraphic sequences and bounding surfaces are assigned          face has been penetrated by numerous drilling efforts (Kirsch
to different orders based on their relative importance, which       et al., 1988).
is also known as a sequence hierarchy.                                 For this study, we selected a representative drill core
   Especially for continental nonconformities, the buried           reaching from unweathered basement rock into the volcanic-
paleo-weathered surfaces provide an ideal opportunity to an-        sedimentary cover that was analyzed at high resolution, in
alyze the weathering and climate conditions during exposure         particular near the nonconformity. This drill core allowed
(Jian et al., 2019; Zhou et al., 2017). This includes the alter-    not only for the study of the alteration in Variscan basement
ation and deformation of minerals, such as changes in crystal       rocks but also for the study of the subsequent alteration of
morphology of primary and secondary minerals during the             overlying early Permian basalt. We carried out a detailed pet-
weathering process, which is also called supergene alteration       rographical, mineralogical, and geochemical study and ap-
(Borrelli et al., 2014). After the paleo-weathered surface has      plied a new workflow to distinguish the supergene and hy-
been covered by sediments or volcanic rocks, burial com-            pogene alteration processes within a first-order nonconfor-
mences, leading to an increase in temperature and pressure          mity. The workflow is based on normalizing mineral types
as well as the passage of diagenetic fluids. This second over-      and geochemical weathering indices to un-overprinted condi-
print during deep burial diagenesis is called hypergene alter-      tions and quantifying the observed deviations. With corrected
ation and has to be carefully distinguished from the primary        geochemical and mineral information of the weathered pro-
supergene alteration (Dill, 2010).                                  file, the weathering and paleoclimatic condition as well as
   The widespread post-Variscan nonconformity represents            the alteration scenario were addressed.
an important first-order bounding surface within the cen-
tral and western European strata. The nonconformity is a re-
sult of the denudation of the Variscan orogen which mainly          2   Geological setting
took place from the late Carboniferous to the early Permian
(Henk, 1995; McCann, 1999; McCann et al., 2006; Zeh and             The Variscan orogen in central Europe was formed due to the
Brätz, 2004). Locally, however, the contact surface was over-       collision of the Gondwana and Laurussia mega-continents
lain during the Triassic period. To date, the tectonic evolu-       and intervening microplates, namely Avalonia and Armor-
tion in central Europe during post-Variscan times has been          ica. The final assemblage of these continents led to the for-
well studied (Matte, 1991; Ziegler et al., 2004). However,          mation of Pangaea between ca. 360 and 320 Ma during the
studies on weathering during the Permo-Carboniferous are            Carboniferous (Powell and Conaghan, 1973; Schulmann et
fairly scarce. On the other hand, climate and paleoenviron-         al., 2014). Due to a southward-directed subduction of the
mental conditions are well known from coal-bearing paralic          oceanic lithosphere below the Armorica microplate, the so-
and lacustrine sediments in the sub-Variscan foredeep and           called Mid-German Crystalline Zone (MGCZ) was formed
post-Variscan intramontane basins which indicate an over-           as a magmatic arc at the northern margin of Armorica during
all aridification trend from humid conditions in the West-          the Early Carboniferous; as a highland, this region contin-
phalian to hyperarid conditions in the Guadalupian (Upper           uously weathered and eroded until thermal subsidence be-
Rotliegend). From the Lopingian, the climate turned back to         gan to dominate in central Europe (von Seckendorff et al.,
semiarid conditions (Roscher and Schneider, 2006).                  2004a; Willner et al., 1991; Zeh and Brätz, 2004; Zeh and
   For the reconstruction of the weathering conditions and          Gerdes, 2010). As a consequence, the post-Variscan noncon-
the paleoclimate, fine-grained sediments such as siltstone or       formity was formed, which represents a diachronous time
mudstone are usually investigated (Nesbitt and Young, 1982;         gap of multiple tens to hundreds of millions years in central
Singer, 1988). However, caution is needed as these sediments        Europe (Henk, 1995; Kroner et al., 2007; von Seckendorff et
may be multi-sourced, recycled, and/or overprinted during           al., 2004b; Zeh and Brätz, 2004). The weathering surface was
transport and sedimentation (Fedo et al., 1995; Jian et al.,        covered and, hence, preserved by Permian sedimentary or
2019). To avoid this, it is feasible to analyze the weathering      volcanic rocks summarized as the Rotliegend Group (Becker
profile of igneous or metamorphic rocks in the source area          et al., 2012; Korsch and Schzfer, 1991; Stollhofen, 1998).
itself. With this approach, more accurate in situ information          The Odenwald basement is the largest basement window
regarding the weathering conditions during a certain period         of the MGCZ and consists of two major parts that are sep-
can be acquired. This approach also applies to the diagenetic       arated by the Otzberg shear zone: the Bergsträsser Oden-
history of the rocks that are situated in direct proximity to the   wald in the west and the Böllstein Odenwald in the east (Zeh
post-Variscan nonconformity (Dill, 2010). The Sprendlinger          and Gerdes, 2010). The Bergsträsser Odenwald is subdivided
Horst (Hesse, Germany) is a key area in southwestern Ger-           into three tectonic units which are composed of magmatic
many for investigating the rock alteration processes at the         and metamorphic rocks. These are, ordered from north to
post-Variscan nonconformity, as plutonic Variscan basement          south, Unit I, which includes the gabbro-dioritic Franken-
rocks in this area are widely covered by only a thin layer          stein Complex; Unit II with the so-called Neunkirchen Mag-
of Cisuralian volcano-sedimentary rocks and the contact sur-        matic Suite; and Unit III, which is dominated by large in-
                                                                    trusive bodies of the Weschnitz, Heidelberg and Tromm plu-

Solid Earth, 12, 1165–1184, 2021                                                       https://doi.org/10.5194/se-12-1165-2021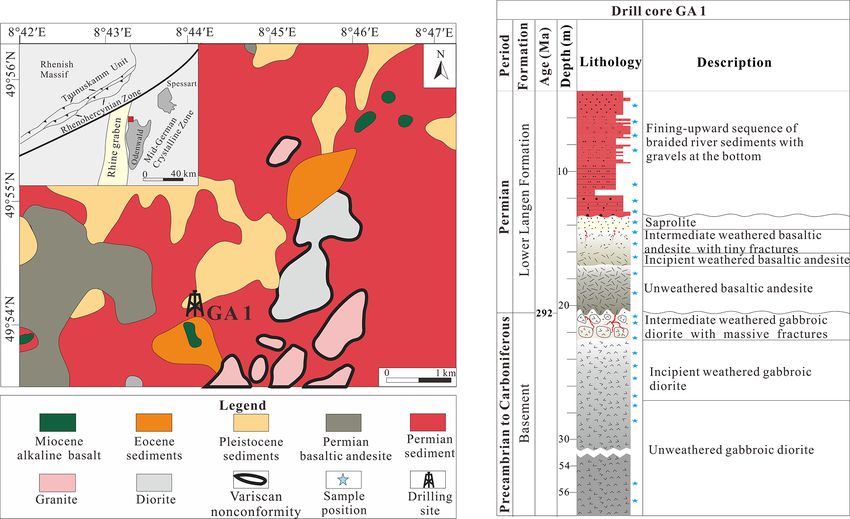
F. Liang et al.: Rock alteration at the post-Variscan nonconformity                                                        1167

tons (Dörr and Stein, 2019; Zeh and Will, 2008). The base-        per Rotliegend I wet phase (291 to 287 Ma), respectively.
ment rocks of the so-called Cenozoic Sprendlinger Horst           These “wet phases” can be observed in the whole European
belong to Unit I and represent a northern extension of the        region and are thought to be linked to deglaciation events of
Odenwald basement, consisting of amphibolite, granite, dior-      the Gondwana ice cap (Roscher and Schneider, 2006).
ite, gabbroic diorite and gabbro. Geochronological investi-          During the Mesozoic, the tectonic activity in central Eu-
gations of crystalline rocks of Unit I yield an emplacement       rope was relatively low and was accompanied by contin-
age of 362 ± 9 Ma for the Frankenstein gabbro (Kirsch et al.,     uous subsidence and marine transgression. In this phase,
1988). K/Ar and 40 Ar/39 Ar amphibole cooling ages fall into      around 1500 m of sediment accumulated, which overlaid the
a range between 363 and 334 Ma (Kirsch et al., 1988; Schu-        Variscan basement and/or Permo-Carboniferous sediments
bert et al., 2001). Cooling below 350–300 ◦ C (approximate        and volcanic rocks (Timar-Geng et al., 2006). The maxi-
closure temperature for the K–Ar system in biotite) occurred      mum thickness of overburden is expected for the Jurassic
at about 330 Ma (Kirsch et al., 1988). Thermal modeling for       (Schäfer, 2011). This is also the period of maximum heat-
the southern Bergsträsser Odenwald implies that the exhuma-       ing and hydrothermal activity, which overprinted both the
tion rate reached a maximum of 1.3 mm/a with average rates        Variscan crystalline basement and the overlain sediments and
of 0.2 mm/a from 338 to 333 Ma (Henk, 1995). Recently, the        volcanics locally. For this period, the formation of hydrother-
basement rocks of Unit I of the Sprendlinger Horst were as-       mal ores in central and southwest Germany is also well doc-
signed to a Cadomian basement (Dörr and Stein, 2019). The         umented (Bons et al., 2014; Staude et al., 2011; Timar-Geng
Dieburg metagranite in this region was dated to 540 ± 8 Ma.       et al., 2004). Based on apatite fission track analysis in crys-
According to these new findings, the investigated basement        talline rocks of the Odenwald basement, Wagner et al. (1990)
rocks are Cadomian relicts in the Variscan orogen.                estimated temperatures of more than 130 ◦ C for the Juras-
   The Cenozoic Sprendlinger Horst constituted a structural       sic. Burisch et al. (2017) calculated homogenization temper-
barrier between the nearby Saar–Nahe Basin in the west and        atures from fluid inclusions in hydrothermal veins of 272–
the Hessian Basin in the east from the early Cisuralian (Mc-      286 ◦ C and 180 ◦ C during the middle Jurassic and the Cre-
Cann, 1999). In the Saar–Nahe Basin, a subsidence rate of         taceous, respectively. These temperatures can only be ex-
approximately 0.26 mm/a has been revealed by backstrip-           plained by higher heat flow and/or ascending hydrothermal
ping analyses for the time between the Namurian and the           fluids.
Saxonian (Schäfer, 2011). The oldest sedimentary rocks of            During the late Cretaceous and the Eocene, coupled with
the Sprendlinger Horst are represented by the Moret For-          compressional intraplate stress of the Alpine Orogeny, the
mation (Becker et al., 2012). The Permian Moret Forma-            Upper Rhine Graben system was formed (Behrmann et al.,
tion deposited in an alluvial environment mostly in wadi-like     2005). In conjunction with the formation of the Upper Rhine
systems that contain poorly sorted conglomerates, pelites,        Graben, the Sprendlinger Horst was formed. The latter is
coarse-grained sandstones/wackes and breccias. The fluvial        bounded by the Rhine Graben fault system in the west and
sedimentary rocks of the overlying Lower Langen Formation         by the Gersprenz Graben in the east. Most of the sedi-
are interbedded with basalts and basaltic andesites. These        ments that overlaid the post-Variscan crystalline basement
volcanic rocks are the product of a Permo-Carboniferous           in the research area have been eroded since the Cretaceous
volcanism which took place throughout central Europe.             (Mezger et al., 2013; Schwarz and Henk, 2005). In the nearby
Ar40 /Ar39 dating of the volcanic products in the eastern         southeastern Odenwald region, they are partly conserved and
Saar–Nahe Basin imply ages of around 290 ± 6 Ma (Lippolt          reach a thickness of 500 m for the Lower Triassic Buntsand-
and Hess, 1983). This age approximately corresponds to the        stein (Marell, 1989). On the Sprendlinger Horst, only Per-
age of the Donnersberg Formation (Schäfer, 2011). The vol-        mian volcano-sedimentary rocks remained which decrease in
canic products in the Sprendlinger Horst are correlated to this   thickness from north to south of Darmstadt from 250 to 0 m
formation accordingly (Marell, 1989). Mudstone compaction         (Marell, 1989; Mezger et al., 2013)
rates indicate that over 3000 m of sediment was eroded due
to the inversion of the basin structure during the mid- and
later Permian (Henk, 1993).                                       3   Materials and methods
   During the Permo-Carboniferous, due to continental cli-
mate conditions within the supercontinent Pangaea, the pa-        Numerous drill cores in the Sprendlinger Horst were ac-
leoclimate in central Europe graduated from humid to hy-          quired by a scientific drilling project between 1996 and 2001.
perarid conditions (Parrish, 1993). In the Permian and Tri-       Many of the drill cores expose the post-Variscan nonconfor-
assic, only the margins of the supercontinent attracted mon-      mity in shallow depths of up to 80 m below ground surface
soonal rainfall and showed semiarid to subhumid conditions        and, thus, provide a unique chance to investigate this paleo-
(Parrish, 1993, 1995). The overall aridization is superim-        surface at local scales. Along these drill cores, core GA1
posed by several wet phases, namely the Westphalian C/D,          was selected because it exposes three different lithological
the Stephanian A (303.6 to 301.7 Ma), the Stephanian C to         units, namely the plutonic basement at the bottom, the Per-
early lower Rotliegend (299.1 to 295.5 Ma) and the early up-      mian volcanic lava in the middle and the overlying Permian

https://doi.org/10.5194/se-12-1165-2021                                                     Solid Earth, 12, 1165–1184, 2021

1168                                                      F. Liang et al.: Rock alteration at the post-Variscan nonconformity

Rotliegend sedimentary rocks at the top. The sedimentary           0.53 g of each sample was mixed (with a ratio of 1 : 8) with
rocks show a gradual transition from alluvial facies at the        Li2 B4 O7 and fused at 1150◦ in a Pt crucible to make a glass
base to fluvial facies at the top (Fig. 1) and mainly consist      disk for XRF analysis.
of matrix-rich breccias, wackes and siltstones. Both the top          For trace and rare earth element analysis, 40 mg of sample
of the basement rock and the top of the volcanic lava con-         powder was weighed and placed into high-pressure-resistant
stitute paleo-surfaces that faced intense alteration throughout    Savillex Teflon beakers to which 0.8 mL 1 : 1 HNO3 , 0.8 mL
their exposure, which is thought to be significantly shorter for   HF and 0.5 mL 3N HClO4 were added. The mixture was
the volcanic rocks. The macroscopic alteration underneath          heated for 48 h at 100◦ and then evaporated. A total of 0.8 mL
these surfaces is intense; this is expressed by a higher de-       1 : 1 HNO3 was then added and heated at 100◦ for 12 h. Next,
gree of fracturing, bleaching and grain disaggregation. The        0.8 mL HF and 0.5 mL 3N HClO4 were added, and the beaker
degree of macroscopic alteration decreases with increasing         was sealed and moved into an oven with a temperature of
depth in these parts. The core offers the unique opportunity       190◦ for 48 h to make sure that the sample was completely
to study subsequent weathering intervals and to compare typ-       dissolved. The beakers were then opened, the solution was
ical end-members of rock types with weak (gabbroic diorite)        evaporated and 4 mL 4N HNO3 was added. Following this,
and strong (andesitic basalt) vulnerability to chemical weath-     the beakers were sealed and moved into the oven which was
ering.                                                             set at a temperature of 170◦ for 4 h. Finally, the solution was
   In total, 24 samples were extracted from the GA1 drill          diluted with 3 % HNO3 until the weight of the solution was
core: 11 belonged to the basement, 6 belonged to the over-         250 times the weight of the sample. A total of 0.25 g of the
lying volcanic rock (Fig. 1) and 7 belonged to the sedimen-        solution was taken and diluted with 3 % HNO3 to 2.00 g,
tary rocks of the Lower Langen Formation. In order to cap-         mixed with 2.00 g Rh–Re internal standard solution and ex-
ture the small-scale petrographic and geochemical variations       amined by ICP-MS. To monitor the analytical quality, inter-
in the weathering zones appropriately, we reduced the sam-         national standards of GSR-1(granite), GSR-2(andesite) and
pling interval in the topmost part of the volcanic rock and in     GSR-3(basaltic andesite) were applied.
the basement to 40 cm; for the rest of the core, the interval
was around 1 m in order to avoid the fractures.
   The samples were used to prepare thin sections that were        4     Results
analyzed by polarization microscopy and SEM–EDX (scan-
ning electron microscopy–energy dispersive X-Ray analy-            4.1     Petrographic characteristics
sis) for their petrographic characteristics. For mineral com-
                                                                   4.1.1    Plutonic rock
position, trace element and major element analyses, all sam-
ples were crushed and milled into a powder with a diameter         The Variscan basement in drill core GA1 consists of a coarse-
of less than 63 µm. One part of the powder was examined            grained plutonic rock with a conspicuous salt-and-pepper ap-
by X-ray diffraction (XRD) at Goethe University Frankfurt          pearance and a phaneritic texture. Fractures are pervasive
for whole rock mineral composition. Careful back-loading           from 20.6 to 21.4 and from 21.7 to 22.3 m. The width of the
of the powder preparation was utilized for XRD in order to         fractures is around 1 cm. From 22.3 to 23.4 m, both fracture
reduced preferred orientation. Using a PANalytical X’Pert          density and width gradually reduce downwards. Nearly all
diffractometer equipped with a Bragg–Brentano goniome-             fractures are filled by secondary minerals (Fig. S1). Under
ter (Copper beam), each sample was scanned at 40 kV and            the microscope, the fresh parts of the plutonic basement rock
30 mA for 2 h. The start angle was 2.5◦ , the end angle was        mainly consist of plagioclase (oligoclase and labradorite),
70.0◦ and a step size of 0.008◦ was applied. The time for          quartz, biotite and amphibole (Fig. 2a). With decreasing
each step was 50 s. The mineral-phase proportions were es-         depth, primary minerals such as plagioclase and biotite were
timated by weighted XRD peak intensities after conversion          gradually altered and transformed into secondary minerals;
with their typical reference intensity ratios (RIR), as found      fractures are also ubiquitous in the thin sections in the top-
in the powder diffraction file (PDF-2 and PDF-4 of the Inter-      most part. Primary grain shapes are distorted and most of
national Centre of Diffraction Data: https://www.icdd.com/,        them are filled with calcite (Fig. 2b). Moreover, recrystal-
last access: 12 June 2019; see Table 1) with MacDiff soft-         lized quartz coupled with calcite is found filled in the frac-
ware (Petschick et al., 1996).                                     tures (Fig. 2c). Some of the fractures are filled by dolomite
   The powder samples were sent to the State Key Laboratory        accompanied with quartz (Fig. 2d). Even in the topmost
of Isotope Geochemistry, Guangzhou Institute of Geochem-           part (20.6 m), the plagioclase grains are only partly altered
istry, Chinese Academy of Sciences, for the examination of         (Fig. 2e).
major elements by X-ray fluorescence (XRF) and the exami-
nation of trace elements by inductively coupled plasma mass        4.1.2    Lava
spectrometry (ICP-MS). Before XRF analysis, samples were
roasted at 900◦ for 3 h and weighed before and after heating       The lava has a phaneritic, amygdaloidal texture. Fractures
to measure the loss on ignition (LOI). Subsequently, 0.51–         in this part are very limited and occur between 13.8 and

Solid Earth, 12, 1165–1184, 2021                                                       https://doi.org/10.5194/se-12-1165-2021
F. Liang et al.: Rock alteration at the post-Variscan nonconformity                                                                1169

Figure 1. Location and geology of the research area, and the lithological section of the GA1 drill core; note the gap between 30 and 54 m
drilling depth. Blue stars indicate the sampling locations.

14.7 m with a high angle to the horizon. The width is less             amphibole is not found. Furthermore, plagioclase decreases
than 1 mm, and the fractures are also filled with secondary            in abundance from around 40 % at the bottom to about 8 %
minerals (Fig. S1). The fresh part of the volcanic rock mainly         at the top. Considering the mineralogical composition of the
consists of plagioclase (albite) crystals and amygdaloid bod-          fresher parts of the plutonic rock, based on the quartz, alkali
ies that are made up of calcite and zeolite locally accom-             feldspar, plagioclase, feldspathoid (QAPF) diagram for plu-
panied with chalcedony (Fig. 2f). With a decrease in depth,            tonic rocks, the protolith of the basement rock can be classi-
the content of plagioclase gradually decreases under the mi-           fied as a quartz diorite/tonalite (Fig. S2), which corresponds
croscope. However, the thin section in the topmost part of             well with Mezger et al. (2013).
the lava (13.9 m) shows a sudden change compared with the
samples from lower parts. Here, nearly all primary miner-              4.2.2   Lava
als were altered to secondary clay minerals, but the primary
grain shapes are still relatively intact (Fig. 2g). Some residual      The fresh samples of the volcanic rock are composed of
grains consist of a kaolinite rim and a core of illite or illite–      augitic pyroxene and plagioclase (albite). In the weathered
smectite (I–S) mixed layers (Fig. 2h). In the void, adularia           part, most of the phases appear as secondary minerals, such
with kaolinite can be observed (Fig. 2i).                              as quartz, hematite and anatase; clay minerals, such as illite,
                                                                       mixed layer illite-smectite (I–S), vermiculite and kaolinite;
4.2     Mineral composition                                            and carbonate minerals, like calcite and minor dolomite. The
                                                                       uppermost part of the lava is dominated by I–S mixed-layer
4.2.1    Plutonic rock                                                 minerals, the plagioclase content is less than 5 % and pyrox-
                                                                       ene is absent. The abundance of plagioclase (and pyroxene)
The XRD results are listed in the Supplement (Table S1) and            gradually decreases from bottom to top, and illite and vermi-
are plotted in Fig. 3. The plutonic basement part is composed          culite exhibit an increasing tendency (Fig. 3). Based on the
of plagioclase (oligoclase and labradorite), K-feldspar (only          QAPF diagram for volcanic rocks, the protolith of the weath-
in one sample), quartz, amphibole (mainly Mg-hornblende)               ered volcanic rock can be classified as a basalt or andesite
and mica phases, with secondary minerals of illite (not sep-           (Fig. S2).
arable from micas), vermiculite, I–S mixed layers, minor
kaolinite, anatase, hematite, calcite and dolomite. Amphibole
abundance decreases in the middle section and disappears
in the uppermost part. In the topmost portion (20.6–23.5 m),

https://doi.org/10.5194/se-12-1165-2021                                                            Solid Earth, 12, 1165–1184, 2021
1170 F. Liang et al.: Rock alteration at the post-Variscan nonconformity
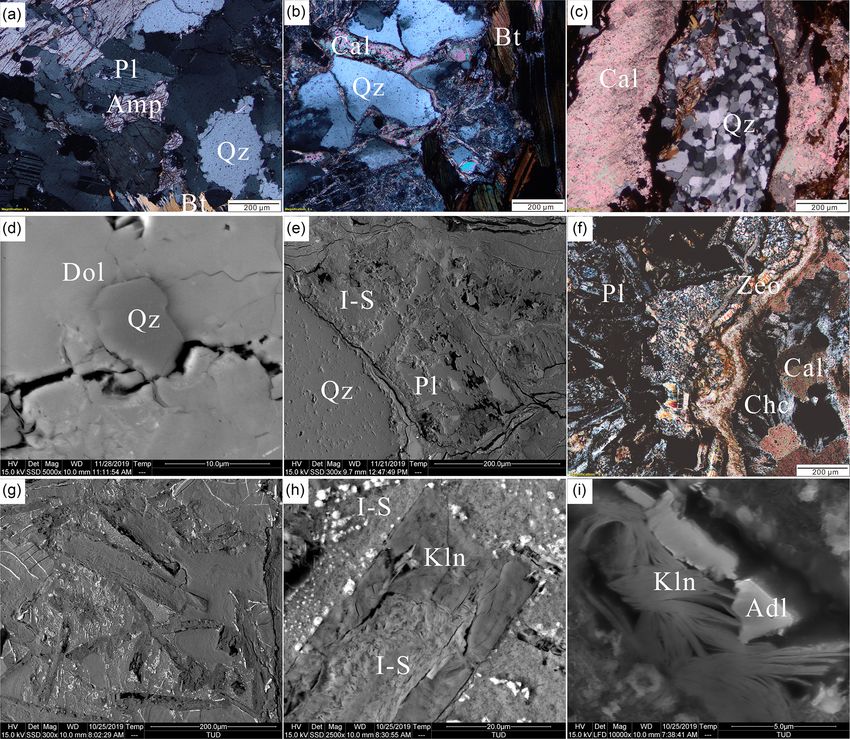
Figure 2. Petrographic characteristic of the basement and the overlying volcanic rock in the GA1 drill core: (a) fresh gabbroic diorite (PM,
z = 55.5 m); (b) gabbroic diorite (PM, z = 20.6 m) and fractured quartz grain; (c) gabbroic diorite (PM, z = 23.5 m) and recrystallized quartz
coupled with a calcite filled in fracture; (d) gabbroic diorite (BSE, z = 21.5 m) and dolomite accompanied by quartz; (e) gabbroic diorite
(BSE, z = 20.6 m) and partly weathered plagioclase. (f) basaltic andesite (PM, z = 17.8 m) and fresh plagioclase grains with the amygdaloid
consisting of calcite and zeolite and chalcedony; (g) basaltic andesite (BSE, z = 13.9 m) secondary clay minerals with intact primary grain
shapes; (h) basaltic andesite (BSE, z = 13.9 m) and I–S surrounded by kaolinite within one residual plagioclase grain shape; (i) basaltic
andesite (SEM, z = 13.9 m) with kaolinite and adularia filled in the void. The abbreviations used in the figure and caption are as follows: PM
– polarizing microscopy, z – depth below ground surface, Amp – amphibole, Kln – kaolinite, Adl – adularia, Bt – biotite, Cal – calcite, Pl –
plagioclase, Zeo – zeolite, Chc – chalcedony, Dol – dolomite and Qz – quartz.
4.3 Geochemical characteristics 4.3.2 Major elements
4.3.1 Geochemical rock classification The concentrations of major elements are listed in the Sup-
plement (Table S2) and are visualized in 1-D profiles for
In order to further verify the lithological type of the plutonic both basaltic andesite (Fig. 5a) and gabbroic diorite (Fig. 5b).
and volcanic rock for the basement part of the GA1 drill Within the lower relatively fresh part of the gabbroic diorite,
core, the geochemical data from comparatively fresh samples major elements such as K2 O, Na2 O, P2 O5 CaO and MnO
(23.5–56.5 m) are plotted in the total alkali silica (TAS) dia- are almost constant. Al2 O3 and TiO2 fluctuate in the topmost
gram (Middlemost, 1994) (Fig. 4). Here, the results mainly part (20.6–21.5 m) and show an overall slightly increasing
plot in the gabbroic diorite field (Fig. 4a), which is grossly tendency from top to bottom. For Fe2 O3 , the fluctuation is
consistent with the results from the petrographic classifica- high in the topmost part and low in the lower part. There is a
tion (Fig. S2). For the volcanic rock classification, a revised sharp shift in most concentrations when approaching the in-
Winchester–Floyd diagram is applied, which is based on im- tensely altered part at the top of the profile. Despite the high
mobile trace elements (Pearce, 1996). Most lava samples fall fluctuation in most concentrations in the uppermost part, a
into the andesite/basaltic andesite field (Fig. 4b), which is significant increase in K2 O and decrease in Na2 O are ob-
also in accordance with the petrographic classification result. served from bottom to top (Fig. 5b).
In the following, we use the result of chemical classifica- Concerning the basaltic andesite, there are some clear
tion and term the two protolith rocks as gabbroic diorite and trends with increasing Al2 O3 , K2 O, P2 O5 and TiO2 concen-
basaltic andesite. trations and with decreasing CaO and Na2 O concentrations
Solid Earth, 12, 1165–1184, 2021 https://doi.org/10.5194/se-12-1165-2021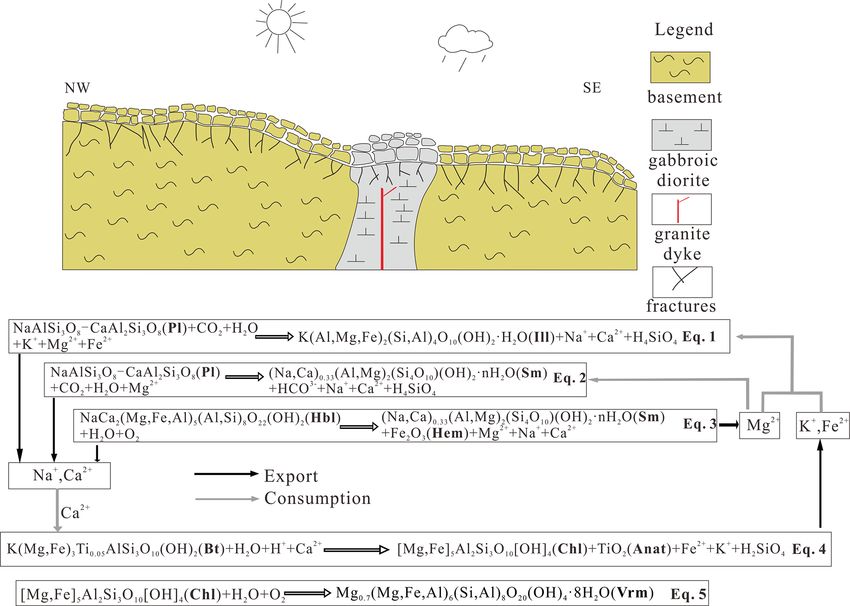
F. Liang et al.: Rock alteration at the post-Variscan nonconformity                                                            1171

Figure 3. Mineral compositions of both Permian volcanic lava and Paleozoic basement rock in the GA1 drill core (measured by powder
XRD).

Figure 4. Classification of rocks of the GA1 well with a TAS diagram and revised Winchester–Floyd diagram: (a) samples from fresh and
sufficiently fresh parts of the basement; (b) samples from overlain lava.

towards the top. In contrast to the gabbroic diorite, a sharp           Concerning the basaltic andesite part, HFSEs such as Zr,
shift in concentrations is observed in the uppermost sample          Hf, Nb, Ta and Th (in ppm) all exhibit an increasing ten-
for all elements except for Fe2 O3 which fluctuates along the        dency from the bottom to the top, with a sharp increase in the
profile (Fig. 5a).                                                   topmost sample. LILEs such as Rb and Cs also show an in-
                                                                     creasing tendency, whereas Sr reveals an inverse trend, with
4.3.3   Trace elements                                               a decrease from 123 ppm at the bottom to 47 ppm in the top-
                                                                     most part. The tendency for Ba is irregular compared with
Trace element data are also given in the Supplement (Ta-             the other elements, but the overall trend is decreasing.
ble S3). Variations in representative trace elements from both
gabbroic diorite and basaltic andesite are shown in Fig. 6. In       4.3.4   Rare earth elements (REEs)
the gabbroic diorite, except for the topmost part, fluctuations
in high-field-strength elements (HFSEs) such as Zr, Hf, Nb,          REE concentrations are listed in the Supplement (Ta-
Ta and Th (in parts per million, ppm) are limited or even con-       ble S4) and are shown as chondrite-normalized patterns (Mc-
stant. For large-ion lithophile elements (LILEs), Rb and Cs          Donough and Sun, 1995) in Fig. 7. The calculation for the
decrease from top to the bottom, whereas Sr increases from           anomalies of cerium (Ce) and europium (Eu) are defined as
61 to 348 ppm. Ba fluctuates in the upper part of the gabbroic       follows:
diorite section but is almost constant in the lower part.             Ce      2 × CeN
                                                                          =             ,                                     (1)
                                                                     Ce∗     LaN + PrN

https://doi.org/10.5194/se-12-1165-2021                                                         Solid Earth, 12, 1165–1184, 2021
1172                                                           F. Liang et al.: Rock alteration at the post-Variscan nonconformity

Figure 5. Major element content (in wt %) of the basaltic andesite (a) and the gabbroic diorite (b) along the drill core profile.

Figure 6. Representative trace element content (in ppm) of basaltic andesite (a) and gabbroic diorite (b) along the drill core profile.

and                                                                       5     Discussion
Eu      2 × EuN
    =              .                                             (2)      5.1    Chemical alteration
Eu∗   (SmN + GdN )
Here, Ce* and Eu* are the hypothetical concentrations of                  During chemical weathering, alkalis and alkaline earth ele-
trivalent Ce and Eu, and XN represents the normalized value               ments contained in silicates such as feldspar, mica minerals,
of the element X. The distribution patterns of both gabbroic              pyroxene and amphibole will be gradually depleted, whereas
diorite and basaltic andesite are nearly parallel at different            aluminum tends to remain in situ, generating clay minerals
depths and exhibit decreasing values from the bottom to the               (Clift et al., 2014; Nesbitt and Young, 1982; Vázquez et al.,
top (Fig. 7). All samples are moderately enriched in light rare           2016). Based on this mechanism, different types of weath-
earth elements (LREEs) and have gently right-dipping REE                  ering indices were developed to evaluate the weathering in-
patterns. They exhibit no Ce anomalies and slightly negative              tensity. Among these, the chemical index of alteration (CIA)
Eu anomalies.                                                             and the plagioclase index of alteration (PIA) were proposed
                                                                          by Nesbitt and Young (1982) and Fedo et al. (1995), respec-
                                                                          tively. They are defined as

                                                                                              Al2 O3
                                                                          CIA =                                 × 100,                    (3)
                                                                                   Al2 O3 + CaO∗ + Na2 O + K2 O

Solid Earth, 12, 1165–1184, 2021                                                                https://doi.org/10.5194/se-12-1165-2021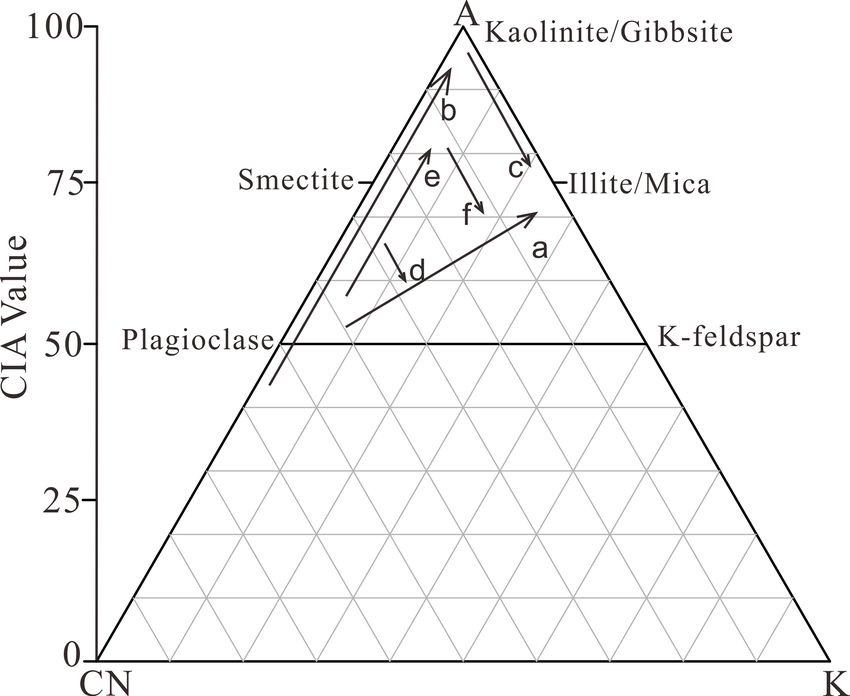
F. Liang et al.: Rock alteration at the post-Variscan nonconformity                                                                  1173

Figure 7. The REE pattern of basaltic andesite (a) and gabbroic diorite (b) at different depths.

and                                                                       molecular proportions. The ideal weathering trend for differ-
                Al2 O3 − K2 O                                             ent types of parent rocks in the upper continental crust should
PIA =                                × 100,                      (4)      be parallel to the A–CN axis, but the original data tend to de-
        Al2 O3 + CaO∗ + Na2 O − K2 O
                                                                          viate from the theoretical weathering trend due to diagenetic
respectively. Here, all portions are given in molecular weight,           alteration (Babechuk et al., 2015; Fedo et al., 1995; Zhou et
and (in both equations) CaO* is the Ca content within sili-               al., 2017). The trends for both basaltic andesite and gabbroic
cate minerals only. Bulk rock analysis of altered rocks, how-             diorite samples uniformly deviate from the ideal weathering
ever, is affected by Ca mobilization and secondary calcite                tendency and excurse to the K apex (Fig. 8a), which clearly
precipitation. First, Ca may be transferred downward during               indicates a relative K enrichment. In the literature, the enrich-
weathering in the top part and may precipitate there along                ment of K is interpreted as K metasomatism due to conver-
fractures that were formed before by physical weathering                  sion among clay minerals, such as the transformation from
and/or rock relaxation. Second, Ca may be transferred by                  kaolinite to illite or from plagioclase to K-feldspar (Fedo et
fluids from underlying or overlying formations during the                 al., 1995; Nesbitt and Young, 1984; Zhou et al., 2017). K
burial process, depending on the hydraulic conditions. Both               metasomatism results in a lower CIA value relative to the ac-
cases will increase the Ca content. Hence, bulk geochem-                  tual weathering intensity and can also explain the deviation
istry cannot be applied directly. For the correction of cal-              from the PIA. To address this problem, Fedo et al. (1995)
citic CaO*, McLennan (1993) used the following approach:                  suggested that the proportion of “pre-metasomatic” composi-
CaOrest = CaO−P2 O5 ∗ 10/3, where P2 O5 is related to ap-                 tions of the weathering products could be determined by cor-
atite, and CaO* = CaOrest when CaOrest < Na2 O or CaO*                    recting each point on the A–CN–K diagram back to its pre-
= Na2 O otherwise. With this calculation, the CIA value for               dicted position. The method proposed by Panahi et al. (2000)
fresh feldspar is about 50, unaltered basaltic andesite is be-            for the K correction is applied as follows:
tween 30 and 45, granitoids range between 45 and 55, illite is                         m∗Aw + m∗CNw
from 75 to 85, muscovite yields a value of 75, and kaolinite              K2 Ocorr =                .                                  (5)
                                                                                           1−m
and chlorite have the highest value of nearly 100 (Fedo et al.,
1995). As a modification of the CIA, the PIA value for fresh              Here, Aw and CNw refer to the Al2 O3 and (CaO* + Na2 O)
rock is around 50, whereas for clay minerals such as kaoli-               content in the weathering zone, respectively, where
nite, illite and gibbsite, it is close to 100 (Fedo et al., 1995;
                                                                                     K
Patino et al., 2003).                                                     m=               .                                           (6)
   In our case, the CIA and PIA decrease from top to bottom                     A + CN + K
for both gabbroic diorite and basaltic andesite. The PIA val-             The K, A and CN values for the calculation of m were taken
ues are clearly higher than the CIA values (Fig. 8a). In the              from the protolith sample.
topmost basaltic andesite part, the CIA is up to 77, which                   With corrected K2 O values, the trend of all sample points
indicates an intermediate degree of weathering. The results               in the A–CN–K diagram is parallel to the A–CN axis
from XRD and backscattered electron microscopy (BSE),                     (Fig. 8b). Moreover, the CIAcorr values are now consistent
however, indicate that the plagioclase is weathered and 74 %              with the PIA value. The CIAcorr values of the gabbroic dior-
of the constituent is I–S. This is well expressed by the PIA,             ite indicate an intermediate to incipient chemical weathering
which yields a value of 98; hence, the PIA is more consistent             degree, with CIAcorr values of 80 in the top part and values of
with the mineralogical and petrographic character than the                58 at the bottom (Fig. 8b). PIA values decrease from 83 to 59
CIA.                                                                      (Fig. 8b). For both the CIAcorr and PIA values, inconsistent
   To better evaluate the weathering intensity, an A–CN–K                 trends between the topmost part (20.6–21.5 m) and the re-
ternary diagram is applied (Fedo et al., 1995; Nesbitt and                maining section (22.5–28.5 m) result from a sudden decrease
Young, 1984). The letter A stands for Al2 O3 , CN stands for              in the weathering degree which forms a “discontinuity”. The
(CaO* + Na2 O) and K stands for the content of K2 O – all in              CIAcorr and PIA values in the topmost part range from 79

https://doi.org/10.5194/se-12-1165-2021                                                              Solid Earth, 12, 1165–1184, 2021
1174                                                       F. Liang et al.: Rock alteration at the post-Variscan nonconformity

Figure 8. Weathering indices with an A–CN–K diagram of both basaltic andesite and gabbroic diorite before and after K correction, based
on Fedo et al. (1995) and Nesbitt and Markovics (1997).

to 80 and from 78 to 80, respectively; in the remaining sec-          5.2    Quantification of element transfer
tion, the CIAcorr and PIA values decrease from 62 to 58 and
from 63 to 59, respectively. Petrographic and mineralogical           For quantification of element transfer due to weathering and
features correspond well to the corrected weathering indexes.         diagenesis, the τ model is applied (Anderson et al., 2002;
Secondary alteration products are mainly illite, with a small         Nesbitt, 1979; Nesbitt and Markovics, 1997). The model uses
quantity of kaolinite and vermiculite.                                the relation of the mobile element concentration in the sam-
   The corrected CIA values in the basaltic andesite suggest          ple (Msample ) vs. the protolith (Mprotolith ) and between the
an extreme to incipient weathering degree, with the CIAcorr           immobile element concentration in the sample (Isample ) vs.
and PIA decreasing from respective values of 97 and 98 at             the protolith (Iprotolith ). Among the immobile elements, Ti is
the top to respective values of 42 and 41 at the bottom. Simi-        widely used as a key element (Middelburg et al., 1988). Thus,
lar to the gabbroic diorite, a discontinuity exists between the       the model is defined as follows:
topmost part (13.9 m) and the lower part (14.3–19.3 m) for                   Msample × Tiprotolith
both CIAcorr and PIA values. The high CIAcorr and PIA val-            τM =                         − 1.                            (7)
                                                                             Mprotolith × Tisample
ues in the topmost part of the basaltic andesite indicate ex-
treme chemical weathering. In the lower part of the basaltic          When τM >0, element M is enriched during alteration; when
andesite, the CIAcorr and PIA values decrease from 64 at the          τM = 0, element M is immobile during alteration; when
top to 42 at the bottom and from 65 at the top to 41 at the           0>τM > − 1, element M is depleted; when τM = −1, ele-
bottom, respectively (Fig. 8b). These values are much lower           ment M is completely lost from the material. For the basaltic
than values from the topmost part and suggest an incipient            andesite and gabbroic diorite, the samples from the bottom
weathering degree. Based on the XRD results, the plagio-              (19.3 m for basaltic andesite and 55.5 and 56.5 m for gab-
clase content at the bottom is 77 % and declines gradually up         broic diorite) were selected as protoliths to provide the low-
the section to 54 % at 14.5 m before it suddenly drops to 0 %         est degree of alteration based on the CIA values, petrographic
at 13.9 m. At a depth of 14.5 m, the plagioclase grains are still     features and XRD results.
mostly fresh, which is clearly different from the uppermost              The results for major and trace elements are listed in the
0.5 m in which they are completely altered.                           Supplement (Table 5) and are plotted in Fig. 9. In the basaltic

Solid Earth, 12, 1165–1184, 2021                                                          https://doi.org/10.5194/se-12-1165-2021
F. Liang et al.: Rock alteration at the post-Variscan nonconformity 1175
of 23.5 m can also be explained by porosity data (Weinert
et al., 2021), which can be considered as a measure of frac-
ture density and grain disaggregation in igneous rocks. The
porosity decreases sharply from 24 % at a depth of 21.5 m
to 3 % at 23.6 m (Fig. 9b). This can be explained by the
fact that the fractures provided pathways for meteoric wa-
ter before the Permian basaltic to andesitic lava flow flooded
the basement. Ca was leached by meteoric water, transferred
downward through these fractures and accumulated around
the interface, where the porosity sharply decreases.
Based on Kcorr , K was depleted during the weathering pro-
cess in both basaltic andesite and gabbroic diorite. The deple-
tion trend of K from top to the bottom is similar to the trend
of Na. In the topmost part of the basaltic andesite, τKcorr is
−0.59 and gradually increases to −0.35 and 0.08 at depths
of 14.3 m and 17.8 m, respectively. In the top part of the gab-
broic diorite, τKcorr increases from −0.26 (20.6 m) to −0.23
(21.5 m) followed by a sharp increase to around 0 in the low-
est part (Table S5). The τ value trend of Kcorr is in agree-
ment with macroscopic and microscopic weathering trends,
thereby supporting the applicability of the K correction.
Figure 9. Element characteristics: (a) Sr–CaO cross-plot for the In contrast to Ca and Na, elements closely related to clay
GA1 drill core; (b) relationship between the τ value and the poros- formation such as K, Rb and Cs show significant enrichment
ity in the gabbroic diorite; (c) relationship among Rb, Cs and K2 O
(Fig. 6). In the gabbroic diorite part, the τ values of K, Rb
for sedimentary rocks, basaltic andesite and gabbroic diorite.
and Cs decrease from 2.5 to 0.2, from 5.4 to 0.5 and from
19.8 to 2.3 from top to bottom, respectively. Similarly, they
decrease in the basaltic andesite from 4.2 to −0.4, from 5.5
andesite part, both Ca and Na are strongly depleted in the to −0.4 and from 8.4 to 0.2 from top to bottom, respectively.
topmost section (13.9 m), with τCa and τNa of −0.93 and To search for the origin of this enrichment, correlation di-
−0.99, respectively. τCa gradually increases from −0.60 to agrams for gabbroic diorite, basaltic andesite and sediments
−0.07 and τNa increases from −0.60 to −0.18 with increas- are plotted (Fig. 9c). The linear and close relationships be-
ing depth from 14.3 m down to 17.8 m. The discontinuity tween Cs, Rb and K in the gabbroic diorite and basaltic an-
between the topmost part and the remaining section corre- desite point to a joint alteration of both, whereas the over-
sponds well to the CIA and PIA values. However, the τNa lying sediments can be excluded as a source. This is con-
values from the top gradually increase from −0.70 (20.6 m) sistent with the conclusion of Molenaar et al. (2015), who
to −0.67 (21.5 m) in the gabbroic diorite part, followed by claimed that the overlain Permian Rotliegend sediment on
a sharp increase in the lower section, with values between Sprendlinger Horst formed a “closed system” and diagenetic
−0.12 and 0.06. This is consistent with the trends of both the fluids did not transfer matter in and out of the system. Palmer
CIA and PIA. τCa values show a high variability compared and Edmond (1989) claimed that mobile elements such as K,
with τNa . The sample from 20.6 m yields a τ value of −0.03, Rb and Cs are very easily extracted by thermal fluids and
which indicates a slight depletion in Ca, whereas the sample transferred during hydrothermal activity. In addition to clay
from 21.5 m shows a τ value of 0.17, which suggests a slight transformation, typical minerals formed from hot fluids are
enrichment in Ca (Fig. 9b). A similar enrichment also occurs observed in thin sections and XRD, such as dolomite accom-
at 23.5 m, which yields a value of 0.13 (Table S5). panied by secondary quartz and adularia (Fig. 3). This obser-
The Sr/Ca ratio can be applied as a parameter to dis- vation supports the model of a second alteration that was per-
tinguish different phases of diagenetic fluids (Berndt et al., vasive through the nonconformity and must have happened
1988; Brandstätter et al., 2018). To figure out the source of during burial diagenesis.
Ca, the Sr–CaO diagram is applied (Fig. 9a). The ratios of Figure 10 displays the τM values for all elements. The
Sr/CaO at the top of the gabbroic diorite at depths of 20.6 large-ion lithophile elements (LILEs), K, Rb and Cs, are re-
and 21.5 m show a close relation to the Sr/CaO ratios of the moved from the figure due to their strong enrichment which
basaltic andesite, and they clearly deviate from the general would affect the scaling of all other elements. The remain-
trend of the gabbroic diorite and the overlying sedimentary ing LILEs, Sr and Ba, are enriched in the gabbroic diorite
rocks. This hints at a chemical overprint of the gabbroic dior- but depleted in the basaltic andesite. The enrichment in the
ite by the overlying basaltic andesite, whereas the Ca in the gabbroic diorite is most probably associated with diffusive
lower part appears to be primary. The spike in τCa at a depth
https://doi.org/10.5194/se-12-1165-2021 Solid Earth, 12, 1165–1184, 20211176 F. Liang et al.: Rock alteration at the post-Variscan nonconformity
carbonate precipitation, which is missing in the basaltic an- diagenesis by comparing the remaining secondary minerals
desite. in the profile with the theoretical weathering products.
In both gabbroic diorite and basaltic andesite, the τ values Due to the chemical composition restriction, rock types
gradually increase from LREEs to HREEs (Fig. 10). This in- that contain only minor amounts of K tend to be weath-
dicates that the depletion degree from LREEs to HREEs de- ered directly by forming smectite and kaolinite instead of
creases during the alteration process if the same conditions illite regardless of the climate (Nesbitt and Young, 1989).
exist. In a study of the weathering of a granodiorite, Nesbitt In our case, both gabbroic diorite and basaltic andesite con-
(1979) showed that REEs are removed by acidic leaching of tain minor K. However, secondary minerals mainly con-
meteoric water which becomes buffered with depth and loses sist of illite which makes metasomatic addition of this ele-
its etching effect due to rising pH. Moreover, Nesbitt (1979) ment during burial diagenesis highly probable (Fedo et al.,
proposed that the fractionation of LREEs and HREEs may be 1995). As discussed in Sect. 5.2, K metasomatism is possi-
controlled by the mineral type. Kaolinite and illite are favor- bly promoted by hydrothermal fluids. According to the A–
able for LREEs, whereas vermiculite, Fe–Ti oxyhydroxides, CN–K diagram (Fig. 11), the initial weathering products of
relict hornblende and biotite are more favorable for HREEs. the gabbroic diorite should have mainly consisted of smec-
In our study, the decreasing depletion degree from LREEs to tite, and a small quantity of kaolinite is expected in the top
HREEs in both weathering profiles also indicates that LREEs part (20.6–21.5 m). For the basaltic andesite (13.9 m), kaoli-
are more mobile than HREEs in the same acid weathering nite with a small portion of smectite is expected, whereas
environment. Moreover, REE fractionation of the gabbroic smectite should be dominant in the lower part. ESEM (en-
diorite is less systematic from the top down compared with vironment scanning electron microscopy) indicated kaolin-
the basaltic andesite (Fig. 10b). By comparison with rock ite in two morphologies: vermiform (Fig. 2h) and booklet
textures, we assume that this is due to physical fracturing and form (Fig. 2i). According to Chen et al. (2001) and Erkoyun
more heterogeneous chemical alteration in the basement. The and Kadir (2011), vermiform kaolinite is favored during the
strongly depleted samples at depths of 20.6 and 22.5 m are in situ formation of kaolinite, whereas the euhedral book-
close to fracture zones and possibly more affected by leach- let form is favored during autogenic diagenesis (e.g., Bauluz
ing. In contrast, the enriched samples from depths of 21.5 and et al. (2008). Kaolinite formed by chemical weathering is
23.5 m do not have macro-fractures. This can be explained always more anhedral (Bauluz et al., 2008; Varajao et al.,
by acidic meteoric water that used the pathways provided 2001); therefore, the influence of subrecent surface-related
by the macro-fractures in the topmost part of the gabbroic weathering can be excluded in our case. Based on the XRD
diorite. REEs in the fracture zone were leached, transported results of the gabbroic diorite (Fig. 3), the remaining mineral
downward, and accumulated around the interface of macro- in the topmost part (13.9 m) of the basaltic andesite is I–S,
fracture- and macro-fracture-free zone. This is comparable to which can be explained by the conversion of kaolinite and
the behavior of Ca. smectite into I–S.
The high-field-strength elements (HFSEs), Zr, Nb, Hf, Ta Na and Ca, as needed for the I–S formation, may originate
and Th, are expected to be immobile. In the gabbroic diorite, from the original smectite or from diagenesis fluids. The τ
the τ values scatter significantly for specific elements within values of Na and Ca in the topmost part are −0.99 and −0.93,
single samples. The samples from depths of 21.5 and 23.5 m respectively; therefore, the influence on the CIA and PIA val-
show mostly enriched values as well as Pb and U, which is ues for evaluating the weathering intensity is negligible. The
in line with REEs. Other element shifts appear to be con- remaining secondary mineral in the lower part (14.3–19.3 m)
trolled by heterogeneous conservation and alteration of spe- is illite, which can be explained by the conversion of smectite
cific minerals due to the fractured and granular texture of the into illite. During the conversion from smectite into illite, Ca
rock. The depletion of Pb and U can be well explained by ox- and Na will be further depleted. The depletion of these ele-
idation during weathering into the mobile species Pb6+ and ments will surely increase the CIA and PIA values. Due to
U4+ , respectively, and subsequent leaching by meteoric wa- the higher content of weathering products (smectite), more
ter. In addition, from LILEs to HFSEs, the overall depletion Ca and Na will be lost. The influence on the CIA and PIA
degree decreased in both the basaltic andesite and gabbroic values will also be more evident. Therefore, in this case, due
diorite part during the alteration process. to the low content of original weathering products, the deple-
tion of Ca and Na content should be limited, thereby resulting
5.3 Burial diagenesis and its implications for negligible effects on the CIA and PIA values. Similar to the
weathering intensity evaluation basaltic andesite, in the gabbroic diorite, the first secondary
minerals formed by weathering were predominantly smectite
In addition to correcting the alteration trend, the A–CN–K according to the A–CN–K diagram. During the overprint of
diagram can also be used to kinetically predict the primary diagenesis, the smectite was transformed into I–S in the top-
weathering products of plutonic and volcanic rocks (Nesbitt most part (20.6–21.5 m); in the lower part (22.5–28.5 m), the
and Young, 1984; Panahi et al., 2000). In this case, this con- smectite was all transformed into illite. Hence, the Ca and Na
cept is applied to differentiate surface weathering from burial should be depleted and the CIA and PIA should increase. In
Solid Earth, 12, 1165–1184, 2021 https://doi.org/10.5194/se-12-1165-2021F. Liang et al.: Rock alteration at the post-Variscan nonconformity 1177
Figure 10. τ value features of basaltic andesite (a) and gabbroic diorite (b) in the GA1 well.
the topmost part, this influence should be highest and should
decrease with the decreasing content of the secondary min-
erals towards the lower part. In both basaltic andesite and
gabbroic diorite, the illitization makes K addition from out-
side the system necessary, most probably by fluid migration
through fractures. The smectite resulting from weathering in
the gabbroic diorite would have been altered to pure illite in
the presence of sufficient K. As we observe a high amount
of I–S, the K supply was not sufficient to alter the smec-
tite completely to illite in the topmost part of the gabbroic
diorite (20.6–21.5 m). A similar mineral content pattern also
exists in the basaltic andesite. The illite in the lower part
(14.3–16.3 m) was most probably transformed from smectite.
However, the K supply was not high enough in the topmost
part where I–S and residual kaolinite are dominant (13.9 m)
(Fig. 3).
Figure 11. Theoretical weathering trend during burial diagenesis
(Fedo et al., 1995): “a” is the observed weathering trend for both
basaltic andesite and gabbroic diorite, “b” is the theoretical weath- 5.4 Implications for paleoclimate
ering trend for basaltic andesite, “c” is the K-metasomatism trend of
the topmost basaltic andesite, “d” is the K-metasomatism trend of The occurrence of weathering products, such as illite, smec-
the lower part of basaltic andesite, “e” is the theoretical weathering tite and kaolinite, can be applied as a useful tool to assess the
trend for gabbroic diorite and “f” is the K-metasomatism trend for paleoclimate (Clift et al., 2014; Raucsik and Varga, 2008;
gabbroic diorite. Singer, 1988). However, caution should be used when work-
ing with these parameters as clay minerals may be over-
printed by transformation or neoformation during burial dia-
https://doi.org/10.5194/se-12-1165-2021 Solid Earth, 12, 1165–1184, 20211178 F. Liang et al.: Rock alteration at the post-Variscan nonconformity genesis, and there is also the restriction due to the geochem- tive content of clay mineral types (additional kaolinite in the ical composition of rock type, as discussed in Sect. 5.3. It topmost part), and petrologic features indicate that the cli- follows that, when the clay minerals in the sedimentary rocks mate changed to humid conditions during basalt weathering. are investigated to assess paleoclimatic conditions, the lithol- Moreover, the thin saprolite layer demonstrates that surficial ogy of the source rocks should be considered. In particular, weathering only lasted for a short period and that the basalt for the weathering profile of the igneous rock, all of the in- was rapidly covered by alluvial sediments. volved processes mentioned above will lead to misjudgments As mentioned in Sect. 5.2, the weathering environment for regarding the paleoclimate conditions if working with raw the basaltic andesite was more acidic than for the gabbroic data. Taking this study as an example and interpreting the diorite. The acid present in the weathered profile can be at- original data from XRD and SEM analyses, I–S clay minerals tributed to CO2 input from the atmosphere or organic acids would indicate a subhumid climate with prominent dry sea- produced by vegetation. Based on the drill core profile, vege- sons (Raucsik and Varga, 2008; Singer, 1988). For the deeper tation was undeveloped at the paleo-surfaces on both the gab- parts of both basaltic andesite and gabbroic diorite, the clay broic diorite and basaltic andesite parts. Hence, the increased minerals are dominated by illite, pointing to a cold or dry cli- acid was probably due to an increase in CO2 in the atmo- mate. According to this information, the profile would sug- sphere (Berner, 1992; Neaman et al., 2005), which may also gest that the climate alternated twice from a cold and dry cli- be the reason for the deglaciation event during the Permo- mate to a seasonal and alternating wet and dry climate. How- Carboniferous. ever, due to the limited K availability, the dominant illite in gabbroic diorite and basaltic andesite must be a product of a diagenetic overprint. When correcting the A–CN–K diagram, 6 Scenario for alteration at the post-Variscan the primary weathering product in the topmost part of the nonconformity gabbroic diorite must have been smectite with negligible il- lite and possibly a small quantity of kaolinite (20.6–21.5 m). As the weathering process and the paleoclimate is elucidated, Furthermore, smectite can also not be applied to evaluate the the overall alteration process at the post-Variscan nonconfor- paleoclimatic conditions in this case due to the K limitation mity can be separated into three subsequent steps (Figs. 12– of the lithology. 14). Approximately at the Carboniferous–Permian boundary, Although the CIA and PIA values may be misleading the gabbroic diorite was firstly weathered under relatively sometimes, they display the alteration intensity of the gab- arid conditions. This included fracturing by physical weath- broic diorite well, with much higher values in the topmost ering and moderate chemical weathering. Plagioclase was part (20.6–21.5 m). However, a related tendency of HFSEs is transformed to smectite with negligible illite (Fig. 12, Eqs. 1– nonexistent (Fig. 6b). Due to leaching, these immobile ele- 2). Other minerals such as amphibole and biotite were weath- ments are expected to become indirectly enriched, which is ered to smectite and chlorite accompanied by the generation not observed. HFSE values and τ values of representative of hematite and vermiculite (Fig. 12, Eqs. 3–5). With the be- LILEs, such as Na and Sr, show a positive correlation with ginning of volcanism in the early Permian, the nonconfor- porosity data, which suggests that the intensity of the leach- mity was concealed by the basaltic andesite lava flow, which ing process was more dominated by the porosity formed by underwent a short but intense period of chemical weathering. intense physical weathering than by other factors, such as the Firstly, pyroxene and plagioclase were weathered to vermi- climate shifting to more humid conditions. culite and smectite (Fig. 13, Eqs. 6–7). Thereafter, more hu- Correction of the A–CN–K diagram for the basaltic an- mid conditions initiated increased leaching and smectite was desite section suggests that primary products of the altered transformed to kaolinite (Fig. 13, Eq. 8). During these two basaltic andesite were dominated by kaolinite in the topmost stages, elements such as Na, Ca and K were depleted from part (13.9 m) and mainly by smectite in the lower part. Again, the system, either by export or descendent enrichment in the smectite cannot be applied as a climate parameter due to the profile. After a relatively short time interval, the basalt was restriction of the K content in basaltic andesite. Similar to the concealed by sediments and the weathering process termi- gabbroic diorite section, the CIA and PIA values, the min- nated. During burial diagenesis, fluids transformed smectite eral abundances and the petrographic features significantly and kaolinite into illite in both gabbroic diorite and basaltic change between the topmost part (13.9 m) and the lower part andesite (Fig. 13, Eqs. 9–10). The transformation of smec- (14.3–19.3 m). In contrast to the gabbroic diorite, however, tite to illite led to depletion of Ca and Na as well. This the relative content of high-field-strength elements (HFSEs), leaching process is accompanied by the formation of ac- such as Nb, Ta, Zr, Hf and Ti, are all drastically shifted be- cessory minerals such as quartz, dolomite, calcite and adu- tween the topmost part (13.9 m) and the lower part (Fig. 6a). laria (Fig. 14, Eqs. 11–12), which indicate a temperature of The abnormal relative concentrations of these elements in around 200 ◦ C (Stimac et al., 2015). Emplacement of cal- the topmost part indicate more depletion of other relatively citic veins is partly coupled with low-temperature migration more mobile elements, which is confirmed by the τ value of recrystallization quartz (Fig. 2c), which indicates a temper- Na and Ca. All parameters together, i.e., the CIA, PIA, rela- ature of around 300 ◦ C (Stipp et al., 2002). This roughly Solid Earth, 12, 1165–1184, 2021 https://doi.org/10.5194/se-12-1165-2021
You can also read


