Highly time-resolved measurements of element concentrations in PM10 and PM2.5: comparison of Delhi, Beijing, London, and Krakow
←
→
Page content transcription
If your browser does not render page correctly, please read the page content below
Atmos. Chem. Phys., 21, 717–730, 2021
https://doi.org/10.5194/acp-21-717-2021
© Author(s) 2021. This work is distributed under
the Creative Commons Attribution 4.0 License.

Highly time-resolved measurements of element concentrations
in PM10 and PM2.5: comparison of Delhi, Beijing,
London, and Krakow
Pragati Rai1 , Jay G. Slowik1 , Markus Furger1 , Imad El Haddad1 , Suzanne Visser2 , Yandong Tong1 ,
Atinderpal Singh3 , Günther Wehrle1 , Varun Kumar1 , Anna K. Tobler1 , Deepika Bhattu1,a , Liwei Wang1 ,
Dilip Ganguly4 , Neeraj Rastogi3 , Ru-Jin Huang5 , Jaroslaw Necki6 , Junji Cao5 , Sachchida N. Tripathi7 ,
Urs Baltensperger1 , and André S. H. Prévôt1
1 Laboratory  of Atmospheric Chemistry, Paul Scherrer Institute, Forschungsstrasse 111, 5232 Villigen, Switzerland
2 Centre for Environmental Quality, National Institute for Public Health and the Environment,
3720 Bilthoven, the Netherlands
3 Geosciences Division, Physical Research Laboratory, Ahmedabad 380009, India
4 Centre for Atmospheric Sciences, Indian Institute of Technology Delhi, New Delhi 110016, India
5 Key Laboratory of Aerosol Chemistry and Physics, Institute of Earth Environment,

Chinese Academy of Sciences, Xi’an 710075, China
6 Faculty of Physics and Applied Computer Science, Department of Applied Nuclear Physics,

AGH University of Science and Technology, 30059 Krakow, Poland
7 Department of Civil Engineering and Department of Earth Sciences, Indian Institute of Technology Kanpur,

Kanpur, Uttar Pradesh 208016, India
a now at: Department of Civil and Infrastructure Engineering, Indian Institute of Technology Jodhpur,

Jodhpur, Rajasthan 342037, India

Correspondence: Markus Furger (markus.furger@psi.ch), André S. H. Prévôt (andre.prevot@psi.ch),
Sachchida N. Tripathi (snt@iitk.ac.in), Junji Cao (cao@loess.llqg.ac.cn), and Jaroslaw Necki (necki@agh.edu.pl)

Received: 20 June 2020 – Discussion started: 13 July 2020
Revised: 1 December 2020 – Accepted: 7 December 2020 – Published: 19 January 2021

Abstract. We present highly time-resolved (30 to 120 min)          with the last group exhibiting the most site-to-site variabil-
measurements of size-fractionated (PM10 and PM2.5 ) ele-           ity. We demonstrate that the high time resolution and size-
ments in two cities in Asia (Delhi and Beijing) and Europe         segregated elemental dataset can be a powerful tool to assess
(Krakow and London). For most elements, the mean concen-           aerosol composition and sources in urban environments. Our
trations in PM10 and PM2.5 are higher in the Asian cities          results highlight the need to consider the size distributions of
(up to 24 and 28 times, respectively) than in Krakow and of-       toxic elements, diurnal patterns of targeted emissions, and lo-
ten higher in Delhi than in Beijing. Among European cities,        cal vs. regional effects in formulating effective environmen-
Krakow shows higher elemental concentrations (up to 20 and         tal policies to protect public health.
27 times, respectively) than London. Hourly maximum con-
centrations of Pb and Zn reach up to 1 µg m−3 in Delhi, sub-
stantially higher than at the other sites. The enrichment factor
of an element together with the size distribution allows for a     1   Introduction
rough classification of elements by major source. We define
five groups: (1) dust emissions, (2) non-exhaust traffic emis-     The percentage of the global population living in urban areas
sions, (3) solid fuel combustion, (4) mixed traffic/industrial     with more than 1 million inhabitants has been steadily in-
emissions, and (5) industrial/coal/waste burning emissions,        creasing over the last decades (Krzyzanowski et al., 2014).

Published by Copernicus Publications on behalf of the European Geosciences Union.
718                                              P. Rai et al.: Highly time-resolved measurements of element concentrations

Air pollution in these cities is a major contributor to the         2     Materials and methods
global disease burden (Lim et al., 2012), with more than 96 %
of the population in these cities exposed to PM2.5 (particulate     2.1    Description of the sampling sites
matter with an aerodynamic diameter below 2.5 µm) concen-
tration above World Health Organization (WHO) air qual-             The sampling site (40.00◦ N, 116.38◦ E) in Beijing was lo-
ity standards (Krzyzanowski et al., 2014). Smaller particles        cated in a residential area north of the urban core, near the
are likely more toxic since they can penetrate deep into the        Olympic Park, without any nearby industrial sources. It is a
lungs (Miller et al., 1979). Particle toxicity depends also on      typical urban site in the central zone of Beijing. It is located
PM composition (Kelly and Fussell, 2012), with identified           approximately 1.2 km away from the west 3rd Ring Road
toxic constituents including elemental and organic carbon           and 2.7 km away from the north 2nd Ring Road. Both ring
and metals. Transition metals such as Fe, V, Ni, CrVI , Cu, and     roads are characterized by heavy traffic. Coal-based heat-
Zn are of particular concern due to their potential to produce      ing is a major sector of coal consumption in northern China
reactive oxygen species (ROS) in biological tissue (Manke et        (Tian et al., 2015). The measurements were performed from
al., 2013). Moreover, metals such as Pb and Cd and the met-         6 November to 12 December 2017.
alloid As accumulate in body tissue and contribute to many             The sampling site (50.06◦ N, 19.91◦ E) in Krakow was lo-
adverse health effects, such as lung cancer, cognitive deficits,    cated in a residential area close to the city center. The major
and hearing impairment (Jaishankar et al., 2014). Elements          local sources of pollution are municipal emissions, combus-
are also recognized as effective markers for source apportion-      tion, industry, and traffic. Traffic in the city is dense with
ment (SA), especially for anthropogenic emissions in urban          frequent traffic jams (∼ 1 km away from sampling location).
areas (e.g., traffic, industry, and power production). Emis-        Factories (steel and nonferrous metallurgical industries) are
sions from these sources vary on timescales of a few hours or       located at a distance of about 10 km from the sampling site.
less, and such rapid changes cannot be resolved by conven-          Additionally, a coal power plant is located in the southern
tional 24 h filter measurements. The vast majority of elemen-       area of the city. Moreover, a zinc ore industry source is sit-
tal SA studies in the literature are limited by the time resolu-    uated about 50 km to the north of the city. The sources with
tion of the input samples (Dall’Osto et al., 2013; Pant and         the highest PM emission rates are situated in the northeast-
Harrison, 2012). Highly time-resolved and size-segregated           ern part of Krakow, i.e., Huta Arcelor Mittal steel works, the
measurements are thus required for the determination of el-         Cementownia cement factory, and the EC Krakow coal-fired
emental PM sources and health effects within urban areas            power plant (Junninen et al., 2009). However, in Krakow,
under varying meteorological conditions.                            there are numerous small coal-fired low-efficiency boilers
   Efforts in European and Asian countries to tackle poor air       (LE boilers) distributed over the city. The measurements
quality include the EURO norms (EEA, 2018) in European              were performed from 11 to 23 October 2018. It is important
cities to control vehicular emissions, odd–even traffic reg-        to note that the sampling period in Krakow is different from
ulations in Delhi (Kumar et al., 2017) and Beijing (An et           the rest of the sites.
al., 2019), and the “Stop Smog” program in Poland (Shah,               The Delhi sampling location (28.54◦ N, 77.19◦ E) was
2018). In addition, strict emission control measures were im-       situated in a residential and commercial area in the south
plemented in China (Gao et al., 2016) in September 2013,            part of Delhi. Roads with heavy traffic within 2–5 km sur-
by lowering the fraction of coal in energy production from          round the sampling location in all directions. Many anthro-
24 % in 2012 to 10 % in 2017. Evaluation and optimization           pogenic sources, such as traffic, agricultural residue burn-
of such programs require elucidation of the sources and pro-        ing, waste burning, and a coal-based power plant, and var-
cesses governing PM abundance and composition. This re-             ious micro-, small-, and medium-scale manufacturing and
mains challenging and may strongly differ from site to site         processing units, such as metal processing, electroplating,
depending on local environmental conditions. To assess this,        and paint and chemical manufacturing for the pretreatment
we present high time resolution PM10 and PM2.5 metal and            of metals, might contribute to the low air quality of this re-
trace element concentrations in four Asian and European             gion. However, the coal-based power plant in the southeast
cities: Delhi, Beijing, Krakow, and London. A simple con-           direction (18 km) was shut down in October 2018, although
ceptual framework allows for the characterization of major          emission of fly ash continued during the study period. The
sources, site-to-site similarities, and local differences and the   measurements were performed from 15 January to 9 Febru-
identification of key information required for efficient pol-       ary 2019.
icy development. Moreover, when the aim of the analysis is             The London sampling location (51.52◦ N, 0.21◦ W), clas-
not to obtain quantitative information, this method is proved       sified as having an urban background, was within a school
particularly useful since it does not require a full SA anal-       ground in a residential area of North Kensington (NK). Long-
ysis (presented elsewhere for London and Delhi; Visser et           term measurements of air pollutants at NK have been de-
al., 2015a; Rai et al., 2020), which is complex and time-           scribed in detail in a previous study (Bigi and Harrison, 2010)
consuming, and which can be challenging to compare across           and are considered as being representative of the background
sites due to differences in source definitions.                     air quality for most of London. NK is situated within a heavy

Atmos. Chem. Phys., 21, 717–730, 2021                                                  https://doi.org/10.5194/acp-21-717-2021
P. Rai et al.: Highly time-resolved measurements of element concentrations                                                   719

traffic suburban area of London. The measurements were            son’s R of 0.91 (Delhi) and 0.96 (Beijing) for S vs. sulfate,
performed from 6 January to 11 February 2012.                     and 0.98 (Delhi) and 0.97 (Beijing) for Cl vs. chloride. The
                                                                  correlation resulted in a slope of 1.13 (Delhi) and 1.23 (Bei-
2.2   Instrumentation                                             jing) for sulfate and 1.03 (Delhi) and 1.9 (Beijing) for Cl.
                                                                  The S measurements of the two instruments agree within the
In Beijing, Delhi, and Krakow, sampling and analysis were         typical uncertainties of such measurements (∼ 25 %; Cana-
conducted with an Xact 625i® Ambient Metals Monitor               garatna et al., 2007; Furger et al., 2017). In addition, the
(Cooper Environmental, Tigard, OR, USA) with an alternat-         Delhi measurements cover different size fractions (PM2.5 for
ing PM10 and PM2.5 inlet switching system (Furger et al.,         the Xact vs. PM1 for the AMS).
2020). Details of the Xact can be found in previous studies          The Xact/AMS ratio for Cl observed in Beijing likely oc-
(Cooper et al., 2010; Furger et al., 2017; Rai et al., 2020;      curs because the relative ionization efficiency for AMS mea-
Tremper et al., 2018). The field measurements with the Xact       surements of Cl was not determined in Beijing (whereas cal-
were performed with 1 h time resolution in Beijing and 0.5 h      ibrations with NH4 Cl were performed in Delhi). In addition,
time resolution in Krakow and Delhi. The instrument was           the Beijing measurements likely have a higher fraction of
able to detect 34 elements (Al, Si, P, S, Cl, K, Ca, Ti, V, Cr,   other forms of Cl (e.g., ZnCl2 , PbCl2 , FeCl3 ), which are not
Mn, Fe, Co, Ni, Cu, Zn, Ga, Ge, As, Se, Br, Rb, Sr, Y, Zr, Cd,    efficiently detected in standard AMS operation. High Cl con-
In, Sn, Sb, Ba, Hg, Tl, Pb, and Bi). However, some of the el-     centrations from November to March in Beijing are reported
ements were below the minimum detection limit (MDL) of            in previous studies, which are believed to be associated with
the instrument (Table S1) for certain periods of time. There-     coal burning (Yao et al., 2002; Zhang et al., 2019). The con-
fore, we discarded the elements that were below the MDL in        tribution from sea salt particles is less important because the
PM10 and PM2.5 ≥ 80 % of the time.                                sampling site in Beijing is about 200 km from the sea. How-
   In London, we deployed a rotating drum impactor (RDI)          ever, the sea and/or road salt discussion would be strength-
which sampled the following with 2 h time resolution in           ened by the measurement of Na, which is an important tracer
size-segregated stages: PM10−2.5 (coarse), PM2.5−1.0 (in-         of sea and road salt in the form of NaCl. While Na and Cl are
termediate) and PM1.0−0.3 (fine). Trace element composi-          good tracers for sea and road salt, the Cl/Na ratio in Beijing
tion of the RDI samples was determined by synchrotron-            during winter is reported to be much higher (2.3) than the
radiation-induced X-ray fluorescence spectrometry (SR-            ratio in seawater (1.17; Yao et al., 2002).
XRF) at the X05DA beamline (Flechsig et al., 2009)
at the Swiss Light Source (SLS), Paul Scherrer Institute          2.3   Crustal enrichment factor (EF) analysis
(PSI), Villigen PSI, Switzerland, and at Beamline L at
the Hamburger Synchrotronstrahlungslabor (HASYLAB),               EF analysis was applied to determine the enrichment of a
Deutsches Elektronen-Synchrotron (DESY), Hamburg, Ger-            given element relative to its abundance in the upper conti-
many (beamline dismantled in November 2012). In total 25          nental crust (UCC). For this analysis Ti (Fomba et al., 2013;
elements were quantified (Na, Mg, Al, Si, P, S, Cl, K, Ca,        Majewski and Rogula-Kozłowska, 2016; Wei et al., 1999)
Ti, V, Cr, Mn, Fe, Ni, Cu, Zn, Br, Sr, Zr, Mo, Sn, Sb, Ba,        was selected as the reference element due to its stable and
and Pb). Details of the RDI-SR-XRF analysis were described        spatially homogenous characteristics in the soil. The com-
in previous studies (Bukowiecki et al., 2008; Richard et al.,     pilation of UCC (Rudnik and Gao, 2014) was used to cal-
2010; Visser et al., 2015b). Due to the RDI’s omission of         culate EFs and crustal contributions in elemental concentra-
particles smaller than 300 nm, the fine-mode elemental data       tions. For an element (X) in a sample, the EF relative to Ti is
for London are less reliable as compared to the other sites.      given as
While the comparison of size-resolved London data with the
other sites should therefore be interpreted with caution, we              X Ti Sample
                                                                  EF =               .                                     (1)
present London PM2.5 /PM10 ratios, group classification (in                X Ti Crust
PM10 and PM2.5 ), and their diurnal patterns (in PM2.5 and
coarse (PM10 −PM2.5 )) in the Supplement (Figs. S4, S5, and       The unexpectedly low EFs observed for Si (0.41–0.45)
S8, respectively).                                                and compared to previous studies (Majewski and Rogula-
   Xact measurements of Cl and S were compared to the             Kozłowska, 2016; Tao et al., 2013) are likely due to self-
chloride and sulfate data obtained from co-located aerosol        attenuation issues in XRF analysis for lighter elements
mass spectrometer (AMS) measurements (Fig. S1). The               (atomic number < 19), which may cause underestimation in
AMS instruments consisted of a high-resolution long-time-         their concentrations (Maenhaut et al., 2011; Visser et al.,
of-flight (HR-L-TOF) AMS deployed for online measure-             2015b). Therefore, the measurements of Al and Si from Xact
ments of size-segregated mass spectra of non-refractory           need to be treated with caution. However, low EFs for Si
(NR)-PM2.5 with 2 min resolution in Beijing and a HR-TOF-         is also probably due to crust–air fractionation in the wind-
AMS of NR-PM1 with 2 min resolution in Delhi. The scatter         blown generation of crustal aerosol particles (Rahn, 1976).
plots exhibit a good correlation, which is reflected by a Pear-   Given that Si is the only outlier across all measured ele-

https://doi.org/10.5194/acp-21-717-2021                                              Atmos. Chem. Phys., 21, 717–730, 2021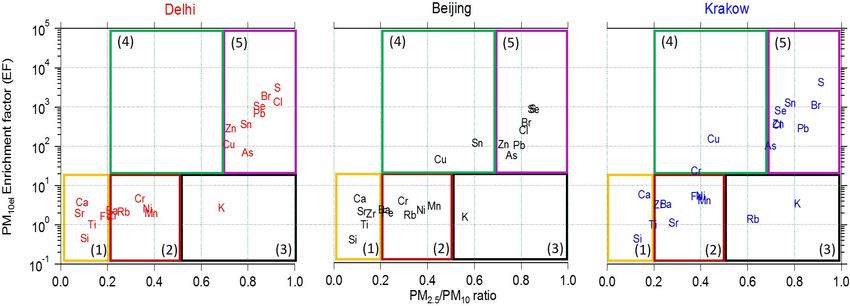
720                                              P. Rai et al.: Highly time-resolved measurements of element concentrations

ments, a major anthropogenic contribution to Ti seems un-           3.2   Characteristic element groups
likely. However, Ti emission is possible from non-exhaust
traffic sources, measured in road dust samples worldwide
(Amato et al., 2009; Pant et al., 2015).                            To evaluate the similarities and differences in element behav-
                                                                    ior across sites, we investigate the PM10 EF for each element,
                                                                    where EFs  1 indicate strong anthropogenic influence, and
3     Results                                                       their corresponding PM2.5 to PM10 ratios. The mass ratio
                                                                    PM2.5 /PM10 for an element gives a rough indication of the
3.1    PM10 el and PM2.5 el concentration
                                                                    particle size distribution that reflects the corresponding emis-
Hourly average elemental PM10 (PM10 el ) and elemental              sion processes and can provide insight into specific sources.
PM2.5 (PM2.5 el ) concentrations were measured, for which           For example, abrasion processes (e.g., mineral dust resuspen-
Fig. 1a and b summarize the results of 18 elements mea-             sion and brake/tire wear) result in coarse particles, whereas
sured at all four sites. Total measured concentrations at           combustion and industrial processes are more likely to emit
Delhi (54 µg m−3 in PM10 ; 32 µg m−3 in PM2.5 ) are 3 times         fine particles.
higher than those at the other sites, followed by Beijing              Figure 2 shows the PM10 EFs as a function of PM2.5 /PM10
(16.7; 5.2 µg m−3 ), Krakow (9; 4.3 µg m−3 ), and London            for all elements measured at Delhi, Beijing, and Krakow
(1.9; 0.9 µg m−3 ; see Fig. S2a for average value statistics).      (see Fig. S5 for London). Each site is shown separately in
Although the measurement periods do not overlap, they were          Fig. 2 and overlaid in Fig. S5. PM10 EFs for all sites and
all performed during the colder months of the year (partially       PM2.5 /PM10 for Delhi, Beijing, and Krakow are shown in
true for Krakow; see Sect. 2.1), and characteristic features of     Figs. 1c and 3 (see Fig. S4 for London together with other
each site are evident. For the four sites, PM10 el diurnal cycles   sites), respectively. In general, EFs increase with increas-
and PM10 el and PM2.5 el time series are shown in Figs. 4 and       ing PM2.5 /PM10 . From Fig. 2, we divide the measured el-
S2b, respectively. The total PM10 el and PM2.5 el concentra-        ements into five groups based on their position in the EF vs.
tions in Delhi show a strong diurnal cycle, with high concen-       PM2.5 /PM10 space; this framework provides insight into ele-
trations overnight and in the early morning hours, followed         ment sources and emission characteristics. The classification
by a sharp decrease during the day (Figs. 4 and S2b). In con-       for London is uncertain due to the lower cutoff issue men-
trast, Beijing experiences multi-day haze events, with only         tioned in Sect. 2.2, but some qualitative agreement with the
minor diurnal cycling (Fig. S3). In Krakow and London, con-         other sites is evident, with the largest differences related to
centrations are mostly elevated during rush hour and during         the PM2.5 /PM10 ratio. Therefore, London is included in the
daytime in general (from 08:00 until 18:00 local time (LT)).        group classification below, although the data are shown in
   At all four sites, Si, Cl, Fe, S, Ca, and K account for          the Supplement for ease of viewing. Figure 4 compares the
> 95 % of PM10 (> 88 % without K) and > 94 % of PM2.5               PM10 diurnal cycles of representative elements from the five
(see Fig. 1b; Tables S2 and S3). Among elements with higher         groups for all four sites normalized to the mean element con-
atomic numbers (Z= 29–82), Zn and Pb are highest at all             centration, while Fig. 5 compares the absolute concentrations
sites except London (where Zn and Cu show the highest con-          of PM2.5 and coarse diurnals for the same elements on a site-
centrations). Figure 1d presents the mean PM10 el concentra-        by-site basis for Delhi, Beijing, and Krakow (see Fig. S8 for
tions normalized to those in Krakow. With rare exceptions,          London). Diurnals of other elements are shown in Figs. S6
element concentrations were highest in Delhi followed by            and S7. The groups are discussed below.
Beijing, Krakow, and London. The concentrations of toxic               Group 1 consists of elements with the lowest EFs and the
PM10 el (Cr, Ni, Fe, Cu, Zn, As and Pb) in Delhi are higher         highest fraction of coarse particles. It includes Ca, Si, and
than at any other site, such as Cr (2 to 9 times), Ni (2 to 8       Ti at all three sites, Sr at Delhi and Beijing, Fe in Delhi,
times), Mn (1 to 16 times), Cu (4 to 13 times), Zn (5 to 95         and Zr in Beijing. Elements associated with this group are
times), and Pb (12 to 205 times). However, the mean concen-         typically of crustal origin, consistent with their position in
trations of carcinogenic elements (Pb, Ni, As, and Cr; IARC,        Fig. 2. In contrast, Zr and Fe have been linked to both brake
2020) fall below the US EPA-recommended inhalation ref-             wear and mineral dust in urban environments (Moreno et al.,
erence concentrations (RfCs) for resident air (200, 20, 15,         2013; Visser et al., 2015b).
and 100 ng m−3 , respectively; USEPA, 2020), except for Pb             Si is selected as the Group 1 representative element. A
in Delhi, which exceeds the RfCs by more than a factor of 2.        strong traffic influence (i.e., rush-hour peaks) on PM10 is ev-
Individual exceedances of the RfCs are relatively common in         ident at London, Krakow, and Delhi, while a much flatter
Delhi for Pb (52.8 % of data) and As (34 %), indicating se-         diurnal pattern with only small rush-hour effects is evident
vere risks to human health. At other sites, RfC exceedances         in Beijing (Fig. 4). PM2.5 concentrations are very low and
are less common, comprising only 10 % of As data in Bei-            in general not significant relative to PM10 (Fig. 5). These
jing, and 1.76 % of Cr and 1.4 % of Ni in Krakow; no other          diurnal patterns are consistent with vehicle-induced resus-
RfC exceedances are observed.                                       pension of the dust deposited on the road surface, which in
                                                                    turn derives mostly from road abrasion, vehicle abrasion, and

Atmos. Chem. Phys., 21, 717–730, 2021                                                  https://doi.org/10.5194/acp-21-717-2021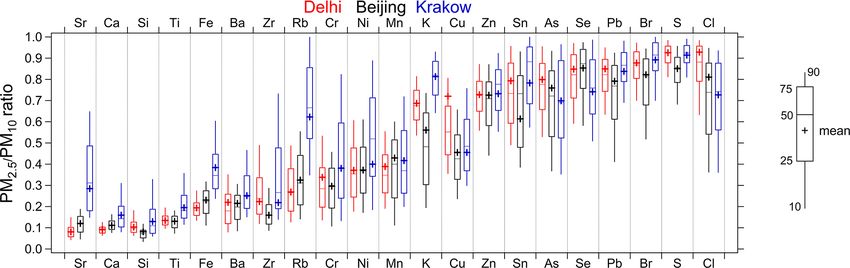
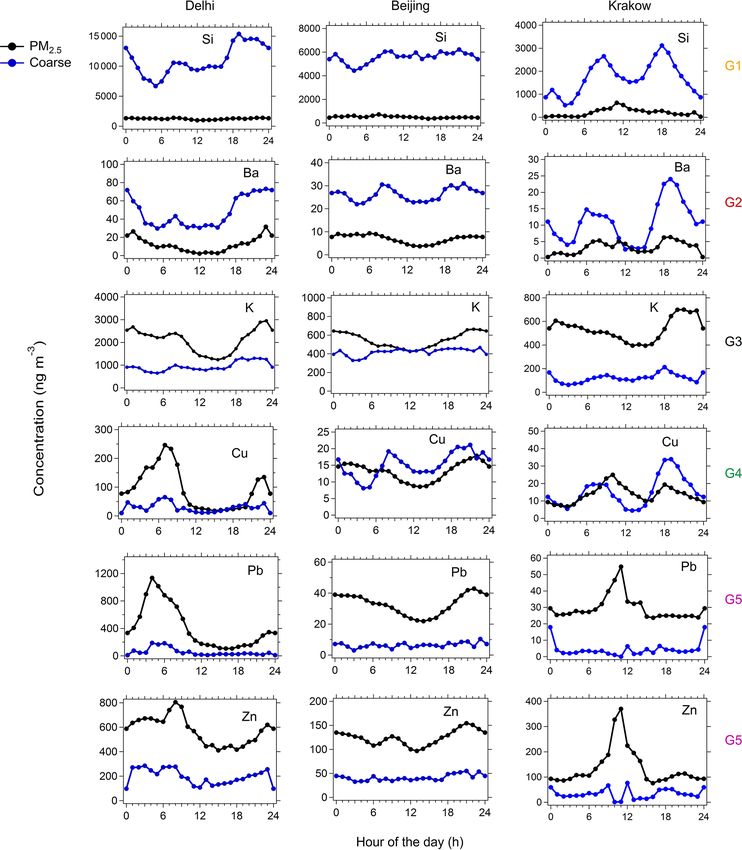
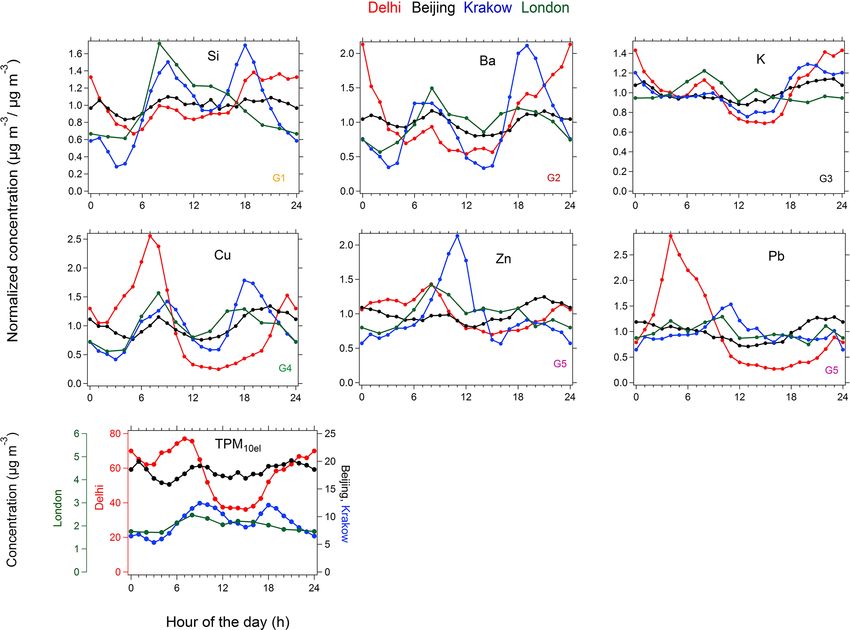
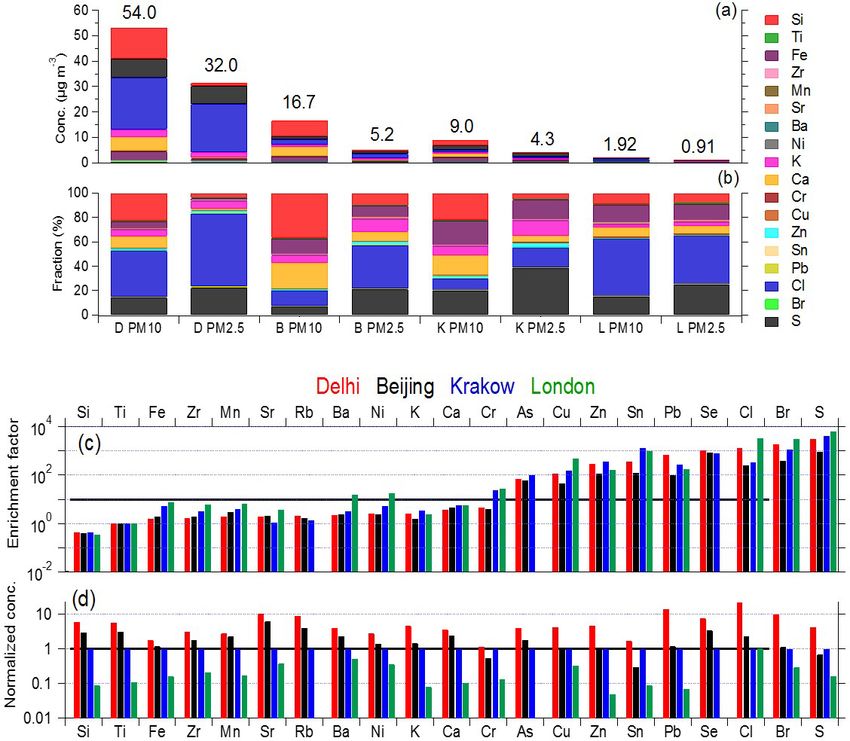
P. Rai et al.: Highly time-resolved measurements of element concentrations                                                            721

Figure 1. (a) Averaged elemental concentrations and (b) fractions (%) of elements in both size ranges at all four sites: Delhi (D), Beijing
(B), Krakow (K), and London (L). (c) Enrichment factors (using Ti as reference) of the measured elements in PM10 (EF ∼ 10; solid line). (d)
Averaged elemental concentrations in PM10 normalized by those at Krakow. Note that Rb, As, and Se are not included in (a) and (b) because
of absence in the London dataset, while all three are considered in (c) and (d) for the comparison between the rest of the sites.

Figure 2. Classification of the measured elements in five groups for Delhi, Beijing, and Krakow based on their PM10 enrichment factor
(EF) vs. PM2.5 /PM10 values. PM10 EF vs. PM2.5 /PM10 values and PM2.5 EF vs. PM2.5 /PM10 values for all four sites are shown in the
Supplement (Fig. S5).

https://doi.org/10.5194/acp-21-717-2021                                                      Atmos. Chem. Phys., 21, 717–730, 2021
722                                                P. Rai et al.: Highly time-resolved measurements of element concentrations

Figure 3. Box-and-whisker plots of the measured elemental PM2.5 /PM10 ratios at Delhi, Beijing, and Krakow (see Fig. S4 for all four sites).
Box: first to third quartile range; −: median line; +: mean; whiskers: 10 %–90 % percentiles.

Figure 4. Diurnal patterns (means) of selected elements representative of each group (G1: Group 1, G2: Group 2, G3: Group 3, G4: Group 4,
G5: Group 5) in PM10 normalized by the mean values of the elements in PM10 and the total elemental PM10 (in µg m−3 , bottom) at all sites.
Note that due to the time resolution of the original data, the London data are 2 h averages, while the other data are 1 h averages.

airborne dust from construction activities or agricultural soil         Fig. 3. Group 2 includes Ba, Ni, and Mn at all three sites, Rb,
(Thorpe and Harrison, 2008 and references therein).                     Cr, Fe, and Zr at two sites, and Sr at a single site (Fig. 2). Sev-
   Group 2 elements have low EFs but mean PM2.5 /PM10                   eral of these elements are associated with multiple sources,
between 0.22 and 0.43. The increased PM2.5 /PM10                        including coarse traffic emissions such as brake wear (e.g.,
value also corresponds to increased temporal variation in               Ni, Mn, Fe, Ba, and Zr; Bukowiecki et al., 2010; Srimuru-
PM2.5 /PM10 , as shown by the larger interquartile range in             ganandam and Nagendra, 2012; Visser, et al., 2015a) and

Atmos. Chem. Phys., 21, 717–730, 2021                                                        https://doi.org/10.5194/acp-21-717-2021
P. Rai et al.: Highly time-resolved measurements of element concentrations                                                        723

Figure 5. Diurnal variations of elements representative of each group (G1: Group 1, G2: Group 2, G3: Group 3, G4: Group 4, G5: Group 5)
in PM2.5 and coarse size fractions (PM10 −PM2.5 ) at Delhi, Beijing, and Krakow (see Fig. S8 for London).

other anthropogenic sources such as industrial emissions or           ferences are also evident in the Ni diurnals and time series
oil burning (Ni) or crustal material (Fe and Zr).                     (Figs. S6, S7, and S9), as Ni concentrations in Krakow are
   Because of these multiple sources, several Group 2 ele-            driven by strong isolated plumes.
ments show significant site-to-site variation, despite remain-           As an example of a typical Group 2 element, the diur-
ing in or near the group boundaries. For example, Fig. 3              nal patterns of Ba are shown in Figs. 4, 5, and S8. Simi-
shows that Ni has a similar lower quartile for PM2.5 /PM10            lar to Group 1, significant rush-hour peaks are evident, al-
across all sites, while the upper quartile is much higher at          though the trend is now also reflected in PM2.5 . In the Asian
Krakow. This is likely due to the strong influence of local           cities, high concentrations are also observed overnight. This
steel and nonferrous metallurgical industries (Samek et al.,          is likely related to heavy-duty vehicular activities, which in
2017a, b), whereas the other sites are more strongly influ-           these cities occur predominantly at night due to their ban dur-
enced by non-exhaust emissions and dust (Grigoratos and               ing peak traffic hours (07:30–11:00 and 17:00–22:00 LT and
Martini, 2015; Pant and Harrison, 2012; Yu, 2013). Such dif-          less dominant during daytime) in Delhi (Rai et al., 2020) and

https://doi.org/10.5194/acp-21-717-2021                                                   Atmos. Chem. Phys., 21, 717–730, 2021
724                                              P. Rai et al.: Highly time-resolved measurements of element concentrations

the entire day in Beijing (Zheng et al., 2015). As both non-           The diurnal patterns of Cu are shown in Figs. 4, 5, and
exhaust traffic emissions (i.e., brake wear and dust resuspen-      S8. London, Beijing, and Krakow all show peaks during the
sion) are related to traffic activity, the time series of most      morning and evening rush hours, mainly due to the PM10
elements in Groups 1 and 2 are relatively well correlated,          fraction. In Krakow, PM2.5 is approximately correlated with
although not as tightly as the Group 1 elements are among           the coarse fraction, although the morning peak appears ∼ 2 h
themselves due to their common source. This is illustrated in       later, while in Beijing PM2.5 Cu is instead elevated at night.
the correlation matrices shown in Fig. S10, where elements          Delhi contrasts sharply with the other sites, which probably
are sorted by group along each axis. Group 2 elements are           is the reason why Cu in Delhi is not categorized in Group 4.
also relatively well correlated among themselves at all sites,      Figure 3 shows that the PM2.5 /PM10 medians and quartiles
with the exception of Ni at Krakow for the reasons discussed        are similar, but the mean (0.72 in Delhi and 0.46 in Bei-
above.                                                              jing and Krakow) is substantially higher in Delhi because
   Group 3 includes K at all three sites and adds Rb at             the Cu time series (Fig. S11) is subject to a series of high-
Krakow (Fig. 2). These elements show low EFs and high               intensity PM2.5 plumes from local industries and/or waste
PM2.5 /PM10 , although uncertainties are high for Rb at             burning. These plumes are tightly correlated with those of
Krakow given that 86 % and 65 % data points in PM2.5 and            Cd, suggesting emissions from Cd–copper alloy manufac-
PM10 , respectively, are below the MDL. Although coarse-            turing plants (Vincent and Passant, 2006), electronic waste
mode K can result from sea/road salt (Gupta et al., 2012;           burning (Rai et al., 2020; Owoade et al., 2015), and/or steel
Zhao et al., 2015) and mineral/road dust (Rahman et al.,            metallurgy (Tauler et al., 2009).
2011; Rogula-Kozłowska, 2016; Viana et al., 2008), the high            Group 5 elements have both the highest EF and high-
fraction of K observed in the fine mode suggests solid fuel         est PM2.5 /PM10 values. Similar to Groups 1–4, Group 5 in-
(coal and wood) burning as a larger source (Cheng et al.,           cludes elements that are directly emitted in the particle phase
2015; Pant and Harrison, 2012; Rogula-Kozłowska, et al.,            (elements mainly present in primary components) but differs
2012; Rogula-Kozłowska, 2016; Viana et al., 2013; Waked et          by also including elements for which the major fraction is
al., 2014). Further, Delhi, Beijing, and Krakow are far from        likely emitted as gases and converted via atmospheric pro-
the ocean, and de-icing salt was not used on the roads dur-         cessing to lower volatility products, which partition to the
ing the measurement periods. In London and Delhi, K was             particle phase (elements mainly present in secondary com-
attributed to solid fuel combustion via SA studies (Rai et al.,     ponents; Seinfeld and Pandis, 2006). Primary component ele-
2020; Visser et al., 2015a). The diurnals in Delhi and Krakow       ments include As, Zn, Se, and Pb (Liu et al., 2017) at all three
show elevated values in the evening (Fig. 4), which is like-        sites, Sn at Delhi and Krakow, and Cu in Delhi, while sec-
wise consistent with solid fuel combustion for domestic heat-       ondary component elements comprise Cl, Br, and S (Zhang
ing. However, in Beijing only PM2.5 exhibits such a diurnal         et al., 2013) at all three sites. Although Cl and Br can in prin-
variation (Fig. 5), whereas the PM10 fraction is similar to the     ciple relate to primary emission of sea or road salt, this is un-
other sites without a clear diurnal variation (Fig. 4). This cor-   likely for the sites studied (except London) due to the large
responds to a wider spread of PM2.5 /PM10 at Beijing (with          distance from the sea, strong and regular diurnal patterns in-
the lower quartile approaching values typical of Group 1),          versely related to temperature, and correlation with elements
suggesting a larger contribution from dust.                         characteristic of coal combustion and industrial emissions. In
   Group 4 has somewhat higher EFs than Groups 1–3 and              London, a major fraction of Cl was attributed to sea/road salt
moderate PM2.5 /PM10 . The group contains Cu at Beijing and         (Visser et al., 2015a). Further, Xact S and Cl measurements
Krakow, as well as Sn at Beijing and Cr at Krakow. No ele-          show a strong correlation with AMS-derived non-refractory
ments are assigned to this group in Delhi, although Cu is near      SO2−           −
                                                                        4 and Cl , respectively, which is nearly insensitive to
the border. The EFs of these elements are  100 in PM2.5            Cl from sea/road salt Cl (see Sect. 2.2). The PM2.5 /PM10 of
and > 10 in PM10 (Fig. S5), indicating strong anthropogenic         these elements is among the highest recorded, with the partial
influence. The Group 4 elements are typically emitted from          exception of Cl, which is probably due to fact that secondary
both traffic (characteristic of Group 2) and industrial or waste    aerosol condensation is driven by surface area rather than
combustion sources (Group 5), and their position in Fig. 2          volume. In Delhi, Cl PM2.5 /PM10 values are high, consis-
reflects the combination of these different sources. For ex-        tent with a high fraction of NH4 Cl. However, the interquartile
ample, Cu derives from brake wear in Europe (Thorpe and             range of Cl PM2.5 /PM10 at Beijing and Krakow is quite wide
Harrison, 2008; Visser et al., 2015a) and Asia (Iijima et al.,      (0.5 to 0.9), with the lower values approximately matching
2007), while Cu and Sn are also emitted from industry or            those of Zn and Pb and suggesting that primary emissions of
waste burning (Chang et al., 2018; Das et al., 2015; Fomba et       ZnCl2 and PbCl2 are not negligible at these sites.
al., 2014; Kumar et al., 2015; Venter et al., 2017). Cr has also       The primary component elements of Group 5 are strongly
been found in the emissions from both traffic (Hjortenkrans         linked to various industries and combustion of non-wood fu-
et al., 2007; Thorpe and Harrison, 2008) and oil burning in         els. Pb was found to be present in very high concentrations
Krakow (Samek et al., 2017a).                                       in Delhi with episodic peaks, and possible sources include
                                                                    industrial emissions (Sahu et al., 2011), waste incineration

Atmos. Chem. Phys., 21, 717–730, 2021                                                  https://doi.org/10.5194/acp-21-717-2021
P. Rai et al.: Highly time-resolved measurements of element concentrations 725 (Kumar et al., 2018), and small-scale Pb battery recycling 4 Discussion and conclusions units (Prakash et al., 2017). Additionally, burning of plastic and electronic waste can contribute to Pb in Delhi. Zn and The broad intercontinental comparison presented here As are emitted from a variety of sources, including indus- demonstrates both the large degree of similarity and crucial tries, refuse burning/incineration, and coal combustion, but local differences in the PMel concentration and composition Zn is also emitted from traffic and wood burning. In Beijing in European and Asian cities. The combination of PM10 el and Krakow, coal burning from coal power plants (Samek, EF and PM2.5 /PM10 provides a robust and useful frame- 2012; Yu, 2013), domestic heating, and iron and steel indus- work for categorizing elements and assessing site-to-site dif- tries (Samek et al., 2018; Yang et al., 2013) are major sources ferences. Five groups are identified based on these metrics of Zn, Se, As, and Pb. Cu and Sn also have industrial sources, (see Fig. 2), with Groups 1–3 having low EFs with increas- as discussed in connection with Group 4. ing PM2.5 /PM10 and Groups 4–5 having high EFs with in- The set of potential sources discussed above for the creasing PM2.5 /PM10 . Broadly, Group 1 is related to crustal primary Group 5 elements is complex and highly site- materials and road dust, Group 2 to non-exhaust traffic emis- dependent, which corresponds to the significant differences sions, Group 3 to biomass combustion, Group 4 to mixed in- between sites evident in the Group 5 correlation matrices dustrial/traffic emissions, and Group 5 to industrial emissions (Fig. S10). In Beijing, Pb, Zn, Cl, Br, Se, and S are all tightly and coal/waste burning. On an element-by-element basis, the correlated, consistent with coal burning emissions. Similar group composition remains relatively consistent across sites, correlations are observed in Krakow, with the exception of although some reassignment of elements occurs depending Zn and Pb, which are rather correlated with each other, as on local sources and conditions. Interestingly, we observe well as Mn and Fe. The Zn and Pb time series in Krakow systematic shifts within the EF vs. PM2.5 /PM10 space only contain high-intensity plumes (Fig. S12), with a strong peak for Group 5 (and perhaps in the sparsely populated Group 4) at ∼ 11:00 LT in PM2.5 (Figs. 4 and 5), suggesting industrial but not in Groups 2 or 3, despite these groups also being dom- emissions (Logiewa et al., 2020). The correlation pattern in inated by anthropogenic sources. Delhi is more complex than at the other sites, with several However, the consistent classification of elements into a pairs of tightly correlated elements (e.g., Br and Cl; Se and particular group regardless of site does not imply that the S) but few larger groupings. This suggests plumes from a va- temporal behavior of these elements is independent of local riety of point sources rather than a regionally homogeneous conditions or policies. For example, the stagnant meteoro- composition. logical conditions frequently encountered in Beijing during The location-specific influences on primary component el- the colder season suppress diurnal variation regardless of el- ements in Group 5 are also evident in the diurnal patterns. ement source, while the multitude of strongly emitting point For example, as shown in Fig. 4, the diurnal pattern of Pb sources yielding individual plumes in Delhi, coupled with is relatively flat in Beijing with a slight rise in the evening, rapid dilution as the boundary layer rises, leads to systematic, peaks at approximately 08:00–10:00 LT in London, peaks intense pre-sunrise peaks in concentration but with a compo- at ∼ 11:00 LT with a tail extending into the afternoon in sition that strongly varies on a day-to-day basis. The effects Krakow, and has a strong diurnal cycle with a massive pre- of air quality policy are also evident, as the night / day con- dawn peak in Delhi. Site-to-site differences are also evident centration ratios of resuspension-related elements (crustal in the location of the elements within the Group 5 box in material, road dust, and non-exhaust traffic emissions) are Fig. 2 (and Fig. S5). Systematic shifts are evident between significantly higher in Delhi and Beijing than in Krakow and Beijing (elements clustered to the lower left), Delhi (ele- London, due to time restrictions on heavy-duty truck activity ments clustered to the upper right; note that two of the el- in the Asian cities. ements in the lower left are Cu and Zn, which require a sig- The diurnal patterns of the total PM10 el concentrations nificant shift towards the upper right to even be included (Fig. 4) reflect many of the trends discussed above. Mete- in Group 5), and Krakow (intermediate). It is important to orological conditions yield a relatively flat diurnal pattern note that the y axes in Figs. 2 and S5 have a logarithmic for Beijing, while concentrations are highest overnight and scale, while the x axes have a linear scale, which indicates in the early morning (before rush hour) in Delhi due to the that the graphical vertical shifts represent higher differences combined effects of industrial emissions, burning of various than the same graphical horizontal shifts. The mean (± stan- solid fuels, and a shallow boundary layer. Krakow and Lon- dard deviation) PM10 el EFs for Group 5 elements in Delhi, don instead have their highest PM10 el concentrations during Beijing, and Krakow are 1190 (± 1017), 384 (± 357), and the day, but features related to rush hour are more visible in 1021 (± 1425), respectively. This site-dependent shift con- Krakow, whereas the London diurnals are similar to that of trasts with Groups 1–3, for which no systematic changes are resuspended dust (Visser et al., 2015a). This may reflect dif- evident. Interestingly, this appears to be a feature of industrial ferences in the fleet composition, specifically a higher frac- emissions rather than anthropogenic emissions more gener- tion of older vehicles and vehicles with faulty catalytic con- ally, as it is not evident in the traffic-dominated or biomass- verters or diesel particulate filters in Krakow (Majewski et combustion-dominated groups (Groups 2 and 3). al., 2018). https://doi.org/10.5194/acp-21-717-2021 Atmos. Chem. Phys., 21, 717–730, 2021
726                                                P. Rai et al.: Highly time-resolved measurements of element concentrations

   The global similarities and local differences discussed            Financial support. This research has been supported by the Swiss
above should be considered in air quality policy formulation.         National Science Foundation (grant nos. 200021_162448,
Current practices focus mainly on total PM mass reduction,            200021_169787,       200020_188624,      BSSGI0_155846,     and
neglecting its toxicity. As an example, the carcinogenic ele-         IZLCZ2_169986), the Swiss Federal Office for the Environ-
ments represent a specific health concern. These elements are         ment (FOEN), the National Science Foundation of China (grant
                                                                      no. 21661132005), the SDC Clean Air China Programme (grant
not assigned to a single group by the EF vs. PM2.5 /PM10 val-
                                                                      no. 7F-09802.01.03), the SDC Clean Air Project in India (grant
ues, and the group(s) to which they are assigned do not nec-          no. 7F-10093.01.04), the Department of Biotechnology (DBT),
essarily correlate with total PM10 el . While such policies may       Government of India (grant no. BT/IN/UK/APHH/41/KB/2016-
have significant ancillary benefits, they may not efficiently         17), and the Central Pollution Control Board (CPCB), Government
address the most critical health risks. In addition, the inhal-       of India (AQM/Source apportionment EPC Project/2017).
ability of potential toxins needs consideration; Pb and As
(which are more industry-related) have PM2.5 /PM10 values
that are up to 3 times higher than those of Ni and Cr (which          Review statement. This paper was edited by Willy Maenhaut and
are more traffic-related). If size dependence is not consid-          reviewed by three anonymous referees.
ered, inefficient or ineffective regulatory priorities may re-
sult. Finally, this study demonstrates that regulatory policy
can affect not only overall concentrations but also the timing
of daily maxima (e.g., truck activity restrictions in Delhi and       References
Beijing). The above considerations highlight the importance
of time- and size-resolved measurements for policy formula-           Amato, F., Pandolfi, M., Escrig, A., Querol, X., Alastuey, A.,
tion, as well as the need to integrate these with daily human           Pey, J., Perez, N., and Hopke, P. K.: Quantifying road dust
activities. Although the method proposed in this work allows            resuspension in urban environment by Multilinear Engine:
for a comparison of the characteristics in different cities, a          A comparison with PMF2, Atmos. Environ., 43, 2770–2780,
full SA analysis is necessary if more quantitative informa-             https://doi.org/10.1016/j.atmosenv.2009.02.039, 2009.
tion (e.g., source contributions) is desired.                         An, Z., Huang, R. J., Zhang, R., Tie, X., Li, G., Cao, J., Zhou,
                                                                        W., Shi, Z., Han, Y., Gu, Z., and Ji, Y.: Severe haze in north-
                                                                        ern China: A synergy of anthropogenic emissions and atmo-
                                                                        spheric processes, P. Natl. Acad. Sci. USA, 116, 8657–8666,
Data availability. Data related to this article are available at
                                                                        https://doi.org/10.1073/pnas.1900125116, 2019.
https://doi.org/10.5281/zenodo.4311854 (Rai and Furger, 2020).
                                                                      Bigi, A. and Harrison, R. M.: Analysis of the air pollution climate
                                                                        at a central urban background site, Atmos. Environ., 44, 2004–
                                                                        2012, https://doi.org/10.1016/j.atmosenv.2010.02.028, 2010.
Supplement. The supplement related to this article is available on-   Bukowiecki, N., Lienemann, P., Zwicky, C. N., Furger, M., Richard,
line at: https://doi.org/10.5194/acp-21-717-2021-supplement.            A., Falkenberg, G., Rickers, K., Grolimund, D., Borca, C., Hill,
                                                                        M., Gehrig, R., and Baltensperger, U.: X ray fluorescence spec-
                                                                        trometry for high throughput analysis of atmospheric aerosol
Author contributions. PR and JGS wrote the paper with input from        samples: The benefits of synchrotron X rays, Spectrochim. Acta
all co-authors. PR, MF, DB, YT, VK, AKT, LW, SV, AS, and JN de-         B, 63, 929–938, https://doi.org/10.1016/j.sab.2008.05.006, 2008.
signed the study. GW designed ISS in Xact. YT and ASHP analyzed       Bukowiecki, N., Lienemann, P., Hill, M., Furger, M., Richard, A.,
AMS data. PR analyzed Xact data. SV, MF, and JGS provided of-           Amato, F., Prévôt, A. S. H., Baltensperger, U., Buchmann, B.,
fline data for London. ASHP, JGS, MF, IEH, and UB were involved         and Gehrig, R.: PM10 emission factors for non-exhaust parti-
with the supervision. ASHP, JGS, MF, and UB assisted in the inter-      cles generated by road traffic in an urban street canyon and
pretation of the results.                                               along a freeway in Switzerland, Atmos. Environ., 44, 2330–
                                                                        2340, https://doi.org/10.1016/j.atmosenv.2010.03.039, 2010.
                                                                      Canagaratna, M. R., Jayne, J. T., Jimenez, J. L., Allan, J. D.,
Competing interests. The authors declare that they have no conflict     Alfarra, M. R., Zhang, Q., Onasch, T. B., Drewnick, F., Coe,
of interest.                                                            H., Middlebrook, A., Delia, A., Williams, L. R., Trimborn,
                                                                        A. M., Northway, M. J., DeCarlo, P. F., Kolb, C. E., Davi-
                                                                        dovits, P., and Worsnop, D. R.: Chemical and microphys-
Acknowledgements. We are grateful to Jamie Berg, Krag Petterson,        ical characterization of ambient aerosols with the aerodyne
and Varun Yadav of Cooper Environmental Services for instrument         aerosol mass spectrometer, Mass Spectrom. Rev., 26, 185–222,
troubleshooting during field campaigns. We thank René Richter of        https://doi.org/10.1002/mas.20115, 2007.
PSI for his tremendous support with building the Xact housing and     Chang, Y., Huang, K., Xie, M., Deng, C., Zou, Z., Liu, S., and
inlet switching system.                                                 Zhang, Y.: First long-term and near real-time measurement of
                                                                        trace elements in China’s urban atmosphere: temporal variabil-
                                                                        ity, source apportionment and precipitation effect, Atmos. Chem.
                                                                        Phys., 18, 11793–11812, https://doi.org/10.5194/acp-18-11793-
                                                                        2018, 2018.

Atmos. Chem. Phys., 21, 717–730, 2021                                                     https://doi.org/10.5194/acp-21-717-2021
P. Rai et al.: Highly time-resolved measurements of element concentrations 727 Cheng, Y., Lee, S., Gu, Z., Ho, K., Zhang, Y., Huang, Y., Gupta, I., Salunkhe, A., and Kumar, R.: Source apportion- Chow, J. C., Watson, J. G., Cao, J., and Zhang, R.: PM2.5 ment of PM10 by positive matrix factorization in ur- and PM10−2.5 chemical composition and source apportion- ban area of Mumbai, India, Sci. World J., 2012, 585791, ment near a Hong Kong roadway, Particuology, 18, 96–104, https://doi.org/10.1100/2012/585791, 2012. https://doi.org/10.1016/j.partic.2013.10.003, 2015. Hjortenkrans, D. S. T., Bergback, B. G., and Haggerud, A. V.: Metal Cooper, J. A., Petterson, K., Geiger, A., and Siemers, A.: Guide for emissions from brake linings and tires: Case studies of Stock- developing a multi-metals, fence-line monitoring plan for fugi- holm, Sweden 1995/1998 and 2005, Environ. Sci. Technol., 41, tive emissions using X ray based monitors, Cooper Environmen- 5224–5230, https://doi.org/10.1021/es070198o, 2007. tal Services, Portland, Oregon, available at: https://www3.epa. IARC: Agents classified by the IARC monographs, 1–127, available gov/ttn/emc/prelim/otm31.pdf (last access: 28 October 2020), at: https://monographs.iarc.fr/agents-classified-by-the-iarc/, last 2010. access: 4 July 2020. Dall’Osto, M., Querol, X., Amato, F., Karanasiou, A., Lucarelli, F., Iijima, A., Sato, K., Yano, K., Tago, H., Kato, M., Kimura, H., and Nava, S., Calzolai, G., and Chiari, M.: Hourly elemental con- Furuta, N.: Particle size and composition distribution analysis centrations in PM2.5 aerosols sampled simultaneously at urban of automotive brake abrasion dusts for the evaluation of anti- background and road site during SAPUSS – diurnal variations mony sources of airborne particulate matter, Atmos. Environ., and PMF receptor modelling, Atmos. Chem. Phys., 13, 4375– 41, 4908–4919, https://doi.org/10.1016/j.atmosenv.2007.02.005, 4392, https://doi.org/10.5194/acp-13-4375-2013, 2013. 2007. Das, R., Khezri, B., Srivastava, B., Datta, S., Sikdar, P. K., Jaishankar, M., Tseten, T., Anbalagan, N., Mathew, B. B., Webster, R. D., and Wang, X.: Trace element composi- and Beeregowda, K. N.: Toxicity, mechanism and health ef- tion of PM2.5 and PM10 from Kolkata – a heavily pol- fects of some heavy metals, Interdiscip. Toxicol., 7, 60–72, luted Indian metropolis, Atmos. Pollut. Res., 6, 742–750, https://doi.org/10.2478/intox-2014-0009, 2014. https://doi.org/10.5094/APR.2015.083, 2015. Junninen, H., Monster, J., Rey, M., Cancelinha, J., Douglas, K., EEA: Air quality in Europe, report, Copenhagen, available at: https: Duane, M., Forcina, V., Mueller, A., Lagler, F., Marelli, L., //www.eea.europa.eu/publications/air-quality-in-europe-2018/ Borowiak, A., Niedzialek, J., Paradiz, B., Mira-Salama, D., at_download/file (last access: 5 June 2020), 2018. Jimenez, J., Hansen, U., Astorga, C., Stanczyk, K., Viana, M., Flechsig, U., Jaggi, A., Spielmann, S., Padmore, H. A., and Querol, X., Duvall, R. M., Norris, G. A., Tsakovski, S., Wahlin, MacDowell, A. A.: The optics beamline at the Swiss P., Horak, J., and Larsen, B. R.: Quantifying the impact of res- Light Source, Nucl. Instrum. Meth. A, 609, 281–285, idential heating on the urban air quality in a typical European https://doi.org/10.1016/j.nima.2009.07.092, 2009. coal combustion region, Environ. Sci. Technol., 43, 7964–7970, Fomba, K. W., Müller, K., van Pinxteren, D., and Herrmann, https://doi.org/10.1021/es8032082, 2009. H.: Aerosol size-resolved trace metal composition in remote Kelly, F. J. and Fussell, J. C.: Size, source and chemi- northern tropical Atlantic marine environment: case study cal composition as determinants of toxicity attributable to Cape Verde islands, Atmos. Chem. Phys., 13, 4801–4814, ambient particulate matter, Atmos. Environ., 60, 504–526, https://doi.org/10.5194/acp-13-4801-2013, 2013. https://doi.org/10.1016/j.atmosenv.2012.06.039, 2012. Fomba, K. W., Müller, K., van Pinxteren, D., Poulain, L., van Pinx- Krzyzanowski, M., Apte, J. S., Bonjour, S. P., Brauer, M., teren, M., and Herrmann, H.: Long-term chemical characteri- Cohen, A. J., and Prüss-Ustun, A. M.: Air pollution in zation of tropical and marine aerosols at the Cape Verde At- the megacities, Current Environ. Health Rep., 1, 185–191, mospheric Observatory (CVAO) from 2007 to 2011, Atmos. https://doi.org/10.1007/s40572-014-0019-7, 2014. Chem. Phys., 14, 8883–8904, https://doi.org/10.5194/acp-14- Kumar, P., Gulia, S., Harrison, R. M., and Khare, 8883-2014, 2014. M.: The influence of odd-even car trial on fine and Furger, M., Minguillón, M. C., Yadav, V., Slowik, J. G., Hüglin, C., coarse particles in Delhi, Environ. Pollut., 225, 20–30, Fröhlich, R., Petterson, K., Baltensperger, U., and Prévôt, A. S. https://doi.org/10.1016/j.envpol.2017.03.017, 2017. H.: Elemental composition of ambient aerosols measured with Kumar, S., Aggarwal, S. G., Gupta, P. K., and Kawa- high temporal resolution using an online XRF spectrometer, At- mura, K.: Investigation of the tracers for plastic-enriched mos. Meas. Tech., 10, 2061–2076, https://doi.org/10.5194/amt- waste burning aerosols, Atmos. Environ., 108, 49–58, 10-2061-2017, 2017. https://doi.org/10.1016/j.atmosenv.2015.02.066, 2015. Furger, M., Rai, P., Slowik, J. G., Cao, J., Visser, S., Baltensperger, Kumar, S., Aggarwal, S. G., Sarangi, B., Malherbe, J., Barre, J. U., and Prévôt, A. S. H.: Automated alternating sampling of P. G., Berail, S., Séby, F., and Donard, O. F. X.: Understand- PM10 and PM2.5 with an online XRF spectrometer, Atmos. En- ing the influence of open-waste burning on urban aerosols using viron., 5, 100065, https://doi.org/10.1016/j.aeaoa.2020.100065, metal tracers and lead isotopic composition, Aerosol Air Qual. 2020. Res., 18, 2433–2446, https://doi.org/10.4209/aaqr.2017.11.0510, Gao, W., Tang, G., Ji, D., Liu Z., Song, T., Cheng, M., and Wang, Y.: 2018. Implementation effects and countermeasures of China’s air pol- Lim, S. S., Vos, T., Flaxman, A. D., Danaei, G., Shibuya, K., Adair- lution prevention and control action plan (in Chinese), Res. En- Rohani, H., AlMazroa, M. A., Amann, M., Anderson, H. R., An- viron. Sci., 29, 1567–1574, https://doi.org/10.13198/j.issn.1001- drews, K. G., Aryee, M., Atkinson, C., Bacchus, L. J., Bahalim, 6929.2016.11.01, 2016. A. N., Balakrishnan, K., Balmes, J., Barker-Collo, S., Baxter, Grigoratos, T. and Martini, G.: Brake wear particle emis- A., Bell, M. L., Blore, J. D., Blyth, F., Bonner, C., Borges, G., sions: a review, Environ. Sci. Pollut. R., 22, 2491–2504, Bourne, R., Boussinesq, M., Brauer, M., Brooks, P., Bruce, N. https://doi.org/10.1007/s11356-014-3696-8, 2015. G., Brunekreef, B., Bryan-Hancock, C., Bucello, C., Buchbinder, https://doi.org/10.5194/acp-21-717-2021 Atmos. Chem. Phys., 21, 717–730, 2021
728                                                   P. Rai et al.: Highly time-resolved measurements of element concentrations

  R., Bull, F., Burnett, R. T., Byers, T. E., Calabria, B., Carapetis,    Majewski, G. and Rogula-Kozłowska, W.: The elemental
  J., Carnahan, E., Chafe, Z., Charlson, F., Chen, H., Chen, J. S.,         composition and origin of fine ambient particles in the
  Cheng, A. T.-A., Child, J. C., Cohen, A., Colson, K. E., Cowie,           largest Polish conurbation: first results from the short-
  B. C., Darby, S., Darling, S., Davis, A., Degenhardt, L., Den-            term winter campaign, Theor. Appl. Climatol., 125, 79–92,
  tener, F., Des Jarlais, D. C., Devries, K., Dherani, M., Ding, E.         https://doi.org/10.1007/s00704-015-1494-y, 2016.
  L., Dorsey, E. R., Driscoll, T., Edmond, K., Ali, S. E., Engell, R.     Majewski, G., Rogula-Kozłowska, W., Rozbicka, K., Rogula-
  E., Erwin, P. J., Fahimi, S., Falder, G., Farzadfar, F., Ferrari, A.,     Kopiec, P., Mathews, B., and Brandyk, A.: Concentra-
  Finucane, M. M., Flaxman, S., Fowkes, F. G. R., Freedman, G.,             tion, chemical composition and origin of PM1 : results
  Freeman, M. K., Gakidou, E., Ghosh, S., Giovannucci, E., Gmel,            from the first long-term measurement campaign in War-
  G., Graham, K., Grainger, R., Grant, B., Gunnell, D., Gutier-             saw (Poland), Aerosol Air Qual. Res., 18, 636–654,
  rez, H. R., Hall, W., Hoek, H. W., Hogan, A., Hosgood, H. D.,             https://doi.org/10.4209/aaqr.2017.06.0221, 2018.
  Hoy, D., Hu, H., Hubbell, B. J., Hutchings, S. J., Ibeanusi, S. E.,     Manke, A., Wang, L., and Rojanasakul, Y.: Mechanisms of
  Jacklyn, G. L., Jasrasaria, R., Jonas, J. B., Kan, H., Kanis, J. A.,      nanoparticle-induced oxidative stress and toxicity, Biomed. Res.
  Kassebaum, N., Kawakami, N., Khang, Y.-H., Khatibzadeh, S.,               Int., 2013, 942916, https://doi.org/10.1155/2013/942916, 2013.
  Khoo, J.-P., Kok, C., Laden, F., Lalloo, R., Lan, Q., Lathlean, T.,     Miller, F. J., Gardner, D. E., Graham, J. A., Lee, R. E., Wilson,
  Leasher, J. L., Leigh, J., Li, Y., Lin, J. K., Lipshultz, S. E., Lon-     W. E., and Bachmann, J. D.: Size considerations for establishing
  don, S., Lozano, R., Lu, Y., Mak, J., Malekzadeh, R., Mallinger,          a standard for inhalable particles, J. Air Pollut. Control Assoc.,
  L., Marcenes, W., March, L., Marks, R., Martin, R., McGale, P.,           29, 610–615, https://doi.org/10.1080/00022470.1979.10470831,
  McGrath, J., Mehta, S., Memish, Z. A., Mensah, G. A., Merri-              1979.
  man, T. R., Micha, R., Michaud, C., Mishra, V., Hanafiah, K.            Moreno, T., Karanasiou, A., Amato, F., Lucarelli, F., Nava,
  M., Mokdad, A. A., Morawska, L., Mozaffarian, D., Murphy, T.,             S., Calzolai, G., Chiari, M., Coz, E., Artíñano, B., Lum-
  Naghavi, M., Neal, B., Nelson, P. K., Nolla, J. M., Norman, R.,           breras, J., Borge, R., Boldo, E., Linares, C., Alastuey, A.,
  Olives, C., Omer, S. B., Orchard, J., Osborne, R., Ostro, B., Page,       Querol, X., and Gibbons, W.: Daily and hourly sourcing of
  A., Pandey, K. D., Parry, C. D. H., Passmore, E., Patra, J., Pearce,      metallic and mineral dust in urban air contaminated by traf-
  N., Pelizzari, P. M., Petzold, M., Phillips, M. R., Pope, D., Pope,       fic and coal-burning emissions, Atmos. Environ., 68, 33–44,
  C. A., Powles, J., Rao, M., Razavi, H., Rehfuess, E. A., Rehm, J.         https://doi.org/10.1016/j.atmosenv.2012.11.037, 2013.
  T., Ritz, B., Rivara, F. P., Roberts, T., Robinson, C., Rodriguez-      Owoade, K. O., Hopke, P. K., Olise, F. S., Ogundele, L. T., Fawole,
  Portales, J. A., Romieu, I., Room, R., Rosenfeld, L. C., Roy, A.,         O. G., Olaniyi, B. H., Jegede, O. O., Ayoola, M. A., and Bashiru,
  Rushton, L., Salomon, J. A., Sampson, U., Sanchez-Riera, L.,              M. I.: Chemical compositions and source identification of partic-
  Sanman, E., Sapkota, A., Seedat, S., Shi, P., Shield, K., Shivakoti,      ulate matter (PM2.5 and PM2.5−10 ) from a scrap iron and steel
  R., Singh, G. M., Sleet, D. A., Smith, E., Smith, K. R., Stapel-          smelting industry along the Ife-Ibadan highway, Nigeria, Atmos.
  berg, N. J. C., Steenland, K., Stöckl, H., Stovner, L. J., Straif,        Pollut. Res., 6, 107–119, https://doi.org/10.5094/APR.2015.013,
  K., Straney, L., Thurston, G. D., Tran, J. H., Van Dingenen, R.,          2015.
  van Donkelaar, A., Veerman, J. L., Vijayakumar, L., Weintraub,          Pant, P. and Harrison, R. M.: Critical review of receptor modelling
  R., Weissman, M. M., White, R. A., Whiteford, H., Wiersma, S.             for particulate matter: a case study of India, Atmos. Environ., 49,
  T., Wilkinson, J. D., Williams, H. C., Williams, W., Wilson, N.,          1–12, https://doi.org/10.1016/j.atmosenv.2011.11.060, 2012.
  Woolf, A. D., Yip, P., Zielinski, J. M., Lopez, A. D., Murray, C.       Pant, P., Baker, S. J., Shukla, A., Maikawa, C., Godri Pollitt,
  J. L., and Ezzati, M.: A comparative risk assessment of burden            K. J., and Harrison, R. M.: The PM10 fraction of road dust
  of disease and injury attributable to 67 risk factors and risk factor     in the UK and India: Characterization, source profiles and
  clusters in 21 regions, 1990–2010: a systematic analysis for the          oxidative potential, Sci. Total Environ., 530–531, 445–452,
  Global Burden of Disease Study 2010, Lancet, 380, 2224–2260,              https://doi.org/10.1016/j.scitotenv.2015.05.084, 2015.
  https://doi.org/10.1016/s0140-6736(12)61766-8, 2012.                    Prakash, J., Singhai, A., Habib, G., Raman, R. S., and Gupta,
Liu, L., Kong, S., Zhang, Y., Wang, Y., Xu, L., Yan, Q., Lin-               T.: Chemical characterization of PM1.0 aerosol in Delhi and
  gaswamy, A. P., Shi, Z., Lv, S., Niu, H., Shao, L., Hu, M., Zhang,        source apportionment using positive matrix factorization, Envi-
  D., Chen, J., Zhang, X., and Li, W.: Morphology, composition,             ron. Sci. Pollut. R., 24, 445–462, https://doi.org/10.1007/s11356-
  and mixing state of primary particles from combustion sources             016-7708-8, 2017.
  – crop residue, wood, and solid waste, Sci. Rep.-UK, 7, 5047,           Rahman, S. A., Hamzah, M. S., Wood, A. K., Elias, M. S.,
  https://doi.org/10.1038/s41598-017-05357-2, 2017.                         Salim, N. A. A., and Sanuri, E.: Sources apportionment of
Logiewa, A., Miazgowicz, A., Krennhuber, K., and Lanzerstorfer,             fine and coarse aerosol in Klang Valley, Kuala Lumpur using
  C.: Variation in the concentration of metals in road dust size            positive matrix factorization, Atmos. Pollut. Res., 2, 197–206,
  fractions between 2 µm and 2 mm: results from three metallur-             https://doi.org/10.5094/APR.2011.025, 2011.
  gical centres in Poland, Arch. Environ. Con. Tox., 78, 46–59,           Rahn, K. A.: Silicon and aluminum in atmospheric aerosols:
  https://doi.org/10.1007/s00244-019-00686-x, 2020.                         crust air fractionation?, Atmos. Environ., 10, 597–601,
Maenhaut, W., Raes, N., and Wang, W.: Analysis of at-                       https://doi.org/10.1016/0004-6981(76)90044-5, 1976.
  mospheric aerosols by particle induced X ray emission,                  Rai, P. and Furger, M.: Highly time-resolved measurements
  instrumental neutron activation analysis, and ion chro-                   of element concentrations in PM10 and PM2.5 : Comparison
  matography, Nucl. Instrum. Meth. B, 269, 2693–2698,                       of Delhi, Beijing, London, and Krakow [Data set], Zenodo,
  https://doi.org/10.1016/j.nimb.2011.08.012, 2011.                         https://doi.org/10.5281/zenodo.4311854, 2020.

Atmos. Chem. Phys., 21, 717–730, 2021                                                         https://doi.org/10.5194/acp-21-717-2021
You can also read


