THE ADAPTABLE 4A INVERSION (5AI): DESCRIPTION AND FIRST XCO2 RETRIEVALS FROM ORBITING CARBON OBSERVATORY-2 (OCO-2) OBSERVATIONS - MPG.PURE
←
→
Page content transcription
If your browser does not render page correctly, please read the page content below
Atmos. Meas. Tech., 14, 4689–4706, 2021
https://doi.org/10.5194/amt-14-4689-2021
© Author(s) 2021. This work is distributed under
the Creative Commons Attribution 4.0 License.

The Adaptable 4A Inversion (5AI): description and first XCO2
retrievals from Orbiting Carbon Observatory-2 (OCO-2)
observations
Matthieu Dogniaux1 , Cyril Crevoisier1 , Raymond Armante1 , Virginie Capelle1 , Thibault Delahaye1 , Vincent Cassé1 ,
Martine De Mazière2 , Nicholas M. Deutscher3,4 , Dietrich G. Feist5,6,7 , Omaira E. Garcia8 , David W. T. Griffith3 ,
Frank Hase9 , Laura T. Iraci10 , Rigel Kivi11 , Isamu Morino12 , Justus Notholt4 , David F. Pollard13 , Coleen M. Roehl14 ,
Kei Shiomi15 , Kimberly Strong16 , Yao Té17 , Voltaire A. Velazco3 , and Thorsten Warneke4
1 Laboratoire  de Météorologie Dynamique/IPSL, CNRS, École polytechnique, Institut Polytechnique de Paris, Sorbonne
Université, École Normale Supérieure, PSL Research University, 91120 Palaiseau, France
2 Royal Belgian Institute for Space Aeronomy, Brussels, Belgium
3 Centre for Atmospheric Chemistry, School of Earth, Atmospheric and Life Sciences, University of Wollongong,

Wollongong, Australia
4 University of Bremen, Bremen, Germany
5 Max Planck Institute for Biogeochemistry, Jena, Germany
6 Lehrstuhl für Physik der Atmosphäre, Ludwig-Maximilians-Universität München, Munich, Germany
7 Deutsches Zentrum für Luft- und Raumfahrt, Institut für Physik der Atmosphäre, Oberpfaffenhofen, Germany
8 Izaña Atmospheric Research Center (IARC), State Meteorological Agency of Spain (AEMET), Tenerife, Spain
9 Institute of Meteorology and Climate Research (IMK-ASF), Karlsruhe Institute of Technology (KIT), Karlsruhe, Germany
10 NASA Ames Research Center, Moffett Field, CA, USA
11 Finnish Meteorological Institute, Sodankylä, Finland
12 National Institute for Environmental Studies (NIES), Tsukuba, Japan
13 National Institute of Water and Atmospheric Research Ltd (NIWA), Lauder, New Zealand
14 Division of Geological and Planetary Sciences, California Institute of Technology, Pasadena, CA, USA
15 Japan Aerospace Exploration Agency (JAXA), Tsukuba, Japan
16 Department of Physics, University of Toronto, Toronto, Canada
17 Laboratoire d’Etudes du Rayonnement et de la Matière en Astrophysique et Atmosphères (LERMA-IPSL), Sorbonne

Université, CNRS, Observatoire de Paris, PSL Université, 75005 Paris, France

Correspondence: Matthieu Dogniaux (matthieu.dogniaux@lmd.ipsl.fr)

Received: 5 October 2020 – Discussion started: 10 November 2020
Revised: 22 March 2021 – Accepted: 18 April 2021 – Published: 24 June 2021

Abstract. A better understanding of greenhouse gas surface      relying on the Operational version of the Automatized At-
sources and sinks is required in order to address the global    mospheric Absorption Atlas (4A/OP) radiative transfer for-
challenge of climate change. Space-borne remote estimations     ward model along with the Gestion et Étude des Informa-
of greenhouse gas atmospheric concentrations can offer the      tions Spectroscopiques Atmosphériques: Management and
global coverage that is necessary to improve the constraint     Study of Atmospheric Spectroscopic Information (GEISA)
on their fluxes, thus enabling a better monitoring of anthro-   spectroscopic database. Here, the 5AI scheme is applied to
pogenic emissions. In this work, we introduce the Adaptable     retrieve the column-averaged dry air mole fraction of car-
4A Inversion (5AI) inverse scheme that aims to retrieve geo-    bon dioxide (XCO2 ) from a sample of measurements per-
physical parameters from any remote sensing observation.        formed by the Orbiting Carbon Observatory-2 (OCO-2) mis-
The algorithm is based on the Optimal Estimation algorithm,     sion. Those have been selected as a compromise between

Published by Copernicus Publications on behalf of the European Geosciences Union.
4690                                M. Dogniaux et al.: The Adaptable 4A Inversion (5AI): description and first retrievals

coverage and the lowest aerosol content possible, so that the     al., 2011, 2013), the Atmospheric CO2 Observations from
impact of scattering particles can be neglected, for computa-     Space (ACOS) algorithm (Bösch et al., 2006; Connor et
tional time purposes. For air masses below 3.0, 5AI XCO2 re-      al., 2008; O’Dell et al., 2012, 2018), the University of Le-
trievals successfully capture the latitudinal variations of CO2   icester Full Physics (UoL-FP) retrieval algorithm from the
and its seasonal cycle and long-term increasing trend. Com-       University of Leicester (Parker et al., 2011), RemoTeC from
parison with ground-based observations from the Total Car-        the Netherlands Institute for Space Research (SRON; Butz et
bon Column Observing Network (TCCON) yields a bias of             al., 2011; Wu et al., 2018) and the Fast atmOspheric traCe
1.30 ± 1.32 ppm (parts per million), which is comparable to       gAs retrievaL (FOCAL) algorithm from the University of
the standard deviation of the Atmospheric CO2 Observations        Bremen (Reuter et al., 2017a, b).
from Space (ACOS) official products over the same set of             They also rely on different forward radiative transfer mod-
soundings. These nonscattering 5AI results, however, exhibit      els to compute synthetic measurements and their partial
an average difference of about 3 ppm compared to ACOS re-         derivatives. It was noted, for the Scanning Imaging Absorp-
sults. We show that neglecting scattering particles for compu-    tion Spectrometer for Atmospheric Chartography (SCIA-
tational time purposes can explain most of this difference that   MACHY) mission (Bovensmann et al., 1999), that NIR and
can be fully corrected by adding to OCO-2 measurements            SWIR measurements are also quite sensitive to the pres-
an average calculated–observed spectral residual correction,      ence of scattering particles on the optical path, which can
which encompasses all the inverse setup and forward differ-       then substantially perturb XCO2 retrievals if unaccounted
ences between 5AI and ACOS. These comparisons show the            for (Houweling et al., 2005). As exact multiple scatter-
reliability of 5AI as an optimal estimation implementation        ing calculations are too time consuming for operational
that is easily adaptable to any instrument designed to retrieve   XCO2 retrievals, all the previously mentioned retrieval algo-
column-averaged dry air mole fractions of greenhouse gases.       rithms have radiative transfer models that implement vari-
                                                                  ous approximations to speed up forward modelling. Finally,
                                                                  radiative transfer fundamentally depends on spectroscopic
                                                                  databases that contain the parameters enabling to compute
1   Introduction                                                  atmospheric gas absorption. The HITRAN spectroscopic
                                                                  database (latest version from 2016; Gordon et al., 2017) is
The atmospheric concentration of carbon dioxide (CO2 ) has        widely used for greenhouse gas concentration retrievals, as
been rising for decades because of fossil fuel emissions and      are the absorption coefficient (ABSCO) atmospheric absorp-
land use changes. However, large uncertainties still remain in    tion tables for the ACOS algorithm (Drouin et al., 2017; Oy-
the global carbon budget (e.g. Le Quéré et al., 2009). In or-     afuso et al., 2017).
der to address the global challenge of climate change, a better      The design of an XCO2 retrieval algorithm, from the for-
understanding of carbon sources and sinks is necessary, and       ward model and the spectroscopic parameters it uses to the
remote space-borne estimations of CO2 columns can help to         choice of the adjusted quantities in the state vector, has a
constrain these carbon fluxes in atmospheric inversion stud-      critical influence on the overall performance of the observ-
ies, thus reducing the remaining uncertainties (e.g. Rayner       ing system (Rodgers, 2000). The systematic errors in re-
and O’Brien, 2001; Chevallier et al., 2007; Basu et al., 2013,    trieved XCO2 and their standard deviations (the latter being
2018).                                                            also called single measurement precision) with regard to the
   The column-averaged dry air mole fraction of CO2 (XCO2 )       true (but unknown) state of the atmosphere particularly im-
can be retrieved from thermal infrared (TIR) soundings,           pact the uncertainty reduction and bias in atmospheric CO2
mostly sensitive to the midtroposphere (e.g. Chédin et            flux inversion studies (e.g. Chevallier et al., 2007). Retrieved
al., 2003; Crevoisier et al., 2004, 2009a), and from near-        XCO2 products are most often validated against columns with
infrared (NIR) and shortwave infrared (SWIR) measure-             similar observation geometry, like the ground-based solar ab-
ments, which are sensitive to the whole atmospheric col-          sorption spectrometry. The Total Carbon Column Observ-
umn and especially to levels close to the surface where car-      ing Network (TCCON) is a network of ground stations that
bon fluxes take place. Current NIR and SWIR satellite mis-        retrieve the column-averaged dry air mole fraction of CO2
sions observing carbon dioxide include the Japanese Green-        and other species from NIR and SWIR spectra measured
house gases Observing SATellites (GOSAT and GOSAT-                with Fourier transform spectrometers (FTSs) directly point-
2), NASA’s Orbiting Carbon Observatory-2 and 3 (OCO-2             ing at the Sun (Wunch et al., 2011b). The network currently
and OCO-3) and the Chinese mission TanSat. Over time,             consists of 27 stations all around the world, and its prod-
different algorithms have been developed to exploit their         ucts constitute a truth proxy reference for the validation of
measurements; those rely on different inverse methods and         space-borne retrievals of greenhouse gas atmospheric con-
use various hypotheses to address the fundamentally ill-          centrations. For instance, TCCON data sets were used to val-
posed problem of XCO2 retrieval. These algorithms, notably,       idate SCIAMACHY (Reuter et al., 2011), GOSAT XCO2 re-
include the Japanese National Institute for Environmental         trieved by the ACOS (Wunch et al., 2011a) and NIES algo-
Studies (NIES) algorithm (Yokota et al., 2009; Yoshida et         rithms (Inoue et al., 2016), and OCO-2 XCO2 produced by

Atmos. Meas. Tech., 14, 4689–4706, 2021                                            https://doi.org/10.5194/amt-14-4689-2021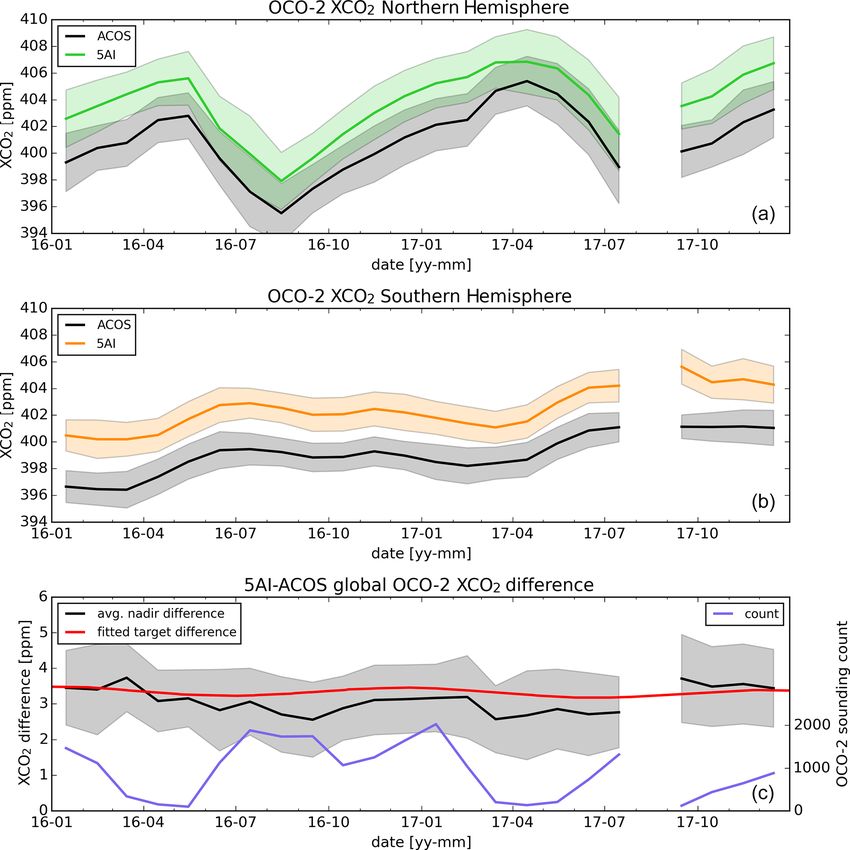
M. Dogniaux et al.: The Adaptable 4A Inversion (5AI): description and first retrievals                                     4691

ACOS (O’Dell et al., 2018; Wunch et al., 2017), RemoTeC           tral measurements made from space. This inverse problem
(Wu et al., 2018), and FOCAL (Reuter et al., 2017b). These        can be expressed with the following equation:
three last algorithms exhibit different biases compared to TC-
CON, depending on their respective forward modelling and          y = F(x) + ε,                                              (1)
bias correction strategies, i.e. 0.30 ± 1.04, 0.0 ± 1.36, and     where y is the measurement vector containing the radiances
0.67 ± 1.34 ppm (parts per million) for OCO-2 nadir land          measured by the space instrument, x is the state vector con-
soundings, respectively.                                          taining the geophysical parameters to be retrieved, ε is the
   In this paper, we present the Adaptable 4A Inversion           measurement noise, and, finally, F is the forward radiative
(5AI) that implements the optimal estimation inverse method       transfer model that describes the physics linking the geo-
(Rodgers, 2000). 5AI relies on the OPerational version of         physical parameters to be retrieved to the measured infrared
the Automatized Atmospheric Absorption Atlas (4A/OP) ra-          radiances.
diative transfer model (Scott and Chédin, 1981; Tournier,
1995; Cheruy et al., 1995; https://4aop.aeris-data.fr, last ac-   2.1   Forward modelling – 4A/OP and GEISA
cess: 25 May 2021) and the GEISA (Gestion et Étude des                  spectroscopic database
Informations Spectroscopiques Atmosphériques: Manage-
ment and Study of Spectroscopic Information) spectroscopic        The 5AI retrieval scheme uses the OPerational version of
database (Jacquinet-Husson et al., 2016; http://cds-espri.ipsl.   the Automatized Atmospheric Absorption Atlas (4A/OP).
fr/etherTypo/?id=950, last access: 25 May 2021). The 5AI          4A/OP is an accurate, line-by-line radiative transfer model
scheme is applied to retrieve XCO2 from a sample of OCO-          that enables a fast computation of atmospheric transmit-
2 measurements that compromises between coverage and              tances based on atlases containing precomputed monochro-
the lowest possible values of ACOS retrieved aerosol opti-        matic optical thicknesses for reference atmospheres. Those
cal depth in order to avoid possible singular biases due to       are used to compute atmospheric transmittances for any in-
strong aerosol events. This sample selection comprises the        put atmospheric profile and viewing configuration that en-
(1) OCO-2 best flag target mode soundings between 2014            able one to solve the radiative transfer equation and yield
and 2018 and (2) a sample of 2 years of OCO-2 nadir mea-          radiances and their partial derivatives with respect to the in-
surements with a global land coverage. First, for computa-        put geophysical parameters at a pseudo-infinite spectral res-
tional time purposes, retrievals are performed without taking     olution (0.0005 cm−1 best) or can be convolved with an in-
into account scattering particles. We then discuss how con-       strument function. 4A/OP is the reference radiative transfer
sidering them and accounting for differences in the radiative     model for the Centre National d’Études Spatiales (CNES)
transfer modelling and retrieval setups impact the 5AI re-        IASI (Infrared Atmospheric Sounding Interferometer) level
sults, which are compared to ACOS and TCCON reference             1 calibration/validation and operational processing, and it is
data over identical sets of soundings.                            used for daily retrieval of midtropospheric columns of CO2
   This paper is organised as follows: Sect. 2 describes the      (Crevoisier et al., 2009a) and CH4 (Crevoisier et al., 2009b)
5AI retrieval scheme and its current features, as well as the     from IASI. Moreover, 4A/OP has also been chosen by CNES
4A/OP radiative transfer model, the GEISA spectroscopic           as the reference radiative transfer model for the development
database, and the empirically corrected O2 A-band absorp-         of the New Generation of the IASI instrument (IASI-NG;
tion continuum on which it relies. Section 3 presents the         Crevoisier et al., 2014) and the French NIR and SWIR CO2
OCO-2 and TCCON data selection. Section 4 presents the a          remote sensing MicroCarb mission (Pascal et al., 2017) and
posteriori filters used for this work and shows the 5AI XCO2      the French–German MEthane Remote sensing LIdar Mission
target and nadir retrieval results which are compared to TC-      (MERLIN; Ehret et al., 2017).
CON and ACOS (B8r version). 5AI results are discussed in             Although originally developed for the thermal infrared
Sect. 5. It shows how taking into account scattering parti-       spectral region, 4A/OP has been extended to the near- and
cles in 5AI retrievals can impact the results and how sys-        shortwave infrared regions (NIR and SWIR). (1) The compu-
tematic differences between different XCO2 products can be        tation of the atlases of optical thickness was extended to the
accounted for by compensating them with a spectral residual       3000–13 500 cm−1 domain and takes into account line mix-
adjustment XCO2 . Finally, Sect. 6 highlights the conclusions     ing and collision-induced absorption (CIA) in the O2 A band
of this work.                                                     (Tran and Hartmann, 2008), as well as line mixing and H2 O
                                                                  broadening of CO2 lines (Lamouroux et al., 2010). The ab-
                                                                  sorption lines of CO2 that we use in this work are, thus,
2   The 5AI retrieval scheme                                      identical to those included in HITRAN 2008. (2) The so-
                                                                  lar spectrum is a flexible input, and the Doppler shift of its
As for any other retrieval scheme, 5AI aims at finding the es-    lines is computed. (3) The radiative transfer model is now
timate of atmospheric and surface parameters (for example,        coupled with the LIDORT model (Spurr, 2002) for scalar
trace gas concentration, temperature profile, surface albedo,     multiple-scattering simulation performed with the discrete
or scattering particle optical depth) that best fits hyperspec-   ordinates method and with VLIDORT (Spurr, 2006) if po-

https://doi.org/10.5194/amt-14-4689-2021                                           Atmos. Meas. Tech., 14, 4689–4706, 2021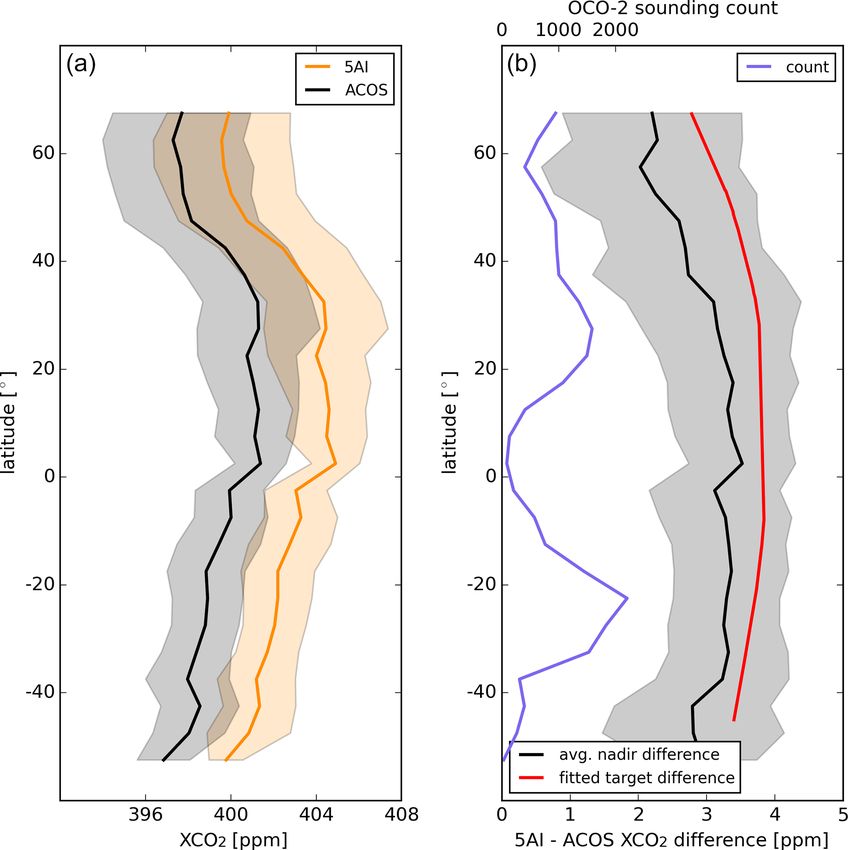
4692                                M. Dogniaux et al.: The Adaptable 4A Inversion (5AI): description and first retrievals

larisation or bidirectional reflectance distribution functions    retrieval is highly nonlinear, it is practical to use a local lin-
(BRDFs) need to be taken into account. This coupling es-          ear approximation, here expressed around the a priori state
pecially enables us to take into account Rayleigh scattering      as follows:
and, if necessary, scattering particles in NIR and SWIR for-                               ∂F
ward modelling.                                                   F(x) = F (x a ) +           |x (x − x a ) .                   (3)
                                                                                           ∂x a
   The 4A/OP radiative transfer model can be used with
monochromatic optical thickness atlases computed from any         The partial derivatives of the forward radiative transfer model
spectroscopic database. For this present work, the atlases        F (here 4A/OP) are expressed as a matrix, called the Jacobian
are computed using the GEISA 2015 (Gestion et Étude               matrix, and is denoted as K.
des Informations Spectroscopiques Atmosphériques: Man-               All these assumptions enable the maximum posterior
agement and Study of Spectroscopic Information) spectro-          probability state x̂ that minimises the cost function defined
scopic database. Being the base of many projects since the        in Eq. (2) to be found. It can be computed by iteration, using
beginning in astronomical and astrophysical communities,          the general approach, as follows:
GEISA has also been used since the 2000s for the preparation                    h                          i−1
                                                                                                   T −1
of several current and future spatial missions and has been       x i+1 = x i + (1 + γ ) S−1
                                                                                           a + Ki Se Ki
chosen by CNES as the reference spectroscopic database for
the definition of IASI-NG, MicroCarb, and MERLIN. Due                      KTi S−1                   −1
                                                                                 e (y − F (x i )) − Sa (x i − x a ) ,         (4)
to imperfections in the Tran and Hartmann (2008) line mix-
ing and CIA models, an empirical correction to the absorp-        where γ is a scaling factor that can be set to 0 (Gauss–
tion continuum in the O2 A band, fitted from Park Falls TC-       Newton method) or whose value can be adapted along iter-
CON spectra, following the method described in Drouin et          ations in order to prevent divergence (Levenberg–Marquardt
al. (2017), has been added. Finally, we use Toon (2015) as        method, in which successful retrievals use decreasing γ val-
input solar spectra.                                              ues and, eventually, 0 for the final iteration). Ki here denotes
                                                                  the forward radiative transfer Jacobian matrix, whose values
2.2     Inverse modelling in the 5AI retrieval scheme             are evaluated for the state vector x i .
                                                                     A successful retrieval reduces the a priori uncertainty of
2.2.1     Optimal estimation applied for XCO2 retrieval           the state vector described in Sa . The a posteriori covariance
                                                                  matrix of the retrieved state vector Ŝ, whose diagonal ele-
The whole formalism of optimal estimation that enables us to      ments give the posterior variance of the retrieved state vector
find a satisfying solution to Eq. (1) may be found in Rodgers     elements, is expressed as follows:
(2000). This subsection only outlines the key steps that are
                                                                                         i−1
implemented in order to retrieve XCO2 .
                                                                       h
                                                                                 T −1
                                                                  Ŝ = S−1a  + K   Se  K     .                                 (5)
   Equation (1) includes ε, the experimental noise of the
measured radiances. Hence, it appears more appropriate to         Finally, the sensitivity of the retrieval with respect to the true
use a formalism that takes into account this measurement          geophysical state x true is given by the averaging kernel ma-
uncertainty and translates it into retrieval uncertainty; this    trix A calculated according to the following:
is done by representing the state of the atmosphere x and
the measurement y as random variables. Assuming Gaus-                   ∂ x̂           h
                                                                                              T −1
                                                                                                   i−1
                                                                  A=           (x a ) = S−1
                                                                                         a + K Se K    KT S−1
                                                                                                           e K.                 (6)
sian statistics, the inversion problem consists in finding the         ∂x true
state vector which compromises between an a priori knowl-
                                                                  In most cases, the CO2 concentration is included in the state
edge of the geophysical state parameters (most often brought
                                                                  vector as a level or layer profile from which XCO2 , the re-
by climatologies) and the information brought by the mea-
                                                                  trieved column-averaged dry air mole fraction of CO2 , is
surement, both weighted by their respective uncertainties. It
                                                                  computed (e.g. O’Dell et al., 2012). If we note x̂ CO2 , the part
finally boils down to the minimisation of the following χ 2
                                                                  of the retrieved state vector x̂ containing the CO2 profile, and
cost function:
                                                                  ACO2 and ŜCO2 , the corresponding square parts of A and Ŝ,
χ 2 = (y − F (x))T S−1
                    e (y − F(x)) + (x − x a )
                                             T
                                                                  we have the following:
        S−1
         a (x − x a ) ,                                    (2)    XCO2 = hx̂ CO2 ,                                              (7)
where x a is the a priori state vector, which is also, in most
                                                                         q
                                                                  σXCO2 = hT ŜCO2 h,                                           (8)
cases, chosen as the first guess for iterative retrievals. As-
                                                                                                  hT A

suming again Gaussian statistics, Sa is the a priori state co-                       ∂XCO2              CO2 j
variance matrix that represents the variability around the a       aCO2       j
                                                                                  =           =                  ,              (9)
                                                                                      ∂x true        hj
priori state vector, and similarly, Se is the a priori measure-
ment error covariance matrix that represents the noise model      where h is the pressure weighting function. σXCO2 denotes the
of the instrument. Moreover, as the forward model for this        posterior uncertainty of the retrieved XCO2 , and aCO2 is the

Atmos. Meas. Tech., 14, 4689–4706, 2021                                                   https://doi.org/10.5194/amt-14-4689-2021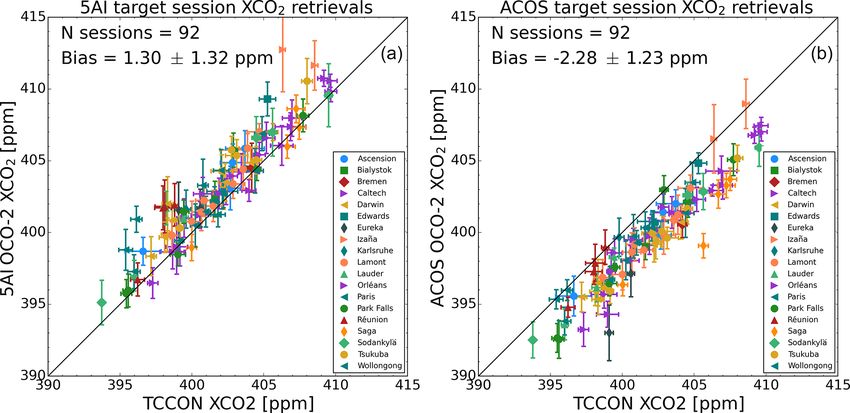
M. Dogniaux et al.: The Adaptable 4A Inversion (5AI): description and first retrievals                                            4693

CO2 column averaging kernel. This profile vector describes            3     Data
the vertical sensitivity of the retrieved column with regard to
the true profile; it is essential to characterise retrieval results   3.1    Data description
and to compare them to other products, as shown in Sect. 4.2.
                                                                      The OCO-2 satellite has three distinct observation modes.
2.2.2   5AI features and retrieval scheme setups for                  The nadir and glint modes are the nominal science observa-
        OCO-2                                                         tion modes; they constitute the vast majority of OCO-2 mea-
                                                                      surements. In addition, the target mode of the OCO-2 mis-
The 5AI retrieval scheme enables the retrieval of multi-              sion provides data for the validation of the retrievals. In target
ple geophysical variables from hyperspectral measurements.            mode, the satellite tilts and aims at a validation target (most
Those currently include trace gas concentration represented           of them are TCCON stations) and scans its whereabouts sev-
in the state vector as a concentration profile or a profile scal-     eral times during the overpass. These sessions thus provide
ing factor, global temperature profile offset, surface temper-        OCO-2 data points closely collocated with validation targets
ature and pressure band-wise albedo, whose spectral depen-            (over areas that can be as small as 0.2◦ longitude × 0.2◦ lati-
dence is modelled as a polynomial, and, finally, scattering           tude) and registered over a few minutes (Wunch et al., 2017).
particle layer-wise optical depth. For this work, the state vec-         OCO-2 high-resolution spectra are analysed by the ACOS
tor includes the main geophysical parameters necessary to             team in order to retrieve XCO2 and other geophysical parame-
retrieve XCO2 and is described in Table 1. The a priori values        ters from them. The ACOS team provides two different XCO2
and their covariance are identical to those used in the ACOS          values, i.e. raw and posterior bias-corrected XCO2 . Raw XCO2
B8r version (O’Dell et al., 2018) in order to ease the retrieval      is the direct output of the ACOS algorithm following the full
result comparison.                                                    physics retrieval; B8 retrospective (B8r) ACOS data release
   The OCO-2 spectrometer measures Earth-reflected near-              is used here (O’Dell et al., 2018). Posterior bias-corrected
and shortwave infrared (NIR and SWIR) sunlight in three               XCO2 is an empirically corrected XCO2 that has reduced av-
distinct bands, namely the O2 A band (0.7 µm), the weak               eraged bias with regard to different truth proxies (O’Dell et
CO2 band (1.6 µm), and the strong CO2 band (2.0 µm). In or-           al., 2018). In this work, 5AI results are compared with raw
der to accurately model OCO-2 measurements, polarisation              XCO2 as we do not perform any empirical bias correction.
effects have to be taken into account. As 4A/OP coupling                 In addition, we compare XCO2 retrieved from OCO-2
with (V)LIDORT is not optimal yet, forward calculations               spectra to TCCON data. The TCCON network uses ground-
can reach unmanageable durations without some assump-                 based high-resolution Fourier transform spectrometers to
tions that allow faster radiative transfer simulations. There-        measure NIR and SWIR spectra that enable the retrieval of
fore, as explained in Sect. 1, we first restrict this work to         the column-averaged dry air mole fractions of greenhouse
the lowest scattering particle content possible (while com-           gases. These retrievals are performed by GGG2014 soft-
promising with coverage) so that only Rayleigh scattering             ware (Wunch et al., 2015), and their results are available on
needs to be taken into account in the O2 A band (0.7 µm).             the TCCON Data Archive (https://tccondata.org/, last access:
This is done by using 4A/OP coupling with VLIDORT, and                25 May 2021).
the ACOS Stokes coefficients are applied to yield the final
scalar radiances. For CO2 weak and strong bands, scatter-             3.2    Data selection
ing and polarisation can be neglected with this low scattering
particle content assumption, and only the Stokes coefficient,         We intend to compare 5AI results with regard to TCCON
0.5, for the I component of the electric field is applied to          against ACOS results for corresponding sets of soundings.
yield the final scalar radiances. As we neglect, for computa-         First, we select all the OCO-2 target soundings between 2015
tion time purposes, the possible impact of scattering particles       and 2018 with the best ACOS cloud, sounding quality, and
in forward calculations and in the state vector, the retrieval        outcome flags values. As a compromise between scattering
problem becomes more linear. Thus, we can also assume a               particle content and coverage, we set an upper limit of 0.5
slow variation in the Jacobian matrix along the retrieval iter-       for the ACOS retrieved total aerosol optical depth (AOD).
ations and, therefore, choose not to update it in order to save       This sample set of OCO-2 target soundings includes 16 414
computational time. Hence, the partial derivatives of the ra-         soundings, with a median ACOS retrieved total AOD of 0.05
diative transfer model are evaluated once and for all around          and a 75 % percentile of 0.1.
the a priori state. We performed a sensitivity test and assessed         For this study, we select the TCCON official products
that this approximation does not significantly change the re-         measured ±2 h compared to OCO-2 overpass time and only
trieval results (not shown).                                          keep the target sessions where there are at least five OCO-2
                                                                      measurements passing 5AI posterior filters and five TCCON
                                                                      data points are available. This set includes 9449 TCCON in-
                                                                      dividual retrieval results from 19 TCCON stations listed in
                                                                      Table 2.

https://doi.org/10.5194/amt-14-4689-2021                                                Atmos. Meas. Tech., 14, 4689–4706, 2021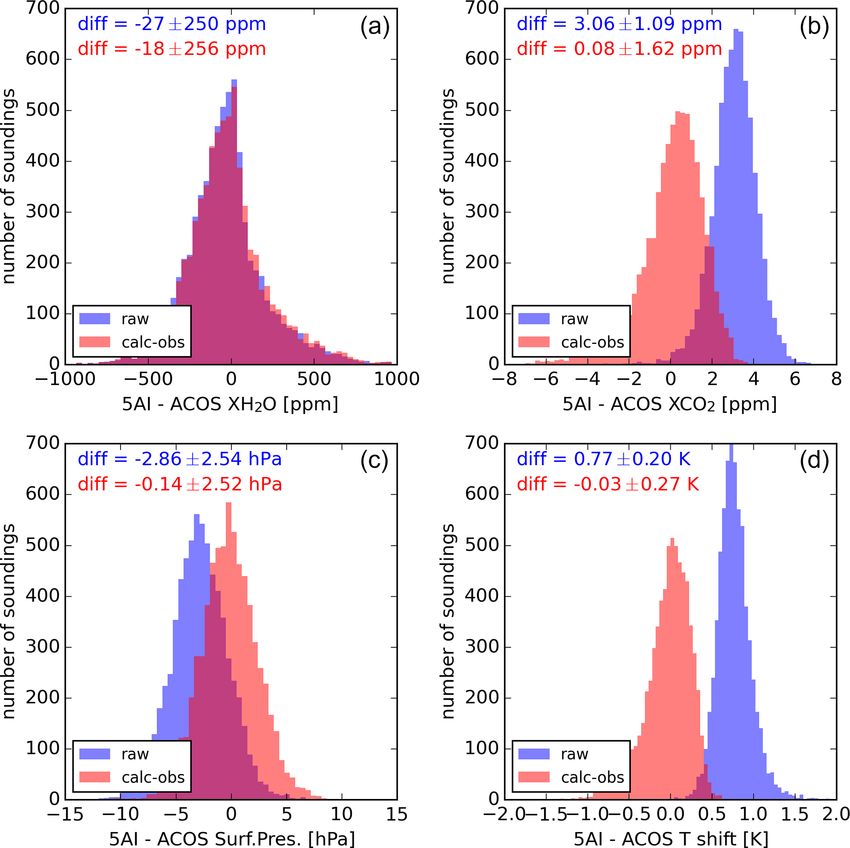
4694                                      M. Dogniaux et al.: The Adaptable 4A Inversion (5AI): description and first retrievals

Table 1. 5AI state vector composition for OCO-2 retrievals.

 Variable name                   Length        A priori value      A priori uncertainty           Notes
                                                                   (1σ )
 H2 O scaling factor             1             1.0                 0.5 (same as ACOS)             –
 CO2 layer concentration         19 layers     ACOS a priori       ACOS prior covariance          See prior covariance matrix
                                                                   matrix                         in O’Dell et al. (2012)
 Surface pressure                1             ACOS a priori       4.0 hPa (same as ACOS)         –
 Temperature profile offset      1             ACOS a priori       5.0 K (same as ACOS)           –
 Surface albedo                  3 bands       ACOS a priori       1.0 (same as ACOS)             Evaluated at 0.77, 1.615 and 2.06 µm for O2 and
 (order 0 of albedo model)                                                                        CO2 weak and strong bands, respectively
 Surface albedo slope            3 bands       0.0                 1.0/cm−1                       –
 (order 1 of albedo model)

Table 2. TCCON data used in this work.

  TCCON station              Coordinates                             No. of   Date range (first and last sessions)     Reference
                             (latitude, longitude, and altitude)     target
                                                                   sessions
  Ascension Island           7.92◦ S, 14.33◦ W, 0.01 km                  4    16 January 2015–15 January 2018          Feist et al. (2014)
  Bialystok (Poland)         53.23◦ N, 23.03◦ E, 0.18 km                 1    18 March 2015                            Deutscher et al. (2019)
  Bremen (Germany)           53.10◦ N, 8.8◦ 5E, 0.027 km                 1    17 March 2016                            Notholt et al. (2014)
  Caltech (USA)              34.14◦ N, 118.13◦ W, 0.230 km              19    12 September 2014–16 September 2018      Wennberg et al. (2015)
  Darwin (Australia)         12.424◦ S, 130.89◦ E, 0.03 km               8    15 May 2015–28 July 2017                 Griffith et al. (2014a)
  Edwards (USA)              34.96◦ N, 117.88◦ W, 0.700 km               1    22 August 2018                           Iraci et al. (2016)
  Eureka (Canada)            80.05◦ N, 86.42◦ W, 0.61 km                 2    16 June–28 June 2015                     Strong et al. (2019)
  Izaña (Tenerife)           28.31◦ N, 16.50◦ W, 2.37 km                 2    5 January–24 March 2018                  Blumenstock et al. (2017)
  Karlsruhe (Germany)        49.10◦ N, 8.44◦ E, 0.116 km                 1    12 September 2016                        Hase et al. (2015)
  Lamont (USA)               36.60◦ N, 97.49◦ W, 0.32 km                 9    10 February 2015–11 November 2016        Wennberg et al. (2016)
  Lauder (New Zealand)       45.04◦ S, 169.68◦ E, 0.37 km                3    17 February 2015–6 February 2016         Sherlock et al. (2014)
  Orléans (France)           47.97◦ N, 2.11◦ E, 0.13 km                  1    8 April 2015                             Warneke et al. (2019)
  Paris (France)             48.85◦ N, 2.36◦ E, 0.06 km                  1    25 August 2016                           Té et al. (2014)
  Park Falls (USA)           45.95◦ N, 90.27◦ W, 0.44 km                 7    11 October 2014–21 April 2017            Wennberg et al. (2017)
  Réunion Island             20.90◦ S, 55.49◦ E, 0.087 km                4    24 March–1 August 2015                   De Mazière et al. (2017)
  Saga (Japan)               33.24◦ N, 130.29◦ E, 0.007 km               5    31 July 2015–2 December 2017             Kawakami et al. (2014)
  Sodankylä (Finland)        67.37◦ N, 26.63◦ E, 0.188 km                4    20 August 2015–17 July 2018              Kivi et al. (2014),
                                                                                                                       Kivi and Heikkinen (2016)
  Tsukuba (Japan)            36.05◦ N, 140.12◦ E, 0.03 km                6    14 November 2014–17 June 2017            Morino et al. (2018)
  Wollongong (Australia)     34.40◦ S, 150.88◦ E, 0.03 km               13    23 September 2014–6 May 2018             Griffith et al. (2014b)

   Besides target data, we also select a sample of OCO-2                       Africa, and Australia) soundings with low ACOS retrieved
nadir land soundings with a coverage as global as possi-                       total AOD. For 2016 and 2017, this selection is done for a
ble over the years 2016–2017 (all ACOS flags at their best                     maximum ACOS retrieved total AOD of 0.035 and 0.045,
value possible). For every month and 5◦ longitude ×5◦ lat-                     respectively, yielding 17 069 soundings for 2016 and 11 002
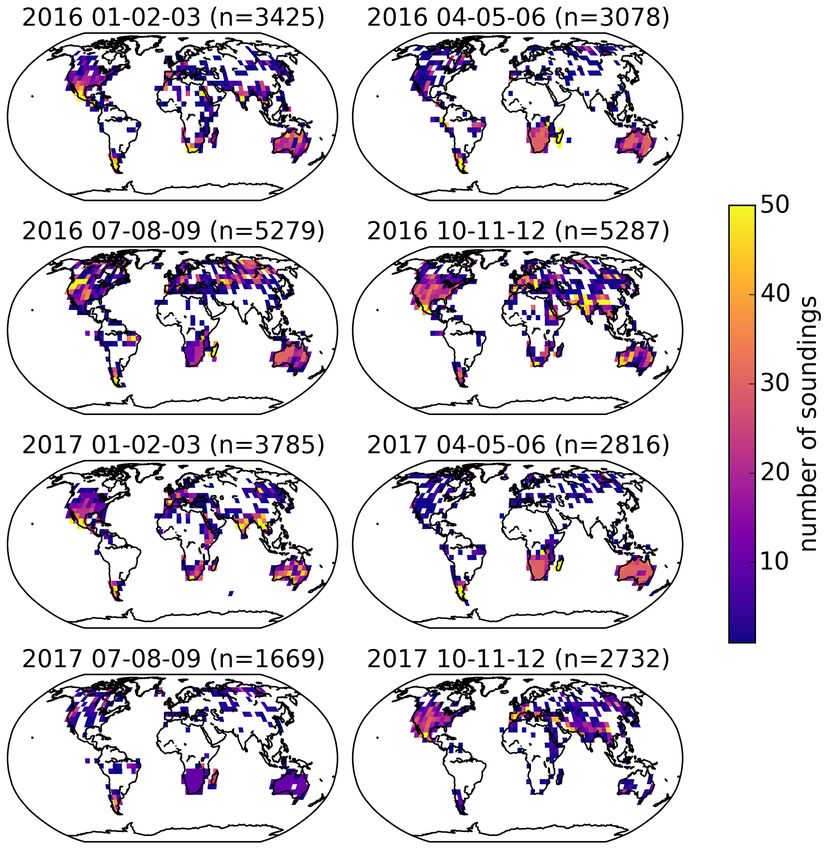
itude bins, we select 25 (10 for North America, southern

Atmos. Meas. Tech., 14, 4689–4706, 2021                                                               https://doi.org/10.5194/amt-14-4689-2021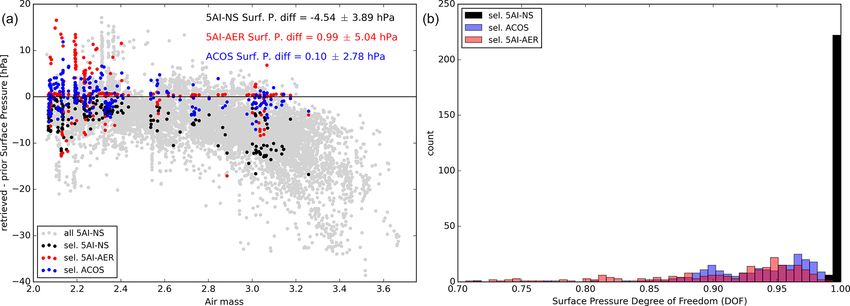
M. Dogniaux et al.: The Adaptable 4A Inversion (5AI): description and first retrievals                                              4695

                                                                    Figure 2. Distribution of target and nadir 5AI retrievals passing sur-
                                                                    face pressure, blended albedo, and reduced χ 2r filters according to
                                                                    air mass and difference between retrieved and prior surface pres-
                                                                    sures. Grey areas denote bins for which no 5AI retrieval is available.
Figure 1. Spatial and temporal repartition of the sample of nadir
OCO-2 soundings selected for 5AI retrievals, in seasonal and 5◦ ×   4.2   OCO-2 target retrieval results
5◦ square bins. The titles include n, the number of soundings for
the corresponding panel. The low number of selected soundings in    For every target session, we consider a unique average of the
July–September 2017 is due to an identified OCO-2 data gap.
                                                                    available retrieval results from OCO-2 measurements and a
                                                                    unique average of the corresponding TCCON official prod-
                                                                    ucts as performed in, for example, O’Dell et al. (2018) and
for 2017. Figure 1 shows the spatial and temporal distribution
                                                                    Wu et al. (2018). As OCO-2 and TCCON XCO2 vertical
of these OCO-2 points.
                                                                    sensitivities described by their averaging kernels are not ex-
                                                                    actly identical, we take into account the averaging kernel cor-
                                                                    rection of TCCON data, as performed by the ACOS team
4     Results
                                                                    (O’Dell et al., 2018) and described by Eq. (10) (Nguyen et
4.1    Post-filtering of retrieval results                          al., 2014) as follows:
                                                                    XOCO-2, TCCON = Xa priori
We apply the a posteriori filters described in Table 3 to en-                          !
sure the quality of the retrieved results. The surface pres-              X̂TCCON        X
sure filter removes soundings for which it proved difficult           +             −1        j
                                                                                                hj a CO2 j x a priori, j .           (10)
                                                                          Xa priori
to successfully model the optical path, suggesting scatter-
ing related errors leading to a large difference between the        XOCO-2, TCCON is the column-averaged dry air mole fraction
retrieved and prior surface pressure. The reduced χ 2 filter        of CO2 that would have been retrieved from the OCO-2 mea-
removes the worst spectral fits. In the end, 95 % of our se-        surement if the collocated TCCON retrieval was the true state
lected soundings pass these first two filters. In addition, the     of the atmosphere. Xa priori is the a priori column-averaged
blended albedo filter removes the 12 % fraction of target data      dry air mole fraction of CO2 , considered to be very simi-
representative of challenging snow or ice-covered surfaces          lar between 5AI (or ACOS) and GGG2014. X̂TCCON is the
(Wunch et al., 2011a). With the current retrieval setup, the        TCCON retrieved column-averaged dry air mole fraction of
difference between the 5AI retrieved surface pressure and its       CO2 . h is the pressure weighting function vector defined pre-
prior exhibit an air mass dependence, as shown in Fig. 2.           viously. (a CO2 ) is the CO2 column averaging kernel vector
For this present work, we filter out all soundings with an air      defined in Eq. (9), and x a priori is the a priori CO2 concentra-
mass above 3.0. Future studies will refine the 5AI forward          tion profile vector. The effect of this correction yields a posi-
and inverse setup in order to process hyperspectral infrared        tive shift of the bias with regard to TCCON of about 0.2 ppm
soundings with larger air masses. Results detailed in the fol-      for the set of target sessions considered in this work.
lowing subsections are based on the 9605 target and 21 254             Following post-filtering, Fig. 3 shows 5AI raw results
nadir OCO-2 soundings that passed all these filters.                compared to the TCCON official product over 92 target ses-

https://doi.org/10.5194/amt-14-4689-2021                                               Atmos. Meas. Tech., 14, 4689–4706, 2021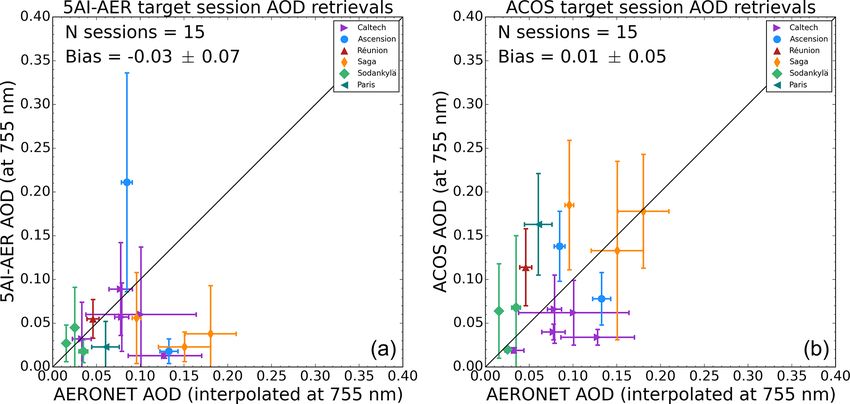
4696                                    M. Dogniaux et al.: The Adaptable 4A Inversion (5AI): description and first retrievals

Table 3. Filters applied on 5AI retrieval results for this work.

     Variable name         Minimum       Maximum       Definition and reference                                         OCO-2 mode
                           value          value
     Retrieved surface     Pnlev−1           –         The atmosphere is discretised in 20 levels bounding 19 layers.   Nadir and target
     pressure                                          We do not allow the surface pressure, Pnlev ,
                                                       to be lower than its preceding pressure level.
     Reduced χ 2           –                7.0        Overall goodness of the spectral fit                             Nadir and target
                                                       (e.g. Wu et al., 2018).
     Blended albedo        –                0.8        2.4× O2 A-band albedo +1.13× CO2 strong band albedo              Target
                                                       (Wunch et al., 2011a, 2017)

     Air mass              –                3.0            1          1
                                                       cos(SZA) + cos(VZA) , with SZA, the solar zenith angle, and      Nadir and target
                                                       VZA, the viewing zenith angle (Wunch et al., 2011a)

Figure 3. The 5AI (a) and raw ACOS B8r (b) OCO-2 target XCO2 retrieval results compared to the TCCON official XCO2 product. Individual
sounding results are averaged for every target session. Markers show the session average for OCO-2 and TCCON XCO2 , and error bars show
the standard deviations.

sions. The mean systematic XCO2 bias (5AI − TCCON) is                      plitude of yearly oscillation in both 5AI and ACOS cases.
1.30 ppm, and its standard deviation is 1.32 ppm. The ACOS                 Latitudinal bias fits performed with all the available target
raw XCO2 and TCCON XCO2 comparison for the correspond-                     sessions, except those from Eureka, show that 5AI bias com-
ing set of OCO-2 soundings is also presented in Fig. 3. The                pared to TCCON appears to be larger in the Southern Hemi-
bias compared to TCCON is −2.28 ppm, and its standard                      sphere than in the Northern Hemisphere, but its behaviour
deviation is 1.23 ppm. This difference in bias compared to                 is quite parallel to ACOS, except at higher latitudes where
TCCON may be greatly influenced by forward modelling                       5AI and ACOS become closer. The Eureka station (latitude
and retrieval setup differences between 5AI and ACOS, as                   80◦ N) has been removed from those fits, as satellite re-
detailed later in this work. Bias-corrected FOCAL and Re-                  trievals and validation are known to be challenging at these
moTeC XCO2 retrieval results compared to the ACOS offi-                    latitudes (O’Dell et al., 2018).
cial product exhibit similar differences in bias standard devi-
ations (Reuter et al., 2017b; Wu et al., 2018).                            4.3    OCO-2 nadir retrieval results
   Temporal and latitudinal fits of 5AI and ACOS XCO2 bi-
ases, compared to TCCON, are displayed in Fig. 4. Tempo-                   In this subsection, raw 5AI retrieved XCO2 is compared to the
ral biases are fitted with a first-order polynomial added to a             ACOS raw product on a sample of OCO-2 nadir soundings,
cosine and exhibit a quasi-null slope with a ∼ 0.4 ppm am-                 as described in Sect. 3 and displayed in Fig. 1. The nadir
                                                                           viewing configuration is the nominal science mode of the

Atmos. Meas. Tech., 14, 4689–4706, 2021                                                       https://doi.org/10.5194/amt-14-4689-2021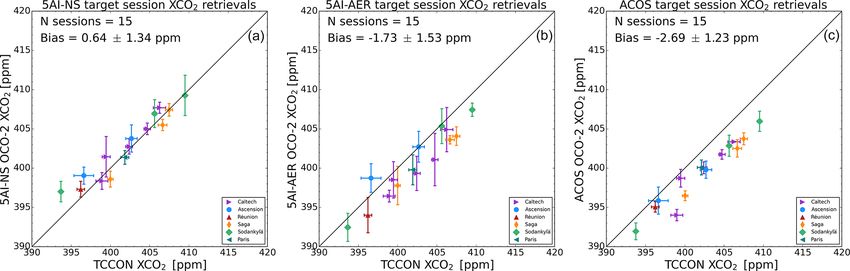
M. Dogniaux et al.: The Adaptable 4A Inversion (5AI): description and first retrievals                                                   4697

Figure 4. The 5AI and raw ACOS B8r OCO-2 target XCO2 bias compared to TCCON as a function of time (a) and latitude (b). Crosses
show the individual session averages in panel (a) and individual station averages in panel (b). The full lines show the polynomial fits of this
bias for all target sessions.

OCO-2 mission and allows comparisons at a larger spatial
scale than the one offered by the target mode dedicated to
validation.
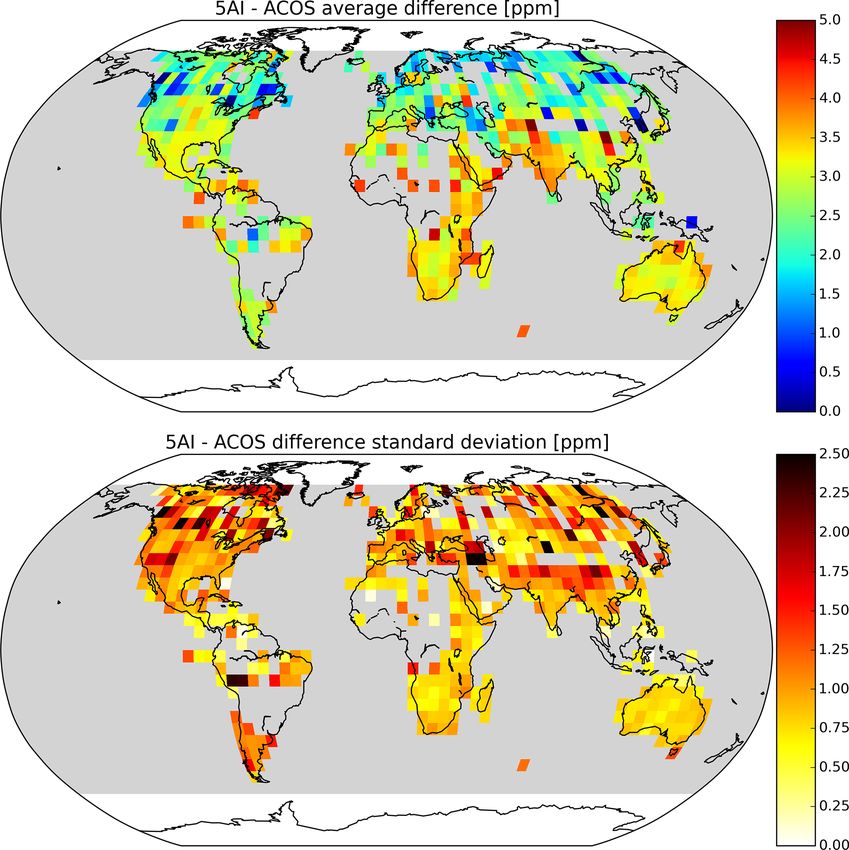
   Figure 5 shows the average and associated standard de-
viation of the difference between 5AI- and ACOS-retrieved
raw XCO2 . The overall 5AI–ACOS difference is about 3 ppm,
with a latitudinal dependency; it is lower above midlatitudes
in the Northern Hemisphere. 5AI differences to ACOS also
exhibit features over India or the Sahara that are places which
are often associated with strong aerosol events; those may be
due to the neglecting of scattering parameters in the 5AI re-
trievals. The standard deviation is mainly correlated with to-
pography; it is higher in the vicinity of mountain chains and
lower in flatter areas. As we do not take into account topog-
raphy in the sampling strategy of the processed OCO-2 nadir
soundings, its greater variability in mountainous areas can re-
sult in a greater variability in the retrieved surface pressure,
which is strongly correlated with retrieved XCO2 . As for the
highest standard deviations in South America, they may be
caused by the South Atlantic Anomaly which they are close
to (Crisp et al., 2017).
   As seen in Fig. 6, latitudinal variations in raw 5AI re-               Figure 5. Spatial repartition of 5AI difference with the raw ACOS
trieved XCO2 are consistent with those of ACOS, with a dif-               B8r (average and standard deviation) on 5◦ × 5◦ square bins for the
ference between the two products being almost constant, ex-               nadir data selection.
cept above midlatitudes in the Northern Hemisphere where
the differences are smaller. In addition, the comparison be-
tween 5AI and ACOS in the nadir mode is consistent with                   tion of CO2 can be observed in both hemispheres and the sea-
the results obtained for target sessions. Indeed, the raw 5AI–            sonal cycle, which is stronger in the Northern Hemisphere,
ACOS target difference lies within ±1σ of nadir results, with             where most of the vegetation respiration and photosynthesis
σ being the standard deviation of the 5AI–ACOS difference.                happen. The temporal variations in the 5AI–ACOS XCO2 re-
Figure 7 details the temporal variations in the retrieved XCO2 .          trieval differences in the nadir mode are also consistent with
The global long-term increase in the atmospheric concentra-               those presented in the target mode.

https://doi.org/10.5194/amt-14-4689-2021                                                     Atmos. Meas. Tech., 14, 4689–4706, 2021
4698                                 M. Dogniaux et al.: The Adaptable 4A Inversion (5AI): description and first retrievals

                                                                     5     Discussion

                                                                     5.1    Sensitivity of raw retrieval results to scattering
                                                                            particles

                                                                     Of the main forward and inverse differences between 5AI
                                                                     and ACOS, one is the accounting of scattering particles on
                                                                     the optical path. Indeed, ACOS considers five Gaussian-
                                                                     shaped vertical profiles of different scattering particle types
                                                                     for which it retrieves three parameters (O’Dell et al., 2018),
                                                                     while, for computational time purposes, none is considered in
                                                                     the previously presented 5AI results (hereafter denoted 5AI-
                                                                     NS for no scattering). In order to assess the sensitivity of 5AI
                                                                     results to this neglecting of scattering particles, we propose
                                                                     performing some 5AI XCO2 retrievals from OCO-2 sound-
                                                                     ings while taking into account some aerosol parameters in
                                                                     the forward modelling and state vector.
                                                                        Several adaptations of the 5AI setup are required for this
                                                                     sensitivity test (hereafter denoted 5AI-AER for aerosols).
                                                                     First, we consider here two fixed-height fixed-width aerosol
                                                                     layers. The first one, representative of coarse mode miner-
Figure 6. Latitudinal variation in 5AI and the raw ACOS B8r re-      als, is located between about 800 and 900 hPa, and the sec-
trieved XCO2 (a) and their difference (b). Panel (b) compares the    ond, representative of fine mode soot, is between about 900
5AI–ACOS average difference for nadir soundings and 5AI–ACOS         and 1013 hPa. Only the two layer-wise optical depths are re-
difference fitted on target sessions (bottom axis). The number of    trieved (defined at 755 nm, as ACOS), each with an a priori
available nadir soundings is also shown in panel (b) (top axis).     value of 0.025 and an a priori uncertainty of 0.15. Otherwise,
                                                                     the state vector and its a priori, described in Table 1, remain
                                                                     unchanged. Regarding forward modelling, we still rely on
                                                                     4A/OP coupling with VLIDORT for the O2 A-band calcu-
                                                                     lations, and we now use 4A/OP coupling with LIDORT for
                                                                     CO2 weak and strong band calculations (thus still neglect-
                                                                     ing polarisation effects in these bands). Finally, as the re-
                                                                     trieval problem becomes less linear when considering scat-
                                                                     tering particle parameters, we update the Jacobian matrix
                                                                     with every iteration.
                                                                        With these adaptations, 5AI retrievals are about 12 times
                                                                     slower than when not accounting for scattering particles.
                                                                     Considering the increase in computation time, this sensitivity
                                                                     test can only be performed for a small subsample of the data.
                                                                     We choose to focus here on 15 OCO-2 target sessions (out of
                                                                     the 92 presented in Sect. 4) that have available AERONET
                                                                     (AErosol RObotic NETwork, version 3; AOD level 2.0) opti-
                                                                     cal depths acquired ±2 h compared to OCO-2 overpass (Hol-
                                                                     ben et al., 1998; Eck et al., 1999; Giles et al., 2019), thus en-
                                                                     abling us to also discuss total retrieved aerosol optical depths.
                                                                     A total of 445 OCO-2 soundings have been processed, and
                                                                     228 remain after filtering according to the quality of the spec-
                                                                     tral fit (reduced χ 2 < 7.0).
Figure 7. Temporal variation in 5AI and the raw ACOS B8r re-            Figure 8 shows how taking into account scattering parti-
trieved XCO2 in the Northern Hemisphere (a), Southern Hemi-          cles in the state vector impacts the retrieval of surface pres-
sphere (b), and the global difference (c). Panel (c) compares 5AI–   sure. The air mass dependence, exhibited in 5AI-NS results
ACOS difference for nadir and target OCO-2.                          and shown in Fig. 2, appears to be reduced or even removed
                                                                     for the 5AI-AER results. Indeed, neglecting scattering parti-
                                                                     cles results in neglecting the backscattered photons that leads
                                                                     to forward a priori synthetic measurements being less intense

Atmos. Meas. Tech., 14, 4689–4706, 2021                                                 https://doi.org/10.5194/amt-14-4689-2021
M. Dogniaux et al.: The Adaptable 4A Inversion (5AI): description and first retrievals 4699 Figure 8. Retrieved surface pressure air mass dependence (a) for all 5AI-NS target OCO-2 soundings (light grey), 5AI-NS soundings selected in the small subsample that passed all filters (black), and the corresponding 5AI-AER (red) and ACOS (blue). Distributions of surface pressure degrees of freedom are shown (b) for 5AI-NS (black), 5AI-AER (red) and ACOS (blue). Figure 9. The 5AI-NS (a), 5AI-AER (b), and raw ACOS B8r (c) OCO-2 target XCO2 retrieval results compared to the TCCON official XCO2 product. Individual sounding results are averaged for every target session. Markers show the session average for OCO-2 and TCCON XCO2 , and error bars show the standard deviations. than those actually measured. This difference is seen by the that is more similar to ACOS’s than to the 5AI-NS surface retrieval scheme as an a priori overestimation of the amount pressure degrees of freedom. When scattering particle pa- of O2 along the optical path; thus, it is seen as an overes- rameters are included in the state vector, this consequently timation of surface pressure which is then reduced. Hence, leads to a stronger pull-back of the retrieved surface pressure the −5 hPa surface pressure average bias of 5AI-NS results, towards the a priori value, also helping to reduce or even re- compared to the a priori surface pressure in Fig. 8, as op- move the air mass dependence for surface pressure. Thus, posed to the 1 hPa bias obtained with 5AI-AER for this small for reasons related to both radiative transfer and the retrieval subsample of OCO-2 target soundings. Besides, the fraction methodology, taking into account scattering particles modi- of measured backscattered photons increases with air mass, fies the average difference between retrieved and a priori sur- leading to the air mass dependence of 5AI-NS results, as face pressure and helps to remove the air mass dependence shown in Fig. 8. Furthermore, adding scattering particle pa- seen in 5AI-NS results. rameters in the retrieval state vector interferes with surface Figure 9 shows XCO2 retrieved from OCO-2 measure- pressure retrieval as the scattering particle and surface pres- ments for these 15 target sessions by the initial 5AI-NS setup sure information carried by the O2 A band is entangled. As it (Fig. 9a), this adapted 5AI-AER setup (Fig. 9b) and ACOS can be seen in Fig. 8b, this leads to lower degrees of freedom in the B8r raw results (Fig. 9c). The impact of taking into for surface pressure compared to retrievals performed with- account scattering particles in the retrievals directly trans- out scattering particle parameters in the state vector. 5AI- lates from surface pressure to XCO2 ; it appears that the dif- AER surface pressure degrees of freedom have a distribution ference of about 3 ppm exhibited in 5AI-NS results compared https://doi.org/10.5194/amt-14-4689-2021 Atmos. Meas. Tech., 14, 4689–4706, 2021
4700                                 M. Dogniaux et al.: The Adaptable 4A Inversion (5AI): description and first retrievals

Figure 10. The 5AI-AER (a) and ACOS B8r (b) OCO-2 target total AOD retrieval results compared to AERONET AOD interpolated at
755 nm. Individual sounding results are averaged for every target session. Markers show the session average for OCO-2 and AERONET
AOD, and error bars show the standard deviations.

to ACOS is reduced to a difference of close to 1 ppm in 5AI-        spectral windows fit those of the calculated 4A/OP spectrum.
AER results. This shows that taking scattering particle pa-         Such comparisons must be performed and averaged over a
rameters into account can indeed explain much of the dif-           spatially and temporally unbiased data set with a homoge-
ferences between 5AI-NS results and ACOS. Regarding the             nous viewing geometry in order to cancel out possible de-
retrieved optical depths, Fig. 10 shows 5AI-AER and ACOS            pendences. Thus, it is performed here for a randomly chosen
retrieved total AOD compared to AERONET reference data              half of the nadir OCO-2 points with an air mass below 3.0 se-
interpolated at 755 nm. 5AI-AER exhibits a higher average           lected in 2016 (6790 in total). Figure 11 shows the resulting
difference to AERONET than ACOS, but both retrieval al-             averaged calc–obs spectral residuals and the corresponding
gorithms exhibit a considerable scatter of their results com-       average OCO-2 measurement. Differences are principally lo-
pared to AERONET. Efforts to optimise 4A/OP coupling                cated in the 0.7 µm O2 absorption band but also in the 1.6
with (V)LIDORT are underway so that more OCO-2 data can             and 2.0 µm CO2 absorption bands. They are due to the dif-
be processed. Once those are completed, a dedicated study           ferences in inverse setup and in radiative transfer models be-
will help to tune the 5AI scattering particle setup better (vary-   tween ACOS and 5AI (impact of aerosols, parameterisation
ing aerosol types, impact of cirrus clouds, varying layer alti-     of continua, spectroscopy, etc.).
tudes, etc.).                                                          In order to compare 5AI retrievals with ACOS products
                                                                    while attenuating the impact of the forward and inverse mod-
5.2    Sensitivity of raw retrieval results to inverse and          elling differences, the obtained averaged calc–obs residual is
       forward modelling                                            added to every OCO-2 measurements within the complemen-
                                                                    tary half of the selected nadir soundings from 2016 (6799 in
A difference of about 3 ppm is found between 5AI and ACOS           total). We then apply the 5AI inverse scheme on this new
raw XCO2 retrieved from OCO-2 for both nadir and target             data set. Fig. 12 compares the distributions of 5AI–ACOS
observations. In Sect. 5.1 we show that neglecting scattering       retrieval results obtained with and without the calc–obs ad-
particles for computational time purposes can explain most          justment. The systematic differences between 5AI and ACOS
of this difference. However, the 5AI-AER retrieval setup            results for XH2 O , XCO2 , surface pressure, and global temper-
does not exactly reproduces ACOS setup, as state vector, for-       ature profile shift are fully removed when adding the spec-
ward radiative transfer, and spectroscopic parameter differ-        tral residual adjustment to OCO-2 measurements (remain-
ences remain. All those can be encompassed and accounted            ing differences are negligible compared to standard devia-
for by using an average calculated–observed spectral resid-         tions). This XCO2 shows that 5AI can, on average, reproduce
ual analysis (hereafter calc–obs). It consists in calculating a     ACOS results when all their respective differences are com-
spectrum (convolved to OCO-2 instrument line shape) based           pensated with a calc–obs adjustment. However, it impacts the
on the ACOS retrieval results (posterior pressure grid, tem-        standard deviations of 5AI–ACOS differences. Indeed, only
perature, H2 O, and CO2 profiles as well as albedo and albedo       ACOS raw results that relate to the 5AI state vector parame-
slope) and comparing it to the corresponding OCO-2 ob-              ters have been used to compute the calculated spectrum used
servation. Possible background differences are also compen-         in this calc–obs analysis, and other ACOS parameters, such
sated by scaling the OCO-2 spectrum so that its transparent         as scattering particles for instance, have not been considered.

Atmos. Meas. Tech., 14, 4689–4706, 2021                                              https://doi.org/10.5194/amt-14-4689-2021
M. Dogniaux et al.: The Adaptable 4A Inversion (5AI): description and first retrievals 4701
Figure 11. 5AI–ACOS average calc–obs spectral residuals in the O2 A band (a), CO2 weak band (b), and CO2 strong band (c) appear in
thick black lines (left axis). A typical spectrum for the three bands is shown in thin grey lines (right axis).
Their impact may be attenuated by the background difference
correction, which, if disabled, leads to a similar standard de-
viation of 5AI–ACOS differences in both with and without
calc–obs cases. However, without the background compen-
sation, the average difference between 5AI–ACOS is only
reduced to 1.9 ppm for XCO2 (not shown). This exemplifies
how highly challenging the sounding-to-sounding intercom-
parison of retrieval results remains and highlights how for-
ward modelling and retrieval setup design impact XCO2 re-
trieval results.
6 Conclusions
In this work, we have introduced the 5AI inverse scheme; it
implements the optimal estimation algorithm and uses the
4A/OP radiative transfer model with the GEISA spectro-
scopic database and an empirically corrected absorption con-
tinuum in the O2 A band. We have applied the 5AI inverse
scheme to retrieve XCO2 from a sample of ∼ 44k OCO-2
soundings that compromises between coverage and the low-
Figure 12. 5AI raw ACOS B8r difference distributions for
est ACOS-retrieved total AOD. We neglected the impact of
XH2 O (a), XCO2 (b), surface pressure (c), and temperature profile scattering particles for computational time purposes and ob-
global shift (d) shown without applying the average calc–obs spec- tained a global averaged uncorrected bias compared to TC-
tral residual correction (in blue) and with the correction (in red). CON of 1.30 ppm, with a standard deviation of 1.32 ppm for
air masses below 3.0. These results are comparable in stan-
dard deviation with those obtained by ACOS on the corre-
https://doi.org/10.5194/amt-14-4689-2021 Atmos. Meas. Tech., 14, 4689–4706, 20214702 M. Dogniaux et al.: The Adaptable 4A Inversion (5AI): description and first retrievals
sponding set of OCO-2 soundings. Moreover, we showed TW provided the TCCON data. MD wrote this article, with feed-
that, similarly to ACOS, 5AI XCO2 retrievals satisfactorily back from all co-authors.
capture the global increasing trend of atmospheric CO2 , its
seasonal cycle, and its latitudinal variations, and that 5AI re-
sults are consistent between OCO-2 nadir and target modes. Competing interests. The authors declare that they have no conflict
Although 5AI exhibits a difference of about 3 ppm compared of interest.
to ACOS, we showed that neglecting scattering particles can
explain most of it. Indeed, 5AI–ACOS average difference is
reduced to 1 ppm when accounting for the optical depths of Acknowledgements. The authors would like to thank the ACOS
team and NASA for OCO-2 data availability. We thank the
two coarse- and fine-mode aerosol layers in 5AI state vector,
AERONET team for the whole database availability and especially
respectively. This is in part due to how taking into account Jochen Stutz, Brent Holben, Toshihiko Takemura, Rigel Kivi, Veijo
scattering particles impacts the retrieval of surface pressure, Aaltonen, Francois Ravetta, and Jacques Pelon for their effort in es-
which becomes closer to ACOS. The air mass dependence tablishing and maintaining Caltech, Ascension Island, Saint-Denis,
of the 5AI retrieved surface pressure is also reduced. Finally, Réunion, Fukuoka, Sodankylä, and Paris AERONET sites. Finally,
we showed that 5AI can on average reproduce ACOS results we would like to thank the two anonymous referees whose com-
when adding to OCO-2 measurements an average calc–obs ments and advice significantly improved the quality of this paper.
spectral residual correction. It encompasses all the inverse The TCCON site at Réunion is operated by the Royal Belgian
and forward differences between 5AI and ACOS, and, thus, Institute for Space Aeronomy, with financial support, since 2014,
underlies the critical sensitivity of retrieval results to the in- from the EU project ICOS-INWIRE and the ministerial decree for
verse setup design and forward modelling. ICOS (grant nos. FR/35/IC1 to FR/35/C5) and local activities sup-
ported by LACy/UMR8105 at Université de La Réunion. The TC-
For favourable conditions (all the best ACOS flags and
CON stations at Tsukuba and Burgos are supported, in part, by
lowest ACOS retrieved total AOD possible), we showed that
the GOSAT series project. Local support for Burgos is provided
5AI is a reliable implementation of the optimal estimation al- by the Energy Development Corporation (EDC, Philippines). The
gorithm, whose results can be compared to ACOS raw prod- Paris TCCON site has received funding from Sorbonne Univer-
ucts. Efforts are underway in order to optimise and increase sité, the French research centre CNRS, the French space agency
the speed of 4A/OP coupling with (V)LIDORT. Finally, the CNES, and Région Île-de-France. The Ascension Island TCCON
implementation of the 5AI retrieval scheme is intended to station has been supported by the European Space Agency (ESA;
be compatible with 4A/OP structure, so that the code can grant no. 4000120088/17/I-EF) and by the German Bundesminis-
be easily adapted to any current or future greenhouse gas terium für Wirtschaft und Energie (BMWi; grant nos. 50EE1711C
monitoring instrument, from TCCON, EM27/SUN (e.g. Gisi and 50EE1711E). We thank the ESA Ariane Tracking Station at
et al., 2012; Hase et al., 2016), and OCO-2 to MicroCarb North East Bay, Ascension Island, for hosting and local support.
Nicholas M. Deutscher is funded by an ARC Future Fellowship
or Copernicus CO2 Monitoring (CO2 M; Meijer and Team,
(grant no. FT180100327). Darwin and Wollongong TCCON sta-
2019), and can even be applied to research concepts such as
tions are supported by ARC (grant nos. DP160100598, LE0668470,
the one proposed in the European Commission Horizon 2020 DP140101552, DP110103118, and DP0879468) and NASA (grant
project of SCARBO (Space CARBon Observatory; Brooker, nos. NAG5-12247 and NNG05-GD07G).
2018).
Financial support. This work has received funding from CNES and
Data availability. For this work, we use the B8r of OCO-2 data CNRS. Matthieu Dogniaux has been funded by Airbus Defence
that were produced by the OCO-2 project at the Jet Propulsion Lab- and Space in the framework of a scientific collaboration with École
oratory, California Institute of Technology, and obtained from the polytechnique.
OCO-2 data archive maintained at the NASA Goddard Earth Sci-
ence Data and Information Services Center (NASA GES-DISC).
All TCCON references are given in Table 2. AERONET data are Review statement. This paper was edited by Abhishek Chatterjee
available from the AERONET website (https://aeronet.gsfc.nasa. and reviewed by two anonymous referees.
gov/new_web/download_all_v3_aod.html, last access: 25 May
2021, Stutz et al., 2021). 5AI retrieval results presented in this
work are available, upon emailed request, from Matthieu Dogniaux
(matthieu.dogniaux@lmd.ipsl.fr).
References
Basu, S., Guerlet, S., Butz, A., Houweling, S., Hasekamp, O., Aben,
Author contributions. MD developed 5AI and tested it on the I., Krummel, P., Steele, P., Langenfelds, R., Torn, M., Biraud, S.,
OCO-2 soundings under the supervision of CC, with input and sup- Stephens, B., Andrews, A., and Worthy, D.: Global CO2 fluxes
port from CC, RA, VirC, TD, and VinC. MDM, NMD, DGF, OEG, estimated from GOSAT retrievals of total column CO2 , At-
DWTG, FH, LTI, RK, IM, JN, DFP, CMR, KS, KS, YT, VAV, and mos. Chem. Phys., 13, 8695–8717, https://doi.org/10.5194/acp-
13-8695-2013, 2013.
Atmos. Meas. Tech., 14, 4689–4706, 2021 https://doi.org/10.5194/amt-14-4689-2021You can also read


