West Coast District - District Health Plan 2018/19 to 2020/21 - Department of Health

Page created by Jimmy Mendoza
 
CONTINUE READING
West Coast District - District Health Plan 2018/19 to 2020/21 - Department of Health
West Coast District

     Western Cape

              District Health Plan
                    2018/19 to 2020/21
West Coast District - District Health Plan 2018/19 to 2020/21 - Department of Health
1.     EXECUTIVE SUMMARY BY THE DISTRICT MANAGER

Towards Health Care 2030 a significant principle relates to a people-centred health care
approach. The Department has adopted the Whole of Society Approach where the community
will increasingly become an equal active stakeholder during the inter-sectoral planning towards
the improvement of services.      Furthermore, the Health Facility Boards Act instruction for Clinic
Committees is also reaching fruition in 2018/19! A highlight to really give full effect to the integrated
Community/Health Care model, was the visit of the Provincial Minister of Health to engage with
Hospital Boards, Municipal Boards and also do oversight at some of our facilities, together with
street meetings.    Valuable feedback was given by the end users of our services, being the
communities and a number of recommendations will be implemented in 2018/19. For the next
MTEF period, the Department of Health will be challenged to provide essential health care services
due to budgetary constraints. The Department has therefore embarked upon the Management
Efficiency Alignment Programme (MEAP) in order to gain efficiencies with savings. There will also be
an impact upon the Meso Operational level (District Office), more so in 1819. In addition to these
constraints, the Western Cape is experiencing a dire drought and all efforts are being made to
ensure that health care services at our hospitals and PHC facilities will continue throughout.
Our main priorities for 1819 based upon the provincial ones are:
      The separation of cross border sub district management in Matzikama, Cederberg, Bergrivier
        and Swartland SDs must be prioritised and funded to ensure management efficiency
        alignment
      The Operational MESO structure needs to be finalized to create synergy and to address the
        scarcity of resources at Micro level
      Mental health services must be strengthened and policy directions expected to be finalized
        and supported by the Strategic MESO
      Full implementation of COPC site interventions in all sub districts
      Supply chain must be geared to support services
      The improvement of QA will be enhanced through the appointment of two Quality
        Assurance Coordinators
With reference to PHC Services important priorities are to:
      Achieve ideal clinic status though there are a number of challenges beyond our control
        that impact upon this ideal;
      Reduce morbidity (or increase coverage indicators) through the identification of the COPC
        pilot sites, commencing with strategies to address social ills and focusing on the WOSA for
        positive spin-offs over time with improved health outcomes in future. Prevention needs to
        start within the 1st 1000 days strategy, continue into primary and secondary education and
        the DOE needs to be influenced into curriculum changes and development.
      Reduce mortality: The 1st 1000 days strategy remains a key programmatic focus.

                                                                                                       2
Towards improved District Hospital Services, we need to achieve higher levels of compliance with
National Core Standards, namely to:
     Ensure that QIP’s are in place and Implemented.
     Maintain and appraise strengths of facilities
     Continue training and Support iro the National Core Standards domains
We also need to reduce mortality. Secondly we have to lower morbidity through amongst others:
     Mental health screening and ESMOE
     Strengthening the PMTCT care in hospitals
     Mental health services iro 72 hour assessments and full support from psychiatrists.
     Clinical governance and holistic management of chronic disease of lifestyle with seamless
       referrals to PHC level

A large number of maintenance and Engineering Infrastructure projects were completed boasting
improved facilities for higher quality health care and staff satisfaction. The Way Finding Signage
project is nearly complete and it will ease the finding of our facilities by patients.        A major
achievement was the creation of the Eye Care Centre in Vredendal, being a Public-Private and
community partnership.
With regard to our People Management, the following foci will be important in 2018/19:
     Over the next MTEF period, there will be an impact upon the constant filling of all of our
       posts
     Improving sick leave management will remain a priority.
     2 wellness posts were added to our establishment.
     Since Quality of Care is such an important priority leading to 2030, two Quality Coordinator
       posts have been added to our establishment
     The concept of less than 50-bed hospitals is an ongoing challenge to manage since a
       critical mass of staff is required to provide the package of care. Citrusdal and Clanwilliam
       Hospital will form a cluster to promote service delivery inclusive of all support services as of
       the 1st of April 2017.
As far as Finances and Supply Chain are concerned the department had a shortfall of R143 million
for the 2017/18 financial year and the West Coast District contribution to the budget cuts was R5.1
million. The budget for the department therefore decreased in real terms while patient numbers
increased. Measures are in place, but the services will obviously be affected though we try to
ameliorate the impact by working smarter and more efficiently. Measures were put in place in
2017/18 and will be during 2018/19 to mitigate the challenges.

                                                                                                     3
2.   ACKNOWLEDGEMENTS

     Alderman Cleophas is the Chairperson of our District Health Committee, and his involvement
     in our District Health planning processes is appreciated, as well as his ongoing contribution
     to the District Health Council being joint partners in our District Health Services to the
     communities in the West Coast.

     The following District Office staff members are once again commended for their
     contribution to the District Health Plan:
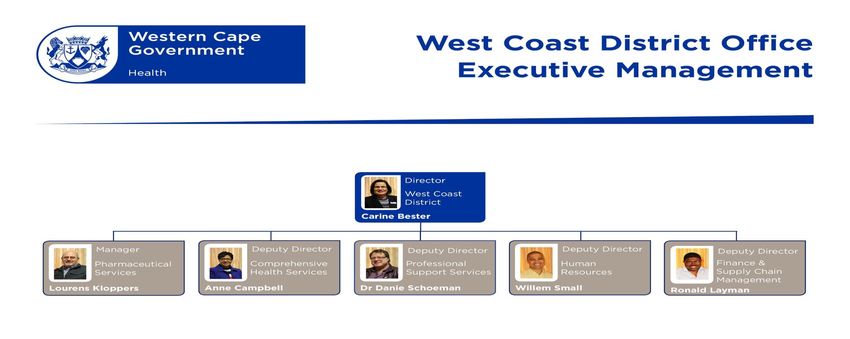
            Mrs C. Bester
            Dr. D. Schoeman
            Mrs A. Campbell
            Mr R. Layman
            Adv. W. Small
            Mrs R. Muller
            Mrs L. Lötter

                                                                                                4
3.     OFFICIAL SIGN OFF

       It is hereby certified that this District Health Plan:

             Was developed by the district management team of West Coast District with the technical
              support from the Chief Directorate: Rural District Health Services and the Strategic Planning
              unit at the provincial head office.
             Was prepared in line with the current Strategic Plan and Annual Performance Plan of the
              Western Cape Department of Health.

Dr R Crous
Chief Director: Rural District Health Services                                  SIGNATURE

                                                                                   DATE

Dr K Cloete
Chief of Operations                                                             SIGNATURE

                                                                                   DATE

Dr B Engelbrecht
Accounting officer (Head of Department)                                         SIGNATURE

                                                                                   DATE

                                                                                                         5
4.       TABLE OF CONTENTS

1.        EXECUTIVE SUMMARY BY THE DISTRICT MANAGER ............................................................. 2
2.        ACKNOWLEDGEMENTS .......................................................................................................... 4
3.        OFFICIAL SIGN OFF................................................................................................................. 5
4.        TABLE OF CONTENTS ............................................................................................................... 6
5.        LIST OF ACRONYMS ................................................................................................................ 7
6.        EPIDEMIOLOGICAL PROFILE ................................................................................................ 10
6.1       GEOGRAPHIC OVERVIEW .................................................................................................... 10
6.2       DEMOGRAPHIC OVERVIEW ................................................................................................. 11
6.3       SOCIAL DETERMINANTS OF HEALTH .................................................................................... 14
6.4       CAUSES OF MORTALITY ........................................................................................................ 16
6.5       BURDEN OF DISEASE ............................................................................................................. 18
7.        SERVICE DELIVERY PLATFORM AND MANAGEMENT ......................................................... 19
7.1       HEALTH FACILITIES PER SUB-DISTRICT .................................................................................. 19
7.2       HUMAN RESOURCES FOR HEALTH (FILLED POSTS) ............................................................. 20
7.3       BASELINE DATA 2016/17 ...................................................................................................... 23
8.        QUALITY OF CARE ................................................................................................................. 30
9.        ORGANISATIONAL STRUCTURE OF THE DISTRICT MANAGEMENT TEAM .......................... 32
10.       DISTRICT HEALTH EXPENDITURE ............................................................................................ 33
11.       DISTRICT PERFORMANCE INDICATORS ............................................................................... 34
11.1      DISTRICT HEALTH SERVICES .................................................................................................. 34
11.2      DISTRICT HOSPITALS .............................................................................................................. 37
11.3      HIV AND AIDS, STIs AND TB CONTROL (HAST) ................................................................... 40
11.4      MATERNAL, CHILD AND WOMEN’S HEALTH (MCWH) AND NUTRITION............................ 44
11.5      DISEASE PREVENTION AND CONTROL ................................................................................ 50
12.       DISTRICT FOCUS FOR THE YEAR ........................................................................................... 52
ANNEXURE A: WEST COAST DISTRICT POPULATION ESTIMATES BY AGE ..................................... 53
ANNEXURE B: TARGETS FOR SDG 3 – “GOOD HEALTH AND WELL-BEING” ................................. 54
ANNEXURE C: FACILITY LIST ............................................................................................................. 55
ANNEXURE D: TECHNICAL INDICATOR DESCRIPTIONS ................................................................. 58
ANNEXURE E: COMMUNICATION PLAN FOR DISTRICT HEALTH PLAN.......................................... 70

                                                                      6
5.   LIST OF ACRONYMS

     AIDS         Acquired immune deficiency syndrome
     ALOS         Average length of stay
     APL          Approved post list
     APP          Annual Performance Plan
     ART          Anti-retroviral treatment
     BANC         Basic antenatal care
     BUR          Bed utilisation rate
     CBS          Community-based services
     CDC          Community day centre
     CDU          Chronic dispensing unit
     CHC          Community health centre
     CHW          Community health worker
     COPC         Community oriented primary care
     COPD         Chronic obstructive pulmonary disease
     DHC          District Health Council
     DHER         District Health Expenditure Review
     DHP          District Health Plan
     DHS          District Health Services/Systems
     DR TB        Drug resistant TB
     EC           Emergency centre
     eCCR         Electronic Continuity of Care
     EDR          Electronic drug-resistant TB register
     EMS          Emergency medical services
     EPWP         Expanded Public Works Programme
     ESMOE        Essential Steps in the Management of Obstetric Emergencies
     ETR.net      Electronic TB register
     GSA          Geographic service area
     HAST         HIV and AIDS, STIs and TB control
     HCBC         Home and community based care
     HCT          HIV counselling and testing
     HIV          Human immunodeficiency virus
     HPV          Human papillomavirus
     HR           Human resource
     ICD-10       International classification of disease coding
     ICT          Information and communication technology
     ID           Infectious diseases
     JAC          Electronic Pharmacy Management Inventory System
     LG           Local government

                                                                               7
M&E        Monitoring and evaluation
MDG        Millennium development goal
MDR-TB     Multi-drug resistant tuberculosis
MHS        Municipal Health Services
MMC        Medical male circumcision
MOU        Midwife obstetric unit
MTEF       Medium-term expenditure framework
MTSF       Medium-term strategic framework
NCS        National core standards
NDP        National Development Plan
NHLS       National Health Laboratory Services
NIMART     Nurse Initiated Management of Anti-retroviral Therapy
NPO        Non-profit organisation
OPD        Outpatient department
OSD        Occupational specific dispensation
PACK       Practical Approach to Care Kit
PCE        Patient centred experience
PCR        Polymerase chain reaction
PCV        Pneumococcal conjugate vaccine
PDE        Patient day equivalent
PHC        Primary health care
PHCIS      Primary Health Care Information Systems
PMTCT      Prevention of mother-to-child transmission
PPIP       Perinatal problem identification programme
PTB        Pulmonary tuberculosis
QA         Quality Assurance
QIP        Quality improvement plan
RCS        Rural clinical school
RDHS       Rural District Health Services
RIC        Retention in care
SAM        Severe acute malnutrition
SCM        Supply chain management
SD         Sub-district
SDG        Sustainable development goal
STI        Sexually transmitted infection
TB         Tuberculosis
TBSAP      TB South African Projection USAID
TIER.net   HIV electronic register
VPUU       Violence Prevention through Urban Upgrading
WCG        Western Cape Government

                                                                   8
WCGH     Western Cape Government Health
WCCN     Western Cape College of Nursing
WHO      World Health Organisation
WoW      Western Cape on wellness
XDR-TB   Extreme drug resistant tuberculosis
YTD      Year to date

                                               9
6.    EPIDEMIOLOGICAL PROFILE

6.1   GEOGRAPHIC OVERVIEW

      The West Coast is one of five rural district municipalities in the Western Cape Province and
      includes several coastal holiday resorts and an ore-export harbour at Saldanha Bay.

      The district consists of five local municipalities, namely Bergrivier, Cederberg, Matzikama,
      Saldanha Bay and Swartland.

      The district office for Western Cape Government: Health (WCG: Health) is situated in Malmesbury
      in the Swartland Sub-district. There are 66 primary health care (PHC) facilities in the district of
      which 26 are fixed facilities. There are seven district hospitals and two TB hospitals: Malmesbury
      Infectious Diseases Hospital (located in Swartland Sub-district) and Sonstraal Hospital (located in
      Drakenstein Sub-district in the Cape Winelands District, but managed as part of a TB complex
      with Malmesbury ID Hospital). Swartland Hospital burnt down on the18th of March 2017 and the
      services have been reorganised into an Interim Service Delivery Platform.

                                                                                                      10
Figure 1: Map of West Coast District

      [Source: https://municipalities.co.za/map/147/west-coast-district-municipality]

6.2   DEMOGRAPHIC OVERVIEW

      The National Department of Health distributed revised population estimates during 2017,
      based on the mid-year population estimates received from Stats SA for 2002 to 2016 and the
      short term projections for 2017 to 2021.

      The revised population estimates reflect financial years rather than calendar years as was
      previously the case. These estimates will be implemented from 2018/19 going forward and is
      reflected in the tables below.

                                                                                             11
Table 1: Sub-district population size and density 2016/17

Sub-district            Town(s)                      Total                  Geographic area        Population
                                                     population(A)          (per km²)(B)           density
Bergrivier             -   Aurora                                 69 262                   4 407                16
                       -   Eendekuil
                       -   Piketberg
                       -   Porterville
                       -   Redelinghuys
                       -   Velddrif
Cederberg              -   Citrusdal                              55 301                   8 007                 7
                       -   Clanwilliam
                       -   Elands Bay
                       -   Graafwater
                       -   Lamberts Bay
                       -   Leipoldtville
                       -   Wupperthal
Matzikama              -   Bitterfontein                          73 387                  12 981                 6
                       -   Doring Bay
                       -   Ebenhaezer
                       -   Klawer
                       -   Kliprand
                       -   Koekenaap
                       -   Lutzville
                       -   Molsvlei
                       -   Nuwerus
                       -   Putsekloof
                       -   Rietpoort
                       -   Stofkraal
                       -   Strandfontein
                       -   Vanrhynsdorp
                       -   Vredendal
Saldanha Bay           -   Hopefield                             113 479                   2 015                56
                       -   Jacobs Bay
                       -   Langebaan
                       -   Paternoster
                       -   Saldanha
                       -   St Helena Bay
                       -   Vredenburg
Swartland              -   Abbotsdale                            127 573                   3 707                34
                       -   Chatsworth
                       -   Darling
                       -   Grotto Bay
                       -   Kalbaskraal
                       -   Koringberg
                       -   Malmesbury
                       -   Moorreesburg
                       -   Riebeeck Kasteel
                       -   Riebeeck West
                       -   Riverlands
                       -   Yzerfontein
District total                                                   439 003                  31 119                14
[Source A: Circular H11/2018: Population data]
[Source B: https://municipalities.co.za/overview/147/west-coast-district-municipality ]

                                                                                                                12
West Coast District is the rural district with the second lowest population density after the
Central Karoo. The sub-districts consist of several towns and small dwellings that are spread
out over a large surface area which pose its own service delivery challenges.

Figure 2: Sub-district population distribution in West Coast District 2016/17

                                                              Bergrivier
                                                               15.8%

                                      Swartland
                                        29.1%

                                                                      Cederberg
                                                                        12.6%

                                                                  Matzikama
                                                                    16.7%
                                           Saldanha
                                             25.8%

[Source: https://municipalities.co.za/overview/147/west-coast-district-municipality ]

Although there is a 1.6% decrease between the total population estimates for 2018/19 (i.e.
all age groups) that were release in 2014 and 2017 respectively, there is a 24.6% increase in
the population under 1 year. This will have a significant impact on the district’s performance
for indicators that use the population under 1 year as denominator, e.g. the immunisation
coverage.

For more detailed information on the population breakdown per age group for the district,
refer to Annexure A.

                                                                                           13
Figure 3: West Coast District population pyramid for 2016/17

        80 years and older
               75 - 79 years
               70 - 74 years
               65 - 69 years
               60 - 64 years
               55 - 59 years
               50 - 54 years
               45 - 49 years
               40 - 44 years
               35 - 39 years
               30 - 34 years
               25 - 29 years
               20 - 24 years
               15 - 19 years
               10 - 14 years
                 5 - 9 years
              Under 5 years

                          -25 000 -20 000 -15 000 -10 000 -5 000       0     5 000   10 000 15 000 20 000 25 000

                                                        Male     Female

      [Source: Circular H11/2018: Population data]

6.3   SOCIAL DETERMINANTS OF HEALTH

      Social determinants may have an impact on the health status outcomes of the district
      population.

      Table 3: Household dynamics in the West Coast District 2016

      Age groups                                         Ceder-         Matzi-       Saldanha
                                         Bergrivier                                                 Swartland   District
                                                          berg          kama           Bay
      Households                              19 072        15 279         20 821        35 550        39 139    129 862
      Average household size                      3.5            3.5           3.4            3.1         3.4         3.4
      Female headed households                 35.4%         35.0%         33.1%          32.9%         30.4%      32.8%
      Formal dwellings                         91.7%           78.1%       88.1%          74.8%         94.6%      85.8%
      Housing owned                            60.9%           56.8%       51.5%          72.4%         65.0%      63.3%
      [Source: https://municipalities.co.za/overview/147/west-coast-district-municipality ]

      Note: The highest and lowest value for each item is coloured orange and green respectively.

                                                                                                                      14
Figure 4: West Coast District education levels 2016

                                                   Education levels by sub-district

                                                                                                              32.2%
    35.0%

                                                                                        30.0%

                                                                                                                                    29.1%
                                                                 28.9%
                     26.3%
    30.0%

                                           23.2%
    25.0%

    20.0%

    15.0%
                             9.6%

                                                                                                                      8.9%
                                                   7.6%

                                                                                                                                            7.6%
    10.0%

                                                                                                6.3%
                                    5.7%

                                                                         5.5%

                                                                                                       4.9%

                                                                                                                             3.8%
                                                          3.3%
              3.1%

                                                                                 2.5%
     5.0%

     0.0%
              Bergrivier            Cederberg             Matzikama             Saldanha Bay           Swartland               District

                                             No schooling            Matric      Higher education

[Source: https://municipalities.co.za/overview/147/west-coast-district-municipality ]

Figure 5: West Coast District household services 2016

                                              Household services by sub-district
    120.0%
                                                                                                            98.7%
                   97.7%

                                                                97.0%

                                                                                                                                  93.8%
                                                              91.5%
                                            90.3%

                                                             88.7%

                                                                                     86.5%

                                                                                                        86.2%
                                                                                     85.9%
               85.3%

                                                                                                                               85.2%
                                                                                                       84.0%

    100.0%
              83.6%

                                                                                                       83.5%

                                                                                                                              83.4%
                                         83.0%
              82.8%

                                                                                    82.6%
                                                          80.3%

                                                                                                                             79.9%
                                                                                 74.8%
                                      74.3%
                                    68.6%

     80.0%

     60.0%

     40.0%

     20.0%

      0.0%
                Bergrivier          Cederberg             Matzikama             Saldanha Bay           Swartland               District

             Flush toilet connected to sewerage                                           Weekly refuse removal
             Piped water inside dwelling                                                  Electricity for lighting

[Source: https://municipalities.co.za/overview/147/west-coast-district-municipality ]

.

                                                                                                                                                   15
Figure 6: Main economic sectors in West Coast District

        Community, social                                                             Other, 1.0%
          and personal
          services, 4.0%

      Construction, 5.0%
                                                                  Finance, insurance,
                                                                    real estate and
                                                                   business services,
       Transport, storage                                                24.0%
      and communication,
             9.0%

                                    General
                                government, 11.0%

                                                                               Manufacturing,
                                  Wholesale and retail
                                                                                  18.0%
                                  trade, catering and
                                   accommodation,
                                         13.0%
                                                    Agriculture, forestry
                                                     and fishing, 15.0%

      [Source: https://municipalities.co.za/overview/147/west-coast-district-municipality ]

6.4   CAUSES OF MORTALITY

      Table 4: Leading underlying natural causes of death, Western Cape, 2015

                   Cape                                                                                            Western
        Rank                   Central Karoo    Cape Town           Eden           Overberg       West Coast
                 Winelands                                                                                          Cape

                               Chronic lower                                      Ischaemic
                                                  Diabetes                                                         Diabetes
                HIV disease     respiratory                     Tuberculosis         heart       Tuberculosis
          1                                        mellitus                                                         mellitus
                   (7.2%)        diseases                          (7.0%)           diseases        (7.9%)
                                                   (7.5%)                                                           (7.2%)
                                  (9.1%)                                             (7.1%)

               Cerebrovasc                                                       Cerebrovasc        Diabetes
                                Tuberculosis    HIV disease     HIV disease                                      HIV disease
          2    ular diseases                                                     ular diseases       mellitus
                                   (6.7%)          (6.3%)          (6.7%)                                           (6.1%)
                  (6.9%)                                                            (6.6%)           (7.4%)

                                                                                   Malignant
                                                 Ischaemic                                                        Ischaemic
                 Diabetes      Cerebrovasc                     Cerebrovasc       neoplasms of    Cerebrovasc
                                                    heart                                                            heart
          3       mellitus     ular diseases                   ular diseases         resp &      ular diseases
                                                   diseases                                                         diseases
                  (6.7%)          (6.2%)                          (6.6%)         intrathoracic      (7.2%)
                                                    (5.7%)                                                           (5.8%)
                                                                                 organs (6.5%)

                                                                 Ischaemic                       Chronic lower
                                               Cerebrovasc                         Diabetes                      Cerebrovasc
                Tuberculosis    HIV disease                         heart                         respiratory
          4                                    ular diseases                        mellitus                     ular diseases
                   (6.6%)          (5.2%)                          diseases                        diseases
                                                  (4.9%)                            (6.1%)                          (5.6%)
                                                                    (6.4%)                          (6.6%)

               Chronic lower                                                     Chronic lower      Ischaemic
                                 Diabetes                         Diabetes
                respiratory                     Tuberculosis                      respiratory          heart     Tuberculosis
          5                       mellitus                         mellitus
                 diseases                          (4.5%)                          diseases           diseases      (5.3%)
                                  (5.2%)                           (6.2%)
                  (6.2%)                                                            (5.6%)             (5.8%)

                                                                                                                          16
Cape                                                                                             Western
  Rank                     Central Karoo    Cape Town          Eden         Overberg           West Coast
            Winelands                                                                                           Cape

            Ischaemic                      Chronic lower Chronic lower                                       Chronic lower
                           Hypertensive                                                     Hypertensive
               heart                        respiratory   respiratory      Tuberculosis                       respiratory
    6                        diseases                                                         diseases
              diseases                       diseases      diseases           (5.0%)                           diseases
                              (5.2%)                                                           (4.6%)
               (5.5%)                         (4.4%)        (5.8%)                                              (5.1%)

                                                             Malignant
            Malignant       Malignant       Malignant      neoplasms of     Malignant                         Malignant
                                                                                               HIV disease
    7       neoplasms       neoplasms       neoplasms          resp &       neoplasms                         neoplasms
                                                                                                  (4.6%)
              (5.0%)          (4.1%)          (4.2%)       intrathoracic      (4.9%)                            (4.5%)
                                                           organs (4.9%)

             Malignant       Malignant       Malignant                                                         Malignant
           neoplasms of    neoplasms of    neoplasms of     Malignant      Hypertensive        Malignant     neoplasms of
    8          resp &          resp &          resp &       neoplasms        diseases          neoplasms         resp &
           intrathoracic   intrathoracic   intrathoracic      (4.6%)          (4.0%)             (4.4%)      intrathoracic
           organs (5.0%)   organs (4.0%)   organs (4.2%)                                                     organs (4.5%)

                                                                                              Malignant
                            Ischaemic                      Other forms     Other forms
           Hypertensive                    Hypertensive                                     neoplasms of     Hypertensive
                               heart                        of heart        of heart
    9        diseases                        diseases                                           resp &         diseases
                              diseases                      disease         disease
              (3.3%)                          (4.1%)                                        intrathoracic       (4.0%)
                               (4.0%)                        (3.7%)          (3.3%)
                                                                                            organs (3.7%)

           Other forms      Other forms     Other forms                                        Other forms    Other forms
                                                           Hypertensive    Influenza and
            of heart         of heart        of heart                                           of heart       of heart
   10                                                        diseases       pneumonia
            disease          disease         disease                                            disease        disease
                                                              (3.4%)            (2.8%)
             (3.2%)           (3.8%)          (3.1%)                                             (2.5%)         (3.2%)

[Source: Mortality and causes of death in South Africa, 2015: Findings from death notification, Statistical Release
P0309.3]

A sub-district breakdown of the underlying natural causes of death was not included in the
above publication.

Table 5: Institutional maternal mortality rate (iMMR) in West Coast District

                                              2011                2012                    2013                2014
Deaths during pregnancy,                        1                     5                    4                    3
childbirth and puerperium
iMMR                                           19.2               101.3                   81.1                 57.6
[Source: Saving Mothers, 2014]

Note: The source listed above is the latest published Saving Mothers Report.

Noting the decrease in mortality rates can be contributed to concerted efforts in training of
clinical staff iro ESMOE, BANC, and registration of pregnant women in the Mom-Connect
program. The monthly morbidity and mortality meetings play an important role in case
discussions and to mitigate future risks and plans for improving services and care.

                                                                                                                      17
Table 6: Infant and child mortality in West Coast District

      District                                                             Infant mortality rate (< 1 year)                                                    Child mortality rate (< 5 years)
                                                                         2011                         2012                        2013                        2011                        2012                        2013
      West Coast                                                          22.4                        20.8                        22.5                         28.1                        26.1                        25.5
      [Source: Western Cape Mortality Profile 2013]

      Note: The source listed above is the latest published Western Cape Mortality Profile.

      The infant and child mortality remains on average in 20-25%. Possible reasons for not
      significantly decreasing can be contributed by the influx of seasonal workers, in-migration
      and settling into established communities or new informal settlements with poor housing
      infrastructure and services. Health seeking behaviour by migrants is delayed due to
      requirements for home affairs and legality of being in our borders of the country.

6.5   BURDEN OF DISEASE

      DISTRICT HIV AND AIDS PROFILE

      Figure 7: Antenatal Survey HIV prevalence: South Africa vs Western Cape; 1990 - 2015

                              35.0

                              30.0

                              25.0
         HIV prevalence (%)

                              20.0

                              15.0

                              10.0

                               5.0

                               0.0
                                     1990
                                            1991
                                                   1992
                                                          1993
                                                                 1994
                                                                        1995
                                                                               1996
                                                                                      1997
                                                                                             1998
                                                                                                    1999
                                                                                                           2000
                                                                                                                  2001
                                                                                                                         2002
                                                                                                                                2003
                                                                                                                                       2004
                                                                                                                                              2005
                                                                                                                                                     2006
                                                                                                                                                            2007
                                                                                                                                                                   2008
                                                                                                                                                                          2009
                                                                                                                                                                                 2010
                                                                                                                                                                                        2011
                                                                                                                                                                                               2012
                                                                                                                                                                                                      2013
                                                                                                                                                                                                             2014
                                                                                                                                                                                                                    2015

                                                                                         Western Cape                                  South Africa

      [Source: National Antenatal Sentinel HIV & Syphilis Survey Report, 2015]

                                                                                                                                                                                                                              18
Figure 8: HIV prevalence among antenatal women, 2010 - 2015

                                           HIV prevalence among antenatal women
                              35

                              30

                              25
         HIV prevalence (%)

                              20

                              15

                              10

                              5

                              0
                                   2010           2011                              2012                         2013                 2014                                     2015

                                            South Africa                                  Western Cape                      West Coast

      [Source: National Antenatal Sentinel HIV & Syphilis Survey Report, 2015]

      DISTRICT TB PROFILE

      The HIV prevalence has always reflected figures below the norm in the province. The
      increase in 2014 can be attributed to the fact that the 90/90/90 strategy was implemented
      as a National department of health initiative to test more people for HIV to ensure early
      enrolment and initiation of treatment within the PMTCT programme. The district has done
      well iro blood sample collection during the survey thus we had good coverage to be able
      to reflect reliable data.

7.    SERVICE DELIVERY PLATFORM AND MANAGEMENT

7.1   HEALTH FACILITIES PER SUB-DISTRICT

      Table 7: Health facilities per sub-district as at 31 March 2017

      Sub-district
                                                                                                                                                                                      Central/tertiary
                                                                                                                                        District hospital
                                                       outreach team
                                          Ward based

                                                                                                                                                                                                                    TB hospital
                                                                                                                                                                Regional
                                                                                                                                                                           hospital

                                                                                                                                                                                                         hospital
                                                                                    Satellite
                                                                       Mobile

                                                                                                    Clinic

                                                                                                                  CDC

                                                                                                                            CHC

      Bergrivier                                              0                 2               5            3          0         0                         2              0                             0                 0
      Cederberg                                               0                 3               1            6          0         0                         2              0                             0                 0
      Matzikama                                               0                 4               9            5          0         0                         1              0                             0                 0

                                                                                                                                                                                                                     19
Sub-district

                                                                                                                                                                                                                                                       Central/tertiary
                                                                                                                                                                                  District hospital
                                             outreach team
                                Ward based

                                                                                                                                                                                                                                                                                           TB hospital
                                                                                                                                                                                                                     Regional
                                                                                                                                                                                                                                 hospital

                                                                                                                                                                                                                                                                          hospital
                                                                                              Satellite
                                                                         Mobile

                                                                                                                           Clinic

                                                                                                                                                  CDC

                                                                                                                                                              CHC
      Saldanha                                      0                             1                       2                               8             0                0                            1                          0                                        0                       0
      Swartland                                     0                             3                       6                               3             1                0                            1                          0                                        0                       2
      District total                                0                        13                      23                           25                    1                0                            7                          0                                        0                       2
      [Source: Sinjani]

      The district strives towards improving access of services to the population we serve. The
      number of satellite clinic services bears testimony to take services to where people live to
      ensure that all pockets of society receive the correct level of care with strong referral links to
      the next platform of services. Mobile clinics, attached to fixed PHC facilities provide a 6
      weekly rotational service to persons on far outlying areas. The staff complement of the fixed
      facility renders the services on mobiles and at satellites, depleting the full staff complement
      at fixed facilities. It must be noted that access to public transport remains a big hindrance to
      access for services in remote areas.

      For a complete list of health facilities in the district, refer to Annexure C.

7.2   HUMAN RESOURCES FOR HEALTH (FILLED POSTS)

      Table 7: Filled posts as at 31 March 2017

      Sub-district
                                                                                                                                                                                                                                     Physiotherapist
                                                                                                          Enrolled nurse

                                                                                                                                                                                                      Occupational
                                                                         health worker

                                                                                                                           Professional
                                                             Community

                                                                                                                                                                                                                                                                                             Audiologist
                                                                                                                                                            Pharmacist

                                                                                                                                                                                                                     therapist

                                                                                                                                                                                                                                                                               therapist
                                                                                         assistant

                                                                                                                                                                                                                                                                  Speech
                                                                           Nursing

                                                                                                                                                                             Dentist
                                                                                                                                                  Doctor
                                   Admin

                                                                                                                                          nurse

      Bergrivier                        14                                               14                      15                       29            5            3                1                              0                      1                                 0                   0
      Cederberg                         33                                               23                      19                       40            3            3                1                              1                      0                                 1                   0
      Matzikama                         40                                               16                      25                       50            4            3                1                              1                      1                                 0                   0
      Saldanha Bay                      55                                               33                      34                       70         13              3                1                              2                      1                                 0                   0
      Swartland                         54                                               26                      34                       69         15              4                2                              1                      1                                 1                   1
      District total                196                                               112                 127                     258                40          16                   6                              5                      4                                 2                   1
      [Source: PERSAL]

                                                                                                                                                                                                                                                                                            20
      Following a year where austerity measures dictated the pace against which posts was
       to be filled, one has to realise and admire the vast resilience of our current staff, as
       even against the backdrop of this challenge service delivery requirements were still
       met.

      Given the fact that the Approved Post List were closely monitored and managed in
       conjunction with the office of the Chief Director: Rural DHS, little leeway was given for
       deviation and the staff establishment managed appropriately.

      Taking into account the influx of farm workers as well as the exacerbated workload
       and the austerity measures one have to be careful not to overexert our current staff.

      Recruitment and retention of staff is a variable that must be aptly managed.

      The Management Efficiency and Alignment Project will undoubtedly change the
       landscape of people management in the District as well as how we conduct our
       business going forward.

Analysis of staff patterns: Sick Leave

2015

Salary Levels       Total days        Number of        % of           Average       Total
                                      employees        employees      days per      Estimated
                                      using sick       using sick     employee      Cost (R’000)
                                      leave            leave
           (9-13)             1738              219       82.95%             7.94           3102
            (6-8)             2739              309       88.03%             8.86           2446
            (4-5)             2235              238       84.39%             9.39           1377
              (3)              650               83       83.84%             7.83            297
            (1-2)              963              126       88.73%             7.64            373

2016

Salary Levels    Total days          Number of        % of            Average       Total
                                     employees        employees       days per      Estimated
                                     using sick       using sick      employee      Cost (R’000)
                                     leave            leave
        (9-13)            1450                  216          79.12%          6.71           2803
         (6-8)            2451                  315          89.49%          7.78           2365
         (4-5)            1874                  242          79.34%          7.74           1240
           (3)             678                   91          79.13%          7.45            337
         (1-2)             996                  121          88.97%          8.23            403

2017

Salary Levels    Total days          Number of        % of            Average       Total
                                     employees        employees       days per      Estimated
                                     using sick       using sick      employee      Cost (R’000)
                                     leave            leave
        (9-13)            1383                  225          82.12%          6.15           2835
         (6-8)            2091                  306          89.73%          6.83           2207
         (4-5)            1868                  254          80.38%          7.35           1320
           (3)             658                   97          83.62%          6.78            349
         (1-2)             711                  112          75.17%          6.35            306

                                                                                                   21
2018 (projected total days)

Salary Levels      Total days     Number of        % of             Average         Total
                                  employees        employees        days per        Estimated
                                  using sick       using sick       employee        Cost (R’000)
                                  leave            leave
          (9-13)           1594              182          66.91%             8.76                2028
           (6-8)           2076              223          63.35%             9.31                1422
           (4-5)           2888              316          96.51%             9.14                 986
             (3)            665               72          62.61%             9.23                 224

1)   Analysis

             The profile indicates that the highest level of in the use of sick leave in terms of
              average days per employee is found within salary levels 1-8.

             The highest number of employees utilising sick leave can be found within salary
              levels 3-8.

2)   Implications

             The loss of man hours through absenteeism has a negative impact on service
              delivery as well as a negative financial impact.

             The cost factor related to employees taking sick leave is much higher for the
              department in the higher salary levels (9-13) even though less staff utilise sick
              leave when compared to other salary levels.

             Additional workload is placed on other employees.

3)   Challenges

             Managers and supervisors must manage employees’ sick leave utilization
              effectively.

             Sick leave utilisation rates should be improved across all salary levels due to the
              cost factor and the negative implications for first-line supervision and managerial
              functions.

4)   Recommendations

             Employees must be kept informed about the sick leave provisions and the
              negative implications of high levels of sick leave use.

             A tool was established and implemented in order to empower managers and
              supervisors to identify trends and address sick leave abuse.

             Sick leave is monitored through the regular distribution of sick leave profiles.

                                                                                                   22
7.3     BASELINE DATA 2016/17

Table 9: Performance indicators for District Health Services

                                                                                 District wide                                                                               Province wide
      Programme performance indicator                      Data source    Type                   Bergrivier       Cederberg      Matzikama      Saldanha       Swartland
                                               Frequency                             value                                                                                       value
                                                           / Element ID
                                                                                   2016/17       2016/17           2016/17        2016/17       2016/17        2016/17         2016/17
 SECTOR SPECIFIC INDICATORS
 1.      Ideal clinic (IC) status rate          Annual                     %           14.8%          66.7%           16.7%          20.0%           0.0%           0.0%            17.2%
                                   Numerator                    3                            4                2              1              1              0             0               47
                                Denominator                     2                          27                 3              6              5              8             5            273
 2.      PHC utilisation rate (annualised)     Quarterly                  No               1.8           1.6             2.3            2.2           1.8             1.6              2.3
                                   Numerator                    6                    803 161        113 396          124 505        159 568       198 952         206 740      14 413 350
                                Denominator                     7                    439 003         69 262           55 301         73 387       113 479         127 573        6 318 281
 3.      Complaint resolution within 25        Quarterly                   %           96.2%         100.0%           87.5%         100.0%          93.9%          97.4%            95.6%
         working days rate (PHC facilities)
                                   Numerator                   10                          128            13             14             33             31             37            3 175
                                Denominator                     8                          133            13             16             33             33             38            3 320

                                                                                      23
Table 10: Performance indicators for District Hospitals

                                                                  Data             District wide                                                                                   Province wide
      Programme performance indicator                                       Type                   Bergrivier       Cederberg       Matzikama       Saldanha       Swartland
                                                   Frequency    source /               value                                                                                           value
                                                               Element ID
                                                                                     2016/17       2016/17           2016/17         2016/17        2016/17        2016/17           2016/17
 SECTOR SPECIFIC INDICATORS
 1.     Hospital achieved 75% and more             Quarterly                 %            57.1%           0.0%          100.0%          100.0%           0.0%          100.0%              69.7%
        on National Core Standards (NCS)
        self-assessment rate (district
        hospitals)
                                    Numerator                      3                           4                0              2               1               0               1               23
                                 Denominator                       4                           7                2              2               1               1               1               33
 2.     Average length of stay (district           Quarterly                Days             2.7            2.6             2.7             2.5            2.7             3.1                 3.2
        hospitals)
                                    Numerator                      7                    103 430         11 223          18 840          23 907          27 404         22 058            909 893
                                 Denominator                       8                     38 124          4 239            7 096           9 469         10 313           7 007           280 580
 3.     Inpatient bed utilisation rate (district   Quarterly                 %            77.4%          75.0%           61.4%           87.3%          92.7%           71.1%              84.8%
        hospitals)
                                    Numerator                      7                    103 430         11 223          18 840          23 907          27 404         22 058            909 893
                                 Denominator                       9                    133 605         14 967          30 663          27 378          29 568         31 028          1 072 731
 4.     Expenditure per PDE (district              Quarterly                 R           R 1 930       R 1 566          R 1 911         R 1 620        R 1 906         R 2 493            R 2 139
        hospitals)
                                    Numerator                     10                300 723 962     26 897 499       48 966 864      51 880 365     94 021 184      78 958 049      2 923 677 427
                                 Denominator                      16                    155 836         17 176          25 629          32 025          49 339         31 668          1 366 831
 5.     Complaint resolution within 25             Quarterly                 %            67.3%          72.0%           87.5%           82.4%         100.0%           41.3%              90.4%
        working days rate (district hospitals)
                                    Numerator                     19                        101              18                14              14             29             26            1 501
                                 Denominator                      17                        150              25                16              17             29             63            1 661

                                                                                                                                                                                            24
Table 11: Performance indicators for HIV and AIDS, STIs and TB control (HAST)

                                                              Data             District wide                                                                             Province wide
     Programme performance indicator                                    Type                   Bergrivier     Cederberg       Matzikama       Saldanha     Swartland
                                               Frequency    source /               value                                                                                     value
                                                           Element ID
                                                                                 2016/17       2016/17         2016/17         2016/17        2016/17      2016/17         2016/17
STRATEGIC GOAL: Promote health and wellness.
1.1.1   TB programme success rate              Quarterly                 %            80.9%          77.1%         76.0%           83.5%          81.4%         84.0%            80.4%
                                  Numerator                    1                       3 054           378           535             794            640           707           34 651
                                Denominator                    2                       3 773           490           704             951            786           842           43 099
2.1.1   ART retention in care after 12         Quarterly                 %            57.8%          64.7%         56.2%           48.9%          61.2%         56.8%            72.2%
        months
                                  Numerator                    3                       1 075           123           199             139            376           238           33 307
                                Denominator                    4                       1 861           190           354             284            614           419           46 120
2.1.2   ART retention in care after 48         Quarterly                 %            41.4%          54.4%         46.9%           39.3%          33.3%         45.5%            60.7%
        months
                                  Numerator                    5                        549              62          115                 46         166           160           19 700
                                Denominator                    6                       1 326           114           245             117            498           352           32 455
SECTOR SPECIFIC INDICATORS
1.      ART client remain on ART end of        Quarterly                No             8 910         1 062         1 643           1 161           2 958        2 086          230 931
        month - total
                                     Element                   7
2.      TB/HIV co-infected client on ART       Quarterly                 %            75.4%          66.7%         96.0%           87.5%          74.4%         81.4%            82.2%
        rate
                                  Numerator                    8                        688              66          192             182            195           193                896
                                Denominator                    9                        912              99          200             208            262           237            1 090
3.      HIV test done – total                  Quarterly                No          107 918         16 690        15 891          17 805          23 692       33 840        1 379 375
                                     Element                  10
4.      Male condoms distributed               Quarterly                No        8 967 800      1 375 600      1 268 600       1 422 800      2 611 200     2 289 600     113 913 868
                                     Element                  12
5.      Medical male circumcision – total      Quarterly                No              856            183               52          131            219           271           11 687
                                     Element                  16

                                                                                                                                                                                 25
Data             District wide                                                                                    Province wide
      Programme performance indicator                                      Type                    Bergrivier       Cederberg       Matzikama       Saldanha       Swartland
                                                  Frequency    source /               value                                                                                            value
                                                              Element ID
                                                                                    2016/17        2016/17           2016/17         2016/17        2016/17        2016/17           2016/17
6.      TB client 5 years and older start on      Quarterly                 %            95.9%           92.3%          111.9%           94.0%          94.3%           88.4%              92.9%
        treatment rate
                                   Numerator                     19                       1 932            253             452             405            350             472             21 007
                                 Denominator                     20                       2 014            274             404             431            371             534             22 612
7.      TB client treatment success rate          Quarterly                 %            80.9%           77.1%           76.0%           83.5%          81.4%           84.0%              80.4%
                                   Numerator                     21                       3 054            378             535             794            640             707             34 651
                                 Denominator                     22                       3 773            490             704             951            786             842             43 099
8.      TB client defaulter / lost to follow up   Quarterly                 %            10.4%           11.2%           12.9%           10.0%          12.5%            6.3%              10.5%
        rate
                                   Numerator                     23                        392               55                91              95             98             53            4 514
                                 Denominator                     22                       3 773            490             704             951            786             842             43 099
9.      TB client death rate                       Annual                   %             4.7%            6.1%            4.5%            4.4%           3.7%            5.3%               3.9%
                                   Numerator                     24                        178               30                32              42             29             45            1 693
                                 Denominator                     22                       3 773            490             704             951            786             842             43 099
10.     TB MDR treatment success rate              Annual                   %            54.6%           60.0%           57.1%           58.0%          43.3%           60.0%              44.6%
                                   Numerator                     25                           65                9              8               29             13               6               738
                                 Denominator                     26                        119               15                14              50             30             10            1 653

                                                                                                                                                                                           26
Table 12: Performance indicators for MCWH and Nutrition

                                                                                District wide                                                                                    Province
     Programme performance indicator                      Data source    Type                   Bergrivier       Cederberg       Matzikama       Saldanha       Swartland
                                              Frequency                             value                                                                                       wide value
                                                          / Element ID
                                                                                  2016/17       2016/17           2016/17         2016/17        2016/17        2016/17          2016/17
SECTOR SPECIFIC INDICATORS
1.     Antenatal 1st visit before 20 weeks    Quarterly                   %            73.1%          77.3%           70.0%           78.7%          67.2%           75.6%            69.6%
       rate
                                 Numerator                     1                        4 484           645             665             759           1 146          1 269           63 901
                              Denominator                      2                        6 133           834             950             964           1 706          1 679           91 849
2.     Mother postnatal visit within 6 days   Quarterly                   %            56.1%          65.5%           54.2%           52.2%          48.3%           65.1%            60.0%
       rate
                                 Numerator                     3                        2 610           328             371             422            687             802           54 816
                              Denominator                      4                        4 649           501             685             809           1 422          1 232           91 322
3.     Antenatal client start on ART rate      Annual                     %            91.2%          91.1%           83.8%          107.7%          93.3%           86.7%            90.8%
                                 Numerator                     5                          330             41                57              42         112                78          7 009
                              Denominator                      6                          362             45                68              39         120                90          7 715
4.     Infant 1st PCR test positive around    Quarterly                   %             0.6%           0.0%            1.2%            1.8%           0.0%            1.0%             0.8%
       10 weeks rate
                                 Numerator                     7                            3                0               1              1               0               1              95
                              Denominator                      8                          471             21                82              57         206             105           12 013
5.     Immunisation coverage under 1          Quarterly                   %            70.5%          58.2%           81.8%           70.0%          69.5%           73.2%            75.1%
       year
                                 Numerator                     9                        5 673           688             823             967           1 550          1 645           78 933
                              Denominator                     10                        8 048         1 182           1 007           1 381           2 231          2 248          105 108
6.     Measles 2nd dose coverage              Quarterly                   %            87.0%          77.6%           90.7%           87.5%          78.2%           98.8%            86.3%
                                 Numerator                    11                        7 025           920             916           1 211           1 751          2 227           92 898
                              Denominator                     12                        8 072         1 185           1 010           1 384           2 238          2 255          107 596
7.     Diarrhoea case fatality rate           Quarterly                   %             0.0%           0.0%            0.0%            0.0%           0.0%            0.0%             0.2%
                                 Numerator                    16                            0                0               0              0               0               0              17
                              Denominator                     17                          767             82            172             201            206             106            6 992
8.     Pneumonia case fatality rate           Quarterly                   %             0.6%           0.0%            2.3%            1.0%           0.0%            0.0%             0.4%
                                 Numerator                    18                            2                0               1              1               0               0              29
                              Denominator                     19                          310             19                44          104                83             60          7 943

                                                                                                                                                                                      27
District wide                                                                                            Province
      Programme performance indicator                        Data source    Type                        Bergrivier       Cederberg       Matzikama        Saldanha       Swartland
                                                 Frequency                             value                                                                                               wide value
                                                             / Element ID
                                                                                     2016/17            2016/17           2016/17         2016/17         2016/17         2016/17           2016/17
9.      Severe acute malnutrition case           Quarterly                   %             0.0%                0.0%              0.0%            0.0%            0.0%           0.0%              0.6%
        fatality rate
                                    Numerator                    20                            0                     0               0              0                0               0                  5
                                 Denominator                     21                            62                    1              13              10              26              12             841
10.     School Grade 1 - learners screened       Quarterly                  No                 0                233               477             520             256            673                    0
                                       Element                   22
11.     School Grade 8 - learners screened       Quarterly                  No                 0                     0               0              0                0               0                  0
                                       Element                   24
12.     Delivery in 10 to 19 years in facility   Quarterly                   %     Not required        Not required      Not required    Not required    Not required    Not required Not required
        rate                                                                           to report           to report         to report       to report       to report       to report to report
                                    Numerator                    26                                -                 -               -               -               -               - -
                                 Denominator                      4                        4 649                501               685             809           1 422          1 232            91 322
13.     Couple year protection rate (Int)        Quarterly                   %            83.3%               76.8%             99.5%           84.0%           91.2%          72.4%             78.8%
                                    Numerator                    27                     102 136              15 172            15 125          16 360          29 417         26 062         1 386 357
                                 Denominator                     28                     122 676              19 747            15 201          19 474          32 254         36 000         1 760 154
14.     Cervical cancer screening                Quarterly                   %            48.4%               33.8%             56.8%           60.8%           44.1%          50.1%             55.7%
        coverage 30 years and older
                                    Numerator                    29                        5 064                596               765           1 025           1 165          1 513            90 454
                                 Denominator                     30                       10 455              1 765             1 346           1 686           2 640          3 019           162 460
15.     HPV 1st dose                              Annual                    No                 0                378               263             493             716            764                    0
                                       Element                   31
16.     HPV 2nd dose                              Annual                    No                 0                313               254             483             713            742                    0
                                       Element                   33
17.     Vitamin A 12 - 59 months coverage        Quarterly                   %            42.4%               44.8%             44.5%           37.0%           36.4%          49.4%             48.8%
                                    Numerator                    34                       27 178              4 221             3 567           4 071           6 477          8 842           425 757
                                 Denominator                     35                       64 133              9 416             8 022          10 998          17 782         17 916           872 332

                                                                                                                                                                                                 28
District wide                                                                                            Province
      Programme performance indicator                        Data source     Type                       Bergrivier       Cederberg       Matzikama       Saldanha         Swartland
                                                 Frequency                                 value                                                                                               wide value
                                                             / Element ID
                                                                                         2016/17         2016/17          2016/17         2016/17         2016/17         2016/17               2016/17
18.     Maternal mortality in facility ratio      Annual                    No per                 39                0               0               0             117                   0                57
                                                                            100 000
                                     Numerator                   37                                 2                0               0               0               2                   0                54
                      Denominator / 100 000                      40                            0.051           0.005           0.007           0.009           0.017            0.013                0.954
19.     Neonatal death in facility rate           Annual                    No per 1                7                4              16               5               9                   1                  9
                                                                              000
                                     Numerator                   43                                33                2              11               4              15                   1               783
                         Denominator / 1 000                     38                            4.828           0.489           0.674           0.800           1.644            1.221               91.798

Table 13: Performance Indicators for District Health Services

                                                                                       District wide                                                                                         Province wide
      Programme performance indicator                        Data source     Type                       Bergrivier       Cederberg       Matzikama       Saldanha        Swartland
                                                 Frequency                                 value                                                                                                 value
                                                             / Element ID
                                                                                         2016/17        2016/17           2016/17         2016/17        2016/17         2016/17               2016/17
SECTOR SPECIFIC INDICATORS
1.      Cataract surgery rate (in uninsured      Quarterly                  No per              149                  0              0           870                 0                0               1 692
        population)                                                         million
                                     Numerator                    1                                40                0              0               40              0                0               8 050
                     Denominator / 1 000 000                      2                            0.268          0.043           0.034           0.046           0.068           0.078                  4.759
2.      Malaria case fatality rate               Quarterly                     %               0.0%                                                           0.0%             0.0%                   0.7%
                                     Numerator                    3                                0                 0              0               0               0                0                      1
                                 Denominator                      4                                13                0              0               0              11                2                   139

                                                                                                                                                                                                     29
8.   QUALITY OF CARE

     Table 14: Top 20 worst performing Ideal Clinic elements in PHC facilities 2016/17

     Nr                                           Worst performing elements
     1.    Patient record content adheres to ICSM prescripts
     2.    Adolescent and youth friendly services are provided
     3.    Staffing needs have been determined in line with WISN
     4.    Staffing is in line with WISN
     5.    Building is compliant with safety regulations
     6.    There is a functional clinic committee
     7.    Contact details of clinic committee members are visibly displayed
     8.    All external signage in place
     9.    Disinfectant, cleaning materials and equipment are available
     10.   Restore the emergency trolley daily or after every time it was used
     11.   There is an official memorandum of understanding between the district management and
           Cooperative Governance and Traditional Affairs (CoGTA)
     12.   Facility information board reflecting the facility name, service hours, physical address, contact
           details for facility and emergency service and service package details is visibly displayed at the
           entrance of the premises
     13.   All staff has received in-service training on infection control standard precautions that is in-line
           with the Standard Operating Procedure in the last two years.
     14.   Electronic networked system for monitoring the availability of medicines is used effectively
     15.   Clinic space accommodates all services and staff
     16.   The guideline for accessing, tracking, filing, archiving and disposal of patient records is adhered
           to
     17.   Resuscitation room is equipped with functional basic equipment for resuscitation
     18.   80% of professional nurses have been trained on Basic Life Support
     19.   Essential equipment is available and functional in consulting areas
     20.   There is an official memorandum of understanding between the PDOH and the Department of
           Social Development
     [Source: Ideal Clinic Quality Improvement Plan 2017/18]

     Table 15: Top 20 worst performing National Core Standards in district hospitals 2016/17

     Nr                                           Worst performing elements
     1.
     2.
     3.
     4.
     5.
     6.
     7.
     8.
     9.
     10.
     11.

                                                        30
Nr                                            Worst performing elements
12.
13.
14.
15.
16.
17.
18.
19.
20.
[Source: WebDHIS National Core Standards]

Table 16: Top 5 challenges reported by patients in patient surveys and patient complaints
2016/17

Nr                  Challenges reported in patient surveys                    Patient complaints
1.    I was very bored at the hospital                            Care and professional treatment
2.    I had to wait a long time to get my folder                  Staff attitudes
3.    I did not feel safe at night at the hospital                Waiting times
4.    It takes longer than 30 minutes to get to the hospital      Other
5.    Visiting hours were not long enough                         Cleanliness
[Source: Sinjani]

                                                                                                    31
9.   ORGANISATIONAL STRUCTURE OF THE DISTRICT MANAGEMENT TEAM

                                        32
10. DISTRICT HEALTH EXPENDITURE

Table 17: Summary of district health expenditure 2016/17

Sub-programme                       Budget: Adjusted                Expenditure                        TOTAL
                                     Appropriation
                                  Province           LG     Province               LG     Budget      Expen-       % Overspent
                                              Trans Own                    Transf Own                  diture     (Underspent)
                                              fer to                        er to
                                               LG *                          LG
2.1           District
                                 23,002,000                22,931,254                   23,002,000   22,931,254    (70,745.92)
            Management
2.2             Clinics         141,938,000               149,478,130                   141,938,000 149,478,130    7,540,130
2.3         Community
                                 33,961,000                29,942,528                   33,961,000   29,942,528    (4,018,472)
           Health Centres
2.4          Community
            Services (incl.      11,343,000                12,375,017                   11,343,000   12,375,017    1,032,017
                PAH)
2.5            Other
             Community               -                          -                            -           -              -
              Services
2.6            HIV/AIDS          89,175,000                91,308,502                   89,175,000   91,308,502    2,133,502
2.7            Nutrition         3,155,000                 3,078,515                     3,155,000   3,078,515     (76,485.00)
2.9        District Hospitals   290,258,000               300,723,962                   290,258,000 300,723,962    10,465,962
2.12        Other Donor
              Funding
TOTAL DISTRICT
                                                          609,837,908                   592,832,000 609,837,908    17,005,908
                                592,832,000
[Source: District Health Expenditure Review (2016/17) or BAS]

Note:

*LG - Local government

The adjusted Management 2016/17 budget was used as a basis for 2017/18 financial year. The budget
increased on Personnel for APL; the ICS/Inflation was 8.37% and for Non-APL 8.39%. The Inflation on Goods and
Services received was 7.2% excluding the following items in Goods & Services:

            Blood (8%)

            Fleet Services (GMT) (6.2%)

            Financial Leases (6.2%)

            Transport equipment (6.2%). Inflation on Transfers and Subsidies estimated at 7 per cent was added.
             Inflation on Capital equipment was estimated at 0 per cent except for financial leases.

The department has a shortfall of R143 million for 2017/18 financial year and the West Coast District contribution
to the budget cuts was R5.1 million. The budget for the department therefore decreased in real terms while
patient numbers increased. Measures were put in place in 2016/17 and will continue during 2017/18 to mitigate
the challenges.

                                                                      33
11. DISTRICT PERFORMANCE INDICATORS

11.1 DISTRICT HEALTH SERVICES

Table 18: Performance indicators for District Health Services

                                                                                                                                                                             Provincial
                                                           Data                                                        Estimated
      Programme performance indicator                                Type     Audited / Actual performance                                  Medium term targets                actual
                                              Frequency source /                                                      performance
                                                                                                                                                                            performance
                                                        Element ID
                                                                            2014/15       2015/16       2016/17         2017/18       2018/19    2019/20      2020/21         2016/17
 SECTOR SPECIFIC INDICATORS
 1.       Ideal clinic (IC) status rate        Annual                 %         0.0%          0.0%         14.8%           25.9%         44.4%       66.7%        100.0%         17.2%
                                 Numerator                  3                         0             0             4               7         12          18            27            47
                              Denominator                   2                     27            27            27              27            27          27            27           273
 2.       PHC utilisation rate (annualised)   Quarterly              No          1.9           1.9           1.8              1.8          1.8         1.8            1.8           2.3
                                 Numerator                  6                809 841       796 986       803 161          804 285      822 490     840 817        859 226    14 413 350
                              Denominator                   7                419 201       428 914       439 003          449 287      459 683     470 159        480 692     6 318 281
 3.       Complaint resolution within 25      Quarterly               %        96.4%         99.4%         96.2%           95.5%         98.6%       98.4%         98.1%         95.6%
          working days rate (PHC
          facilities)
                                 Numerator                  10                   107           160           128             150           140         125           105          3 175
                              Denominator                   8                    111           161           133             157           142         127           107          3 320

                                                                                                                                                                                   34
Table 19: Quarterly targets for District Health Services

           Programme performance indicator                 Data source    Frequency   Annual target                            Quarterly targets
                                                           / Element ID                 2018/19         Quarter 1         Quarter 2         Quarter 3         Quarter 4
 SECTOR SPECIFIC INDICATORS
 1.     Ideal clinic (IC) status rate                                      Annual              44.4%                  -                 -                 -          44.4%
                                               Numerator        3                                  12                 -                 -                 -               12
                                            Denominator         2                                  27                 -                 -                 -               27
 2.     PHC utilisation rate (annualised)                                 Quarterly               1.8               1.8               1.9               1.7               1.8
                                               Numerator        6                            822 490         207 549           216 250             192 518         206 173
                                            Denominator         7                            459 683         114 921           114 921             114 921         114 920
 3.     Complaint resolution within 25 working days rate                  Quarterly            98.6%           97.2%            100.0%             100.0%            97.2%
        (PHC facilities)
                                               Numerator       10                                 140               35                37                33                35
                                            Denominator         8                                 142               36                37                33                36

(a)   Achieve ideal clinic status;
      The district has over the past year adhered to all requirements with regards to all levels of the prescribed assessments that had to be done
      towards achieving silver status. Each sub district manager and facility operational managers has been involved with focused on and off-site
      informal training sessions to re-emphasize and re-train staff to understand the importance and benefits towards improved quality health care
      services and contributing towards person centered care. Each sub district received 3 well-organized Ideal clinic master files that are organized in
      a way that the prescribed manual dictates to ensure standardization of source documents and to assist with standardized interpretation of what
      is required. The planning, coordination and provision of services are geared towards all the inclusion of all categories of the community requiring
      health care services. Although no dedicated youth health services facilities are operational, this category receives care and services as in
      specific timeslots later in the afternoon or as they prefer to attend during any time of the day. Processes for sorting of patients in the waiting area
      with specific emphasis on children, the disabled, elderly and acutely ill clients is being addressed and streaming patients to the appropriate
      areas for services are fast tracked. This can only be sustainable considering the activities scheduled for the day and the available staff. Efficient
      patient flow and waiting times are key indicators and are routinely monitored by the OPMs. Patient communication in facilities is crucial. The
      district has an additional two posts for quality assurance coordinators which will certainly assist with improving quality of services.

                                                                                                                                                                          35
It is suggested that the broader system could assist in down-sizing the frequency and intervals in the same year when IC assessments must be
      conducted by the various levels. This is extremely cumbersome for operational managers who are also functioning as production clinical services
      providers on a daily basis. The frequency and approach of peer reviews in the PPTICRM must be reviewed as there appears to be inconsistencies
      across district assessors and an unhealthy competition with some generalized punitive attitude in some instances.

(b)   Reduce morbidity (or increase coverage indicators);
      The integrated management of chronic conditions has been a concern from a patient and clinician perspective. Some of the concerns to note
      are the lack of self-care management, taking ownership, compliance, ignorance and socio-economic conditions. The district has regular
      integrated wellness days in all sub districts and it is planned and coordinated with all relevant stakeholders working in a specific area. The
      strategies that are implemented include assessments of clients at home with referral to PHC clinics, health talks and open days where screening
      is done with referrals to clinics. PACK training is well on track and various modalities of training interventions are applied, eg on-site and e-version
      access for training. The identification of the COPC pilot sites, commencing with strategies to address social ills and focusing on the WOSA will
      give positive spin-offs over time with improved health outcomes in future. The wellness program requires dedicated persons per sub district to
      ensure that the focus is kept and driven with purpose if we want to turn down or close the tap. Prevention needs to start within the 1st 1000 days
      strategy, continue into primary and secondary education and the DOE needs to be influenced into curriculum changes and development.

(c)   Reduce mortality.
      The 1st 1000 days strategy remains a key programmatic focus. Roadshows have been conducted in all sub districts. Specific events are
      continuing with support from all staff and NPOs active in the area. The full package for this strategy is being implemented and is monitored by
      quarterly M&E sessions at sub district and district levels of engagements. The dedication and commitment of staff, NPOs and environmental
      health practitioners in the PSS season has shown a remarkable improvement in awareness of improved wellness and reducing preventable
      childhood diseases and death. No in-facility deaths have been reported for the past year during this time period.
      BANC services are available at all PHC facilities and early bookings are encouraged from a HCBC services platform and in PHC facility settings.
      Monthly M&M meetings remain mandatory and are monitored closely. It has been reported by the managers that the quality of such meetings
      has had positive spin-offs for staff in the management of our patients.

                                                                                                                                                           36
11.2 DISTRICT HOSPITALS

Table 20: Performance indicators for District Hospitals

                                                                                                                                                                                    Provincial
                                                          Data                                                           Estimated
      Programme performance indicator                               Type      Audited / Actual performance                                     Medium term targets                    actual
                                             Frequency source /                                                         performance
                                                                                                                                                                                   performance
                                                       Element ID
                                                                            2014/15        2015/16        2016/17         2017/18        2018/19       2019/20       2020/21         2016/17
 SECTOR SPECIFIC INDICATORS
 1.      Hospital achieved 75% and more      Quarterly               %          28.6%          42.9%          57.1%           71.4%         85.7%        100.0%        100.0%            69.7%
         on National Core Standards
         (NCS) self-assessment rate
         (district hospitals)
                                 Numerator                 3                          2              3              4               5              6             7             7               23
                              Denominator                  4                          7              7              7               7              7             7             7               33
 2.      Average length of stay (district    Quarterly              Days           2.7            2.7            2.7             2.7           2.7           2.7           2.7                 3.2
         hospitals)
                                 Numerator                 7                  108 694        106 066        103 430         100 533        102 739       104 957       107 180         909 893
                              Denominator                  8                   40 404         38 972         38 124          36 603         37 398        38 196        38 997         280 580
 3.      Inpatient bed utilisation rate      Quarterly               %          81.4%          79.4%          77.4%           85.5%         87.4%         89.3%         91.2%            84.8%
         (district hospitals)
                                 Numerator                 7                  108 694        106 066        103 430         100 533        102 739       104 957       107 180         909 893
                              Denominator                  9                  133 605        133 605        133 605         117 543        117 543       117 543       117 543        1 072 731
 4.      Expenditure per PDE (district       Quarterly               R         R 1 561        R 1 746        R 1 930         R 2 080       R 2 140       R 2 193       R 2 271          R 2 139
         hospitals)
                                 Numerator                 10              253 555 557    280 147 269    300 723 962     315 193 000 331 512 000 347 165 000 367 322 000 2 923 677 427
                              Denominator                  16                 162 395        160 442        155 836         151 528        154 915       158 324       161 744        1 366 831
 5.      Complaint resolution within 25      Quarterly               %          54.1%          91.1%          67.3%           78.2%         81.6%         86.8%         90.7%            90.4%
         working days rate (district
         hospitals)
                                 Numerator                 19                      46             82            101                 86         84            79            68            1 501
                              Denominator                  17                      85             90            150             110           103            91            75            1 661

                                                                                                                                                                                          37
Table 21: Quarterly targets for District Hospitals

             Programme performance indicator                     Data source    Frequency   Annual target                              Quarterly targets
                                                                 / Element ID                 2018/19           Quarter 1         Quarter 2         Quarter 3         Quarter 4
 SECTOR SPECIFIC INDICATORS
 1.       Hospital achieved 75% and more on National                            Quarterly            85.7%                    -                 -                 -          85.7%
          Core Standards (NCS) self-assessment rate (district
          hospitals)
                                                     Numerator        3                                     6                 -                 -                 -                6
                                                   Denominator        4                                     7                 -                 -                 -                7
 2.       Average length of stay (district hospitals)                           Quarterly               2.7                 2.8               2.6               2.8               2.7
                                                     Numerator        7                            102 739            26 405            25 045             25 819           25 470
                                                   Denominator        8                             37 398             9 323             9 503              9 286            9 286
 3.       Inpatient bed utilisation rate (district hospitals)                   Quarterly            87.4%             89.9%             85.2%              87.9%            86.7%
                                                     Numerator        7                            102 739            26 405            25 045             25 819           25 470
                                                   Denominator        9                            117 543            29 386            29 386             29 386           29 385
 4.       Expenditure per PDE (district hospitals)                              Quarterly          R 2 140           R 1 962           R 2 215             R 2 101         R 2 286
                                                     Numerator       10                        331 512 000        76 594 936        85 374 646         82 230 761       87 311 657
                                                   Denominator       16                            154 915            39 049            38 537             39 135           38 194
 5.       Complaint resolution within 25 working days rate                      Quarterly            81.6%             84.6%             80.0%              80.8%            80.8%
          (district hospitals)
                                                     Numerator       19                                  84                 22                20                21                21
                                                   Denominator       17                                 103                 26                25                26                26

List and summarise the key interventions that will be implemented by the district in their district hospitals to:

(a)   Achieve higher levels of compliance with National Core Standards
              Ensure that QIP’s are in place and Implemented.
              Maintain and appraise strengths of facilities
              Strengthen support to the sub district Management iro of National Core Standards
              Ensure that minimum required resources are in place at facilities that enable them to comply and maintain good Quality.
              Continue training and Support iro the National Core Standards domains .

                                                                                                                                                                                  38
(b)   Reduce morbidity (or increase coverage indicators); and
          Full implementation and strengthening of maternal and child health services, 1st 1000 days, including mental health screening and ESMOE
          Strengthening the PMTCT care in hospitals
          Mental health services iro 72 hour assessments and full support from psychiatrists.
          Clinical governance and holistic management of chronic disease of lifestyle with seamless referrals to PHC level
          Quality improvement in M&M meetings
          HAST: fast tracking TB patients to TB complex and referral to PHC level
          eCCR is being rolled out to improve continuity and quality of care of the patient

(c)   Reduce mortality (reduce the number of deaths – specifically maternal, neonatal and child).
          1st 1000 days strategy fully implemented and monitored for outcomes
          Referral and follow up of high risk ante-natal clients
          ESMOE program implementation
          Staff competence and training

                                                                                                                                                39
11.3 HIV AND AIDS, STIs AND TB CONTROL (HAST)

Table 22: Performance indicators for HIV and AIDS, STIs and TB control (HAST)

                                                                                                                                                                         Provincial
                                                           Data                                                     Estimated
     Programme performance indicator                                 Type     Audited / Actual performance                              Medium term targets                actual
                                              Frequency source /                                                   performance
                                                                                                                                                                        performance
                                                        Element ID
                                                                            2014/15     2015/16      2016/17         2017/18      2018/19     2019/20     2020/21         2016/17
STRATEGIC GOAL: Promote health and wellness.
1.1.1   TB programme success rate             Quarterly               %        81.9%        68.9%        80.9%           81.3%       81.9%       82.8%         83.8%          80.4%
                                  Numerator                 1                   2 904       2 608        3 054           3 096        3 154       3 216         3 273        34 651
                                Denominator                 2                   3 546       3 787        3 773           3 809        3 849       3 882         3 906        43 099
2.1.1   ART retention in care after 12        Quarterly               %        63.4%        57.0%        57.8%           59.7%       72.8%       73.6%         74.4%          72.2%
        months
                                  Numerator                 3                    881          859        1 075           1 130        1 354       1 391         1 419        33 307
                                Denominator                 4                   1 389       1 507        1 861           1 893        1 861       1 890         1 907        46 120
2.1.2   ART retention in care after 48        Quarterly               %        51.0%        45.9%        41.4%           49.9%       57.2%       58.0%         59.0%          60.7%
        months
                                  Numerator                 5                    426          433            549           503         699         723           751         19 700
                                Denominator                 6                    836          943        1 326           1 008        1 223       1 247         1 273        32 455
SECTOR SPECIFIC INDICATORS
1.      ART client remain on ART end of       Quarterly              No         6 521       7 651        8 910           9 802       11 831      12 100        12 370       230 931
        month - total
                                    Element                 7
2.      TB/HIV co-infected client on ART      Quarterly               %        75.4%        78.7%        82.3%           82.3%       82.3%       82.2%         82.2%          89.6%
        rate
                                  Numerator                 8                    688          789            828           841         859         877           896         14 902
                                Denominator                 9                    912        1 003        1 006           1 022        1 044       1 067         1 090        16 637
3.      HIV test done – total                 Quarterly              No        84 723     100 721      107 918         106 968      109 435     111 921       114 422      1 379 375
                                    Element                 10
4.      Male condoms distributed              Quarterly              No     7 020 742    8 070 750   8 967 800        9 245 400   9 458 529   9 673 256   9 889 070      113 913 868
                                    Element                 12
5.      Medical male circumcision –           Quarterly              No         1 709       1 412            856         1 325        1 331       1 361         1 391        11 687
        total
                                    Element                 16

                                                                                                                                                                               40
Provincial
                                                             Data                                                                 Estimated
     Programme performance indicator                                          Type       Audited / Actual performance                                      Medium term targets                        actual
                                                Frequency source /                                                               performance
                                                                                                                                                                                                   performance
                                                          Element ID
                                                                                       2014/15       2015/16         2016/17       2017/18          2018/19          2019/20      2020/21             2016/17
6.       TB client 5 years and older start      Quarterly                      %           99.3%         98.5%          95.9%           95.8%           95.8%           95.8%          95.8%               92.9%
         on treatment rate
                                  Numerator                     19                          2 109         2 346          1 932           2 121          2 168            2 216             2 263          21 007
                                Denominator                     20                          2 123         2 381          2 014           2 215          2 263            2 312             2 361          22 612
7.       TB client treatment success rate       Quarterly                      %           81.9%         68.9%          80.9%           81.3%           81.9%           82.8%          83.8%               80.4%
                                  Numerator                     21                          2 904         2 608          3 054           3 096          3 154            3 216             3 273          34 651
                                Denominator                     22                          3 546         3 787          3 773           3 809          3 849            3 882             3 906          43 099
8.       TB client defaulter / lost to follow   Quarterly                      %            8.4%          9.1%          10.4%           10.3%            9.6%            9.5%              9.4%            10.5%
         up rate
                                  Numerator                     23                           297           345            392                393          368             369               366            4 514
                                Denominator                     22                          3 546         3 787          3 773           3 809          3 849            3 882             3 906          43 099
9.       TB client death rate                    Annual                        %            4.2%          4.5%           4.7%            4.6%            4.5%            4.4%              4.3%                3.9%
                                  Numerator                     24                           148           169            178                174          173             170               167            1 693
                                Denominator                     22                          3 546         3 787          3 773           3 809          3 849            3 882             3 906          43 099
10.      TB MDR treatment success rate           Annual                        %                         54.8%          54.6%           42.9%           47.6%           47.4%          49.0%               44.6%
                                  Numerator                     25                               0          40             65                48            59              64                71                 738
                                Denominator                     26                               0          73            119                112          124             135               145            1 653

Table 23: Quarterly targets for HIV and AIDS, STIs and TB control (HAST)

              Programme performance indicator                        Data source     Frequency       Annual target                                      Quarterly targets
                                                                     / Element ID                      2018/19             Quarter 1               Quarter 2             Quarter 3                 Quarter 4
 PROVINCIAL STRATEGIC OBJECTIVE INDICATORS
 1.1.1    TB programme success rate                                                  Quarterly                 81.9%               82.0%                  81.9%                  81.9%                    82.0%
                                                    Numerator             1                                    3 154                   796                     829                   738                       791
                                                  Denominator             2                                    3 849                   971                1 012                      901                       965
 2.1.1    ART retention in care after 12 months                                      Quarterly                 72.8%               72.8%                  72.8%                  72.7%                    72.7%
                                                    Numerator             3                                    1 354                   342                     356                   317                       339
                                                  Denominator             4                                    1 861                   470                     489                   436                       466

                                                                                                                                                                                                               41
You can also read