Need for Specialized Geriatric Services in the Central East LHIN - Central East Regional Specialized Geriatric Services
←
→
Page content transcription
If your browser does not render page correctly, please read the page content below
October 2013

   Central East Regional Specialized Geriatric Services

         Need for Specialized Geriatric Services
               in the Central East LHIN

                                Prepared by:

                     This report contains copyrighted material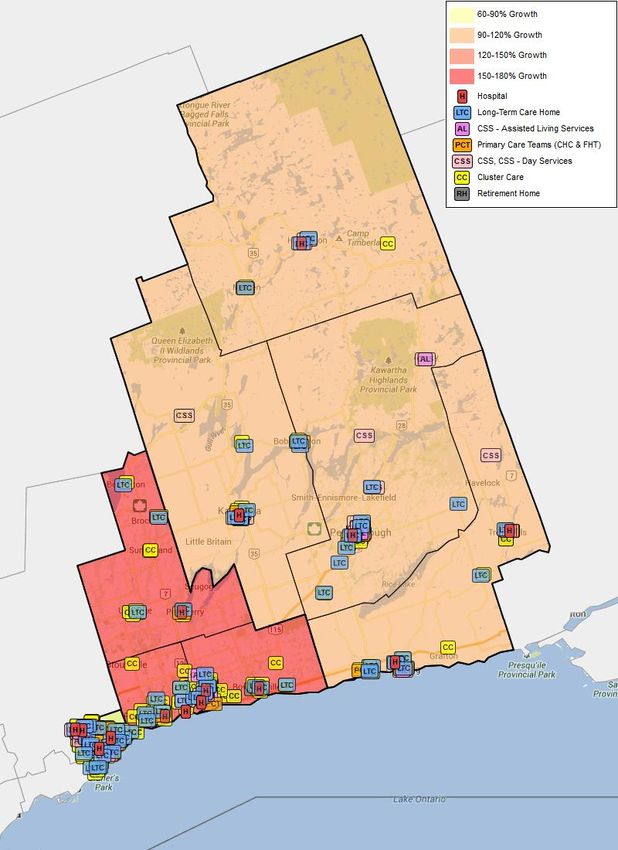
What We Found
Purpose of the Study
There are many developed and evolving specialized geriatric programs in the Central East
The Regional Specialized Geriatric LHIN. The Regional Specialized Geriatric Services entity is positioned to improve the
Services (RSGS) entity was formed to planning and coordination of these programs. The number of seniors in the LHIN is
improve the organization, coordination projected to double over the next 20 years, but this does not imply that existing services
and governance of specialized geriatric can or should be increased proportional to senior population growth. Service location and
services for frail seniors in the Central configuration will need to change, as some communities are growing faster than others.
East LHIN. In 2013, the RSGS Seniors' preferences and constrained health care budgets will increase the need for
Governance Authority commissioned community based delivery of senior care. Specialized geriatric service (SGS) can support
Preyra Solutions Group (PSG) to: the shift from institutional to community settings.
assess the current and future Since almost 90% of CE LHIN seniors live in the community, focusing mainly on institution
specialized geriatric service needs based services would under serve the population. There is potential for SGS resources to
of the CE LHIN population expand in many settings outside long term care homes and hospitals, including seniors'
assess the capacity of specialized own homes, in retirement homes or Assisted Living in Supportive Housing. Early access to
geriatric services in the CE LHIN these interventions in the community is critical for delaying or avoiding frail seniors' need
examine the gaps between needs for institutional care.
and capacity for different sectors
that provide specialized geriatric Hospital days, ED visits and LTC days could be reduced with earlier access to geriatric
services services in the community. RSGS can support the CE LHIN in its specific aim to substantially
suggest services, subpopulations, reduce long term care bed days. Expanding SGS services could be extremely cost effective.
and activities that should be Without adjusting for case mix and inflation and if capacity were unconstrained, we
priorized for system improvement project LTC home expenses in the LHIN would grow by $365 million over the next 20
identify system reconfigurations years. Community based SGS interventions could delay and reduce the need for long term
and resource redistributions to care days. For example, we estimate that if all LTC homes achieved at least the 50th
achieve an integrated system of percentile average length of stay, roughly one million LTC home bed days would be
specialized geriatric services. available without increases in capacity. Our analysis also finds that residents in some
homes are less frail than others, creating an opportunity for residents that would
To conduct its assessment PSG worked otherwise be in long term care to remain in the community.
with an RSGS Steering Committee,
which included clinicians and managers There are many health risks that SGS can be expected to reduce. These risks are
from specialized programs in the CE measurable and are important indicators of system efficiency, patient experience and SGS
LHIN. PSG conducted extensive effectiveness. We found substantial variation in seniors’ risk of health service utilization
analysis using population, across the LHIN. These variations include Potentially Avoidable Hospital Use and low
administrative, and survey data. acuity visits from the LTC to the ED.
Methods included linked episodic,
Case finding is an important tactic to ensure that SGS resources are best used. To
single episodic, and population based
demonstrate, we created a segment of high users that could be targeted for specialized
analysis. To understand demand, we
services. We identified 4,900 high acute use seniors in the CE LHIN. These seniors had high
estimated the risk of health decline. To
rates of Potentially Avoidable Hospitalizations and their health deteriorated from low to
understand service need, we matched
high levels of frailty in the years before their hospitalization and institutionalization.
different kinds of senior health risks to
RSGS interventions that could reduce Specialized geriatric services in both institutions and the community will need to increase
that risk. Where possible, statistics in the future as the population ages. How this is done will affect the whole health care
from other specialized programs and system. There is no single best way to organize specialized geriatric services, although
the literature were used for there are essential components: services should be provided to those seniors that would
comparisons. benefit most; coordinated specialized geriatric services should be available in the
Victoria Van Hemert generously
community with the goal to reduce specific health risks such as injuries, muscle
provided extensive comments on an
weakening, infections and exacerbation of chronic conditions; and service should be
earlier draft. The report does not
continuously evaluated for quality, access and effectiveness.
necessarily represent the views or
actions of the Central East LHIN or the 2
RSGS Governance Authority.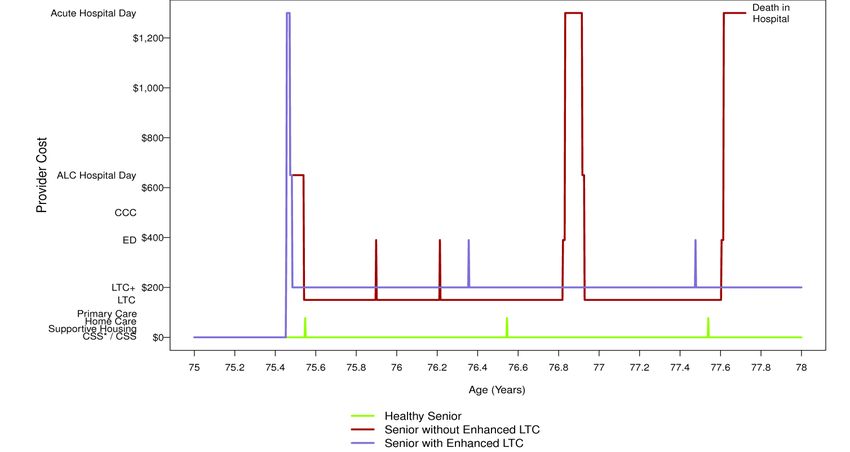
Table of Contents
Background......................................................................................... 4
Scope and Methods ........................................................................... 5
Seniors in The Central East LHIN ................................................ 6
I. The Needs of Frail Seniors in the CE LHIN .......................... 10
      Frail Seniors ............................................................................. 10
      Health Risks that RSGS Can Reduce ................................. 13
      Priority Populations for RSGS............................................. 19
II. Meeting the Needs of Frail Seniors in the CE LHIN ......... 27
      What RSGS Resources are Available? ................................ 27
      What Are the Service Gaps? .................................................. 36
      Findings and Suggestions ..................................................... 47
Appendices ........................................................................................ 51
      Appendix A ............................................................................... 51
      Appendix B ............................................................................... 52
      Appendix C ............................................................................... 59
      Appendix D ............................................................................... 60

                                                                                                    3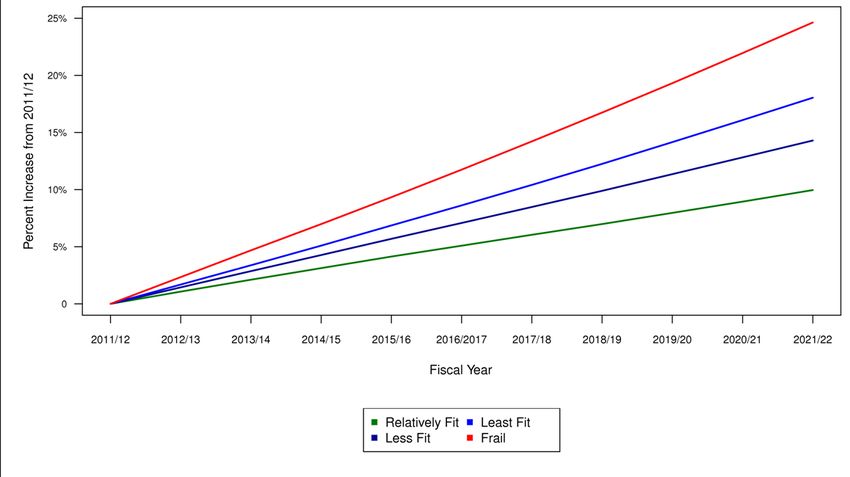
Background               In May 2011 the Central East LHIN identified the opportunity to create the Regional
                         Specialized Geriatric Services entity (RSGS): Regional, for close-to-home care that
                         meets community needs; Specialized, because skilled interprofessional teams provide
                         the care; Geriatric because seniors, especially those older than 75 years, are the
                         focus; and Services, which are a portfolio of available interventions that combine to
                         improve frail senior health. RSGS became operational in July 2012.

                         These basic qualitative ideas about RSGS motivate our policy questions: Who are the
                         frail seniors? What specific services do the CE LHIN frail senior population need? How
                         much of each service should be provided? Where should services be provided? What
                         outcome improvements can be expected by program expansion and redesign?

                         That these questions are unanswered reflects the Central East LHIN's current
                         patchwork of specialized geriatric services across community and institutional
                         settings.

                         Specialized Geriatric Services
                         SGS uses expert, inter-professional teams to provide eldercare. These teams include
                         physicians trained in geriatric medicine and geriatric psychiatry. Services include
15% of CE LHIN           geriatric emergency management, geriatric rehabilitation, geriatric day hospital,
residents are seniors,   geriatric outreach, geriatric specialty clinics, inpatient geriatric consultation, inpatient
yet consume almost       geriatric assessment and treatment, acute care of the elderly units, urgent-emergency
                         care clinics, community and long term care psychogeriatrics, and nurse led outreach
half of the LHIN's
                         to long-term care.
health care resources
                         Frail seniors and their families experience SGS as services in varied settings by
                         interprofessional teams.

                         Within SGS programs, service availability and delivery modes differ by CE LHIN
                         community. Specialized geriatric programs in the LHIN have evolved to reflect
                         differences in the resources, values, effort and vision of community focused teams.

                         RSGS allows frail senior programs to be distinct yet benefit from the coordinated care
                         and planning that is possible under a single entity.

                                                                                                                   4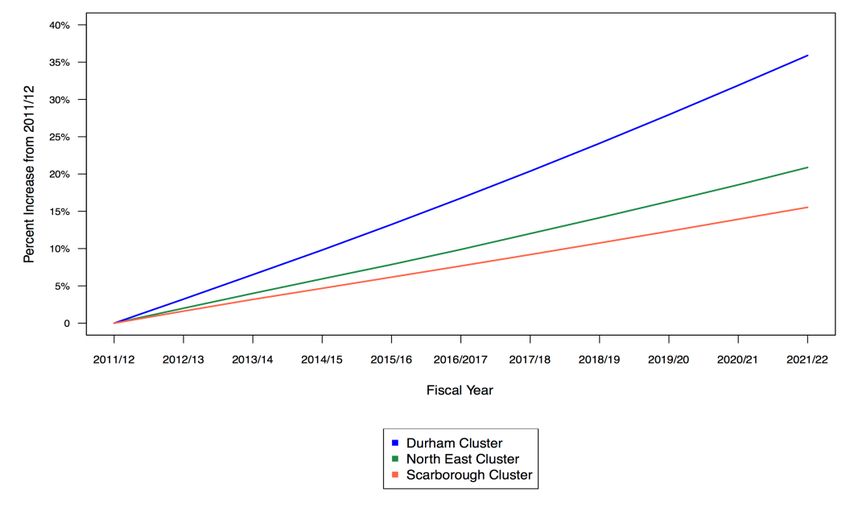
Scope and                             This study assesses the need for specialized geriatric services in the CE LHIN. The
                                      frailest seniors are found in hospital and long term care yet most frail seniors are in
Methods                               the community; specialized services for all these seniors are in scope for this study.
                                      Our first objective was to infer unmet SGS need from differences in frail senior
                                      resource use and outcomes between Central East and other LHINs and among Central
                                      East clusters. Our second objective was to describe current CE LHIN SGS capacity,
                                      organization, expansion and reconfiguration options to meet future need.
                                      Beginning a study of this kind, it is difficult to predict which information is most
                                      important. We undertook extensive analysis which was reviewed by an RSGS Steering
                                      Committee in order to select priority areas. This report describes the topics and
                                      results that are immediately important for RSGS planning. Further details about the
                                      Committee and the analysis are in the appendices.
                                      To do our work, we organized multiyear clinical and financial administrative data from
                                      hospitals, long term care homes, the Community Care Access Centre and Community
                                      Health Centres. We obtained additional statistical and financial information about
                                      specialized geriatric services in the LHIN directly from the programs, and surveyed
                                      managers when we needed more detailed information and statistics.1 We used
                                      Census data and Ministry of Finance population estimates and projections to compare
                                      and report results by geographic cluster within the LHIN. Our person based analysis
                                      was both single and multiple encounter, akin to the approach used in risk adjustment
                                      systems such as the Health Based Allocation Model (HBAM). We devised population
                                      segmentation approaches to better match frail seniors to specialized services, and to
                                      help RSGS prioritize interventions. In most cases, we compared Central East
                                      measures with other LHINs and the province. Where possible, we used information
                                      about better practice2 gleaned from our literature review.
                                      There are several important limitations to our analysis. First, program statistics were
                                      not always comparable across clusters or across LHINs. This is because many of the
                                      programs were historically developed independently of each other, with their own
                                      service definitions and reporting requirements. Second, programs in the LHIN did not
                                      have similarly defined counterparts in the other jurisdictions, limiting our ability to
                                      benchmark; as with the Ontario comparisons, this reflects the evolution and
                                      customized nature of specialized geriatric programs. Third, there is little client level
                                      morbidity data for ambulatory and community-based services, which limits refined
                                      estimation of community specific need and program case mix.

1
 Data from program managers was collected between April and June 2013.
2
 We refer to improvements in service access and delivery as "better practice". "Best practice" would incorrectly suggest that there is
consensus about an ideal state.
                                                                                                                                    5
Despite these limitations, there are numerous strengths to the analysis. We combine
survey with financial and clinical administrative data, and apply leading analytic
methods to describe the current system and ways it can be improved. It is the first
inter-sectoral analysis of health service use, need, capacity, specific to frail seniors in
the CE LHIN, and its findings can substantially inform RSGS strategy.
Seniors in The 15% of the Central East LHIN's 1.6 million residents are seniors, yet consume almost
half of the LHIN's health care resources.3 Over the next 20 years, the LHIN's senior
Central East population is forecast to double, substantially increasing total health care need.4
LHIN
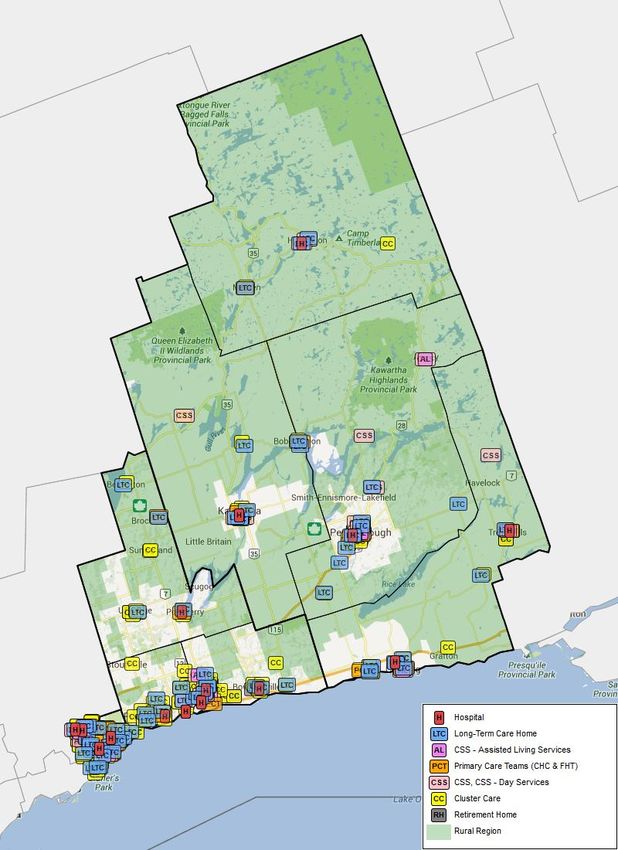
The Central East LHIN covers 17,000 square kilometers of mostly rural geography.
Only 11% of residents live in rural regions while 80% of residents are concentrated in
Scarborough and Durham.
Meeting the SGS needs of frail seniors will require different approaches for rural and
dense urban areas. Exhibits 1 and 2 show the location of the LHIN's nine acute
hospitals, 68 Long Term Care Homes, 39 Community Support Services, 17 Assisted
Living Services in Supportive Housing, seven Community Health Centres and other
services5 with overlays for rural geography and demographic growth. As Exhibit 1
shows, most services are concentrated in urban areas, with service clusters around
populated rural areas.
The location of services will likely need to change in the future. As Exhibit 2 shows,
local services will need to grow faster in some communities than others because of
differential population growth; for example, 20 year senior population growth
forecasts range from 60% in Scarborough to 170% in Durham.
3
Ministry of Finance. “Ontario’s Long Term Report on the Economy.” Web. 5 July 2013.
.
4
Statistics Canada, Ministry of Finanace Population Projections.
5
Central East LHIN. “Developing Ontario’s Seniors Care Strategy: A Central East LHIN Perspective.” Central East LHIN.
.
6Exhibit 1 Health Care Providers and Rural Regions in the Central East LHIN
Different approaches
are required for rural
and urban areas
Source: FSA Rural Geograph, MOH Health Indicator Tool
7Exhibit 2 Health Care Providers and 20 Year Forecast Growth in the Senior
Population in the Central East LHIN
Specialized geriatric
services will need to
grow faster in some
clusters
Source: MOF Population Projections, MOH Health Indicator Tool
Where Do Seniors in the Central East LHIN Access Services?
Most specialized geriatric services are best received close to home, so a LHIN cluster`s
resources should be strongly linked to its total senior residents. However, for
specialized geriatric services that should be co-located in hospitals, resources should
flow to where seniors receive care, which might not be at a hospital in their cluster. In
Exhibits 3 and 4 below, we show the extent to which seniors receive hospital inpatient
and emergency department care within their own cluster.
8Exhibit 3 Where Central East 75+ Seniors Receive Services, Inpatient
Discharges 2011/2012
Hospital Location
North East Durham Scarborough Out of Total
CE seniors do not Patient Residence
Cluster Cluster Cluster LHIN Discharges
always receive care in North East Cluster 86% 2% 0.4% 11% 8,574
their home cluster Durham Cluster 2% 74% 6% 17% 8,875
Scarborough
0.1% 1% 76% 23% 9,950
Cluster
Central East LHIN 27% 25% 30% 18% 27,399
Source: DAD, 2011/12
Exhibit 4 Where Central East 75+ Seniors Receive Services, ED Visits
2011/2012
Total services located Hospital Location
within a cluster need North East Durham Scarborough Out of Total ED
Patient Residence
not always be Cluster Cluster Cluster LHIN Visits
proportional to the North East Cluster 95% 1% 0.1% 4% 26,857
Durham Cluster 2% 85% 3% 11% 26,036
number of seniors Scarborough Cluster 0.5% 1% 82% 17% 25,041
living in the cluster Central East LHIN 34% 29% 27% 10% 77,934
Source: NACRS, 2011/12
Overall 18% of the total 27,399 inpatient discharges for Central East residents aged
75+ were from hospitals outside the LHIN. Scarborough residents were more likely
than North East residents to receive inpatient care from hospitals outside the LHIN.
Although Durham and Scarborough residents are approximately equally likely to leave
their cluster for care (26% vs. 24% respectively), in Durham, 8% of the outflow is to
other clusters within the LHIN (compared to Scarborough at just over 1%).
The North East is almost completely self sufficient for senior ED care (at 95%),
compared with the amount of ED care for Durham and Scarborough seniors that is
provided outside the LHIN (11% and 17% respectively). This patient flow suggests that
total services located within a cluster need not always be proportional to the number
seniors living in the cluster; hospital based geriatric service planning will need to
incorporate both subLHIN6 population growth and market share.
6
Sub-LHINs are geographic units within LHINs and are synonymous with clusters in the CE LHIN
9I. The Needs of Frail Seniors in the Central East LHIN
Frail Seniors Frailty and Health Risk
There is no all-purpose definition of frailty, nor is there consensus on definitions
within specific settings.7 8 9 In practice, the term frailty is imprecise and potentially
confusing.
Briefly put, frail seniors are at risk for worsening health; frail seniors are less able than
others to recover after a health stressor event. Examples of their health risks include:
need for institutional care; falling; delirium; post surgical complications; functional
Frail seniors are less dependence and death. Specialized geriatric health maintenance, health restorative
able than others to and preventative interventions each reduce health risk.
recover after a health Conceptually, we use the terms frailty and health risk interchangeably, but for
stressor event analysis, we specify the type of senior health risk to be managed. Referring to frailty
without identifying the specific nature of the risk is operationally incomplete.
As RSGS develops and implements its strategy, it should be aware of the types of
health risks that can be reduced through specialized interventions, and should
understand how clinicians, planners and researchers measure frailty in populations.
Exhibit 5 shows a sample of approaches. These differ in method, the data used and
the extent to which they are calculable across different settings in Ontario.
Exhibit 5 Sample Frailty Indexes
Ontario Data
Measure Developer Data Used
Currently Available
There is no single CSHA Clinical
Rockwood et al. Clinical Assessment Some Sites
Frailty Scale
definition of frailty Edmonton Frail
Rolfson et al. Clinical Assessment Some Sites
that is appropriate for Scale
Rockwood Frailty Comprehensive
all RSGS purposes Index
Rockwood et al.
Geriatric Assessment
Some Sites
Adjusted Clinical Johns Hopkins Hospital IP DS and ED/
Administrative
Groups University OHIP
Assessed Home Care,
MAPLe/CHESS InterRAI RAI Assessment
All LTC, CCC
Hospital IP DS and ED/
High Risk Seniors PSG Administrative
OHIP
7
Fried, L.P., C.M. Tangen, M.A. McBurnie, J. Walston, A.B. Newman, C. Hirsch, J. Gottdiener, T. Seeman, R. Tracy, W.J. Kop, G. Burke and the
Cardiovascular Health Study Collaborative Research Group. "Frailty in older adults: evidence for a phenotype." The Journal of Gerontology. 56.3
(2001): M146-56. Web. 3 July 2013.
8
Rockwood, Kenneth , and Arnold Mitnitski. "Frailty in relation to the accumulation of deficits." The Journal of Gerontology 62.7 (2006): 722-727.
Web. 3 July 2013.
9
Meloche, James. "LHINs, Primary Health Care and Health System Design: Integrating Systems and People to Achieve Better Outcomes for our
Community." Central East LHIN. Web. 5 July 2013. .
10Several research studies conclude that, in care settings where different instruments
can be compared, frailty measures are highly correlated.10 When frailty measures
use different data elements, such as comorbidity and functional status, results can
differ, but then the measures can be used together to better describe population
frailty.
Choice of instrument matters at the individual level but, since results are often similar
at the regional level, RSGS can choose one approach to estimate frailty for regions
within the LHIN. For example, using Rockwood's application of the CSHA Clinical
Frailty Scale to Canadian data, we can estimate and forecast frailty prevalence in the
population 65 years and older in the Central East LHIN11, as shown in Exhibit 6 for the
FY 2012/2013.
Exhibit 6 CSHA Clinical Frailty Scale Estimated Number of Seniors by Level of
Fitness in the CE LHIN
North East Durham Scarborough Central
Cluster Cluster Cluster East LHIN
Relatively Fit 15,467 19,344 20,615 55,426
Less Fit 18,724 23,177 24,901 66,802
Least Fit 15,431 18,881 20,456 54,768
Frail 15,126 18,164 19,923 53,214
Total 64,748 79,566 85,895 230,209
Source: Rockwood Frailty Scale, MOF Population Projections
Frailty is a continuous measure, but Rockwood et al. created four groups for analysis.
These groups vary by health risk: for example, the four year mortality rate in the age
70+ Frail group is 36% compared to 20% in the Least Fit group. Planners should
certainly focus on the 53,214 people in the Frail group but are also likely to focus on
the 54,768 seniors at risk that are in the Least Fit group. Later in this report, we use a
broad definition of frailty, which results in slightly different target population
estimates, but here we use the Rockwood groups to illustrate aspects of population
based change. Exhibit 6 shows that the forecasted prevalence varies by both relative
fitness and geography. Exhibit 7 shows that the Frail population is expected to
increase by 25% over ten years, while the Relatively Fit senior population is expected
to increase by 10%. Exhibit 8 shows that the Frail population forecast varies by sub-
LHIN with Durham North/Central expected to increase by 40% and Scarborough by
12%.
10
Armstrong, Joshua J., Paul Stolee, John P. Hirdes, and Jeff W. Poss. "Examining three frailty conceptualizations in their ability to predict negative
outcomes for home-care clients." Oxford Journals: Age and Ageing 39.6 (2010): 755-758.
11
Rockwood, K., X. Song, C. MacKnight, H. Bergman, D.B. Hogan, I. McDowell, and A. Mitnitski. "A global clinical measure of fitness and frailty in
elderly people." Canadian Medical Association Journal 173.5 (2005): 489-95.
11Exhibit 7 Ten Year Forecast Change in Central East Senior Population by
Relative Fitness
The number of frail
seniors in the CE
LHIN is expected to
increase by 25% over
the next ten years and
this varies by cluster:
40% in Durham and
12% in Scarborough
Source: Rockwood Frailty Scale, MOF Population Projections
Exhibit 8 Ten Year Forecast Change in Central East Frail Population by Cluster
Source: Rockwood Frailty Scale, MOF Population Projections
12Health Risks that The previous section reviewed frailty measures and demonstrated their use for
population based frailty estimation. Although frailty measures use different data in
SGS Can Reduce different ways, they are typically validated based on how well they predict nursing
home admission and mortality12. However, there are other health risks that RSGS
expects its services to reduce, such as hospital-acquired functional decline and
delirium.13 These risks are measurable and are important indicators of system
efficiency, patient experience and SGS effectiveness.
Since risk indicates need for specialized services, measuring risk is a prerequisite to
service gap estimation. Exhibit 9 illustrates how matching risk to service provision can
improve outcomes.
The use of health services over three years for three hypothetical seniors is shown,
beginning at age 75. One senior is healthy, visits primary care once per year and costs
the system $231 over the three years. The other two seniors, with paths in red and
blue, are clinically similar at baseline, but differ in their access to geriatric services.
Both seniors had an incident hospitalization at age 75 with acute costs per day of
$1,250. Unlike the senior in red, the senior in blue has timely access to Long Term
Care, which is enhanced by specialized care shown as LTC+, which costs $200, instead
of $150, per day.
12
Rockwood, K., X. Song, C. MacKnight, H. Bergman, D.B. Hogan, I. McDowell, and A. Mitnitski. "A global clinical measure of fitness and frailty in
elderly people." Canadian Medical Association Journal 173.5 (2005): 489-95.
13
Raymond, Glenna and van Hemert, Victoria. “Development of a Regionalized Specialized Geriatric Service in the Central East Region." Central
East LHIN. .
13Exhibit 9 Frailty, SGS and Health Service Use: An Illustration
The senior in red became an ALC patient at a cost of $600 per day as they waited for
LTC placement. During that time, they developed a pressure ulcer. After admission to
a LTC home, the pressure ulcer became infected and they were admitted to the
emergency department and discharged back to the home with undetected delirium.
They fell, which resulted in a minor laceration and were again sent to the emergency
department. The delirium was still undetected and the senior fell again, fracturing
their hip. They were admitted to hospital, treated surgically and discharged to the
long term care home where they were immobile for an extended period of time. They
developed blood clots in their legs, resulting in a pulmonary embolism, and were
admitted to hospital, where they died.
The senior in blue received timely access to long term care, which avoided the
pressure ulcer. In the two years following discharge, they were sent to the emergency
department twice. Other emergency department visits were avoided through use of
nurse practitioners and protocols in the long term care home to reduce avoidable
hospital visits. Exhibit 10 summarizes the outcomes for these seniors.
14Exhibit 10 Outcome Comparison with and without Enhanced Services
Senior with Senior without
Enhanced Services Enhanced Services
Emergency Visits 2 4
Inpatient Visits 1 3
Total Hospital Cost $10,400 $118,950
Total Hospital and LTC Cost $194,970 $230,040
Health Status after Three Years Alive, Moderately Frail Dead
Although this example is simple, the trajectories described are not uncommon among
seniors admitted to hospital. The example suggests how access to specialized services
for frail seniors may improve cost, quality of life, survival outcomes, and the use of
hospital capacity.
Seniors face many health risks, and Exhibit 11 summarizes our literature review of
risks that specialized geriatric services can reduce.
For example, Nurse Practitioners Supporting Teams Averting Transfers (NPSTAT),
Interventions to Reduce Acute Care Transfers (INTERACT), and Acute Care for the
Elderly (ACE), are three SGS interventions shown to reduce senior health risks. Under
NPSTAT, nurse practitioners provide outreach services to LTC homes and reported
reductions in ED transfers of more than 50%.14 INTERACT is a set of tools and
protocols to support LTC home staff. The Centre for Medicare and Medicaid Services
in the US (CMS) pilot studies report that INTERACT reduces Potentially Avoidable
hospital admissions by as much as 50%.15 ACE is an interprofessional model of in-
hospital care that includes physicians, geriatricians and allied health teams. ACE has
been shown to significantly reduce both hospital length of stay, readmissions and
complications.16
14
Lori Brown. “MH-LHIN’s Nurse Practitioner LTC Rapid Response Team.” Mississauga Halton LHIN.
.
15
Ouslander, JG., G. Lamb. R. Tappen, L. Herndon, S. Diaz, BA. Roos, DC. Grabowski, and A. Bonner. “Interventions to reduce hospitalizations from
nursing homes: evaluation of the INTERACT II collaborative quality improvement project.” Journal of the American Geriatrics Society.
16
NSW Dept. of Health. “Acute Care for the Elderly (ACE).” 2006.
15Exhibit 11 Examples of SGS Interventions to Reduce Senior Risk
Intervention
Risks That SGS can Reduce Intervention Examples Reference
Settings
ED Visits from LTC NPSTAT, INTERACT LTC Home Ouslander et al. (2011),
Intrator et al. (2004)
ED Visits from Community Community Outreach Community Prior et al. (2012)
Hospital Days Interprofessional Geriatric Acute Inpatient Hogan et al. (2007),
Consultation Teams Jayadevappa et al. (2006)
Hospital Admissions Geriatric Emergency Management, ED/LTC Home Sinha et al. (2010),
INTERACT Ouslander et al. (2011)
Complications in Hospital Acute Care of the Elderly (ACE), Hospital Harari et al. (2007),
Comprehensive Geriatric Vidan (2005)
Assessment (CGA),
Interprofessional Interventions
Admissions to LTC, LTC Days GEM, Preventative Home Visits ED, CCAC Phibbs et al. (2006),
Jones (2012),
Kleinpell et al. (2008)
Avoidable Hospitalizations
Injury in Community Including Falls Fall Clinic, Screening, Single and Outpatient, Tinetti et al. (1997),
Multifactorial Prevention Physician Office Tareef Al-Aama (2011)
Adverse Drug Events Geriatric Nursing Protocol LTC Home Zwicker et al. (2012)
Urinary Tract Infections NPSTAT, INTERACT LTC Home Ouslander et al. (2011),
Intrator et al. (2004)
Heart Failure Geriatric Consultation Teams Hospital Buist et al. (2002)
Dehydration and Gastroenteritis NPSTAT, INTERACT LTC Home Ouslander et al. (2011),
Intrator et al. (2004)
Chronic Obstructive Pulmonary Disease Home Care by Outreach Nursing Home Smith et al. (2008)
Septicemia or Severe Sepsis NPSTAT, Interprofessional LTC Home Saltvedt et al. (2002)
Interventions
Minor Procedures in the Emergency NPSTAT, INTERACT, LTC Home, Ouslander et al. (2011),
Department Preventative Home Visits Home Prior et al. (2012)
Guided by our literature review, we selected categories of service use shown to be
Central East LHIN sensitive to SGS. To find the best opportunities for RSGS, we compare the rates for
has higher rates of ED seniors age 75+ for each of these categories in the CE LHIN and its clusters to the rest
visits and Potentially of the Province. Exhibit 12 shows the results of our comparison. RSGS will make the
biggest reductions in risk of avoidable health service use by targeting services where
Avoidable ED visits
rates are high compared to those seen in other regions. We compare the CE LHIN's
from LTC than rest of rates of services use against two reference rates: 1) the 25th percentile, and 2) the
the Province median. 25% of subLHINs have rates at or below the 25th percentile while half of
subLHINs have rates at or below the median. The 25th percentile is a more ambitious
target than the median, but it is a reasonable reference since it is observed in 25% of
subLHINs. All rates are standardized to control for differences in demographics.
Further description of our methods can be found in Appendix A.
16Exhibit 12 Variation in Service Use for Seniors Age 75+ in the Central East LHIN
Amount of CE LHIN Variation from Cluster Level Variation from
Service Use Reference Rate CE LHIN Average Rate
Risks that SGS Can Reduce
for CE LHIN 25th NorthEast Durham Scarborough
Seniors 75+ Median
Percentile Cluster Cluster Cluster
ED Visits from LTC 19,016 39% 19% -17% -14% 25%
ED Visits from Community 201,265 15% 1% 23% 4% -21%
ED Visits per Senior from LTC 1.6 11% 7% -5% -2% 4%
ED Visits per Senior from Community 1.9 8% 4% 7% 4% -11%
Hospital Days 832,438 11% 0% 14% -4% -7%
Hospital Admissions 78,791 3% -8% 8% -1% -6%
Repeated Hospital Admissions per Senior IP User 1.4 3% 1% 3% 1% -3%
Admissions to LTC 11,964 20% 6% -7% -1% 6%
Average Length of Stay in LTC 612 3% -5% 5% 5% -7%
Post-Procedural Complication 4,189 0% -12% -3% 7% -3%
Post-Admit Comorbidity 2,553 1% -10% -10% 14% -4%
Avoidable ED Visits
Injury in Community Including Falls 30,586 15% 1% 15% 7% -17%
Urinary Tract Infections 8,525 12% -4% 43% -11% -24%
Heart Failure 5,844 15% 0% -8% 2% 4%
Chronic Obstructive Pulmonary Disease 6,428 29% 7% 42% 4% -35%
Dehydration and Gastroenteritis 3,074 21% 9% 12% 4% -12%
Septicemia or Severe Sepsis 989 29% 9% -24% -7% 25%
Adverse Drug Event 167 21% -17% 63% -9% -41%
Other 16,077 17% 1% 21% 3% -19%
All Avoidable ED Visits from LTC 7,817 36% 18% -15% -6% 17%
Visits from LTC for Minor Px (Suture, Catheter) 1,328 45% 26% -5% -5% 8%
All Avoidable ED Visits 71,690 15% 1% 20% 3% -17%
Avoidable Inpatient Hospitalizations
Heart Failure 4,228 8% -5% -10% 0% 7%
Injury in Community Including Falls 5,913 9% -11% 23% 4% -21%
Urinary Tract Infections Including Pyelonephritis 2,207 9% -7% -13% -15% 23%
Chronic Obstructive Pulmonary Disease 4,099 19% -6% 27% 2% -22%
Septicemia or Severe Sepsis 1,156 19% -7% 7% 21% -23%
Dehydration and Gastroenteritis 588 13% -14% 3% 3% -5%
Adverse Drug Event 37 28% -17% 10% -24% 12%
Other 3,704 0% -11% 8% -8% 0%
All Avoidable IP Hospitalizations from LTC 2,911 24% 2% -16% -14% 23%
All Avoidable IP Hospitalizations 21,932 2% -10% 10% 0% -7%
Source: DAD, NACRS, RAI-LTC, RAI-HC; FY 2009/10 – 2011/12
17How to interpret the information in Exhibit 12:
Between 2009/10 and 2011/12, there were 19,016 ED visits by residents of LTC
homes to CE LHIN hospitals. Controlling for differences in population
demographics, CE LHIN had 39% more visits than expected at the rate seen in 25%
of subLHINs and 19% more visits compared to the median subLHIN rate.
These findings imply that there are opportunities for SGS to reduce the risk of ED
visits from LTC in the CE LHIN.
How does the rate vary across Central East clusters? Northeast and Durham
clusters were 17% and 14% below the CE LHIN average, while the Scarborough
cluster was 25% above.
These findings imply that the most opportunity to reduce ED visits among LTC
residents is in the Scarborough cluster.
Below we list other examples of service use where there may be important
Delaying admission to
opportunities for RSGS to reduce risk.
LTC is potentially a
leading goal of ED visits from LTC and Potentially Avoidable ED visits from LTC are high throughout
the Central East LHIN compared to the Province. Other categories of service use are
specialized geriatric
generally similar to the Province, but they vary substantially among clusters within
services the LHIN. For example, although the number of hospital days in the CE LHIN is at the
median, the North East cluster is 14% higher than the CE LHIN average while the
Scarborough cluster is 7% lower.
ED visits per senior in the CE LHIN are higher than the Provincial median, both for
seniors from LTC and for seniors from the community. There is substantial variation,
however, among clusters within the CE LHIN. In the Scarborough cluster, ED visits per
senior from LTC are 4% above the CE LHIN average, while visits per senior from the
community are 11% below. In the North East and Durham cluster, visits per senior
from LTC are 5% and 2% below the CE LHIN average, while visits per senior from the
community are 7% and 4% above. These findings imply that, in Scarborough, there is
opportunity to reduce ED visits per senior from LTC, while in the North East and
Durham, there is opportunity to reduce ED visits per senior from the community.
The rate of post-admit comorbidities for seniors in the Central East is below the
Provincial median, but again there is substantial variation among the Central East
LHIN clusters. While post-admit comorbidities in Scarborough and the North East
clusters are below the CE LHIN average, Durham cluster is 14% above. This suggests
that there is opportunity to reduce post-admit comorbidities for seniors in the
Durham cluster.
Potentially Avoidable Hospital use refers to inpatient and ED encounters that have
been demonstrated in the literature to be preventable using community and LTC
18based interventions. The literature suggests that differences in the availability of
specialized geriatric services across subLHINs is manifested as differences in
potentially avoidable hospital use and LTC use.
The rates of Potentially Avoidable Hospital use differ substantially by cluster. For
example, in the North East cluster, the rates of COPD inpatient admissions and ED
Average stay in LTC visits among seniors are 27% and 42% higher than the CE LHIN average rate, while in
the Scarborough cluster, the rates are 22% and 35% below, respectively. For
varies by cluster. SGS
Septicemia or Severe Sepsis, there are also differences between clusters in rates of
could delay the need ED versus inpatient use. In the Scarborough cluster, the rate ED visits for Septicemia
for LTC. or Severe Sepsis is 25% above the CE LHIN average, while the rate of IP admissions is
23% below.
Delaying admission to LTC is potentially a leading goal of specialized geriatric services.
Since SGS reduces risk of worsening health, use of SGS services outside LTC could
result in shorter LTC stays by delaying LTC admission. In the Central East LHIN, the
average LTC resident stay is 612 days. This is similar to the provincial 25th percentile,
so the CE LHIN rate is not currently high; but delaying LTC admission will be an
important CE LHIN strategy as population aging puts additional demand on this
resource.
Priority The previous section described the types and amount of health risk that RSGS could
reduce. The most cost effective RSGS tactic will be to target seniors who would
Populations for benefit most from specialized geriatric services.17 For focused analysis, the RSGS
RSGS Steering Committee reviewed population segments that would benefit from
specialized geriatric services. Excluded were people younger than 75 years old,
receiving palliative care or with malignancy.18 95% of seniors aged 75+ remained in
our focal population: the RSGS priority population. We describe this subset of the
Central East senior population as the frail seniors, understanding that the degree of
frailty within this population varies widely.19
Exhibit 13 shows the proportions of these frail seniors living in residential care and in
the community.
17
Winograd, C.H. "Targeting strategies: an overview of criteria and outcomes." Journal of the American Geriatrics Society 39 (1991): 25S-35S.
18
The Committee also suggested excluding people with single conditions that we already part of other provincial initiatives such as Stroke, COPD
and Heart Failure. The prevalence of these seniors were so low that they were included in the target population for completeness.
19
This working definition of frailty is similar to that used by the Institute for Clinical Evaluative Sciences in Health System Use by Frail Ontario
Seniors, 2011. Bronskill et al.
19Exhibit 13 RSGS Priority Population by location, residence site and care type
Knowing the specific 2010/11
settings where the frail Community seniors**
senior population can Setting Location % Residence % Care Type %
CCC 1,177 1.2% 1,177 1.2%
be reached is LTC Home 8,131 8.4% 8,131 8.4%
important for RSGS Community 87,265 90.4%
program design ALSH 1,371 1.4%
Retirement Home** 2,250 2.3%
Home in the community 83,644 86.6%
Primary Care
54,797 65.5%†
Teams
Solo-practice Primary Care Physicians 25,787 30.8%†
Unattached to PCP 3,060 3.7%*
Home Care 15,617 17.9%‡
Total 96,573 100% 6,573 100%
Excluded§ 4,983
Total pop. 75+ 101,556
* Proportion of seniors 65+ in Ontario unattached to a family physician, as reported in the Primary Care
Access Survey (PCAS), 2007-08 {Hay, 2010}.
** Proportion of seniors in retirement homes and receiving different types of primary care are estimations.
† Proportions reported by Rosser (Rosser et al. 2011), subtracted the proportion of unattached.
‡ The proportion of total target seniors receiving home care services was 16.2%.
§ Exclusion criteria were senior receiving palliative care and with malignancies.
Source: DAD, NACRS, OMHRS databases, CCRS, RAI-LTC, RAI-HC, NRRS, Statistics Canada, ALSH statistical
data; fiscal year 2010/11.
Specialized geriatric services for frail seniors living in the community can be provided
in hospitals, in physician offices or through CCAC and other outreach methods. 8% of
If SGS are to
the frail seniors are in Long Term Care homes, where certain SGS programs could
substantially reduce benefit them directly. However, 90% of frail seniors live in the community, so even
demand for long term the most effective interventions in the long term care setting will miss a substantial
care, then services to opportunity to reduce risk for most frail seniors in the CE LHIN.
seniors living in the
Knowing the specific settings where the frail senior population can be reached is
community must essential to RSGS program design.
increase
Like Exhibit 13 above, Exhibit 14 assigns each frail senior in the LHIN to one segment.
For the purpose of this analysis, when these frail seniors receive care in multiple
settings, they are assigned to a setting based on a frailty hierarchy that is reflected by
the order of the rows in the exhibit. First in the hierarchy is long term institutional
care: complex continuing care, long term care or retirement homes. Applying the
hierarchy: a senior admitted to both complex continuing care and long term care is
assigned to the higher needs complex care segment; a senior discharged from an
acute hospital to long term care is assigned to the long term care segment.
20Further segmentation assigns frail seniors by the level of care they received in the
past year. For example, Exhibit 14 shows that, in 2010/2011, 12% of frail seniors,
(11,589 seniors) had CCAC encounters, but were not admitted to residential care,
hospital inpatient, mental health or rehabilitation care. Other hierarchies are
possible, but organizing the data in this way reveals potential RSGS intervention
settings and case finding tactics.
Exhibit 14 Distribution of Frail Seniors By Care Setting
Site Group % of Total
CCC All 1%
LTC MH Neurodegenerative 6%
LTC MH Other 2%
LTC Non-MH 1%
Retirement Home All 2%
ALSH All 1%
Community IP MH 0.1%
Community Acute IP with Rehab 1%
Community Acute IP with Home Care 3%
Community Acute IP with ED 2%
Community Acute IP Other 0.3%
Community Rehab 0.7%
Community Home Care (CCAC) 12%
70% of LTC residents Community ED 16%
Community Other 51%
have a Priority Population 96,573
neurodegenerative Source: DAD, NACRS, OMHRS databases, CCRS, RAI-LTC, RAI-HC, NRRS, Statistics Canada,
ALSH statistical data; fiscal year 2010/11.
condition
9% of the target population of frail seniors resides in LTC; of these, 70% have a
neurodegenerative condition. Overall, the community segment is 90% of the frail
senior population. Roughly half (52%) of frail seniors are in the community segment
and had no in-year contact with either hospitals or home care. Therefore, physician
offices and other community and outreach services are currently the only potential
SGS contacts for approximately half of the frail seniors in the LHIN. Adding the acute
care and home care rows in Exhibit 14 shows that roughly one third of frail seniors
could potentially connect with SGS as part of their hospital or CCAC encounters, in
addition to physician and community outreach services.
Currently, RSGS could seek out frail seniors in the care settings where they are
presenting, but focusing mainly on LTC, hospital and home care clients leaves many
seniors without the benefit of specialized geriatric services, and so at risk of health
decline.
Without increases in community services for frail seniors, there will be many more
seniors not covered by SGS in the future. Exhibit 15 shows the number of seniors in
2010/2011 and the ten year forecasted increase, for each segment, by geographic
21cluster. Overall in the LHIN, the seniors population at risk is estimated to grow by
27% over the next ten years, with almost 50% growth in Durham, which is twice the
rate of growth as in the North East and four times as much as in Scarborough.
Exhibit 15 Forecast of Frail Seniors by Cluster and Segment
All CE Frail Seniors Durham Cluster North East Cluster Scarborough Cluster
Current Additional Current Additional Current Additional Current Additional
Site Group
2010/11 2020/21 2010/11 2020/21 2010/11 2020/21 2010/11 2020/21
Segment 96,573 122,856 31,213 46,282 28,209 34,911 37,151 41,663
CCC All 1,177 1,522 474 702 283 349 420 471
LTC MH Neurodegenerative 5,668 7,229 1,870 2,772 1,745 2,155 2,053 2,302
LTC MH Other 1,616 2,039 497 737 433 533 686 769
LTC Non-MH 847 1,084 285 423 264 327 298 334
Retirement
Home All 2,250 2,850 653 968 761 944 836 938
ALSH All 1,371 1,744 442 656 399 494 530 594
Community IP MH 130 161 31 46 27 34 72 81
Community Acute IP with Rehab 1,037 1,330 355 527 342 422 340 381
Community Acute IP with Home Care 3,341 4,267 1,074 1,592 1,115 1,382 1,152 1,292
Community Acute IP with ED 2,216 2,783 615 912 639 793 962 1,079
Community Acute IP Other 250 314 70 105 70 87 109 122
Community Rehab 644 808 181 268 177 219 287 322
Community Home Care 11,649 14,884 3,929 5,825 3,454 4,275 4,266 4,784
Community ED 15,341 19,578 4,735 7,023 5,313 6,619 5,293 5,936
Community Other 49,035 62,263 16,002 23,727 13,187 16,279 19,847 22,257
10-Year % Growth 27% 48% 23% 12%
Source: DAD, NACRS, OMHRS databases, CCRS, RAI-LTC, RAI-HC, NRRS, Statistics Canada, ALSH statistical data; fiscal year 2010/11.
Evidently, if RSGS is to contribute to substantially reducing the demand for long term
care, then it must advocate to expand services to seniors living in the community.
Low Income and Rural Senior Populations
In addition to segments defined by clinical condition or setting, RSGS may target low-
income seniors or those living in rural regions. These potentially vulnerable
Rural seniors are 9% subpopulations may have higher but unmeasured social and clinical health risks.
less likely to be Comprehensive geriatric assessments of a large random sample, of rural, low-income
and other seniors would be the most accurate way to estimate the additional needs
admitted to long term
of rural and low-income seniors; we did not have such a sample. Since the likelihood
care than non-rural of long term care admission is highly correlated with frailty, we instead used long
seniors term care admission data in the Central East to compare low income and rural groups
with others. Each senior in the Central East LHIN was assigned an income quintile
using the Statistics Canada Area Based Income Quintile Approach (Statistics Canada
22PCCF, 2012), and a rural identifier based on their postal code. Comparing the age
standardized LTC admissions within the Central East LHIN, we found that: rural
seniors are 9% less likely to be admitted to long term care than non-rural seniors; low
income seniors are 9% more likely than non-low-income seniors to be admitted to
Low income seniors long term care. Further investigation would help understand these differences,
although the absolute differences might not be substantial enough to warrant
are 9% more likely
targeted RSGS strategy.
than non-low income
seniors to be admitted
Consumers of Substantial Health Care Services
to long term care
In the previous section, we identified priority populations within the population of
people aged 75+ years. In this section, we broaden the priority population to include
the few seniors 65+ years that consumed a substantial amount of health care
resources.
Focusing on frequent consumers is a common tactic among established specialized
geriatric services20 and is also consistent with Ontario's broader Health Links initiative.
Within the senior population (65+years), we identified a segment of high users that
could be targeted for specialized geriatric services. We first identified 7,604 people of
all ages and then among them, the 4,900 seniors who used 50% of CE LHIN’s inpatient
hospital resources in 2011/12 (Exhibit 16).
Exhibit 16 Seniors with high hospital use in the CE LHIN, 2011/12
% Seniors
# Persons # Avg % Seniors
Total Average Total Died in % Seniors
Admitted Persons Avg Comorbid receiving % Seniors
Age Admissions Weighted Weighted Hospital Hospital with
to with ED LOS Dx per Home to HC
Cases Cases Days (All LTC/CCC
Hospital Visits Admission Care
Causes)
65-69 784 680 1,922 6,906 8.8 27,442 35 2.7 24% 12% 73% 38%
70-74 870 748 2,190 8,559 9.8 37,476 43.1 2.9 27% 15% 74% 38%
75-79 968 861 2,337 8,848 9.1 40,479 41.8 3 29% 21% 77% 33%
80-84 1,067 951 2,526 8,768 8.2 45,920 43 3 29% 27% 83% 34%
85-89 767 704 1,784 6,073 7.9 36,885 48.1 3 34% 33% 85% 30%
90+ 444 411 951 3,448 7.8 22,817 51.4 3 34% 33% 91% 27%
All
4,900 4,355 11,710 42,602 8.7 211,019 43.1 2.9 29% 23% 80% 34%
Seniors
Source: DAD, NACRS; FY 2011/12
On average these seniors spent 43 days in hospital; 29% died in hospital and 80%
received home or residential continuing care. Irrespective of age, they are a
multimorbid population, with an average of three significant coexisting diagnoses21.
Since these seniors are frequent users of the health system across different settings
20
Man-Son-Hing, M., B. Power, A. Byszewski, and W.B. Dalziel. "Referral to specialized geriatric services. Which elderly people living in the
community are likely to benefit? " Canadian Family Physician 43 (1997): 925-30.
21
This includes their most responsible diagnosis.
23(including hospitals), there are opportunities for SGS to improve coordination, quality,
outcomes and cost of health care services for this population.
As described in the previous section on SGS risk reduction, Potentially Avoidable
Hospital use is one kind of risk that can be reduced by SGS services.22 In Exhibit 17, we
show the prevalence of Potentially Avoidable Hospital use in this cohort of 4,900
seniors over a one-year period, with an estimate of the associated total hospital cost
of care.
Seniors with
Exhibit 17 Most Responsible Diagnosis, High Use Seniors
Potentially Avoidable Number of
Estimated
Hospitalizations Most Responsible Diagnosis Admissions
Hospital Cost
2011/12
account for 56% of Heart Failure 1,249 $28,099,552
total hospital costs in Diabetes Complications 789 $26,784,646
the high use cohort Injury 762 $25,384,271
Chronic Obstructive Pulmonary
915 $21,623,638
Disease
Urinary Tract Infections
717 $17,409,362
Including Pyelonephritis
Hypertension 319 $10,920,299
Dehydration and Gastroenteritis 430 $8,375,955
Septicemia & Severe Sepsis 151 $4,194,552
Cellulitis 168 $3,918,421
Perforated/Bleeding Ulcer 97 $3,543,673
Angina/Ischaemic Heart Disease 187 $2,518,046
RSGS has a potential Iron Deficiency Anaemia 46 $1,183,416
role to facilitate Pulmonary Edema 23 $696,900
strategies to reduce Ear, Nose and Throat Infections 19 $650,879
need for future Influenza and Pneumonia 23 $539,112
hospital services Asthma 18 $499,664
Pelvic Inflammatory Disease 10 $453,643
among high risk Convulsions and Epilepsy 8 $236,683
seniors Other Potentially Avoidable
43 $1,065,074
Hospitalizations
All Potentially Avoidable
5,974 $158,097,786
Hospitalizations
Other Hospitalizations 5,736 $121,983,879
All Hospitalizations 11,710 $280,088,239
Note:Estimated using Provincial Average Inpatient CPWC $6,575 and Actual Weighted Cases
Source: DAD 2011/12
22
Kleinpel et al. Reducing Functional Decline in Hospitalized Elderly in Patient Safety and Quality
An Evidence-Based Handbook for Nurses Edited by Ronda G Hughes Rockville (MD): Agency for Healthcare Research and Quality; April 2008.
24In this example, seniors with a Potentially Avoidable Hospitalization accounted for
$158 million, or 56% of total annual hospital cost of the high use seniors cohort.
Analyzing the progression of morbidity in the high use population would improve SGS
program design. In fact, the consensus of the RSGS Steering Committee was that early
interventions meant to prevent or delay health decline should be a focus of RSGS.
Seniors that consumed RSGS would need to explore SGS specific program components that could address the
a substantial and needs of these seniors and reduce their progression of morbidity.
disproportionate An advantage of our segmentation approach is that we can study the experience of
amount of hospital the high risk seniors in previous years.
resources were often For the high use senior population, we examined their service use and settings in the
hospitalized in the two years before they became high users of the acute system. Exhibit 18 below shows
previous two years the historical inpatient hospital use by CE LHIN’s 2011/12 high use seniors.
Exhibit 18 Historical Inpatient Resource Use, High Use Seniors in the CE LHIN
Number Admitted to Hospital Total Admissions
Age Cohort
2011/12 (t) *t - 1 t-2 2011/12 (t) t-1 t-2
65-69 784 233 162 1,922 444 264
70-74 870 295 186 2,190 605 332
75-79 968 301 208 2,337 544 358
80-84 1,067 356 227 2,526 625 334
85-89 767 235 167 1,784 388 246
90+ 444 127 93 951 189 134
All Seniors 4,900 1,547 1,043 11,710 2,795 1,668
Hospital Days 211,019 25,587 14,998
*t-1 refers to 2010/11 and t-2 refers to 2009/10
Source: 2009/10 - 2011/12 DAD, NACRS
We observed that seniors who consumed high levels of hospital resources in
2011/2012 had frequently been hospitalized in the previous two years (Exhibit 18 and
Exhibit 19). Of the 4,900 seniors in this group, approximately 30% had been admitted
to hospital in the previous year, and roughly 20% had been admitted two years
previous. Of those seen in the emergency department, 60% had been seen in the
emergency department in the previous year and 46% had been seen in the
emergency two years before.
On average, the 4,900 seniors spent: 43 days in hospital in 2011/2012; 16 days in
hospital in 2010/2011 and 14 days in hospital in 2009/2010. Evidently, the morbidity
of the frailest seniors increased over time.
25Exhibit 19 Historical ED Resource Use, High Use Seniors in the CE LHIN
# with ED Visits Total ED Visits
Age Cohort
2011/12 (t) t-1 t-2 2011/12 (t) t-1 t-2
65-69 680 386 295 2,370 1,084 753
70-74 748 469 355 2,609 1,394 933
75-79 861 508 412 2,970 1,439 987
80-84 951 597 426 3,239 1,683 975
85-89 704 439 331 2,335 1,125 726
90+ 411 259 200 1,305 645 432
All Seniors 4,355 2,658 2,019 14,828 7,370 4,806
*t-1 refers to 2010/11 and t-2 refers to 2009/10
Source: 2009/10 - 2011/12 DAD, NACRS
These seniors had many encounters with the acute system that could have potentially
triggered supportive services. Many seniors could also have been intercepted by
specialized geriatric programs in the community setting: for example, CCAC services
were provided to 33% of high users in the previous years, as shown in Exhibit 20.
High use seniors had Surprisingly and unlike use of hospital services, use of CCAC services was similar
many encounters with across all three years.
the acute system that
could have potentially
Exhibit 20 Historical Home Care Resource Use, High Use Seniors in the CE LHIN
triggered supportive
services % Seniors to Home Care
Age Cohort (CCAC)
2011/12 (t) t-1 t-2
65-69 38% 32% 35%
70-74 38% 33% 28%
75-79 33% 33% 34%
80-84 34% 35% 24%
85-89 30% 38% 37%
90+ 27% 28% 48%
All Seniors 34% 33% 33%
*t-1 refers to 2010/11 and t-2 refers to 2009/10
Source: 2009/10 - 2011/12 DAD, NACRS
26II. Meeting the Needs of Frail Seniors in the Central East LHIN
In Part I of this report, we described the health risks and service use and settings of
frail seniors in the CE LHIN. In Part II we describe available specialized geriatric
services and gaps between need and capacity for frail seniors care.
What RSGS Frail seniors use two broad types of health care services. The first, which we term
general services, provide most of frail seniors' ongoing health services and support
Resources are but are not specifically designed for the frail senior population. The second are
Available? specialized geriatric services (SGS). Specialized geriatric services are designed by
geriatric experts to meet the specific needs of frail seniors and are complements to
general health services. It is important to understand that seniors can have excellent
access to general health services, such as acute hospitals and home care, yet have
poor access to specialized geriatric services, such as comprehensive geriatric
assessment.
In Exhibit 21, we distinguish general from specialized geriatric services and
subsequently detail the specialized geriatric services available in the CE LHIN.
Exhibit 21 General and Specialized Geriatric Services
General Geriatric Services Specialized Geriatric Services
Hospital
Acute
SGS interventions can Rehabilitation
Mental Health
reduce senior health Complex Continuing Care
risk, especially in Emergency
Ambulatory
clusters where risk is Long-Term Residential Care Comprehensive Geriatric Assessment
Long term care Centralized Referral and Intake
high Assisted Living in Supportive Housing Acute Diversions
Retirement Homes Acute, Maintenance and Restorative
Community Care Care by Geriatric Specialists
Home Care
Community Support Services
Community Paramedicine
Primary Care
Primary Care Physician in solo-
practice
Primary Care Teams
The arrows in Exhibit 21 are meant to emphasize that SGS and other health services
are complementary and must be coordinated with general geriatric services.
Specialized geriatric service types are only broadly defined in Exhibit 21; Exhibit 22
more specifically organizes and describes these programs.
27Two broad categories of SGS are geriatric and psychogeriatric services. Each of these
is further differentiated by the setting where the service are provided. Each service is
typically provided by the staff of a specifically titled program, for example: Geriatric
Assessment and Intervention Network Clinics.
Exhibit 22 Description of Specialized Geriatric Services in the Central East LHIN23
Setting Service Program Description
Hospital/ Inpatient Acute Geriatric ACE Units are inpatient general medicine units for acutely ill seniors who
Inpatient/ acute Medical require an admission to an acute care hospital and the ongoing expertise of
Geriatric geriatric Unit/Acute Care of a specialized geriatric team. Individuals are admitted directly from the
beds the Elderly (ACE) emergency department. These acute care beds are situated in one unit for
older adults who require short term diagnostic investigation and treatment
and are at high risk for a prolonged hospital stay due to frailty, multiple
complex medical, functional, psychosocial problems and/or recent
functional decline.
Inpatient Geriatric GATU inpatient units are typically short-stay, non-acute care units
geriatric Assessment and specifically designed to meet the needs of older adults and managed by
sub-acute Treatment Unit interprofessional specialized geriatric teams. Specialized equipment is
beds (GATU) available to promote safety and independence. Patients stay between one
and three months.
Geriatric Geriatric Rehabilitation Units are for older frail persons who require the
Rehabilitation Unit expertise of a geriatric team and individualized assessment and
(GRU) rehabilitation program in order to regain or maximize function and
independence. These units are often located in Complex Continuing Care
and the client is typically admitted for a period of one to three months.
Geriatric Specialized rehabilitation unit for seniors who require a longer course of
Assessment and therapy with shorter, less frequent periods of rehabilitation. The rehab unit
Rehabilitation Unit is led by a nurse practitioner with geriatric training and includes inter-
(GARU) professional team of physicians, therapists and other allied health providers.
Geriatric Similar to GARU, but without a geriatrician or physician. GERI works to
Engagement and maintain function and mobility in seniors with complex chronic conditions
Reintegration Unit through activation and socialization.
(GERI)
Inpatient Internal Geriatric A specialized geriatric interprofessional team providing in-hospital
geriatric Consultation Team consultation and assessment for frail seniors. Consultation teams support
consultation (IGCT) the development of care teams in hospital through education and capacity
building. In some situations the teams participate in ‘case finding’ for ACE
Units or GRUs to facilitate the seamless transfer from an acute care bed to
the most appropriate setting.
Other Geriatric GAP is an interprofessional program that focuses on early intervention for
inpatient Activation high-risk, frail seniors upon hospital admission. GAP identifies seniors in
geriatric Program (GAP) need of enhanced therapy services and works to prevent functional or
programs cognitive decline, prevent falls or manage wound care. GAP includes
occupational therapy, physiotherapy, social work and recreational therapy.
VALUE Volunteer Volunteers Assisting Leisure Interests to Meet Unique Needs (VALUE) is a
Program volunteer-based program providing one-on-one support to maintain
functionality for frail elderly patients in the general inpatient or ACE Unit
setting. The VALUE program promotes functionality by helping frail elderly
patients get out of bed, get dressed and remain active.
23
Content in this table is based on descriptions provided by the programs and P. Reed, 2011. Specialized Geriatric and Psychogeriatric Services in
the Central East LHIN: An Environmental Scan 2011
28You can also read